biomass as a renewable energy source - ufto home page · biomass as a renewable energy source ufto...
TRANSCRIPT

National Renewable Energy Laboratory
Biomass as a Renewable Energy Source
UFTO Visit
Richard L. Bain
May 8, 2002
Operated for the U.S. Department of Energy by Midwest Research Institute • Battelle • Bechtel
Sustained Growth
LS-CD-b136501
18801860
1500
0
1000
1500
1900 1920 1940 1960 1980 2000 2020 2040 2060
Surprise
Geothermal
Solar
New Biomass
Wind
NuclearHydroGas
Oil & NGL
CoalTraditional
Biomass
Exaj
oule
s
Sustained Growth
LS-CD-b136501
18801860
1500
0
3000
4500
1900 1920 1940 1960 1980 2000 2020 2040 2060
Surprise
Geothermal
Solar
New Biomass
Wind
NuclearHydroGas
Oil & NGL
CoalTraditional
Biomass
Exaj
oule
s

Carbon Dioxide - The Biosphereand the Earth's Atmosphere
310
320
330
340
350
360
370
1955 1960 1965 1970 1975 1980 1985 1990 1995 2000
Year
CO
Con
cent
r atio
n(p
pmv)
2
Note: Data taken from observations at the Mauna Loa Observatory
The World Needs Low-Cost Energy
0.1
1
10
100
0.1 1 10 100 1000
Energy Consumption Per Capita (GJ/person)
GD
P P
er C
apita
($
000/
pers
on)
Poverty
Affluence
Ethiopia
United Kingdom
Mexico
Bangladesh
China
Poland
South Korea
United StatesFranceJapan
Source: Energy Information Administration, International Energy Annual 1998 Tables E1, B1, B2; Mike Grillot, 5/17/00Gross Domestic Product per capita is for 1997 in 1990 dollars. Energy Consumption per capita is 1997.
El Salvador Russia

Solar 1%
ConventionalHydropower
46%
Geothermal 4%
Biomass 48%
Wind 1%
RenewableEnergy
8%
Coal22%
Nuclear ElectricPower
8%
Natural Gas23%
Petroleum39%
U.S. Primary Energy Consumption, 1999
Renewable Energy 7.37 Quads
Source: EIA Annual Energy Review 1999
All Sources 96.60 Quads
Why Biomass?
• Environmentally low impact• National Security – less imported fuel • Increased diversity of energy supply • Greater social and technological flexibility • Strong public support• Significant job creation potential, especially in
rural areas
“Renewable energy development is at a crossroads… . The momentum for Renewables has never been greater, despite the factthat energy prices are low and there are few immediate energy concerns.”The Evolving Renewable Energy Market, IEA 1999
“Renewable energy development is at a crossroads… . The momentum for Renewables has never been greater, despite the factthat energy prices are low and there are few immediate energy concerns.”The Evolving Renewable Energy Market, IEA 1999
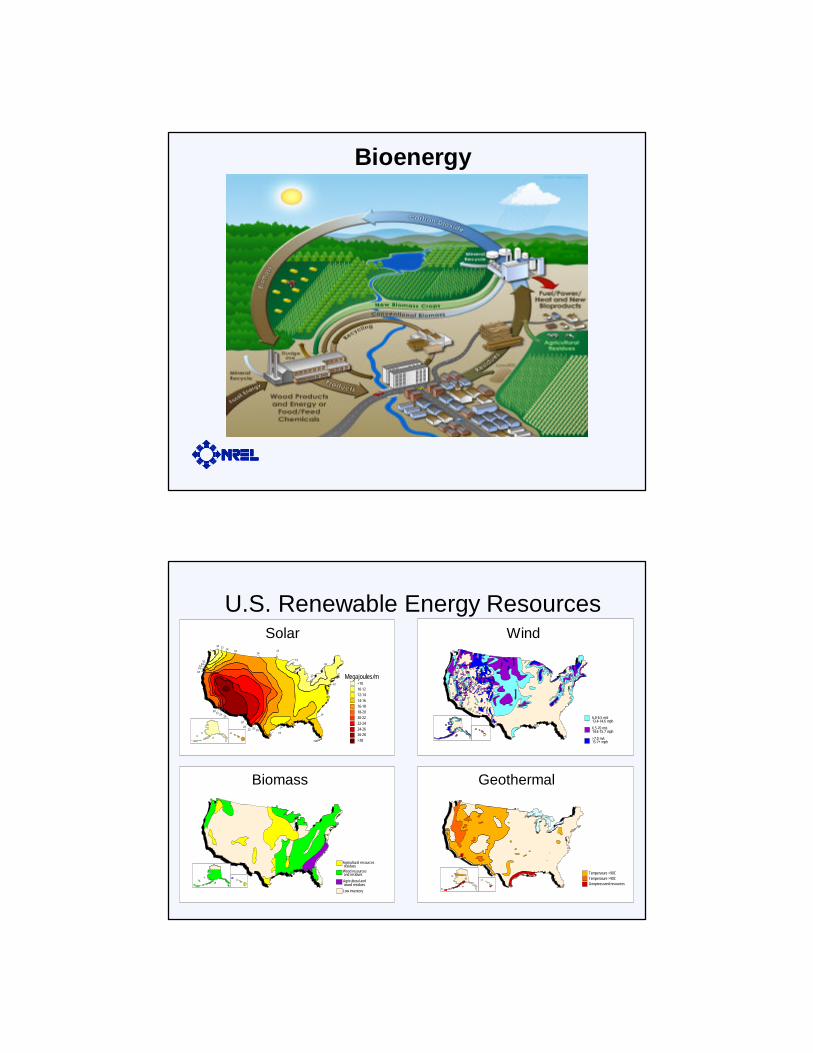
Bioenergy
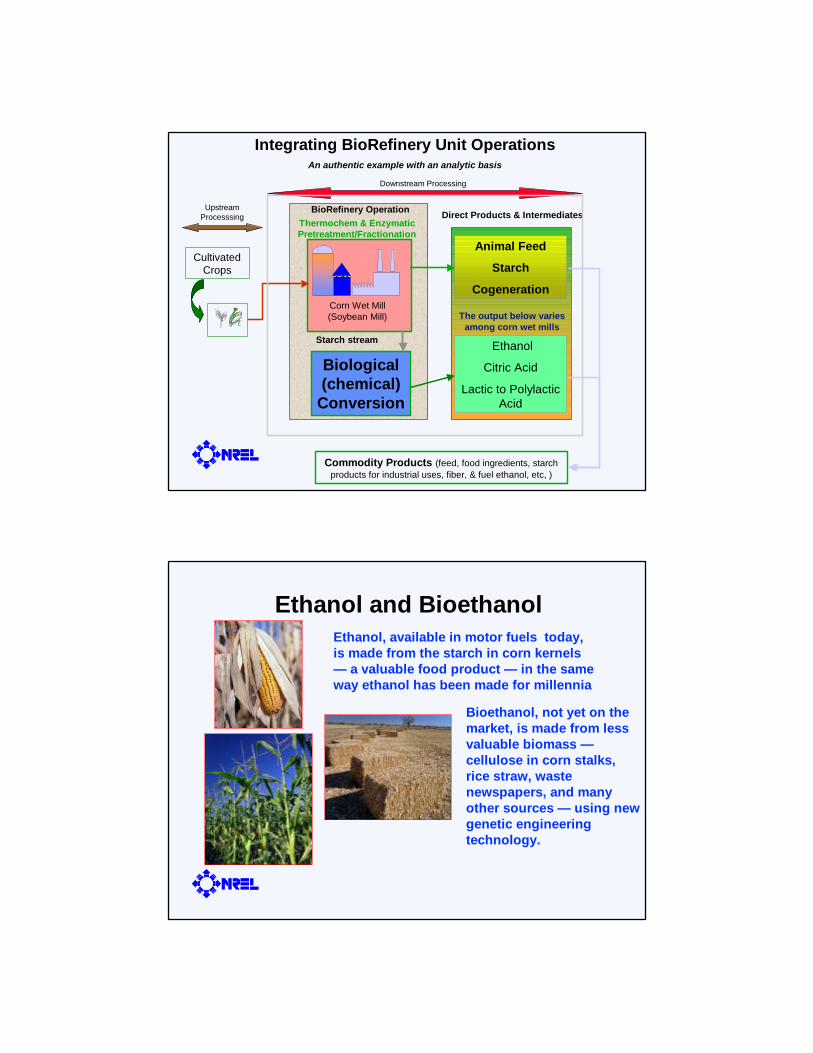
U.S. Renewable Energy ResourcesWindSolar
Biomass Geothermal
Agricultural resources
Wood resources
Agricultural and
Low inventory
residues
and residues
wood residues
Temperature <90CTemperature >90CGeopressured resources
o
o
10
10
12
12
14
14
16
16
18
1820
20
2224
26
22 2426
16
14
14
1614
12
10
10
12 <10 10-12 12-1414-1616-18 18-2020-2222-24 24-26 26-28 >28
6.0-6.5 m/s13.4-14.6 mph
6.5-70 m/s14.6-15.7 mph
>7.0 m/s15.7+ mph
Megajoules/m2

U.S. Bioenergy 2000
Primary Bioenergy3.1 quads
Industrial/CHP & ElectricityResidential/HeatTransportationElectricity/ResidueHeat/Waste
Delivered Bioenergy1.5 quads
Industrial/CHP &Electricity
Residential/Heat
Transportation/Ethanol
Electricity/Residue
Heat/Waste
3% of U.S. Primary Energy
Examples of Bioenergy andExamples of Bioenergy and BiobasedBiobased Products FacilitiesProducts Facilities

ConversionProcesses
BiomassBiomassFeedstockFeedstock– Trees– Grasses– Agricultural Crops– Agricultural Residues– Animal Wastes– Municipal Solid Waste
USESUSES
Fuels:EthanolRenewable Diesel
Electricity
Heat
Chemicals– Plastics– Solvents– Pharmaceuticals– Chemical Intermediates– Phenolics– Adhesives– Furfural– Fatty acids– Acetic Acid– Carbon black– Paints– Dyes, Pigments, and Ink– Detergents– Etc.
Food and Feed
- Enzymatic Fermentation- Gas/liquid Fermentation- Acid Hydrolysis/Fermentation- Gasification- Combustion- Co-firing- … ..
Fuels, Chemicals, Materials, Heat and Power from Biomass
Petroleum and Natural
Gas Feedstocks
Petrochemical Refinery Producing Fuels and Chemical
Intermediates
Fuels – gasoline and diesel
Polymer intermediates –
ethylene, propylene, butadiene
Chemicals –methanol,
benzene, etc
Consumer
Commodities ProductionAntifreeze, packaging, tanks, boat hulls, fuel
oxygenates, additives, paints, fabric, fibers, etc.
Petrochemical Refining
Upstream Processsing
Downstream Processing

Pyrolysis
Gasification
Biochemical Conversion
Direct Products & Materials
Thermochemical
Biological
BioRefinery Operations
Commodity Products (electricity,
fuels, chemicals, materials)
Feedstock development
Upstream Processsing
Downstream Processing
Fischer-Tropschproduct slate
Methanol
Ethanol
Power-Heat
Hydrogen
Chemicals, fuels, adhesives, hydrogen
Biofuels
Chemicals
Specialty Products: polymers, enzymes
Direct Products & Intermediates
Integrated BioRefinery Concept
Residues
Pre
trea
tmen
t
Chemical Conversion
Thermochemical
BioRefinery Operation
Commodity Products (electricity, paper, chemicals, inks, dyes, & binders for asphalt)
Managed, Private Forests
Upstream Processsing
Downstream Processing
Pulp
Power-Heat
Lignosulfonates
Tall Oils
Resins
Direct Products & Intermediates
Integrating BioRefinery Unit Operations An authentic example with an analytic basis
Pulp and Paper Kraft Mill
Black Liquor stream
Biological (chemical) Conversion
Thermochem & Enzymatic Pretreatment/Fractionation
BioRefinery Operation
Commodity Products (feed, food ingredients, starch products for industrial uses, fiber, & fuel ethanol, etc, )
Cultivated Crops
Upstream Processsing
Downstream Processing
Animal Feed
Starch
Cogeneration
Ethanol
Citric Acid
Lactic to Polylactic Acid
Direct Products & Intermediates
Integrating BioRefinery Unit OperationsAn authentic example with an analytic basis
Corn Wet Mill (Soybean Mill)
Starch stream
The output below varies among corn wet mills
Ethanol and BioethanolEthanol, available in motor fuels today, is made from the starch in corn kernels — a valuable food product — in the same way ethanol has been made for millennia
Bioethanol, not yet on the market, is made from less valuable biomass —cellulose in corn stalks, rice straw, waste newspapers, and many other sources — using new genetic engineering technology.

Biomass Transportation Fuels? Ethanol costs:
– Current: $1.22/gal estimate– 2010: $0.67/gal estimate
? Near term - biomass wastes for oxygenates; longer term - energy crops for bulk fuel
Source: Technology Opportunities to Reduce
U.S. Greenhouse Gas Emissions, October 1997
? Biochemical and thermochemical processing
? Displacing gasoline with ethanol in light-duty vehicles gives 90% reduction in carbon emissions
? R&D: low-cost production of enzymes, development of microorganisms, improved performance of thermochemical processing, energy crop advances
Bioethanol Production
“Cooking”
+ =
catalyst+
heat+
time
sugarsand
residual solids
(lignin)
ethanolfermentationand recovery
ligninutilization(boiler fuel)
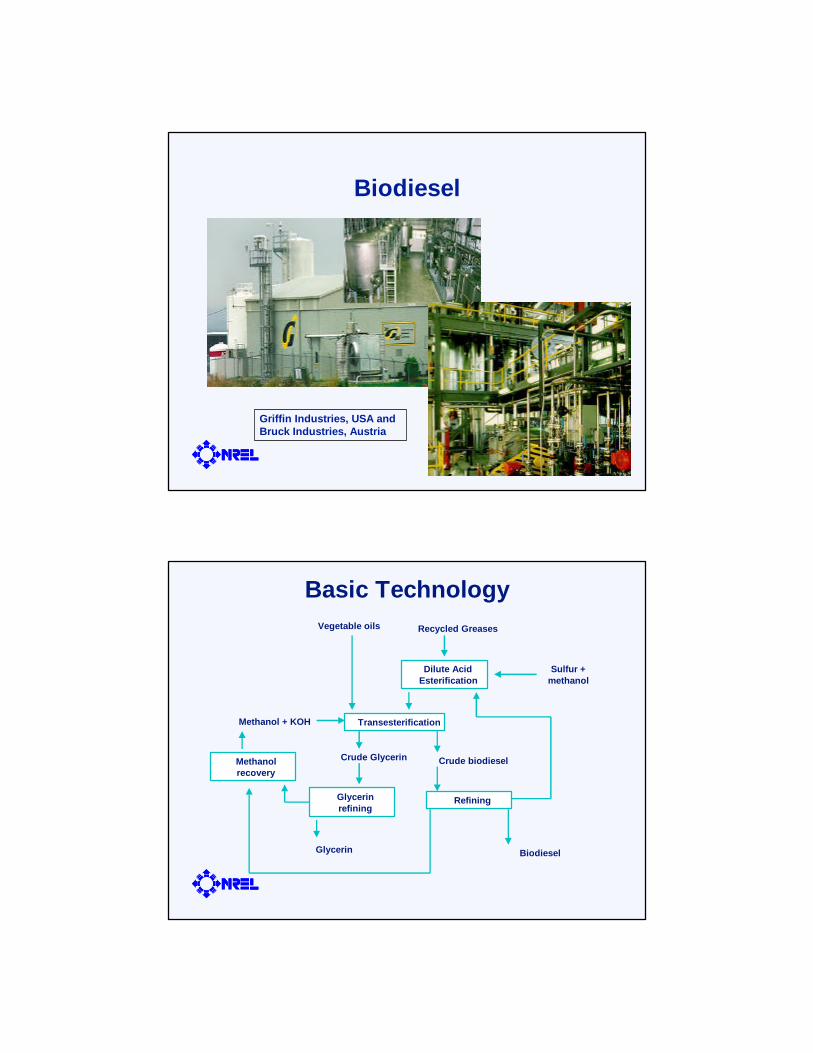
Biodiesel
Griffin Industries, USA and Bruck Industries, Austria
Basic TechnologyVegetable oils Recycled Greases
Dilute AcidEsterification
Transesterification
Crude Glycerin
Refining
Crude biodiesel
Biodiesel
Sulfur +methanol
Methanol + KOH
Glycerinrefining
Glycerin
Methanolrecovery

Production Cost per Gallon Biodiesel
0.000.501.001.502.002.503.003.50
0 .05 .1 .15 .2 .25 .3
feedstock cost $/lb
$/galYellow greases
Tallow & lard
Soy oil
Canola & other oils
Trap grease
3 mil gal/yr plant, 80% glycerin. Total cost at plant gate.
Does not include transportation and handling.
Biopower TechnologiesBiopower Technologies
2.50
3.50
4.50
5.50
6.50
7.50
8.50
1995 2000 2005 2010 2020 2025 2030
Year
Cos
t of E
lect
rici
ty
(cen
ts /
kWh)
Cost of Electricity:Biomass Gasification and Co-Firing
Biomass Gasification Combined-Cycle
Coal (baseline)
Biopower Capacity Projection, 2000-2020*
0
5,000
10,000
15,000
20,000
25,000
30,000
35,000
40,000
45,000
2000 2005 2010 2020Year
Industrial Pulp and Paper Co-FiringGasification Modular
Cap
acity
(MW
)
*Market Potential with Supporting Policy Measures

Life Cycle CO2 and Energy Balance for a Direct-Fired Biomass System
Current biomass power industry
Direct-Fired Biomass Residue System134% carbon closure
Net greenhouse gas emissions-410 g CO2 equivalent/kWh
Landfill andMulching
Transportation Construction Power PlantOperation
10 3
1,204
1,627
Avoided CarbonEmissions
1.0
FossilEnergyIn
FossilEnergyIn
ElectricityOut28.4
Life Cycle Net Greenhouse Gas Emissions for Each Power Production System
-600
-400
-200
0
200
400
600
800
1000
1200
BiomassIntegrated
GasificationCombined
Cycle
Coal Coal/biomass co-fired
Biomass Residues direct-fired
Natural GasCombined Cycle
GW
P (g
CO
2-eq
uiva
lent
/ kW
h of
net
pow
er p
rodu
ctio
n)
Dedicated
Offset landfill methane emissions

NOx Emissions - Life Cycle Total and Plant Operating Emissions
0
1
2
3
4
5
6
7
8
BIGCC direct coal - avg co-firing coal - NSPS NGCC
NO
x em
issi
ons
(lb/M
Wh)
total NOx
operating plant NOx
Biomass Combustion - Potential for NOx Reduction
0.00
0.20
0.40
0.60
0.80
1.00
1.20
1.40
1.60
1.80
Existing - FGR Future - FGR +SCR (80%) Future with CHP East Texas Standard West Texas Standard
NO
x (l
b/M
Wh
)

Status of Biopower in U.S.
•Currently Installed:– U.S. Biomass Power: 10,500
MW (or about 8% of all non-utility generating capacity)
– 7,000 MW from biomass residues
– Over 500 facilities in U.S. generate electricity from wood or wood waste
Bioenergy Electricity Generation, 1981 - 1999
0
2,000
4,000
6,000
8,000
10,000
12,000
1981 1984 1987 1990 1993 1996 1999
Year
Cap
acity
, MW
0.0
10.0
20.0
30.0
40.0
50.0
60.0
70.0
Gen
erat
ion,
Bill
ion
kWh
Capacity Generation
?
Ref: EIA, Annual Energy Review 1997, Renewable Energy Annual 1995Renewable Energy Annual 2000
?

Biomass
10.5 GW
Grid Connected Electricity From Biomass
Biopower Program
• Near Term– Cofiring
(Rural Development)
• Mid Term– Modular Systems
• Long Term– Integrated Gasification
Combined Cycle

Comparative Process Efficiency
Cofiring • New York Salix (Willow)
– Dunkirk Power Plant• 10-15 MWe from biomass
• Iowa Switchgrass– Ottumwa Generating Station
• Up to 35 MWe from biomass
• Hawaiian Energy Cane– HC&S Sugar Mill,
Puunene, Maui– Alternate feedstock processing

Switchgrass Cofiring TestingAlliant Ottumwa Generating Station,
Chillicothe, Iowa 700 MW PC
DebalerDebaler
GrinderGrinder
NozzlesNozzles
BiomassBiomass
CoalCoal
½ ton bales½ ton bales
Chariton ValleyChariton ValleySwitchgrass FieldSwitchgrass Field
1300 tons SWG1300 tons SWGUp to 16 TPHUp to 16 TPH
3% of coal3% of coal
Develop gasification technologies for the conversion of biomass into clean, sustainable energy and other products
Elements:?Build on successful and existing
technology platforms?Plan and implement a robust R&D
program?Establish supportive
infrastructure
Gasification

FERCO GASIFIER- BURLINGTON, VT
Battelle Columbus Gasifier200 TPD
Waste HeatWaste HeatRecoveryRecovery
Flue GasFlue Gas
AshAshRecoveryRecoveryCycloneCyclone
DryerDryer
WetWetFeedFeed
DailyDailyStorageStorage
FeedFeed
SteamSteam
Gasifier
AirAir
SandSandSandSand
&&CharChar
Combustor
CycloneCycloneSeparatorsSeparators
Ash
ScrubberScrubber
WaterWater
WastewaterWastewater
Medium BTUProduct Gas
Product HeatRecovery
Gasification Process
Gas Conditioning
The FERCO SilvaGas Biomass

Other DOE Gasification Efforts•Biopower Cofiring Initiative
•Nexant, LLC –Study the use of poultry litter in a biomass gasification co-firing demonstration•Gas Technology Inst. & Calla Energy Partners –Develop and demonstrate advanced biomass gasification technology
•Biomass & Black Liquor Gasification Initiative•Georgia-Pacific, Big Island, Georgia (Stonechem –MTCI gasifier)•Gaylord Container Corp., Pine Bluff, Arkansas•Boise Cascade, site TDB•Details to be announced
•Biomass R&D: Advanced Power Generation Technologies•Biomass Gasification, > 5MW•Pre-commercial research: gasification based CHP•$1 M USD available•Solicitation closing date: June 8, 2001•http://www.netl.doe.gov/business•Reference: DE-PS26-01NT41130
Small Modular Biopower InitiativeUSDOE Biopower Program
Gasification - ICEVillage Power
Gasification - ICEVillage Power
Stirling EngineResidential
Gasification-STMini-grid
Micro-turbineLFG, Grid
Phase 2 Prototype Projects

INITIATIVE GOAL
To develop Small Modular Biopower (SMB) Systems that:
• improve the quality of life
• are fuel flexible
• are efficient
• are simple to operate
• have minimum negative environmental impacts
• are designed for domestic/international markets
Ratings of Features by Risk Categories for Small-Scale Biopower Systems
-800
-600
-400
-200
0
200
400
600
800
1,000
1,200
Construction Operating Feedstock Environmental Economic Market
Major Vulnerabilities
Major Advantages / Opportunities

Carbona: 5 MWe CHP Gasifier-Steam Turbine located In Lemvig, Jutland, Denmark
Strategic Partners: FLS miljo, Lemvig Varmevaerk, Danish Energy Agency
CPC: 25 kW Gasification-ICE Prototypes, Lab Unit at CPC, Philippines Unit, Hoopa Indian Reservation Unit in Calif.
Strategic Partners: Shell International Renewables, California Energy Commission, Hoopa Indian Tribe
U.S. Forest Service-DOE-CPC community demonstrations – 6 locations
External Power: 3 kW Pellet Stove - Stirling Engine CHP System
Strategic Partners: Wood Mizer, Sunpower
FlexEnergy: 30 kW microturbine with co-compression of fuel/ air and catalytic combustion
Strategic Partners:Capstone Turbine Corp., California Energy Commission
SMB Phase 2 Project Descriptions
Carbona Project: Lemvig, Denmark
BIOMASSBIOMASS
ASHASH
AIRAIR
ASHASH
POWERPOWER
HEATHEAT
FUELFUELFEEDINGFEEDING
GASIFIERGASIFIER
TAR CRACKERTAR CRACKER
GAS COOLERGAS COOLER GAS COOLERGAS COOLER
STACKSTACK
HEAT RECOVERYHEAT RECOVERY
GAS TANKGAS TANK
GAS ENGINE(S)GAS ENGINE(S)

CPC 12 kWe Field PrototypeAlaminos, Panay, the Philippines
USFS – DOE – CPC Community Demonstration Program
•Objective: to demonstrate the feasibility of using SMB biopower systems to produce energy (CHP) with wood chips from forest fuel reduction activities
•Six sites to be chosen
•Two-year demonstrations
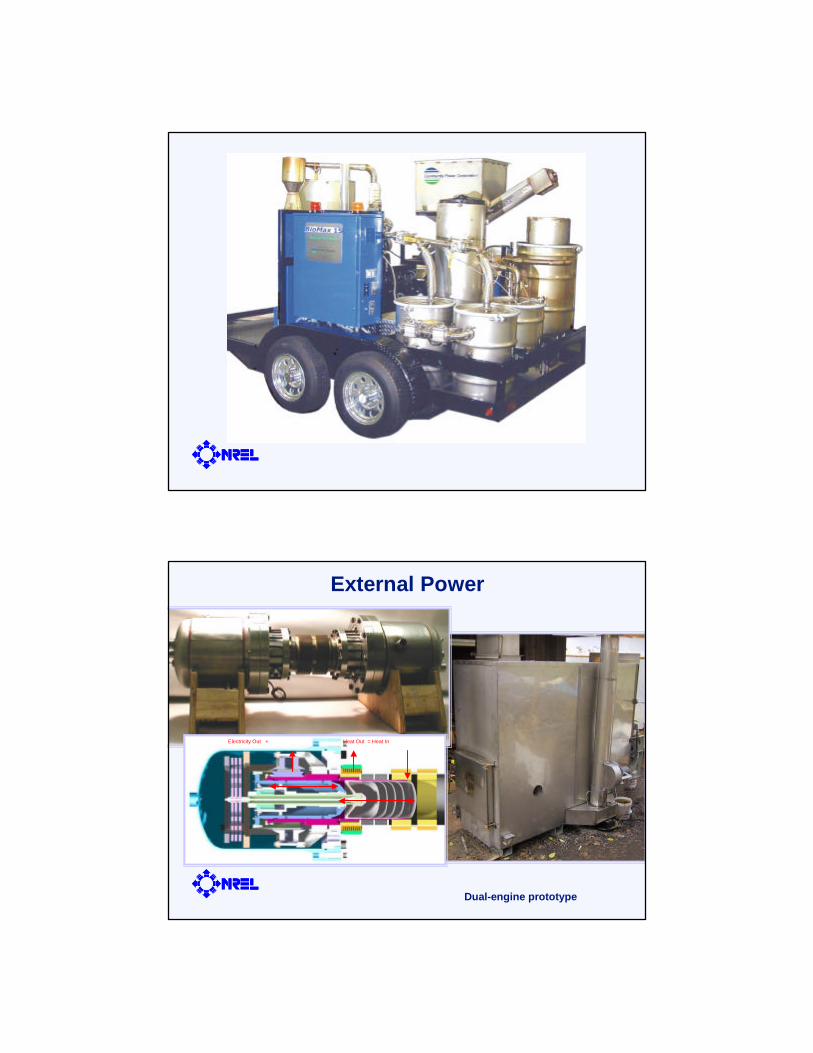
External Power
Dual-engine prototype
Electricity Out + Heat Out = Heat In

FlexEnergy Project
MBMS
TMBMS
Gasification (TCUF)
Engine Testing
Emissions Monitoring
NREL Facilities

Clean Syngas
H213 kW Power
Generator
Catalyst Test Bed
Biomass Syngas: CO, CO2, H2, etc
Bio-Reactor
Multifunction OperationSchematic of Biorefinery Test-Bed Operation
Continuous operation for 48 hours
Basic hot gas cleanup
Fluidized Fluidized bed biomass bed biomass
gasifiergasifier
slipstream
slipstream
Electricity
NREL - South Table Mountain Site02556011
Solar Energy Research Facility (SERF)
Field Test Laboratory Building (FTLB)Visitors Center