biomass and cellulosic ethanol production of forage sorghum under limited water conditions
TRANSCRIPT
Biomass and Cellulosic Ethanol Production of ForageSorghum Under Limited Water Conditions
Jon Cotton & Gloria Burow & Veronica Acosta-Martinez & Jennifer Moore-Kucera
Published online: 28 December 2012
Abstract This study presents results from a 2-year evalua-tion of biomass and cellulosic ethanol (EtOH) productionpotential of forage sorghum (Sorghum bicolor L. Moench)cultivars differing in brown midrib trait (i.e., bmr12) underdryland (no irrigation) and limited irrigation (2.88 mmday−1; subsurface drip) in the semiarid Southern High Plainsof the USA. Commercial cultivar Sorghum Partners 1990(SP 1990, conventional non-bmr) produced significantlymore biomass (29–62 %) than a bmr12 cultivar PaceSetterbmr (PS bmr) under irrigated and dryland conditions duringboth years of this study. However, PS bmr biomass hadhigher cellulosic EtOH conversion efficiency than SP 1990in both years according to simultaneous saccharification andfermentation analysis. Irrigation resulted in 26–49 % morebiomass and 28–72 % more cellulosic EtOH productionduring both growing seasons, indicating that limited irriga-tion had favorable effects on both biomass and biofuelproduction. In the first year, when precipitation was belowaverage, both cultivars produced similar amounts of cellu-losic EtOH. During the second year, when precipitation wasabove average, higher biomass production of SP 1990 resultedin 28 % higher cellulosic EtOH production than PS bmr whenaveraged across both irrigated and dryland conditions. Thelarge range of cellulosic EtOH production (1,600 to 3,380 Lha−1) during the 2 years of this study was primarily drivenby differences in water availability that resulted fromprecipitation and irrigation. Our findings indicates that
chemical composition and biomass yield potential of sorghumcultivars are critical factors that affect biomass and biofuelproduction under limited water conditions.
Keywords Biofuels . Ethanol . Forage sorghum . Ogallalaaquifer . Simultaneous saccharification and fermentation .
Water deficit . Deficit irrigation
AbbreviationsEtOH EthanolSHP Southern High Plainsbmr Brown midrib traitSP 1990 Sorghum cultivar Sorghum Partners 1990PS bmr Sorghum cultivar PaceSetter bmrET EvapotranspirationADF Acid detergent fiberNDF Neutral detergent fiberADL Acid detergent ligninSSF Simultaneous saccharification and
fermentationPercent CCE Cellulosic ethanol conversion efficiencyTEY Theoretical cellulosic ethanol yield
Introduction
Biofuels, which are produced from renewable plant resour-ces such as grain or biomass, have gained attention in recentyears as continuing decline in fossil fuel reserves coupledwith increases in global energy demand and greenhouse gasemissions has threatened the sustainability of current energyproduction. The benefits of fixing atmospheric carbon tohelp offset increased greenhouse gas emissions make bio-fuel production systems an integral facet of energy research.
J. Cotton :G. Burow :V. Acosta-MartinezUSDA-ARS Cropping Systems Research Laboratory,3810 4th Street,79415, Lubbock, TX, USA
J. Cotton (*) : J. Moore-KuceraDepartment of Plant and Soil Science, Texas Tech University,Campus Box 42122, 79409, Lubbock, TX, USAe-mail: [email protected]
Bioenerg. Res. (2013) 6:711–718DOI 10.1007/s12155-012-9285-0
# Springer Science+Business Media New York (outside the USA) 2012
To meet the energy challenge in the USA, the EnergyIndependence and Security Act of 2007 mandated that by2030, 30 % of liquid fuels in the country will be replaced bybiofuels [1, 2]. This directive requires production of anestimated one billion tons of feedstock that, by law, cannotbe produced on newly cleared or cultivated lands [1, 2].However, this energy production model is not without con-troversy as high-input food crops grown on fertile landshave primarily been used for biofuel applications up to thispoint, effectively causing direct competition between energyand food prices [3]. To avoid this problem, one alternativescenario is to transition agricultural lands limited by abioticfactors (e.g., water deficit) not used for food production tosustainable biofuel cropping systems using crops adapted tothese stresses.
The semiarid Southern High Plains (SHP) region of theUSA, specifically the Llano Estacado region of northwestTexas, has over 4.7 million ha in 20 counties currently underintensive row crop production [4]. Major limitations toagriculture in this region are the deficit water conditionsdue to the intensive use of the main irrigation water source(i.e., the Ogallala aquifer) [5] and the low fertility and loworganic matter content of the soils. This region has becomedominated by cotton (Gossypium hirsutum L.) monoculturecropping during the past 20 years, accounting for 20–25 %of the total US cotton production [5]. However, the future ofcurrent cropping practices is uncertain, as they further de-plete the Ogallala aquifer, reduce inherently low soil organicmatter [6], and intensify wind erosion common in thisregion [7]. Sorghum (Sorghum bicolor L. Moench) biofuelcropping systems in the SHP were shown to positivelyimpact soil quality parameters within 2 years of transition-ing from cotton cropping systems [8] despite completeremoval of aboveground biomass. These soil qualityimprovements were mainly attributed to increased root bio-mass inputs from sorghum compared to cotton [9] andsuggest the potential sustainability of sorghum biofuel crop-ping systems in the SHP.
Sorghum has been recommended for use as a bioenergyfeedstock, and its overall resilience and stress tolerancefeatures make it well adapted to water-limited conditions[10, 11]. This crop is suitable for production purposes as it isan annual row crop with a short growing season, offeringcropping system flexibility (e.g., rotations) not possible withother feedstock candidate perennial crops such as switch-grass. This is important in the SHP, where cropping flexi-bility and integration with profitable cotton production mustbe considered for large-scale adoption. Additionally, newsorghum cultivars have been introduced to enhance its util-ity as biomass feedstock. For example, the brown midribtrait (bmr) now available in a number of forage sorghumcultivars results in reduced wall lignin content. Lignin limitsthe access of enzymes to cell wall sugars during digestion
processes [12, 13]; therefore, biomass with lower lignincontent can have greater EtOH conversion efficienciesand production potential. Multiple bmr loci have beencharacterized to manipulate lignin biosynthetic enzymessuch as caffeic acid O-methyl transferase or cinnamylalcohol dehydrogenase [14, 15], with bmr12 and bmr6being most commonly used in commercial lines. Specifically,this study assessed a forage sorghum cultivar containing abmr12 mutation which specifically reduces production ofsyringyl lignin, modifying syringyl/guaiacyl ratios andresulting in lower overall lignin content. Sorghum iso-lines with bmr12 have shown higher residue yields withlower lignin content than the same lines with bmr6mutations [16, 17]. While information is available onthe biochemical characteristics of sorghum and theireffects on potential biofuel production [11, 12, 18], lessis known about how these properties are affected bystress such as water deficit.
The objectives of this study were: (1) to measure thebiomass production and biochemical composition of twocommercial forage sorghum cultivars under two deficit wa-ter levels (dryland and limited supplemental irrigation of2.88 mmday−1), (2) to evaluate differences in cellulosicEtOH conversion between a forage sorghum with abmr12 mutation and a conventional forage sorghum lack-ing bmr mutation, and (3) to quantify cellulosic EtOHproduction on a land area basis over two growing seasonsfor the combination of cultivar (i.e., bmr and non-bmr)and water level.
Materials and Methods
Site Description, Sorghum Cultivation, and Climate Data
This study was conducted during 2009–2010 at the USDepartment of Agriculture Agricultural Research ServiceStation in Big Spring, TX (32°16.75′ N latitude, 101°29.30′ W longitude), a semiarid region with mean annualtemperature of 17.1 °C and precipitation of 485 mm. Thesoil is an Amarillo fine sandy loam (fine-loamy, mixed,superactive, thermic Aridic Paleustalfs), with 13 % clay,78 % sand, pH of 7.5, and an average total C of 3.64 gkg−1 soil within the top 15 cm. The land used was underconventional cotton production for over 10 years prior tostudy initiation. The study was a split-plot randomizedblock experimental design with irrigation rate as themain plot and split for cultivar types and biomass re-moval treatments (n03 for each treatment combination).Irrigation treatments consisted of non-irrigated (dryland)and deficit-irrigated (2.88 mmday−1) plots, with subsur-face drip irrigation (35 cm depth) applied daily undereach row. The deficit irrigation rate was not based on a
712 Bioenerg. Res. (2013) 6:711–718
target replacement evapotranspiration (ET) but representsthe projected reduced irrigation capacity of the Ogallalaaquifer in the SHP [5]. Total irrigation applied was 228and 210 mm during the 2009 and 2010 growing seasons,respectively. Two commercial forage sorghum cultivarswere selected according to the results from fully irrigatedyield trials in the SHP [19]. Sorghum Partners 1990 (SP1990) was used to maximize biomass production with typicalor wild-type cell wall composition. This cultivar wascompared to the highest yielding bmr cultivar, PaceSetterbmr (PS bmr), which has a bmr12 mutation
Each plot (6×7 m) had six rows of sorghum planted at aspacing of 101.6 cm, which is typical spacing for rowcropping in this region under water deficit conditions. Plant-ing occurred after precipitation events, when sufficient soilmoisture for seed germination was present near the surfacefor both irrigated and dryland treatments. In 2009, plantingoccurred on 3 June, emergence on 9 June, and harvest on 21August. In 2010, planting initially occurred on 7 May, butseedlings were adversely affected by hail and the field wasreplanted on 24 May. Emergence occurred on 29 May, andplants were harvested on 19 August. The harvest times werebased on the maximum vegetative growth similar to Beanand McCollum [19]. Prior to planting, tillage (20 cm) wasconducted multiple times in early spring to build beds forwind erosion prevention and for planting preparation. Cul-tivation (0–10 cm) using sweeps in the furrow occurredearly in the season, with subsequent weed removal doneby hand. Fertilizer (123 and 56 kgha−1 year−1 N and P2O5,respectively) was injected by chisel at 25 cm from the plantbase approximately 1 month after emergence. For harvest,plant samples were taken to measure biomass yield andfor use in analyses (See “Plant Sampling and Analysis”subsection), followed by cutting and application of theappropriate biomass removal treatment (50 and 100 %),which were implemented for determining impacts on soilproperties [8]. The remaining residue was left standingthrough winter and early spring before incorporation intothe soil [8].
Weather data were collected using an on-site weatherstation (2009) and from the US National Weather Service(2010) weather station located 9.2 km from the research site.ET was estimated using the Texas Alliance for WaterConservation website [20]. During 2009, ET replacementwas approximately 50 % for dryland and 75 % for irrigated.In 2010, due to higher precipitation, ET replacement wasapproximately 75 % for dryland and near replacement forirrigated plots.
Plant Sampling and Analysis
At harvest, a non-border row within each plot was randomlyselected and sampled (1 m) at the root–shoot juncture to
estimate aboveground biomass yield. Biomass was deter-mined for leaf and stem samples (chopped to 10-cm pieces)separately for each plot (oven dried at 65 °C for 96 h). Allsubsequent analyses were performed on leaf and stem sam-ples separately, and a ratio of leaf-to-stem biomass was usedto determine the overall value for each plant property for theentire plot.
For plant biochemical analyses, subsamples (approx.50 g) were ground to pass through a 2-mm sieve using aWiley mill (Thomas Scientific, Inc., Swedesboro, NJ). Aciddetergent fiber (ADF) [21], neutral detergent fiber (NDF)[22], and acid detergent lignin (ADL) [23] were determinedin a private laboratory (Ward Laboratories, Kearney, NE)using the Ankom filter bag system (Ankom Technology,Fairport, NY). Cellulose (ADF–ADL) and hemicellulose(NDF–ADF) were subsequently calculated using thesevalues.
Cellulosic EtOH yield was assayed in triplicate for allsamples using the simultaneous saccharification and fer-mentation (SSF) method of Isci et al. [24]. Briefly, 0.5 gof ground plant sample was heat-sealed in an Ankom filterbag and weighed for initial total weight (sample + bag).Samples were pretreated by soaking in 30 % NH4OH for24 h, rinsed with deionized water until ammonia odor wasno longer present, and dried at ambient temperature for 48 h.Total weight was again taken to estimate sample mass lossto ensure proper pretreatment occurred. Bags had slits cutand were then placed in 25-ml DeLong flasks (Bellco,Vinland, NJ), submerged in 20 ml of SSF media (1 % yeastextract and 2 % peptone in 0.05 M citrate buffer, pH 4.8),capped, covered in aluminum foil, and sterilized by auto-clave for 20 min at 121 °C. Samples were cooled at ambienttemperature for 30 min, and sterile SSF medium was addedto each flask to replace any that had been lost duringautoclaving. Cellulase enzyme (Spezyme CP lot no. 490-0901-224, Genencor, Rochester, NY), 0.5 ml, with an ac-tivity of 50 filter paper units per milliliter, was added to eachflask, followed by 0.5 ml of Saccharomyces cerevisiae D5Ayeast culture (provided by the National Renewable EnergyLab) diluted to 2.4×10⁹ cells ml−1. Fermentation occurredduring 24-h incubation at 37 °C on a rotating shaker at170 rpm. A 1-ml aliquot was then removed and dilutedappropriately with sterile deionized water for the rangeof the standard curve of the Megazyme International(Wicklow, Ireland) protocol used to quantify EtOH content[25].
Calculations and Statistical Analysis
Using values from the SSF analysis and the amount ofcellulose present calculated from ADF and ADL analy-ses, cellulose conversion efficiency (percent CCE) wascalculated [26] using a maximum conversion rate of
Bioenerg. Res. (2013) 6:711–718 713
0.511 g EtOH per gram sugar [27] using the followingequation:
% CCE ¼ EtOH gð Þ produced during SSF
cellulose gð Þ present � 0:511� 100
Theoretical cellulosic EtOH yield (TEY) on a land areabasis was calculated according to the equation:
TEY L EtOH ha�1� � ¼ Plant Biomass kg ha�1
� �
� % cellulose=100ð Þ � 0:511
� % CCE=100ð Þ � 0:789 L EtOH kg�1Þ�
For the different parameters evaluated, the mean andstandard error of the mean, standard least squares analysisof variance (ANOVA), and protected pairwise comparisonsusing Student's t test were performed using R statisticalsoftware (ver. 2.13.1) [28].
Results
Climate Data
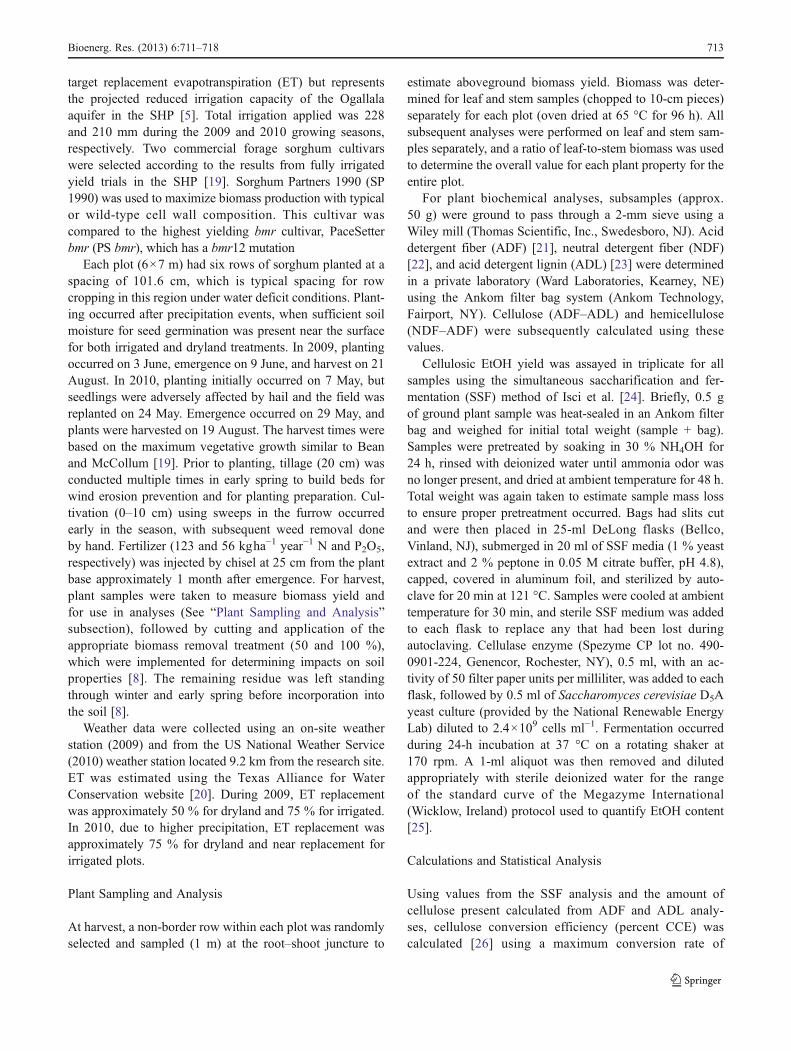
Higher precipitation occurred during the second year of thisstudy in 2010 (789 mm) than the first year in 2009(310 mm), and specifically during the growing season fromMay to August (324 vs. 186 mm) (Fig. 1). Seasonal pre-cipitation was above and below the historical average of230 mm during 2010 and 2009, respectively. Combiningirrigation and precipitation during the growing season,total water available for the irrigated treatments was 414and 534 mm during 2009 and 2010, respectively. Aver-age daily temperatures were similar during the growingseason of 2009 (27.0 °C) and 2010 (26.7 °C), and werewarmer than the historical average of 25.8 °C. Though
average temperatures were similar between years, 2010had an unseasonably cool and wet 7-day period approx-imately 1 month after emergence, which slowed cropgrowth.
2009
Pre
cipi
tati
on (
mm
)
0
20
40
60
80
100
120
140
160
180
Mean A
ir temperature ( oC
)
0
5
10
15
20
25
30
35
Jan Feb Mar Apr May Jun Jul Aug Sep Oct Nov Dec Jan Feb Mar Apr May Jun Jul Aug Sep Oct Nov Dec
2010
Total annual: 310 mm
PrecipitationGrowing season: 186 mm
PrecipitationGrowing Season: 324 mmTotal annual: 789 mm
Planting Planting
Harvest Harvest
Fig. 1 Mean monthly temperature (line), total monthly precipitation(bar), precipitation during growing season (May–August, gray bars,text at top left), and total annual precipitation (text at top left) during
the 2 years of the study. Planting dates were 3 June 2009 and 24 May2010; harvest dates were 21 August 2009 and 19 August 2010
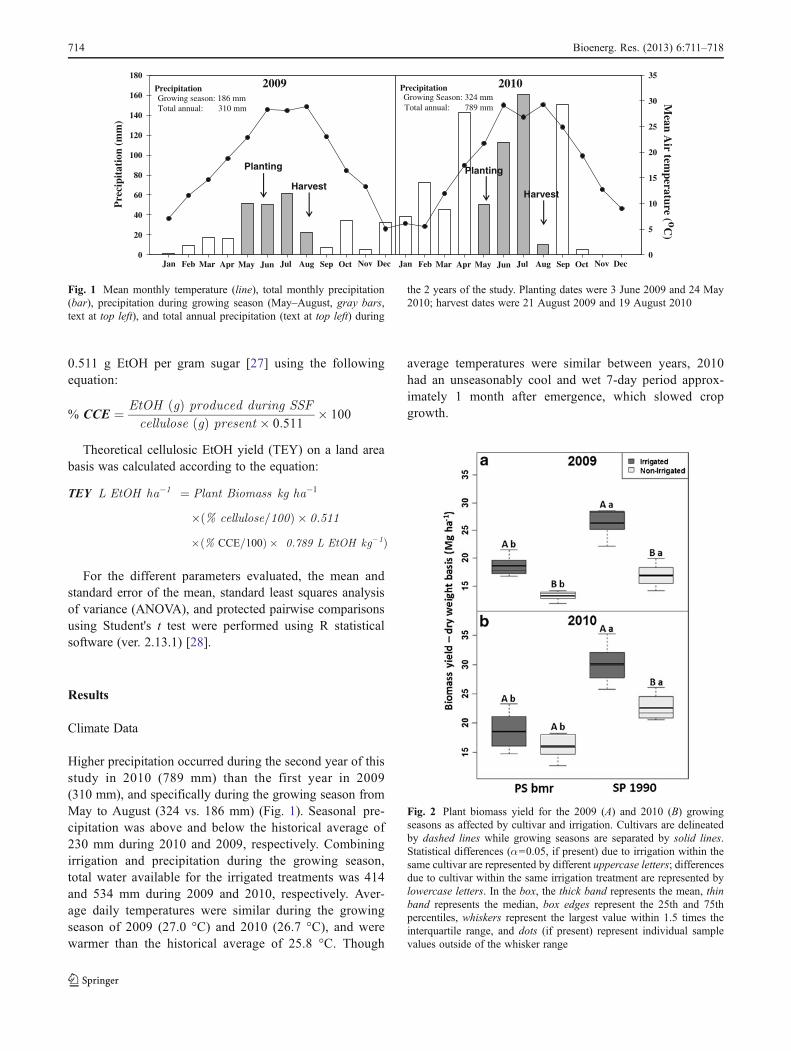
Fig. 2 Plant biomass yield for the 2009 (A) and 2010 (B) growingseasons as affected by cultivar and irrigation. Cultivars are delineatedby dashed lines while growing seasons are separated by solid lines.Statistical differences (α00.05, if present) due to irrigation within thesame cultivar are represented by different uppercase letters; differencesdue to cultivar within the same irrigation treatment are represented bylowercase letters. In the box, the thick band represents the mean, thinband represents the median, box edges represent the 25th and 75thpercentiles, whiskers represent the largest value within 1.5 times theinterquartile range, and dots (if present) represent individual samplevalues outside of the whisker range
714 Bioenerg. Res. (2013) 6:711–718
Sorghum Biomass Yields
Overall biomass production ranged from 13.2 to 30.1Mgha−1
(Fig. 2, A and B). Leaves accounted for 24–36 % of theoverall plant biomass, though there was no difference due tocultivar or growing season (data not shown). Biomass yieldswere influenced by year of sampling, cultivar type, and irri-gation treatment. More biomass was produced by both culti-vars in 2010 compared to 2009 (Table 1). The SP 1990cultivar was more responsive to conditions during samplingyears and produced 22 %more biomass in 2010 than in 2009,whereas PS bmr only produced 8 % more in 2010. SP 1990produced more biomass than PS bmr in 2009 (35 %) and
2010 (52 %) regardless of irrigation. Irrigated plots hadsignificantly greater biomass than the dryland plots, with alarger difference in 2009 (49 %) than in 2010 (26 %) (Fig. 2,A and B; Table 1). A significant interaction between irrigationand cultivar occurred only in 2010 according to ANOVA. Forexample, deficit-irrigated treatment increased biomass in SP1990 during both years, but only in 2009 for PS bmr.
Biomass Chemical Composition
Similar to the biomass yields, the chemical composition wassignificantly affected by sampling year, cultivar, and irriga-tion treatments (Table 1 and 2). When averaged across all
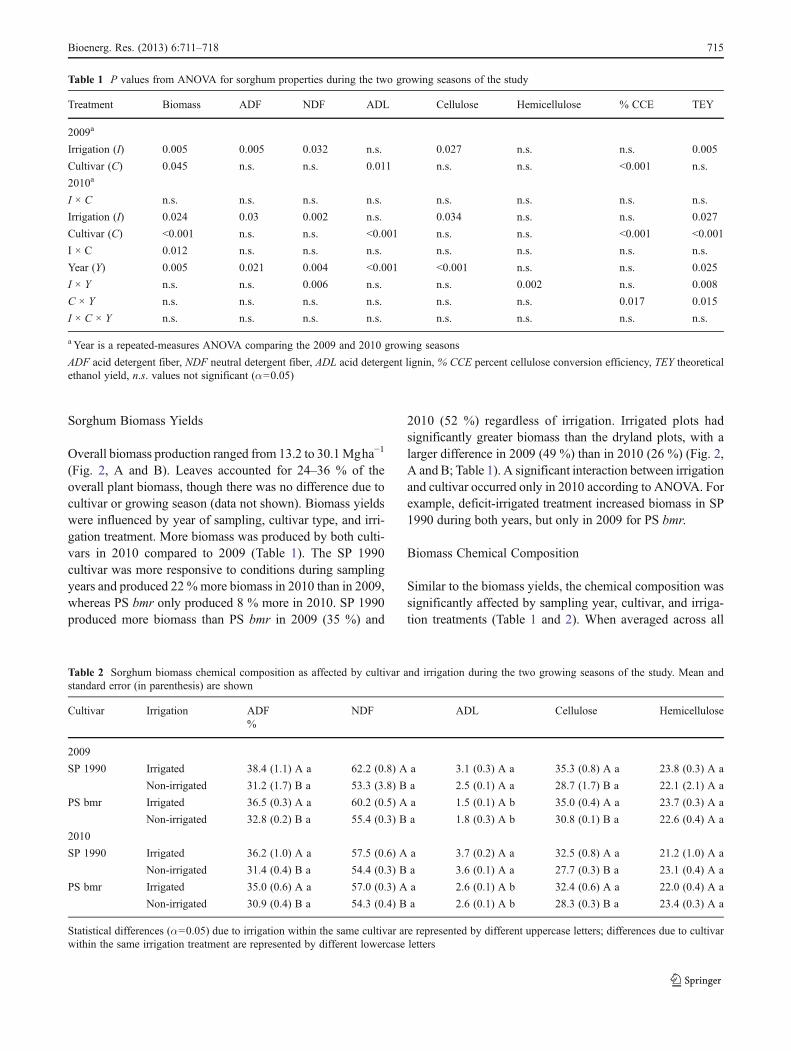
Table 1 P values from ANOVA for sorghum properties during the two growing seasons of the study
Treatment Biomass ADF NDF ADL Cellulose Hemicellulose % CCE TEY
2009a
Irrigation (I) 0.005 0.005 0.032 n.s. 0.027 n.s. n.s. 0.005
Cultivar (C) 0.045 n.s. n.s. 0.011 n.s. n.s. <0.001 n.s.
2010a
I × C n.s. n.s. n.s. n.s. n.s. n.s. n.s. n.s.
Irrigation (I) 0.024 0.03 0.002 n.s. 0.034 n.s. n.s. 0.027
Cultivar (C) <0.001 n.s. n.s. <0.001 n.s. n.s. <0.001 <0.001
I × C 0.012 n.s. n.s. n.s. n.s. n.s. n.s. n.s.
Year (Y) 0.005 0.021 0.004 <0.001 <0.001 n.s. n.s. 0.025
I × Y n.s. n.s. 0.006 n.s. n.s. 0.002 n.s. 0.008
C × Y n.s. n.s. n.s. n.s. n.s. n.s. 0.017 0.015
I × C × Y n.s. n.s. n.s. n.s. n.s. n.s. n.s. n.s.
a Year is a repeated-measures ANOVA comparing the 2009 and 2010 growing seasons
ADF acid detergent fiber, NDF neutral detergent fiber, ADL acid detergent lignin, % CCE percent cellulose conversion efficiency, TEY theoreticalethanol yield, n.s. values not significant (α00.05)
Table 2 Sorghum biomass chemical composition as affected by cultivar and irrigation during the two growing seasons of the study. Mean andstandard error (in parenthesis) are shown
Cultivar Irrigation ADF NDF ADL Cellulose Hemicellulose%
2009
SP 1990 Irrigated 38.4 (1.1) A a 62.2 (0.8) A a 3.1 (0.3) A a 35.3 (0.8) A a 23.8 (0.3) A a
Non-irrigated 31.2 (1.7) B a 53.3 (3.8) B a 2.5 (0.1) A a 28.7 (1.7) B a 22.1 (2.1) A a
PS bmr Irrigated 36.5 (0.3) A a 60.2 (0.5) A a 1.5 (0.1) A b 35.0 (0.4) A a 23.7 (0.3) A a
Non-irrigated 32.8 (0.2) B a 55.4 (0.3) B a 1.8 (0.3) A b 30.8 (0.1) B a 22.6 (0.4) A a
2010
SP 1990 Irrigated 36.2 (1.0) A a 57.5 (0.6) A a 3.7 (0.2) A a 32.5 (0.8) A a 21.2 (1.0) A a
Non-irrigated 31.4 (0.4) B a 54.4 (0.3) B a 3.6 (0.1) A a 27.7 (0.3) B a 23.1 (0.4) A a
PS bmr Irrigated 35.0 (0.6) A a 57.0 (0.3) A a 2.6 (0.1) A b 32.4 (0.6) A a 22.0 (0.4) A a
Non-irrigated 30.9 (0.4) B a 54.3 (0.4) B a 2.6 (0.1) A b 28.3 (0.3) B a 23.4 (0.3) A a
Statistical differences (α00.05) due to irrigation within the same cultivar are represented by different uppercase letters; differences due to cultivarwithin the same irrigation treatment are represented by different lowercase letters
Bioenerg. Res. (2013) 6:711–718 715
treatments, biomass from 2009 contained 4–7 % more ADF,NDF, and cellulose, while ADL was 40 % higher in 2010.No difference was found in hemicellulose between thegrowing seasons. As expected, the SP 1990 biomasscontained higher lignin content (percent ADL) than PSbmr, but varied by year. For example, percent ADL inPS bmr averaged 1.65 % in 2009 and 2.6 % in 2010(Tables 1 and 2). The two cultivars did not showsignificant differences for ADF, NDF, cellulose, andhemicellulose. The irrigated treatment resulted in higherADF (11–23 %), NDF (5–17 %), and cellulose (16–18 %)contents compared to the non-irrigated treatment for bothcultivars (Table 2).
Ethanol Conversion Efficiency and Yield Production
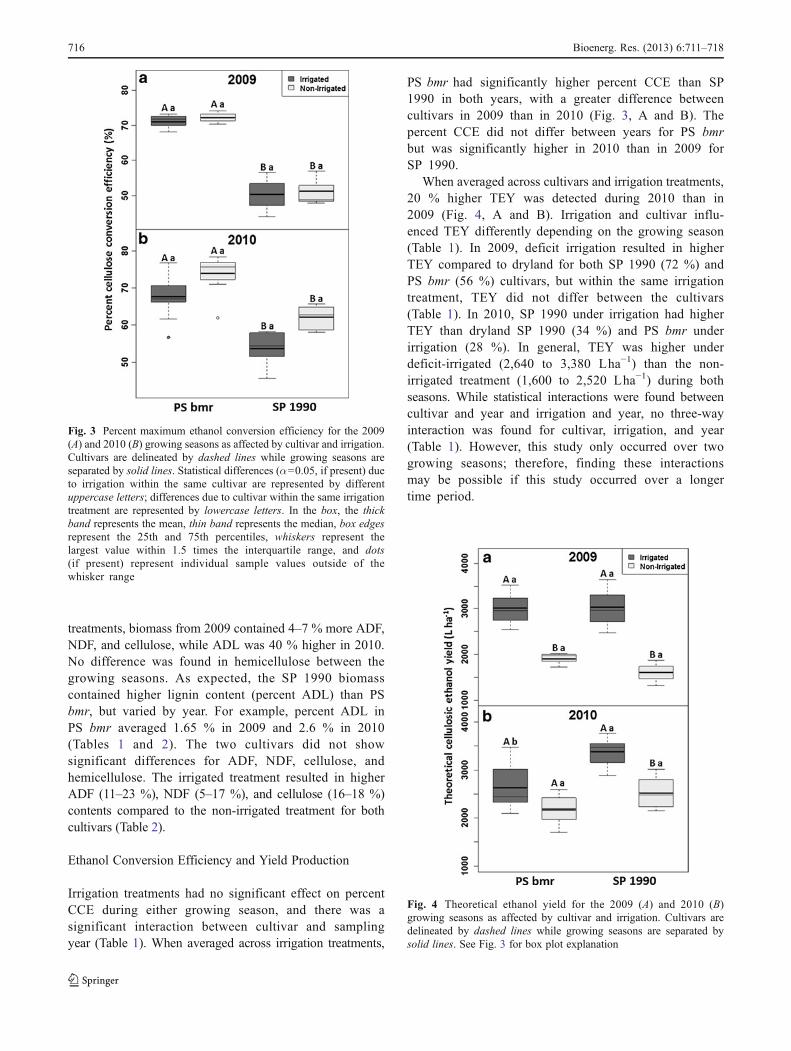
Irrigation treatments had no significant effect on percentCCE during either growing season, and there was asignificant interaction between cultivar and samplingyear (Table 1). When averaged across irrigation treatments,
PS bmr had significantly higher percent CCE than SP1990 in both years, with a greater difference betweencultivars in 2009 than in 2010 (Fig. 3, A and B). Thepercent CCE did not differ between years for PS bmrbut was significantly higher in 2010 than in 2009 forSP 1990.
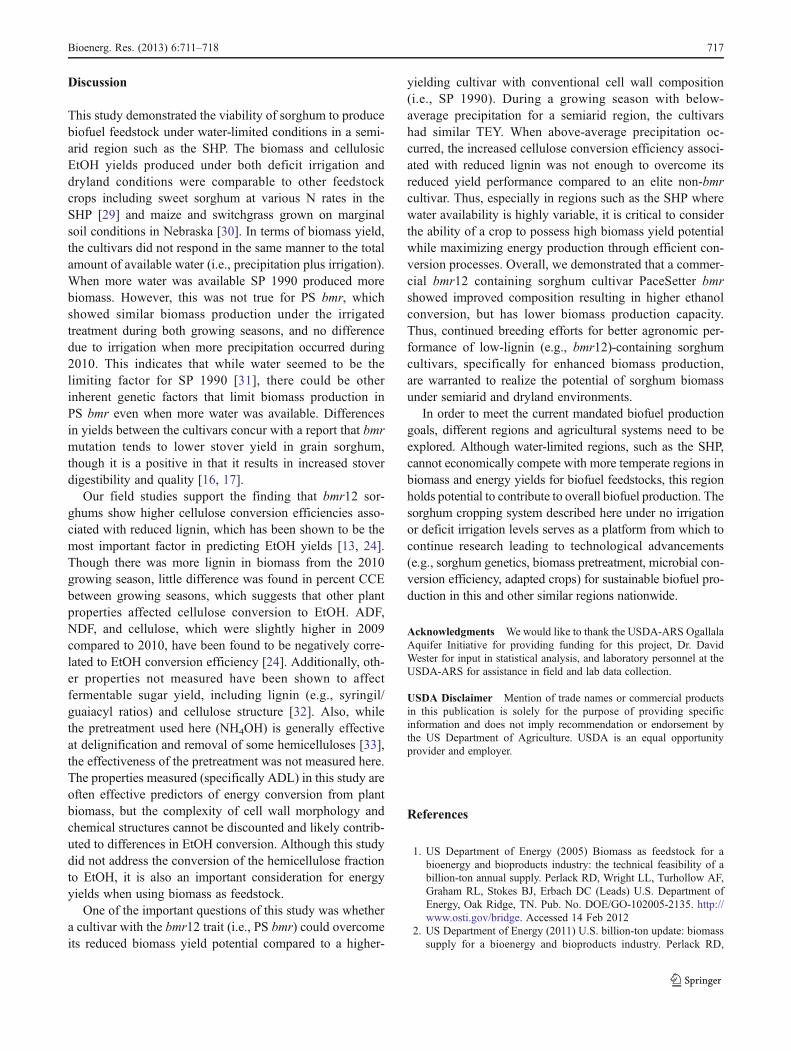
When averaged across cultivars and irrigation treatments,20 % higher TEY was detected during 2010 than in2009 (Fig. 4, A and B). Irrigation and cultivar influ-enced TEY differently depending on the growing season(Table 1). In 2009, deficit irrigation resulted in higherTEY compared to dryland for both SP 1990 (72 %) andPS bmr (56 %) cultivars, but within the same irrigationtreatment, TEY did not differ between the cultivars(Table 1). In 2010, SP 1990 under irrigation had higherTEY than dryland SP 1990 (34 %) and PS bmr underirrigation (28 %). In general, TEY was higher underdeficit-irrigated (2,640 to 3,380 Lha−1) than the non-irrigated treatment (1,600 to 2,520 Lha−1) during bothseasons. While statistical interactions were found betweencultivar and year and irrigation and year, no three-wayinteraction was found for cultivar, irrigation, and year(Table 1). However, this study only occurred over twogrowing seasons; therefore, finding these interactionsmay be possible if this study occurred over a longertime period.
Fig. 3 Percent maximum ethanol conversion efficiency for the 2009(A) and 2010 (B) growing seasons as affected by cultivar and irrigation.Cultivars are delineated by dashed lines while growing seasons areseparated by solid lines. Statistical differences (α00.05, if present) dueto irrigation within the same cultivar are represented by differentuppercase letters; differences due to cultivar within the same irrigationtreatment are represented by lowercase letters. In the box, the thickband represents the mean, thin band represents the median, box edgesrepresent the 25th and 75th percentiles, whiskers represent thelargest value within 1.5 times the interquartile range, and dots(if present) represent individual sample values outside of thewhisker range
Fig. 4 Theoretical ethanol yield for the 2009 (A) and 2010 (B)growing seasons as affected by cultivar and irrigation. Cultivars aredelineated by dashed lines while growing seasons are separated bysolid lines. See Fig. 3 for box plot explanation
716 Bioenerg. Res. (2013) 6:711–718
Discussion
This study demonstrated the viability of sorghum to producebiofuel feedstock under water-limited conditions in a semi-arid region such as the SHP. The biomass and cellulosicEtOH yields produced under both deficit irrigation anddryland conditions were comparable to other feedstockcrops including sweet sorghum at various N rates in theSHP [29] and maize and switchgrass grown on marginalsoil conditions in Nebraska [30]. In terms of biomass yield,the cultivars did not respond in the same manner to the totalamount of available water (i.e., precipitation plus irrigation).When more water was available SP 1990 produced morebiomass. However, this was not true for PS bmr, whichshowed similar biomass production under the irrigatedtreatment during both growing seasons, and no differencedue to irrigation when more precipitation occurred during2010. This indicates that while water seemed to be thelimiting factor for SP 1990 [31], there could be otherinherent genetic factors that limit biomass production inPS bmr even when more water was available. Differencesin yields between the cultivars concur with a report that bmrmutation tends to lower stover yield in grain sorghum,though it is a positive in that it results in increased stoverdigestibility and quality [16, 17].
Our field studies support the finding that bmr12 sor-ghums show higher cellulose conversion efficiencies asso-ciated with reduced lignin, which has been shown to be themost important factor in predicting EtOH yields [13, 24].Though there was more lignin in biomass from the 2010growing season, little difference was found in percent CCEbetween growing seasons, which suggests that other plantproperties affected cellulose conversion to EtOH. ADF,NDF, and cellulose, which were slightly higher in 2009compared to 2010, have been found to be negatively corre-lated to EtOH conversion efficiency [24]. Additionally, oth-er properties not measured have been shown to affectfermentable sugar yield, including lignin (e.g., syringil/guaiacyl ratios) and cellulose structure [32]. Also, whilethe pretreatment used here (NH4OH) is generally effectiveat delignification and removal of some hemicelluloses [33],the effectiveness of the pretreatment was not measured here.The properties measured (specifically ADL) in this study areoften effective predictors of energy conversion from plantbiomass, but the complexity of cell wall morphology andchemical structures cannot be discounted and likely contrib-uted to differences in EtOH conversion. Although this studydid not address the conversion of the hemicellulose fractionto EtOH, it is also an important consideration for energyyields when using biomass as feedstock.
One of the important questions of this study was whethera cultivar with the bmr12 trait (i.e., PS bmr) could overcomeits reduced biomass yield potential compared to a higher-
yielding cultivar with conventional cell wall composition(i.e., SP 1990). During a growing season with below-average precipitation for a semiarid region, the cultivarshad similar TEY. When above-average precipitation oc-curred, the increased cellulose conversion efficiency associ-ated with reduced lignin was not enough to overcome itsreduced yield performance compared to an elite non-bmrcultivar. Thus, especially in regions such as the SHP wherewater availability is highly variable, it is critical to considerthe ability of a crop to possess high biomass yield potentialwhile maximizing energy production through efficient con-version processes. Overall, we demonstrated that a commer-cial bmr12 containing sorghum cultivar PaceSetter bmrshowed improved composition resulting in higher ethanolconversion, but has lower biomass production capacity.Thus, continued breeding efforts for better agronomic per-formance of low-lignin (e.g., bmr12)-containing sorghumcultivars, specifically for enhanced biomass production,are warranted to realize the potential of sorghum biomassunder semiarid and dryland environments.
In order to meet the current mandated biofuel productiongoals, different regions and agricultural systems need to beexplored. Although water-limited regions, such as the SHP,cannot economically compete with more temperate regions inbiomass and energy yields for biofuel feedstocks, this regionholds potential to contribute to overall biofuel production. Thesorghum cropping system described here under no irrigationor deficit irrigation levels serves as a platform from which tocontinue research leading to technological advancements(e.g., sorghum genetics, biomass pretreatment, microbial con-version efficiency, adapted crops) for sustainable biofuel pro-duction in this and other similar regions nationwide.
Acknowledgments We would like to thank the USDA-ARS OgallalaAquifer Initiative for providing funding for this project, Dr. DavidWester for input in statistical analysis, and laboratory personnel at theUSDA-ARS for assistance in field and lab data collection.
USDA Disclaimer Mention of trade names or commercial productsin this publication is solely for the purpose of providing specificinformation and does not imply recommendation or endorsement bythe US Department of Agriculture. USDA is an equal opportunityprovider and employer.
References
1. US Department of Energy (2005) Biomass as feedstock for abioenergy and bioproducts industry: the technical feasibility of abillion-ton annual supply. Perlack RD, Wright LL, Turhollow AF,Graham RL, Stokes BJ, Erbach DC (Leads) U.S. Department ofEnergy, Oak Ridge, TN. Pub. No. DOE/GO-102005-2135. http://www.osti.gov/bridge. Accessed 14 Feb 2012
2. US Department of Energy (2011) U.S. billion-ton update: biomasssupply for a bioenergy and bioproducts industry. Perlack RD,
Bioenerg. Res. (2013) 6:711–718 717
Stokes BJ (Leads) U.S. Department of Energy, Oak Ridge, TN.Pub. no. ORNL/TM-2011/224. http://www.osti.gov/bridge.Accessed 14 Feb 2012
3. Cassman KG, Liska AJ (2007) Food and fuel for all: realistic orfoolish? Biofuels Bioprod Bioref 1:18–23
4. National Agriculture Statistics Service (2007) 2007 census ofagriculture. US Department of Agriculture, Washington D.C.http://www.agcensus.usda.gov/Publications/2007/index.asp.Accessed 16 Dec 2011
5. Allen VG, Brown CP, Segarra E, Green CJ, Wheeler TA, Acosta-Martínez V, Zobeck TM (2008) In search of sustainable agricul-tural systems for the Llano Estacado of the U.S. Southern HighPlains. Agric Ecosys Environ 124:3–12
6. Acosta-Martínez V, Lascano R, Calderón F, Booker JD, ZobeckTM, Upchurch DR (2011) Dryland cropping systems influence themicrobial biomass and enzyme activities in a semiarid sandy soil.Biol Fertil Soils 47:655–667
7. Lee JA, Baddock MC, Mbuh MJ, Gill TE (2012) Geomorphic andland cover characteristics of aeolian dust sources in West Texasand eastern New Mexico, USA. Aeolian Res 3:459–466
8. Cotton J, Acosta-Martínez V, Moore-Kucera J, Burow G (2012)Early changes due to sorghum biofuel cropping systems in soilmicrobial communities and metabolic functioning. Biol FertilSoils. doi:10.1007/s00374-012-0732-z
9. Polley HW, Johnson HB, Mayeux HS (1992) Determination ofroot biomasses of three species grown in a mixture using stableisotopes of carbon and nitrogen. Plant Soil 142:97–106
10. Rooney WL, Blumenthal J, Bean B, Mullet JE (2007) Designingsorghum as a dedicated bioenergy feedstock. Biofuels BioprodBioref 1:147–157
11. Saballos A (2008) Development and utilization of sorghum as abioenergy crop. In: Vermerris W (ed) Genetic improvement ofbioenergy crops. Springer Science + Business Media, New York,pp 211–248
12. Dien BS, Sarath G, Pedersen JF, Sattler SE, Chen H, Funnell-Harris DL et al (2009) Improved sugar conversion and ethanolyield for forage sorghum (Sorghum bicolor L. Moench) lines withreduced lignin contents. Bioenerg Res 2:153–164
13. Lorenz AJ, Anex RP, Isci A, Coors JG, de Leon N, Weimer PJ(2009) Forage quality and composition measurements as predictorsof ethanol yield from maize (Zea mays L.) stover. Biotechn Bio-fuels 2:1–8. doi:10.1186/1754-6834-2-5
14. Bout S, Vermerris W (2003) A candidate-gene approach to clonethe sorghum brown midrib gene encoding caffeic acid O–methyl-transferase. Mol Gen Genomics 269:205–214. doi:10.1007/s00438-003-0824-4
15. Saballos A, Vermerris W, Rivera L, Ejeta G (2008) Allelic associ-ation, chemical characterization and saccharification properties ofbrown midribmutants of sorghum (Sorghum bicolor (L.) Moench).Bioenerg Res 1:193–204. doi:10.1007/s12155-008-9025-7
16. Oliver AL, Pedersen JF, Grant RJ, Klopfenstein TJ, Jose HD(2005) Comparative effects of the sorghum bmr-6 and bmr-12
genes: II. Grain yield, stover yield and stover quality in grainsorghum. Crop Sci 45:2240–2245
17. Sattler SE, Funnell-Harris DL, Pedersen JF (2010) Brown midribmutations and their importance to the utilization of maize, sor-ghum, and pearl millet lignocellulosic tissues. Plant Sci 178:229–238. doi:10.1016/j.plantsci.2010.01.001
18. Tew TL, Cobill RM, Richard EP Jr (2008) Evaluation of sweetsorghum and sorghum × sudangrass hybrids as feedstocks forethanol production. Bioenerg Res 1:147–152
19. BeanB,McCollumT (2006) Summary of six years of forage sorghumvariety trials. Texas Cooperative Extension and Texas AgriculturalExperiment Station, Amarillo, TX. Pub No SCS-2006-04 2–06
20. Texas Alliance for Water Conservation (2011) TAWC ET. TexasAlliance for Water Conservation, Lubbock, TX. http://www.depts.ttu.edu/tawc/. Accessed 13 Dec 2011
21. ANKOM Technology (1998) Method for determining acid deter-gent fiber. Ankom 200/220 Fiber Analyzer Manual, Fairport, NY
22. ANKOM Technology (1998) Method for determining neutral de-tergent fiber. Ankom 200/220 Fiber Analyzer Manual, Fairport,NY
23. ANKOM Technology (1998) Method for determining acid deter-gent lignin in beakers. Ankom 200/220 Fiber Analyzer Manual,Fairport, NY
24. Isci A, Murphy PT, Anex RP, Moore KJ (2008) A rapid simulta-neous saccharification and fermentation (SSF) technique to deter-mine ethanol yields. Bioenerg Res 1:163–169
25. Megazyme International Ireland Ltd (2011) Ethanol assay proce-dure, 02/11 ed, Wicklow, Ireland
26. Schuler ML, Kargi F (2002) Bioprocess engineering, 2nd edn.Prentice Hall, USA
27. Kim TH, Lee YY (2005) Pretreatment of corn stover by soaking inaqueous ammonia. Appl Biochem Biotechnol 121:1119–1132
28. R Development Core Team (2011) R: a language and environmentfor statistical computing. Vienna, Austria. http://www.R-project.org/.Accessed 11 Jan 2011
29. Tamang PL, Bronson KF, Malapati A, Schwartz R, Johnson J,Moore-Kucera J (2011) Nitrogen requirements for ethanol produc-tion from sweet and photoperiod sensitive sorghums in the South-ern High Plains. Agron J 103:431–440
30. Varvel GE, Vogel KP, Mitchell RB, Follett RF, Kimble JM (2008)Comparison of corn and switchgrass on marginal soils for bioen-ergy. Biomass Bioenerg 32:18–21
31. Turhollow AF, Webb EG, Downing ME (2010) Review of sor-ghum production practices: applications for bioenergy. Oak RidgeNational Laboratory, Oak Ridge. TN, pub. no. ORNL/TM-2010/7.http://www.osti.gov/bridge. Accessed 13 Oct 2010
32. Corredor DY, Salazar JM, Hohn KL, Bean S, Bean B, Wang D(2009) Evaluation and characterization of forage sorghum as feed-stock for fermentable sugar production. Appl Biochem Biotechnol158:164–179
33. Zheng Y, Pan Z, Zhang R (2009) Overview of biomass pretreatmentfor cellulosic ethanol production. Int J Agric Biol Eng 2:51–68
718 Bioenerg. Res. (2013) 6:711–718