biomass and bioenergy - soliftec technique 2017.pdf · biomass and bioenergy journal homepage: ......
TRANSCRIPT
Contents lists available at ScienceDirect
Biomass and Bioenergy
journal homepage: www.elsevier.com/locate/biombioe
Research paper
Impact of ignition technique on total emissions of a firewood stove
Benoît Brandeleta,b,∗, Christophe Rosec, Caroline Rogaumea, Yann Rogaumea
a Laboratoire d’Etudes et de Recherches sur le MAtériau Bois, 27 rue Philippe Seguin, 88000 Epinal, Franceb Agence De l’Environnement et de la Maîtrise de l’Energie, 20 Avenue du Grésillé, 49004 Angers Cedex 01, Francec UMR EEF (PTEF) Institut National de la Recherche Agronomique, Rue d’Amance, 54280 Champenoux, France
A R T I C L E I N F O
Keywords:User behaviorPM emissionsFirewodd stoveFirewood combustionEmissions analysis
A B S T R A C T
A comparison of the effects of traditional stove ignition with paper under the wood versus the Top-Down ignitionof a wood crib is made, comparing the gaseous and particulate emissions. Top-Down ignition reduced the un-burnt gas emissions by a factor of 2. The Total Suspended Particle (TSP) emission was reduced by about 1/3,while Organic Carbon (OC) was reduced by 73% relative to traditional under-fire ignition. Never the less theElemental Carbon (EC) doubled in Top-Down ignition. The particle formation mechanism is also different withprimary emissions being nanoparticles (20 nm - 50 nm) which agglomerated as they passed along the flue duct.The TSP were generally composed of CHO while the smaller size range < PM1 and especially the PM0.1 con-tained other elements.
1. Introduction
Most developed countries depend on fuel, which leads them to in-creasingly use and improve renewable energies. Saidur et al. [1] de-monstrated that domestic wood heating, which is composed of boilers(central heating, hot water) and biomass room heating appliances(room heating, hot air), is the first renewable energy and is the one thatis promoted. Moreover, Kalt and Kranzl [2] showed that domestic woodheating is one of the cheapest energies, especially for logs. In thiscontext, the sales of wood domestic appliances have considerably in-creased in all Europe [3]. In Europe, the residential sector (except forpellets) is the main share of wood energy with 27% of the total use [4].Then, in this study, the performance of a firewood stove was focusedon. Many scientific papers describe this energy as an important sourceof particles emissions [5–8] particularly during winter [9]. Particles inthe ambient air represent an important risk for health because of theirsize, their surface and their composition [10–14]. Moreover, the com-position in Elemental Carbon (EC) and Organic Carbon (OC) of particlesinduces a modification of the radiative balance of the earth and alsochanges the composition of the clouds [15–17]. The particles in theatmosphere from wood fuel combustion are not only due to the directparticulate emission but also to a physical and chemical condensationprocess that produces additional particles from volatile compounds inthe flue gases [18]. The Secondary Organic Aerosols (SOA) are an im-portant fraction of the particles in the ambient air [8]. Therefore, theVolatile Organic Compounds (VOC) and the Total Suspended Particles(TSP) need to be measured simultaneously [19]. Even if some
secondary emission abatement systems do exist and are suitable forfirewood stoves [20,21], only few installations are fitted. Then theemissions in firewood stoves must first be reduced by the user. Manyprimary measures were developed, (secondary air, insulation of thecombustion room …) and led to cleaner combustion. Many parametersindependent of the user impact the emissions and the thermal efficiency(i.e. chimney system and weather conditions). One of the parametersthat most impacts on the emissions is the operating practice [20,22]like fuel characteristics [23], combustion air supply settings [24] or theignition technique. These improvements of firewood stoves are sus-tained by the evolution of standards and labels [21]. Nevertheless, thefuel feed and the ignition of firewood stoves remain highly emissive[25]. Indeed, during the ignition phase, the furnace and hearth are coldand lead to high emissions of unburned gas and particles. In order tosolve this issue, the Top-Down ignition was recommended in Switzer-land. The Top-Down offers an advantage to induce a more progressiveignition. Indeed, as the flame is on the top, the radiation will be moregradual and then the emissions of pyrolysis gases will also be pro-gressive. On the contrary, with a Traditional Ignition system, the wholefuel is directly heated by the combustion. Miljevic et al. [26] demon-strated that this kind of ignition reduced the Total Suspended Particles(TSP) emissions contrary to Vicente et al. [27].
Several different pollutants were followed, namely CO, NO, SO2,Total Volatile Organic Compounds (VOC), CH4, Total SuspendedParticles (TSP), Total Carbon (TC), Elemental Carbon (EC) and OrganicCarbon (OC). By measuring the CH4 emissions separately in addition tothe TVOC measurement, it allowed the CH4/TVOC ratio to be
http://dx.doi.org/10.1016/j.biombioe.2017.10.047Received 24 August 2016; Received in revised form 14 September 2017; Accepted 30 October 2017
∗ Corresponding author. Laboratoire d’Etudes et de Recherches sur le MAtériau Bois, 27 rue Philippe Seguin, 88000 Epinal, France.E-mail address: [email protected] (B. Brandelet).
Biomass and Bioenergy 108 (2018) 15–24
0961-9534/ © 2017 Elsevier Ltd. All rights reserved.
MARK
measured. Moreover, so as to obtain a better understanding of themechanisms of formation of the particles, two microscopes were used.
In order to evaluate the impact of both ignitions modes on a real useof the studied stove, a simulation was also developed.
2. Materials and methods
2.1. Stove, combustible and experimental procedures
The WABI (D2I INVICTA, DONCHERY, FRANCE) firewood stovethat was designed, built and purchased in 2012 with a nominal thermalheat output of 6 kW was used. The combustion chamber was fitted withprimary and secondary air supplies and was insulated with vermiculite.The fuel was split beech (Fagus sylvatica) logs of 12 cm of diameter froma 40-year-old beech. The logs were chosen without any knots and bark.They were air-seasoned in greenhouses, and their moisture content wasstabilized in a regulated enclosed chamber. Then, the water massfraction was 0.12 (following the standard EN 14774). The wet base NetCalorific Value (NCVwb), measured following the standard EN 14918,was 16.7 MJ kg−1. The ash mass fraction of the dried material wasmeasured following the standard EN 14775 at 823.15 K and 1088.15 K.The results are: 2.7 g kg−1 at 823.15 K; 1.4 g kg-1 at 1088.15 K. Theelemental composition of the logs was also measured. In order to obtaina representative result, a complete log was ground up. The sawdust wasthen mixed, and three samples of 1 g each were analysed. The resultswere equivalent for each of the three analyses, and are: 495 g kg−1 of C;59 g kg−1 of H; 438 g kg−1 of O;< 3 g kg−1 of N; 108 mg kg−1 of S;64 mg kg−1 of Cl.
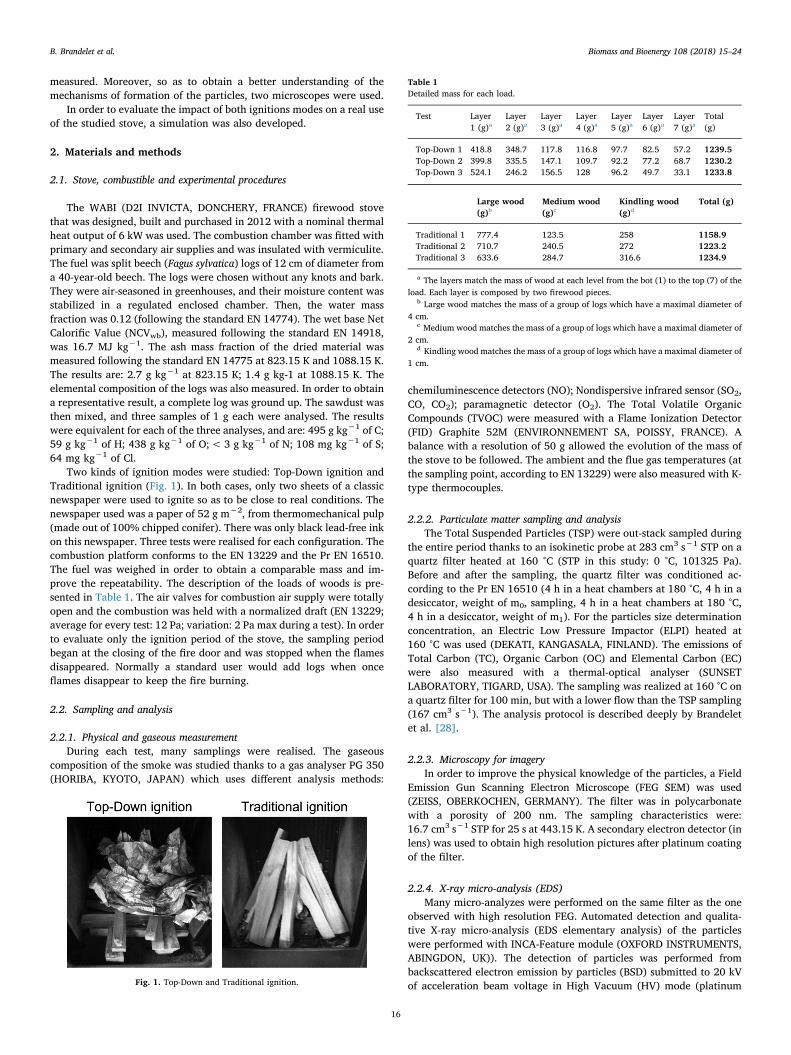
Two kinds of ignition modes were studied: Top-Down ignition andTraditional ignition (Fig. 1). In both cases, only two sheets of a classicnewspaper were used to ignite so as to be close to real conditions. Thenewspaper used was a paper of 52 g m−2, from thermomechanical pulp(made out of 100% chipped conifer). There was only black lead-free inkon this newspaper. Three tests were realised for each configuration. Thecombustion platform conforms to the EN 13229 and the Pr EN 16510.The fuel was weighed in order to obtain a comparable mass and im-prove the repeatability. The description of the loads of woods is pre-sented in Table 1. The air valves for combustion air supply were totallyopen and the combustion was held with a normalized draft (EN 13229;average for every test: 12 Pa; variation: 2 Pa max during a test). In orderto evaluate only the ignition period of the stove, the sampling periodbegan at the closing of the fire door and was stopped when the flamesdisappeared. Normally a standard user would add logs when onceflames disappear to keep the fire burning.
2.2. Sampling and analysis
2.2.1. Physical and gaseous measurementDuring each test, many samplings were realised. The gaseous
composition of the smoke was studied thanks to a gas analyser PG 350(HORIBA, KYOTO, JAPAN) which uses different analysis methods:
chemiluminescence detectors (NO); Nondispersive infrared sensor (SO2,CO, CO2); paramagnetic detector (O2). The Total Volatile OrganicCompounds (TVOC) were measured with a Flame Ionization Detector(FID) Graphite 52M (ENVIRONNEMENT SA, POISSY, FRANCE). Abalance with a resolution of 50 g allowed the evolution of the mass ofthe stove to be followed. The ambient and the flue gas temperatures (atthe sampling point, according to EN 13229) were also measured with K-type thermocouples.
2.2.2. Particulate matter sampling and analysisThe Total Suspended Particles (TSP) were out-stack sampled during
the entire period thanks to an isokinetic probe at 283 cm3 s−1 STP on aquartz filter heated at 160 °C (STP in this study: 0 °C, 101325 Pa).Before and after the sampling, the quartz filter was conditioned ac-cording to the Pr EN 16510 (4 h in a heat chambers at 180 °C, 4 h in adesiccator, weight of m0, sampling, 4 h in a heat chambers at 180 °C,4 h in a desiccator, weight of m1). For the particles size determinationconcentration, an Electric Low Pressure Impactor (ELPI) heated at160 °C was used (DEKATI, KANGASALA, FINLAND). The emissions ofTotal Carbon (TC), Organic Carbon (OC) and Elemental Carbon (EC)were also measured with a thermal-optical analyser (SUNSETLABORATORY, TIGARD, USA). The sampling was realized at 160 °C ona quartz filter for 100 min, but with a lower flow than the TSP sampling(167 cm3 s−1). The analysis protocol is described deeply by Brandeletet al. [28].
2.2.3. Microscopy for imageryIn order to improve the physical knowledge of the particles, a Field
Emission Gun Scanning Electron Microscope (FEG SEM) was used(ZEISS, OBERKOCHEN, GERMANY). The filter was in polycarbonatewith a porosity of 200 nm. The sampling characteristics were:16.7 cm3 s−1 STP for 25 s at 443.15 K. A secondary electron detector (inlens) was used to obtain high resolution pictures after platinum coatingof the filter.
2.2.4. X-ray micro-analysis (EDS)Many micro-analyzes were performed on the same filter as the one
observed with high resolution FEG. Automated detection and qualita-tive X-ray micro-analysis (EDS elementary analysis) of the particleswere performed with INCA-Feature module (OXFORD INSTRUMENTS,ABINGDON, UK)). The detection of particles was performed frombackscattered electron emission by particles (BSD) submitted to 20 kVof acceleration beam voltage in High Vacuum (HV) mode (platinumFig. 1. Top-Down and Traditional ignition.
Table 1Detailed mass for each load.
Test Layer1 (g)a
Layer2 (g)a
Layer3 (g)a
Layer4 (g)a
Layer5 (g)a
Layer6 (g)a
Layer7 (g)a
Total(g)
Top-Down 1 418.8 348.7 117.8 116.8 97.7 82.5 57.2 1239.5Top-Down 2 399.8 335.5 147.1 109.7 92.2 77.2 68.7 1230.2Top-Down 3 524.1 246.2 156.5 128 96.2 49.7 33.1 1233.8
Large wood(g)b
Medium wood(g)c
Kindling wood(g)d
Total (g)
Traditional 1 777.4 123.5 258 1158.9Traditional 2 710.7 240.5 272 1223.2Traditional 3 633.6 284.7 316.6 1234.9
a The layers match the mass of wood at each level from the bot (1) to the top (7) of theload. Each layer is composed by two firewood pieces.
b Large wood matches the mass of a group of logs which have a maximal diameter of4 cm.
c Medium wood matches the mass of a group of logs which have a maximal diameter of2 cm.
d Kindling wood matches the mass of a group of logs which have a maximal diameter of1 cm.
B. Brandelet et al. Biomass and Bioenergy 108 (2018) 15–24
16
coating). 2000 particles were automatically analysed per filter in orderto improve the robustness of the results. To avoid spatial segregations,these particles were analysed in two groups geometrically separated onthe filter.
2.3. Simulation
In order to evaluate the impact of the Top-Down ignition on aheating period, a “conventional life rhythm” was defined. It consists oftwo heating periods with the objective of checking if the ignition modecould change substantially the emissions of any heating period, in-cluding ignition. The first one corresponded to the use of the stoveduring weekday evenings: the users ignited the stove at 18:00 andstopped heating at 23:00. The second period simulated a weekend witha heating period between 09:00 to 21:00. For these two periods, thefirst half hour corresponded to the ignition. These heating period, va-lidated by the environment and energy French agency (ADEME), is theone described by the CEREN [29] in 2009 and confirmed by Autretet al. [30] in 2010.
The actual duration for lighting the stove was 26.7 min and26.5 min for Top-Down and Traditional ignition, respectively. Thescenario was calculated with the emissions factors of the steady stateand of both ignition modes. The emissions factors of the Traditional andTop-Down ignition modes were determined by six experiments detailedin this study. The emissions factors of the steady state were measuredby five additional experiments. For the additional experiments, the airvalves for combustion air supply were reduced by 2 in order to followthe settings of the manufacturer.
3. Results and discussions
3.1. Impacts on gaseous emissions
The Top-Down ignition mode had a high impact on the gaseousemissions. Table 2 presents the results. The O2 volume fraction of drygas was around 0.12 and 0.105 for Top-Down and Traditional ignitionmode, respectively: indeed, the Traditional ignition mode led to apartial obstruction of the primary air and the loss of mass was moreimportant at the beginning of the combustion. This phenomenon is dueto the flame radiation which is more important in the case of Tradi-tional ignition and more progressive in the case of Top-Down ignition.
The duration of ignition looks similar whatever the ignition mode.Then, the duration of ignition, whatever the mode, was estimated at
1800 s (30 min) for the simulation.
3.2. Impacts on particles emissions
Concerning the particles emissions, the Top-Down ignition modewas also more efficient (Table 3). Indeed, the TSP emissions were re-duced in mass by 32%. Miljevic et al. [26] found a decrease comprisedbetween factors 2 to 5. The decrease is then larger for gaseous emissionsthan for PM. Nevertheless, thanks to the particle size distributionmeasurement, it appears that, in both cases, the particles with an aero-diameter higher than 1 μm were a minor fraction (content< 0.001).For the Top-Down ignition, the contents in PM0.1 and PM0.1-1 were 80%and 20% in number respectively. In the case of Traditional ignition, thecontents were about 70% and 30% in number, respectively. In any case,these results are consistent with the work of Johansson et al. [19] whichdescribed the submicronic fraction as the most important. Moreover,Pettersson et al. [31] or Bäfver et al. [32] found the same order ofparticle size determination.
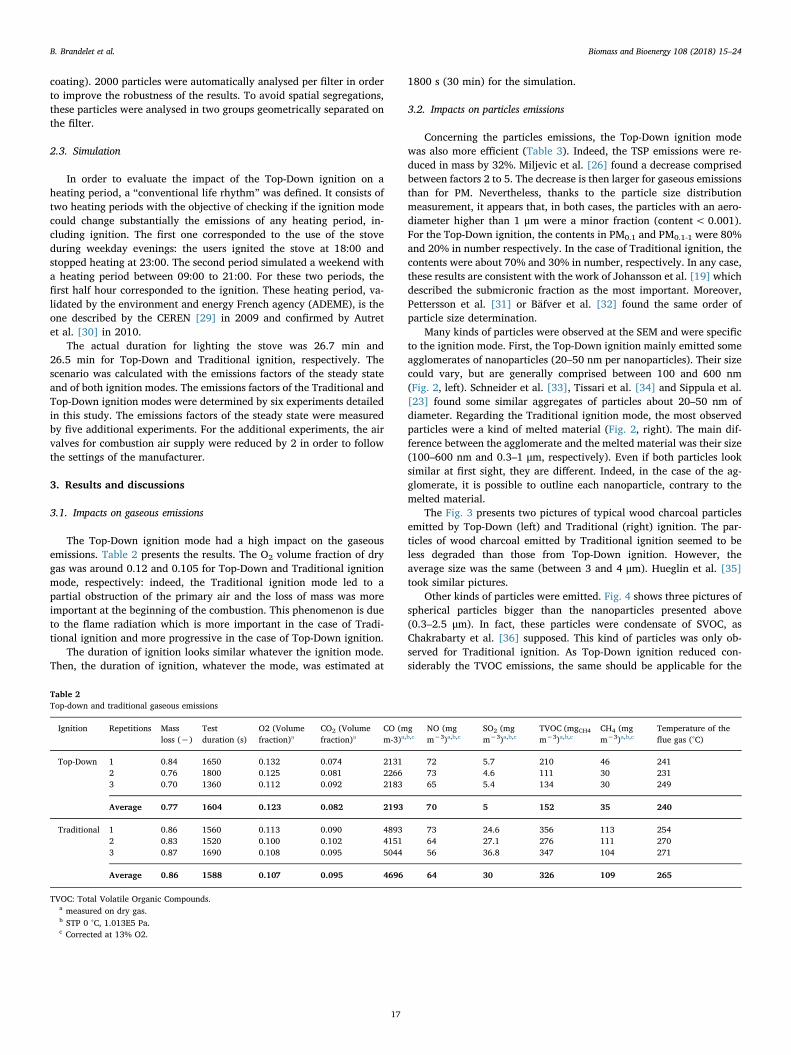
Many kinds of particles were observed at the SEM and were specificto the ignition mode. First, the Top-Down ignition mainly emitted someagglomerates of nanoparticles (20–50 nm per nanoparticles). Their sizecould vary, but are generally comprised between 100 and 600 nm(Fig. 2, left). Schneider et al. [33], Tissari et al. [34] and Sippula et al.[23] found some similar aggregates of particles about 20–50 nm ofdiameter. Regarding the Traditional ignition mode, the most observedparticles were a kind of melted material (Fig. 2, right). The main dif-ference between the agglomerate and the melted material was their size(100–600 nm and 0.3–1 μm, respectively). Even if both particles looksimilar at first sight, they are different. Indeed, in the case of the ag-glomerate, it is possible to outline each nanoparticle, contrary to themelted material.
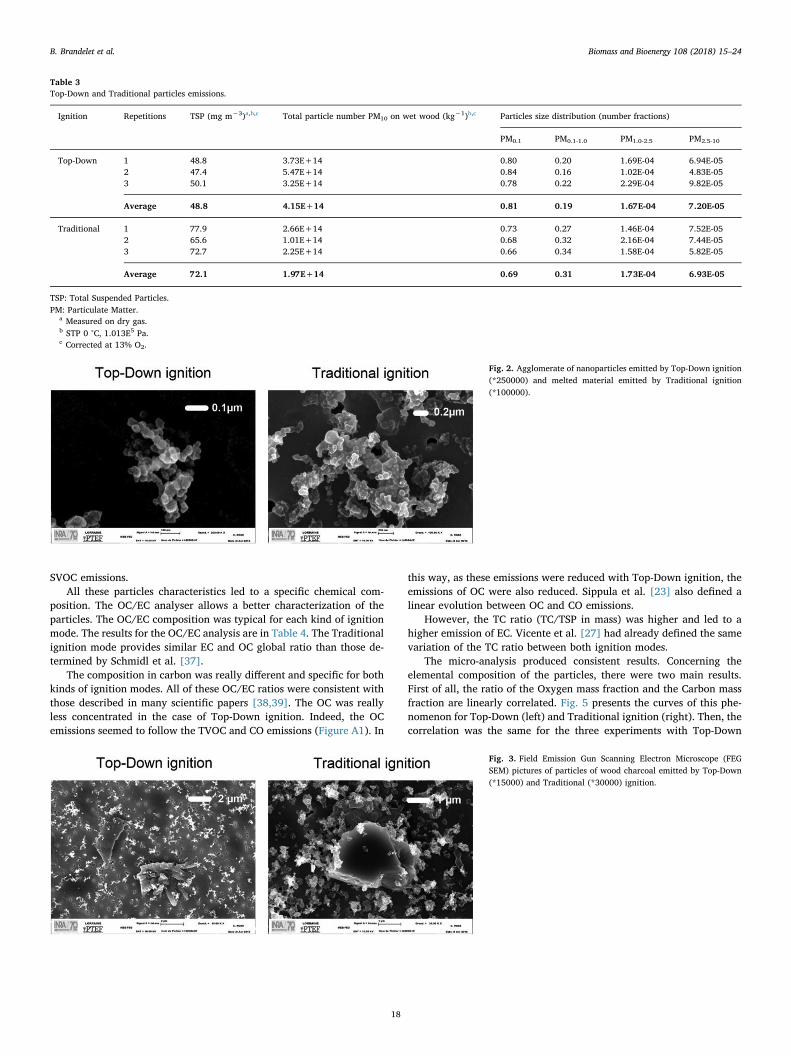
The Fig. 3 presents two pictures of typical wood charcoal particlesemitted by Top-Down (left) and Traditional (right) ignition. The par-ticles of wood charcoal emitted by Traditional ignition seemed to beless degraded than those from Top-Down ignition. However, theaverage size was the same (between 3 and 4 μm). Hueglin et al. [35]took similar pictures.
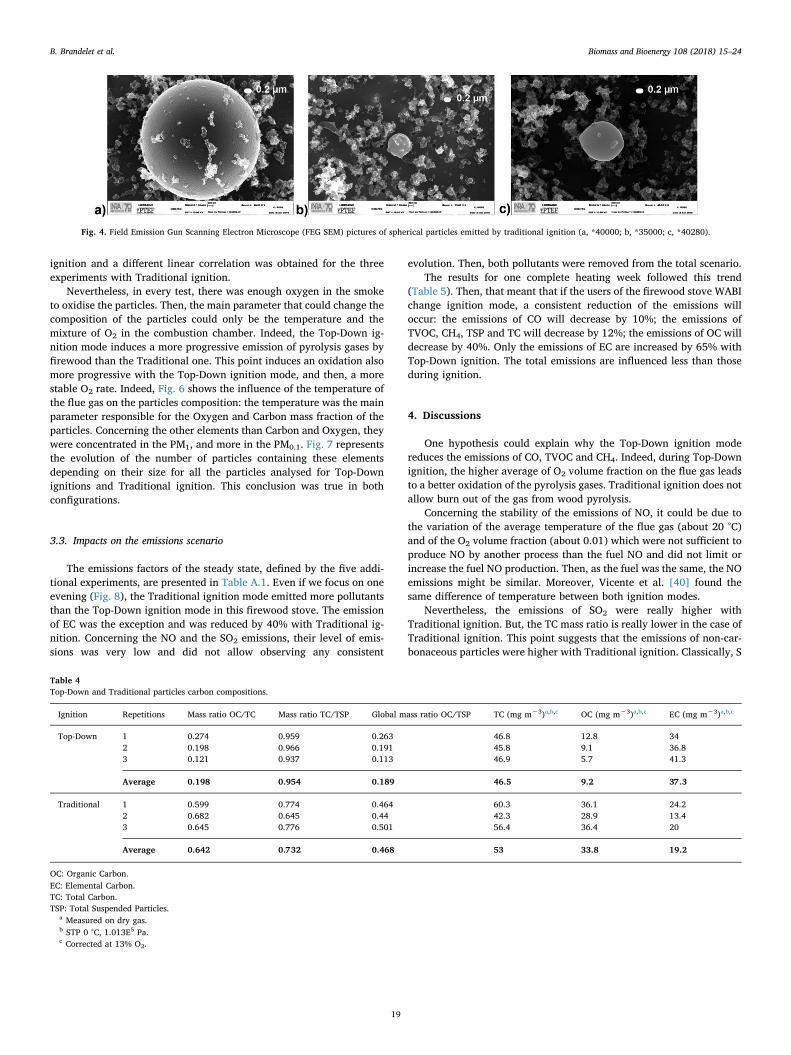
Other kinds of particles were emitted. Fig. 4 shows three pictures ofspherical particles bigger than the nanoparticles presented above(0.3–2.5 μm). In fact, these particles were condensate of SVOC, asChakrabarty et al. [36] supposed. This kind of particles was only ob-served for Traditional ignition. As Top-Down ignition reduced con-siderably the TVOC emissions, the same should be applicable for the
Table 2Top-down and traditional gaseous emissions
Ignition Repetitions Massloss (−)
Testduration (s)
O2 (Volumefraction)a
CO2 (Volumefraction)a
CO (mgm-3)a,b,c
NO (mgm−3)a,b,c
SO2 (mgm−3)a,b,c
TVOC (mgCH4m−3)a,b,c
CH4 (mgm−3)a,b,c
Temperature of theflue gas (°C)
Top-Down 1 0.84 1650 0.132 0.074 2131 72 5.7 210 46 2412 0.76 1800 0.125 0.081 2266 73 4.6 111 30 2313 0.70 1360 0.112 0.092 2183 65 5.4 134 30 249
Average 0.77 1604 0.123 0.082 2193 70 5 152 35 240
Traditional 1 0.86 1560 0.113 0.090 4893 73 24.6 356 113 2542 0.83 1520 0.100 0.102 4151 64 27.1 276 111 2703 0.87 1690 0.108 0.095 5044 56 36.8 347 104 271
Average 0.86 1588 0.107 0.095 4696 64 30 326 109 265
TVOC: Total Volatile Organic Compounds.a measured on dry gas.b STP 0 °C, 1.013E5 Pa.c Corrected at 13% O2.
B. Brandelet et al. Biomass and Bioenergy 108 (2018) 15–24
17
SVOC emissions.All these particles characteristics led to a specific chemical com-
position. The OC/EC analyser allows a better characterization of theparticles. The OC/EC composition was typical for each kind of ignitionmode. The results for the OC/EC analysis are in Table 4. The Traditionalignition mode provides similar EC and OC global ratio than those de-termined by Schmidl et al. [37].
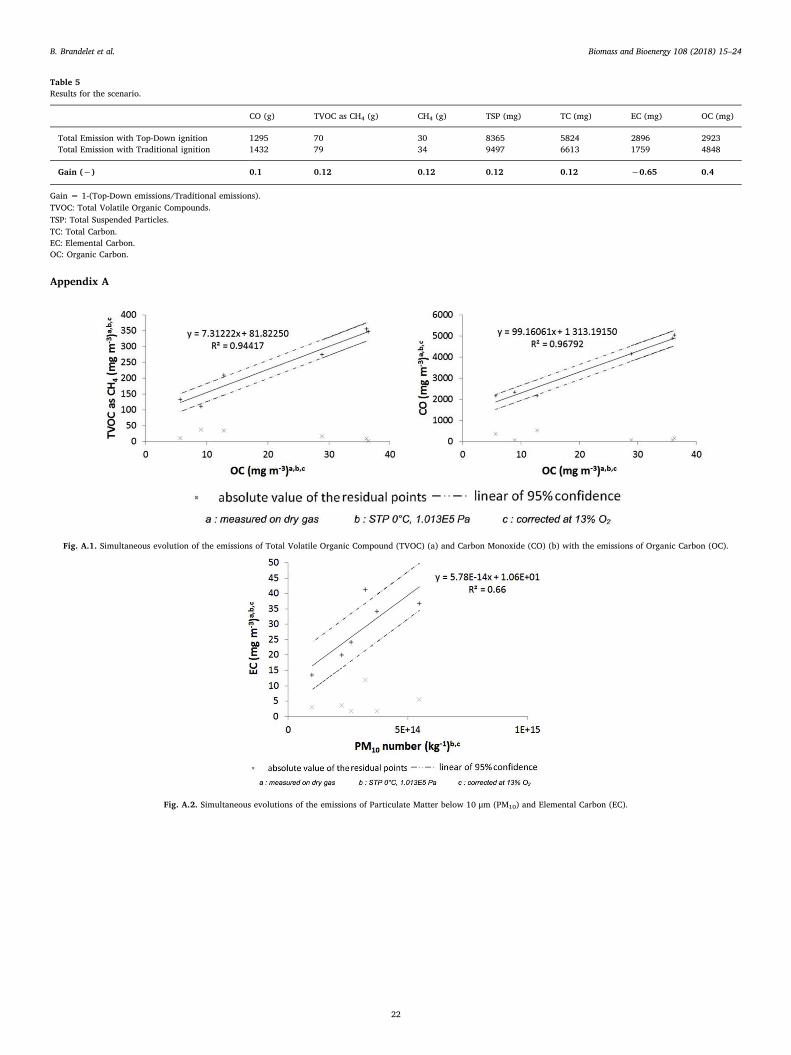
The composition in carbon was really different and specific for bothkinds of ignition modes. All of these OC/EC ratios were consistent withthose described in many scientific papers [38,39]. The OC was reallyless concentrated in the case of Top-Down ignition. Indeed, the OCemissions seemed to follow the TVOC and CO emissions (Figure A1). In
this way, as these emissions were reduced with Top-Down ignition, theemissions of OC were also reduced. Sippula et al. [23] also defined alinear evolution between OC and CO emissions.
However, the TC ratio (TC/TSP in mass) was higher and led to ahigher emission of EC. Vicente et al. [27] had already defined the samevariation of the TC ratio between both ignition modes.
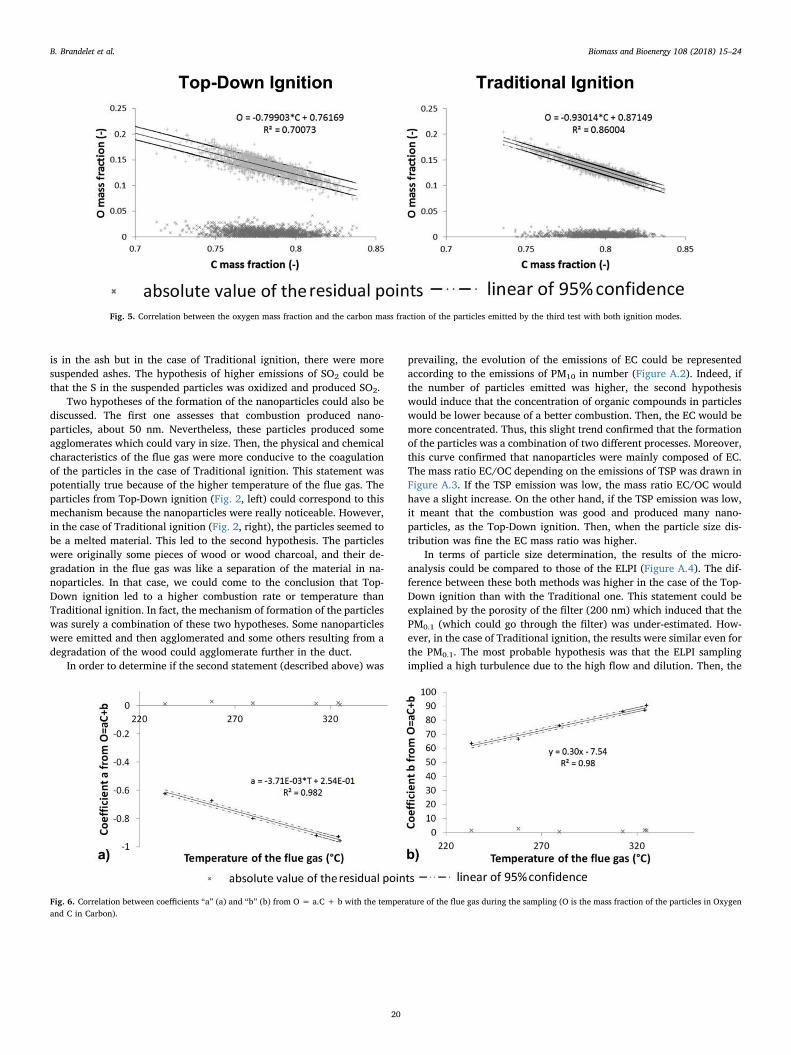
The micro-analysis produced consistent results. Concerning theelemental composition of the particles, there were two main results.First of all, the ratio of the Oxygen mass fraction and the Carbon massfraction are linearly correlated. Fig. 5 presents the curves of this phe-nomenon for Top-Down (left) and Traditional ignition (right). Then, thecorrelation was the same for the three experiments with Top-Down
Table 3Top-Down and Traditional particles emissions.
Ignition Repetitions TSP (mg m−3)a,b,c Total particle number PM10 on wet wood (kg−1)b,c Particles size distribution (number fractions)
PM0.1 PM0.1-1.0 PM1.0-2.5 PM2.5-10
Top-Down 1 48.8 3.73E+14 0.80 0.20 1.69E-04 6.94E-052 47.4 5.47E+14 0.84 0.16 1.02E-04 4.83E-053 50.1 3.25E+14 0.78 0.22 2.29E-04 9.82E-05
Average 48.8 4.15E+14 0.81 0.19 1.67E-04 7.20E-05
Traditional 1 77.9 2.66E+14 0.73 0.27 1.46E-04 7.52E-052 65.6 1.01E+14 0.68 0.32 2.16E-04 7.44E-053 72.7 2.25E+14 0.66 0.34 1.58E-04 5.82E-05
Average 72.1 1.97E+14 0.69 0.31 1.73E-04 6.93E-05
TSP: Total Suspended Particles.PM: Particulate Matter.
a Measured on dry gas.b STP 0 °C, 1.013E5 Pa.c Corrected at 13% O2.
Fig. 2. Agglomerate of nanoparticles emitted by Top-Down ignition(*250000) and melted material emitted by Traditional ignition(*100000).
Fig. 3. Field Emission Gun Scanning Electron Microscope (FEGSEM) pictures of particles of wood charcoal emitted by Top-Down(*15000) and Traditional (*30000) ignition.
B. Brandelet et al. Biomass and Bioenergy 108 (2018) 15–24
18
ignition and a different linear correlation was obtained for the threeexperiments with Traditional ignition.
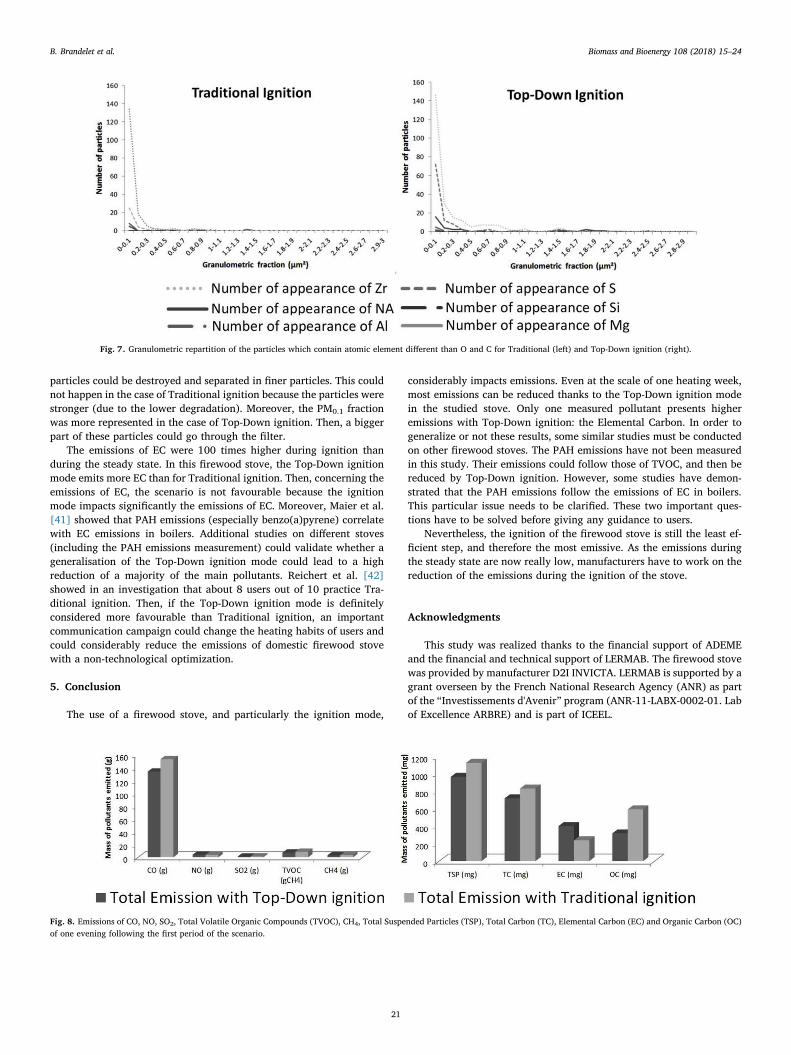
Nevertheless, in every test, there was enough oxygen in the smoketo oxidise the particles. Then, the main parameter that could change thecomposition of the particles could only be the temperature and themixture of O2 in the combustion chamber. Indeed, the Top-Down ig-nition mode induces a more progressive emission of pyrolysis gases byfirewood than the Traditional one. This point induces an oxidation alsomore progressive with the Top-Down ignition mode, and then, a morestable O2 rate. Indeed, Fig. 6 shows the influence of the temperature ofthe flue gas on the particles composition: the temperature was the mainparameter responsible for the Oxygen and Carbon mass fraction of theparticles. Concerning the other elements than Carbon and Oxygen, theywere concentrated in the PM1, and more in the PM0.1. Fig. 7 representsthe evolution of the number of particles containing these elementsdepending on their size for all the particles analysed for Top-Downignitions and Traditional ignition. This conclusion was true in bothconfigurations.
3.3. Impacts on the emissions scenario
The emissions factors of the steady state, defined by the five addi-tional experiments, are presented in Table A.1. Even if we focus on oneevening (Fig. 8), the Traditional ignition mode emitted more pollutantsthan the Top-Down ignition mode in this firewood stove. The emissionof EC was the exception and was reduced by 40% with Traditional ig-nition. Concerning the NO and the SO2 emissions, their level of emis-sions was very low and did not allow observing any consistent
evolution. Then, both pollutants were removed from the total scenario.The results for one complete heating week followed this trend
(Table 5). Then, that meant that if the users of the firewood stove WABIchange ignition mode, a consistent reduction of the emissions willoccur: the emissions of CO will decrease by 10%; the emissions ofTVOC, CH4, TSP and TC will decrease by 12%; the emissions of OC willdecrease by 40%. Only the emissions of EC are increased by 65% withTop-Down ignition. The total emissions are influenced less than thoseduring ignition.
4. Discussions
One hypothesis could explain why the Top-Down ignition modereduces the emissions of CO, TVOC and CH4. Indeed, during Top-Downignition, the higher average of O2 volume fraction on the flue gas leadsto a better oxidation of the pyrolysis gases. Traditional ignition does notallow burn out of the gas from wood pyrolysis.
Concerning the stability of the emissions of NO, it could be due tothe variation of the average temperature of the flue gas (about 20 °C)and of the O2 volume fraction (about 0.01) which were not sufficient toproduce NO by another process than the fuel NO and did not limit orincrease the fuel NO production. Then, as the fuel was the same, the NOemissions might be similar. Moreover, Vicente et al. [40] found thesame difference of temperature between both ignition modes.
Nevertheless, the emissions of SO2 were really higher withTraditional ignition. But, the TC mass ratio is really lower in the case ofTraditional ignition. This point suggests that the emissions of non-car-bonaceous particles were higher with Traditional ignition. Classically, S
Fig. 4. Field Emission Gun Scanning Electron Microscope (FEG SEM) pictures of spherical particles emitted by traditional ignition (a, *40000; b, *35000; c, *40280).
Table 4Top-Down and Traditional particles carbon compositions.
Ignition Repetitions Mass ratio OC/TC Mass ratio TC/TSP Global mass ratio OC/TSP TC (mg m−3)a,b,c OC (mg m−3)a,b,c EC (mg m−3)a,b,c
Top-Down 1 0.274 0.959 0.263 46.8 12.8 342 0.198 0.966 0.191 45.8 9.1 36.83 0.121 0.937 0.113 46.9 5.7 41.3
Average 0.198 0.954 0.189 46.5 9.2 37.3
Traditional 1 0.599 0.774 0.464 60.3 36.1 24.22 0.682 0.645 0.44 42.3 28.9 13.43 0.645 0.776 0.501 56.4 36.4 20
Average 0.642 0.732 0.468 53 33.8 19.2
OC: Organic Carbon.EC: Elemental Carbon.TC: Total Carbon.TSP: Total Suspended Particles.
a Measured on dry gas.b STP 0 °C, 1.013E5 Pa.c Corrected at 13% O2.
B. Brandelet et al. Biomass and Bioenergy 108 (2018) 15–24
19
is in the ash but in the case of Traditional ignition, there were moresuspended ashes. The hypothesis of higher emissions of SO2 could bethat the S in the suspended particles was oxidized and produced SO2.
Two hypotheses of the formation of the nanoparticles could also bediscussed. The first one assesses that combustion produced nano-particles, about 50 nm. Nevertheless, these particles produced someagglomerates which could vary in size. Then, the physical and chemicalcharacteristics of the flue gas were more conducive to the coagulationof the particles in the case of Traditional ignition. This statement waspotentially true because of the higher temperature of the flue gas. Theparticles from Top-Down ignition (Fig. 2, left) could correspond to thismechanism because the nanoparticles were really noticeable. However,in the case of Traditional ignition (Fig. 2, right), the particles seemed tobe a melted material. This led to the second hypothesis. The particleswere originally some pieces of wood or wood charcoal, and their de-gradation in the flue gas was like a separation of the material in na-noparticles. In that case, we could come to the conclusion that Top-Down ignition led to a higher combustion rate or temperature thanTraditional ignition. In fact, the mechanism of formation of the particleswas surely a combination of these two hypotheses. Some nanoparticleswere emitted and then agglomerated and some others resulting from adegradation of the wood could agglomerate further in the duct.
In order to determine if the second statement (described above) was
prevailing, the evolution of the emissions of EC could be representedaccording to the emissions of PM10 in number (Figure A.2). Indeed, ifthe number of particles emitted was higher, the second hypothesiswould induce that the concentration of organic compounds in particleswould be lower because of a better combustion. Then, the EC would bemore concentrated. Thus, this slight trend confirmed that the formationof the particles was a combination of two different processes. Moreover,this curve confirmed that nanoparticles were mainly composed of EC.The mass ratio EC/OC depending on the emissions of TSP was drawn inFigure A.3. If the TSP emission was low, the mass ratio EC/OC wouldhave a slight increase. On the other hand, if the TSP emission was low,it meant that the combustion was good and produced many nano-particles, as the Top-Down ignition. Then, when the particle size dis-tribution was fine the EC mass ratio was higher.
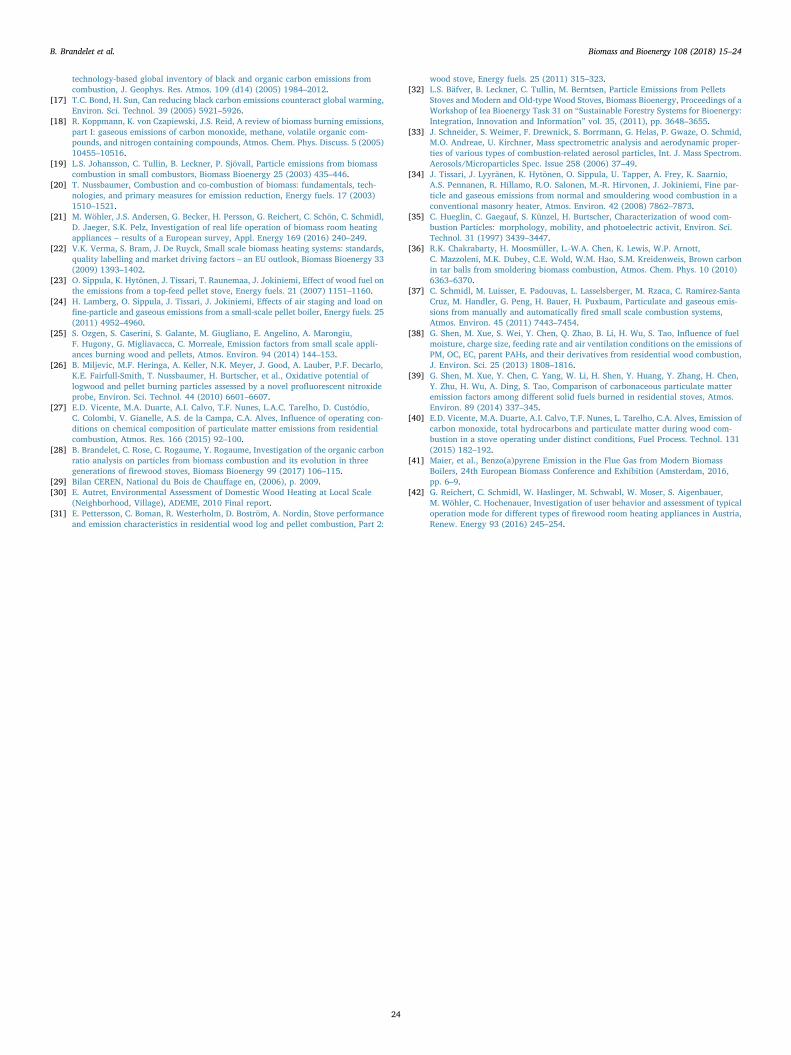
In terms of particle size determination, the results of the micro-analysis could be compared to those of the ELPI (Figure A.4). The dif-ference between these both methods was higher in the case of the Top-Down ignition than with the Traditional one. This statement could beexplained by the porosity of the filter (200 nm) which induced that thePM0.1 (which could go through the filter) was under-estimated. How-ever, in the case of Traditional ignition, the results were similar even forthe PM0.1. The most probable hypothesis was that the ELPI samplingimplied a high turbulence due to the high flow and dilution. Then, the
Fig. 5. Correlation between the oxygen mass fraction and the carbon mass fraction of the particles emitted by the third test with both ignition modes.
Fig. 6. Correlation between coefficients “a” (a) and “b” (b) from O = a.C + b with the temperature of the flue gas during the sampling (O is the mass fraction of the particles in Oxygenand C in Carbon).
B. Brandelet et al. Biomass and Bioenergy 108 (2018) 15–24
20
particles could be destroyed and separated in finer particles. This couldnot happen in the case of Traditional ignition because the particles werestronger (due to the lower degradation). Moreover, the PM0.1 fractionwas more represented in the case of Top-Down ignition. Then, a biggerpart of these particles could go through the filter.
The emissions of EC were 100 times higher during ignition thanduring the steady state. In this firewood stove, the Top-Down ignitionmode emits more EC than for Traditional ignition. Then, concerning theemissions of EC, the scenario is not favourable because the ignitionmode impacts significantly the emissions of EC. Moreover, Maier et al.[41] showed that PAH emissions (especially benzo(a)pyrene) correlatewith EC emissions in boilers. Additional studies on different stoves(including the PAH emissions measurement) could validate whether ageneralisation of the Top-Down ignition mode could lead to a highreduction of a majority of the main pollutants. Reichert et al. [42]showed in an investigation that about 8 users out of 10 practice Tra-ditional ignition. Then, if the Top-Down ignition mode is definitelyconsidered more favourable than Traditional ignition, an importantcommunication campaign could change the heating habits of users andcould considerably reduce the emissions of domestic firewood stovewith a non-technological optimization.
5. Conclusion
The use of a firewood stove, and particularly the ignition mode,
considerably impacts emissions. Even at the scale of one heating week,most emissions can be reduced thanks to the Top-Down ignition modein the studied stove. Only one measured pollutant presents higheremissions with Top-Down ignition: the Elemental Carbon. In order togeneralize or not these results, some similar studies must be conductedon other firewood stoves. The PAH emissions have not been measuredin this study. Their emissions could follow those of TVOC, and then bereduced by Top-Down ignition. However, some studies have demon-strated that the PAH emissions follow the emissions of EC in boilers.This particular issue needs to be clarified. These two important ques-tions have to be solved before giving any guidance to users.
Nevertheless, the ignition of the firewood stove is still the least ef-ficient step, and therefore the most emissive. As the emissions duringthe steady state are now really low, manufacturers have to work on thereduction of the emissions during the ignition of the stove.
Acknowledgments
This study was realized thanks to the financial support of ADEMEand the financial and technical support of LERMAB. The firewood stovewas provided by manufacturer D2I INVICTA. LERMAB is supported by agrant overseen by the French National Research Agency (ANR) as partof the “Investissements d'Avenir” program (ANR-11-LABX-0002-01. Labof Excellence ARBRE) and is part of ICEEL.
Fig. 7. Granulometric repartition of the particles which contain atomic element different than O and C for Traditional (left) and Top-Down ignition (right).
Fig. 8. Emissions of CO, NO, SO2, Total Volatile Organic Compounds (TVOC), CH4, Total Suspended Particles (TSP), Total Carbon (TC), Elemental Carbon (EC) and Organic Carbon (OC)of one evening following the first period of the scenario.
B. Brandelet et al. Biomass and Bioenergy 108 (2018) 15–24
21
Appendix A
Fig. A.1. Simultaneous evolution of the emissions of Total Volatile Organic Compound (TVOC) (a) and Carbon Monoxide (CO) (b) with the emissions of Organic Carbon (OC).
Fig. A.2. Simultaneous evolutions of the emissions of Particulate Matter below 10 μm (PM10) and Elemental Carbon (EC).
Table 5Results for the scenario.
CO (g) TVOC as CH4 (g) CH4 (g) TSP (mg) TC (mg) EC (mg) OC (mg)
Total Emission with Top-Down ignition 1295 70 30 8365 5824 2896 2923Total Emission with Traditional ignition 1432 79 34 9497 6613 1759 4848
Gain (−) 0.1 0.12 0.12 0.12 0.12 −0.65 0.4
Gain = 1-(Top-Down emissions/Traditional emissions).TVOC: Total Volatile Organic Compounds.TSP: Total Suspended Particles.TC: Total Carbon.EC: Elemental Carbon.OC: Organic Carbon.
B. Brandelet et al. Biomass and Bioenergy 108 (2018) 15–24
22
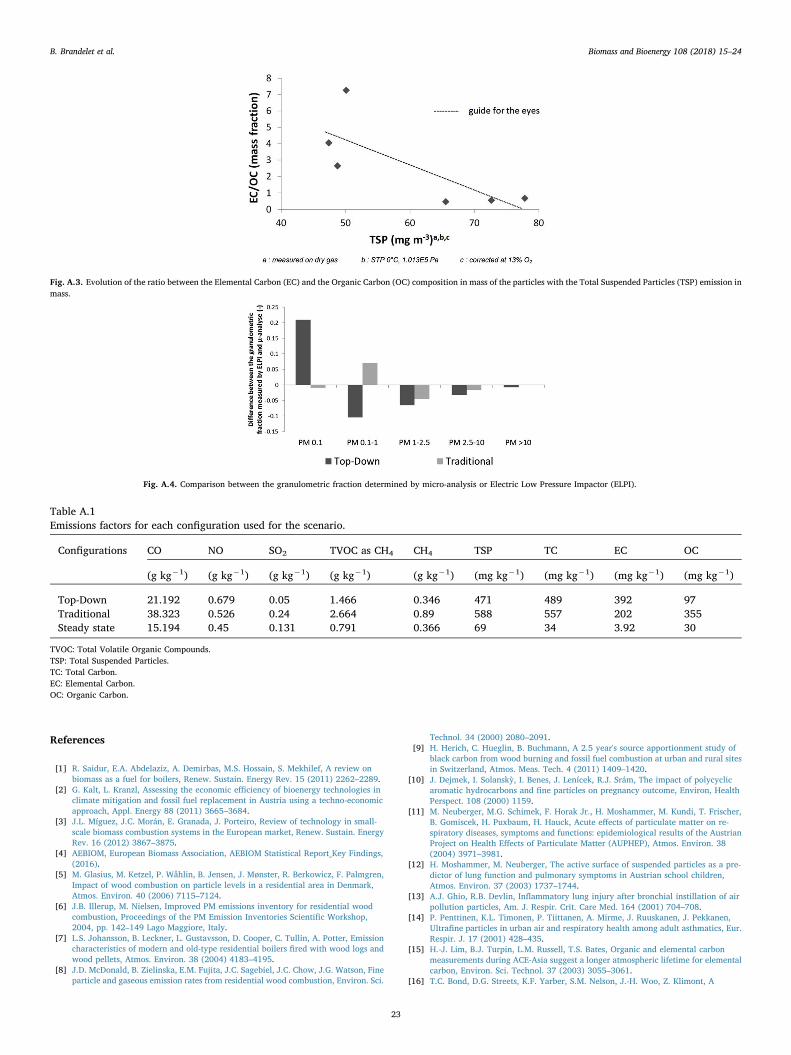
Fig. A.3. Evolution of the ratio between the Elemental Carbon (EC) and the Organic Carbon (OC) composition in mass of the particles with the Total Suspended Particles (TSP) emission inmass.
Fig. A.4. Comparison between the granulometric fraction determined by micro-analysis or Electric Low Pressure Impactor (ELPI).
Table A.1Emissions factors for each configuration used for the scenario.
Configurations CO NO SO2 TVOC as CH4 CH4 TSP TC EC OC
(g kg−1) (g kg−1) (g kg−1) (g kg−1) (g kg−1) (mg kg−1) (mg kg−1) (mg kg−1) (mg kg−1)
Top-Down 21.192 0.679 0.05 1.466 0.346 471 489 392 97Traditional 38.323 0.526 0.24 2.664 0.89 588 557 202 355Steady state 15.194 0.45 0.131 0.791 0.366 69 34 3.92 30
TVOC: Total Volatile Organic Compounds.TSP: Total Suspended Particles.TC: Total Carbon.EC: Elemental Carbon.OC: Organic Carbon.
References
[1] R. Saidur, E.A. Abdelaziz, A. Demirbas, M.S. Hossain, S. Mekhilef, A review onbiomass as a fuel for boilers, Renew. Sustain. Energy Rev. 15 (2011) 2262–2289.
[2] G. Kalt, L. Kranzl, Assessing the economic efficiency of bioenergy technologies inclimate mitigation and fossil fuel replacement in Austria using a techno-economicapproach, Appl. Energy 88 (2011) 3665–3684.
[3] J.L. Míguez, J.C. Morán, E. Granada, J. Porteiro, Review of technology in small-scale biomass combustion systems in the European market, Renew. Sustain. EnergyRev. 16 (2012) 3867–3875.
[4] AEBIOM, European Biomass Association, AEBIOM Statistical Report_Key Findings,(2016).
[5] M. Glasius, M. Ketzel, P. Wåhlin, B. Jensen, J. Mønster, R. Berkowicz, F. Palmgren,Impact of wood combustion on particle levels in a residential area in Denmark,Atmos. Environ. 40 (2006) 7115–7124.
[6] J.B. Illerup, M. Nielsen, Improved PM emissions inventory for residential woodcombustion, Proceedings of the PM Emission Inventories Scientific Workshop,2004, pp. 142–149 Lago Maggiore, Italy.
[7] L.S. Johansson, B. Leckner, L. Gustavsson, D. Cooper, C. Tullin, A. Potter, Emissioncharacteristics of modern and old-type residential boilers fired with wood logs andwood pellets, Atmos. Environ. 38 (2004) 4183–4195.
[8] J.D. McDonald, B. Zielinska, E.M. Fujita, J.C. Sagebiel, J.C. Chow, J.G. Watson, Fineparticle and gaseous emission rates from residential wood combustion, Environ. Sci.
Technol. 34 (2000) 2080–2091.[9] H. Herich, C. Hueglin, B. Buchmann, A 2.5 year's source apportionment study of
black carbon from wood burning and fossil fuel combustion at urban and rural sitesin Switzerland, Atmos. Meas. Tech. 4 (2011) 1409–1420.
[10] J. Dejmek, I. Solanskỳ, I. Benes, J. Lenícek, R.J. Srám, The impact of polycyclicaromatic hydrocarbons and fine particles on pregnancy outcome, Environ, HealthPerspect. 108 (2000) 1159.
[11] M. Neuberger, M.G. Schimek, F. Horak Jr., H. Moshammer, M. Kundi, T. Frischer,B. Gomiscek, H. Puxbaum, H. Hauck, Acute effects of particulate matter on re-spiratory diseases, symptoms and functions: epidemiological results of the AustrianProject on Health Effects of Particulate Matter (AUPHEP), Atmos. Environ. 38(2004) 3971–3981.
[12] H. Moshammer, M. Neuberger, The active surface of suspended particles as a pre-dictor of lung function and pulmonary symptoms in Austrian school children,Atmos. Environ. 37 (2003) 1737–1744.
[13] A.J. Ghio, R.B. Devlin, Inflammatory lung injury after bronchial instillation of airpollution particles, Am. J. Respir. Crit. Care Med. 164 (2001) 704–708.
[14] P. Penttinen, K.L. Timonen, P. Tiittanen, A. Mirme, J. Ruuskanen, J. Pekkanen,Ultrafine particles in urban air and respiratory health among adult asthmatics, Eur.Respir. J. 17 (2001) 428–435.
[15] H.-J. Lim, B.J. Turpin, L.M. Russell, T.S. Bates, Organic and elemental carbonmeasurements during ACE-Asia suggest a longer atmospheric lifetime for elementalcarbon, Environ. Sci. Technol. 37 (2003) 3055–3061.
[16] T.C. Bond, D.G. Streets, K.F. Yarber, S.M. Nelson, J.-H. Woo, Z. Klimont, A
B. Brandelet et al. Biomass and Bioenergy 108 (2018) 15–24
23
technology-based global inventory of black and organic carbon emissions fromcombustion, J. Geophys. Res. Atmos. 109 (d14) (2005) 1984–2012.
[17] T.C. Bond, H. Sun, Can reducing black carbon emissions counteract global warming,Environ. Sci. Technol. 39 (2005) 5921–5926.
[18] R. Koppmann, K. von Czapiewski, J.S. Reid, A review of biomass burning emissions,part I: gaseous emissions of carbon monoxide, methane, volatile organic com-pounds, and nitrogen containing compounds, Atmos. Chem. Phys. Discuss. 5 (2005)10455–10516.
[19] L.S. Johansson, C. Tullin, B. Leckner, P. Sjövall, Particle emissions from biomasscombustion in small combustors, Biomass Bioenergy 25 (2003) 435–446.
[20] T. Nussbaumer, Combustion and co-combustion of biomass: fundamentals, tech-nologies, and primary measures for emission reduction, Energy fuels. 17 (2003)1510–1521.
[21] M. Wöhler, J.S. Andersen, G. Becker, H. Persson, G. Reichert, C. Schön, C. Schmidl,D. Jaeger, S.K. Pelz, Investigation of real life operation of biomass room heatingappliances – results of a European survey, Appl. Energy 169 (2016) 240–249.
[22] V.K. Verma, S. Bram, J. De Ruyck, Small scale biomass heating systems: standards,quality labelling and market driving factors – an EU outlook, Biomass Bioenergy 33(2009) 1393–1402.
[23] O. Sippula, K. Hytönen, J. Tissari, T. Raunemaa, J. Jokiniemi, Effect of wood fuel onthe emissions from a top-feed pellet stove, Energy fuels. 21 (2007) 1151–1160.
[24] H. Lamberg, O. Sippula, J. Tissari, J. Jokiniemi, Effects of air staging and load onfine-particle and gaseous emissions from a small-scale pellet boiler, Energy fuels. 25(2011) 4952–4960.
[25] S. Ozgen, S. Caserini, S. Galante, M. Giugliano, E. Angelino, A. Marongiu,F. Hugony, G. Migliavacca, C. Morreale, Emission factors from small scale appli-ances burning wood and pellets, Atmos. Environ. 94 (2014) 144–153.
[26] B. Miljevic, M.F. Heringa, A. Keller, N.K. Meyer, J. Good, A. Lauber, P.F. Decarlo,K.E. Fairfull-Smith, T. Nussbaumer, H. Burtscher, et al., Oxidative potential oflogwood and pellet burning particles assessed by a novel profluorescent nitroxideprobe, Environ. Sci. Technol. 44 (2010) 6601–6607.
[27] E.D. Vicente, M.A. Duarte, A.I. Calvo, T.F. Nunes, L.A.C. Tarelho, D. Custódio,C. Colombi, V. Gianelle, A.S. de la Campa, C.A. Alves, Influence of operating con-ditions on chemical composition of particulate matter emissions from residentialcombustion, Atmos. Res. 166 (2015) 92–100.
[28] B. Brandelet, C. Rose, C. Rogaume, Y. Rogaume, Investigation of the organic carbonratio analysis on particles from biomass combustion and its evolution in threegenerations of firewood stoves, Biomass Bioenergy 99 (2017) 106–115.
[29] Bilan CEREN, National du Bois de Chauffage en, (2006), p. 2009.[30] E. Autret, Environmental Assessment of Domestic Wood Heating at Local Scale
(Neighborhood, Village), ADEME, 2010 Final report.[31] E. Pettersson, C. Boman, R. Westerholm, D. Boström, A. Nordin, Stove performance
and emission characteristics in residential wood log and pellet combustion, Part 2:
wood stove, Energy fuels. 25 (2011) 315–323.[32] L.S. Bäfver, B. Leckner, C. Tullin, M. Berntsen, Particle Emissions from Pellets
Stoves and Modern and Old-type Wood Stoves, Biomass Bioenergy, Proceedings of aWorkshop of Iea Bioenergy Task 31 on “Sustainable Forestry Systems for Bioenergy:Integration, Innovation and Information” vol. 35, (2011), pp. 3648–3655.
[33] J. Schneider, S. Weimer, F. Drewnick, S. Borrmann, G. Helas, P. Gwaze, O. Schmid,M.O. Andreae, U. Kirchner, Mass spectrometric analysis and aerodynamic proper-ties of various types of combustion-related aerosol particles, Int. J. Mass Spectrom.Aerosols/Microparticles Spec. Issue 258 (2006) 37–49.
[34] J. Tissari, J. Lyyränen, K. Hytönen, O. Sippula, U. Tapper, A. Frey, K. Saarnio,A.S. Pennanen, R. Hillamo, R.O. Salonen, M.-R. Hirvonen, J. Jokiniemi, Fine par-ticle and gaseous emissions from normal and smouldering wood combustion in aconventional masonry heater, Atmos. Environ. 42 (2008) 7862–7873.
[35] C. Hueglin, C. Gaegauf, S. Künzel, H. Burtscher, Characterization of wood com-bustion Particles: morphology, mobility, and photoelectric activit, Environ. Sci.Technol. 31 (1997) 3439–3447.
[36] R.K. Chakrabarty, H. Moosmüller, L.-W.A. Chen, K. Lewis, W.P. Arnott,C. Mazzoleni, M.K. Dubey, C.E. Wold, W.M. Hao, S.M. Kreidenweis, Brown carbonin tar balls from smoldering biomass combustion, Atmos. Chem. Phys. 10 (2010)6363–6370.
[37] C. Schmidl, M. Luisser, E. Padouvas, L. Lasselsberger, M. Rzaca, C. Ramirez-SantaCruz, M. Handler, G. Peng, H. Bauer, H. Puxbaum, Particulate and gaseous emis-sions from manually and automatically fired small scale combustion systems,Atmos. Environ. 45 (2011) 7443–7454.
[38] G. Shen, M. Xue, S. Wei, Y. Chen, Q. Zhao, B. Li, H. Wu, S. Tao, Influence of fuelmoisture, charge size, feeding rate and air ventilation conditions on the emissions ofPM, OC, EC, parent PAHs, and their derivatives from residential wood combustion,J. Environ. Sci. 25 (2013) 1808–1816.
[39] G. Shen, M. Xue, Y. Chen, C. Yang, W. Li, H. Shen, Y. Huang, Y. Zhang, H. Chen,Y. Zhu, H. Wu, A. Ding, S. Tao, Comparison of carbonaceous particulate matteremission factors among different solid fuels burned in residential stoves, Atmos.Environ. 89 (2014) 337–345.
[40] E.D. Vicente, M.A. Duarte, A.I. Calvo, T.F. Nunes, L. Tarelho, C.A. Alves, Emission ofcarbon monoxide, total hydrocarbons and particulate matter during wood com-bustion in a stove operating under distinct conditions, Fuel Process. Technol. 131(2015) 182–192.
[41] Maier, et al., Benzo(a)pyrene Emission in the Flue Gas from Modern BiomassBoilers, 24th European Biomass Conference and Exhibition (Amsterdam, 2016,pp. 6–9.
[42] G. Reichert, C. Schmidl, W. Haslinger, M. Schwabl, W. Moser, S. Aigenbauer,M. Wöhler, C. Hochenauer, Investigation of user behavior and assessment of typicaloperation mode for different types of firewood room heating appliances in Austria,Renew. Energy 93 (2016) 245–254.
B. Brandelet et al. Biomass and Bioenergy 108 (2018) 15–24
24