biology hl/sl ia guide - the!mad!scientist! hl/sl ia guide . by marwa bkerat – updated december...
TRANSCRIPT

By Marwa Bkerat – Updated December 2016 Page 1 of 47
Biology HL/SL
IA Guide
By Marwa Bkerat – Updated December 2016 Page 2 of 47
General Guidelines about the IA
Same requirements at SL and HL.
An individual piece of work: One scientific investigation that should cover a topic that is
commensurate with the level of the course of study.
10 hours, including:
Time for the teacher to explain to students the requirements of the IA
Class time for students to work on the IA and ask questions
Time for consultation between the teacher and student
Time to review and monitor progress, and to check authenticity.
20% of the final assessment
Assessed by the teacher and externally moderated by the IB.
Total mark out of 24
6-12 pages. Investigations exceeding this length will be penalized in the communication criterion
as lacking conciseness.
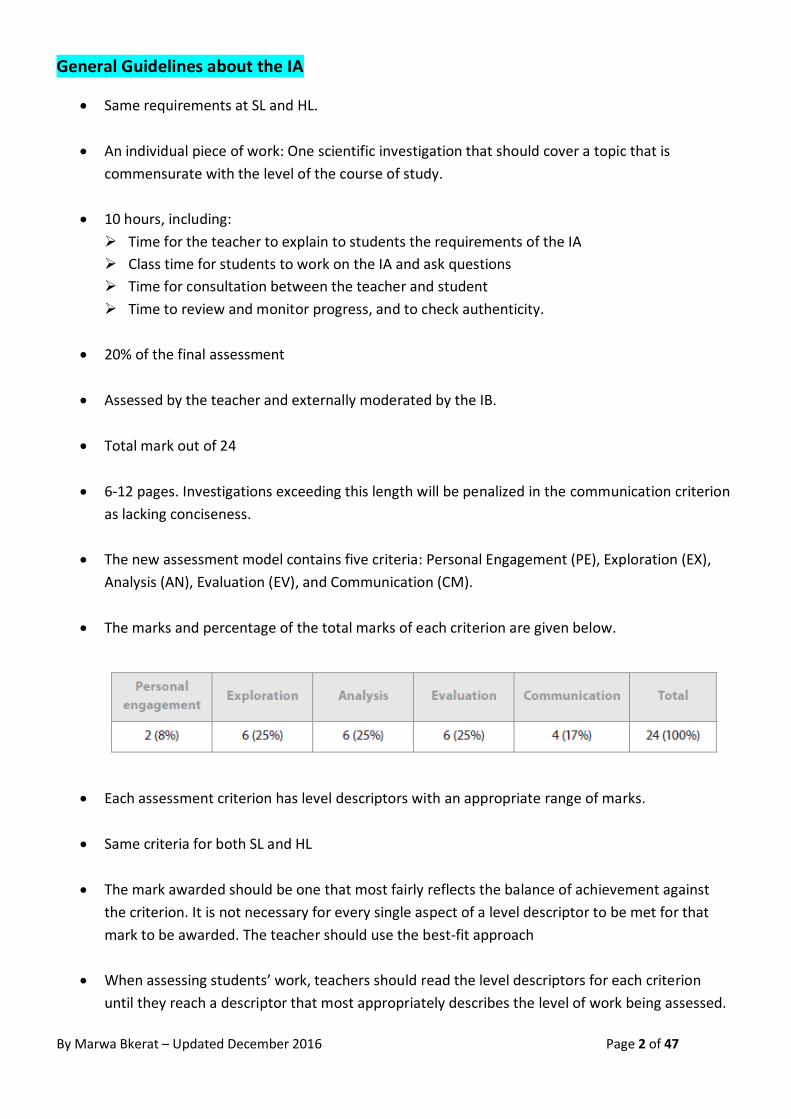
The new assessment model contains five criteria: Personal Engagement (PE), Exploration (EX),
Analysis (AN), Evaluation (EV), and Communication (CM).
The marks and percentage of the total marks of each criterion are given below.
Each assessment criterion has level descriptors with an appropriate range of marks.
Same criteria for both SL and HL
The mark awarded should be one that most fairly reflects the balance of achievement against
the criterion. It is not necessary for every single aspect of a level descriptor to be met for that
mark to be awarded. The teacher should use the best-fit approach
When assessing students’ work, teachers should read the level descriptors for each criterion
until they reach a descriptor that most appropriately describes the level of work being assessed.
By Marwa Bkerat – Updated December 2016 Page 3 of 47
If a piece of work fall between 2 descriptors, both descriptors should be read again and the one
that more appropriately describes the student’s work should be chosen.
When two or more marks are available within a level, award the upper marks if the student’s
work demonstrates the qualities described to a great extent. Award the lower marks if the
student’s work demonstrates the qualities described to a lesser extent.
Only whole numbers should be used
The highest descriptors do not imply faultless performance
Each criterion must be marked separately.
The assessment criteria should be available to students at all times.

By Marwa Bkerat – Updated December 2016 Page 4 of 47

By Marwa Bkerat – Updated December 2016 Page 5 of 47
By Marwa Bkerat – Updated December 2016 Page 6 of 47

By Marwa Bkerat – Updated December 2016 Page 7 of 47

By Marwa Bkerat – Updated December 2016 Page 8 of 47

By Marwa Bkerat – Updated December 2016 Page 9 of 47

By Marwa Bkerat – Updated December 2016 Page 10 of 47
By Marwa Bkerat – Updated December 2016 Page 11 of 47
Biology guide

By Marwa Bkerat – Updated December 2016 Page 12 of 47
Expectations for each criterion
Expectations for ‘personal engagement’:
Clear evidence of personal engagement with the exploration.
Evidence of significant independent thinking, initiative or insight.
Justification of RQ and/or Personal interest, significance or curiosity.
Evidence of personal input and initiative in designing, implementing or presentation of the investigation.
Expectations for ‘Exploration’:
Topic identified
States a clear, relevant and fully focused RQ
Background information is appropriate and relevant.
Highly appropriate methodology, that takes into consideration nearly all the significant factors that may
influence the relevance, reliability and sufficiency of data collected.(DV, IV and control variables)
When appropriate, evidence of full awareness of safety, ethical or environmental issues that are relevant
to the methodology.
Expectations for ‘Analysis’:
Sufficient and relevant quantitative and qualitative raw data.
Appropriate and sufficient data processing with accuracy
Full and appropriate consideration of the impact of measurement uncertainty on the analysis.
Correct interpretation of data.
All to lead to a detailed and valid conclusion.
Expectations for ‘Evaluation’:
Conclusion
Described
Justified
Relevant comparison to accepted scientific context

By Marwa Bkerat – Updated December 2016 Page 13 of 47
Evaluation
Strengths identified
Weakness identified (limitations of the data and sources of error are discussed)
Clear understanding of methodological issues
Realistic and relevant suggestions for the improvement are discussed.
Expectations for ‘Communication’:
Presentation is clear and coherent
Well-structured and clear report
Necessary information on focus.
Report is relevant and concise.
Subject-specific terminology
Proper citation
Correct labeling of graphs, tables, use of units, decimal places.

By Marwa Bkerat – Updated December 2016 Page 14 of 47
Checklist for the IB Biology IA Criteria (new syllabus)
Personal Engagement
Clear evidence of personal engagement with the exploration.
Evidence of significant independent thinking, initiative or insight.
Justification of RQ and/or Personal interest, significance or curiosity.
Evidence of personal input and initiative in designing, implementing or presentation of the investigation.
Exploration
Topic identified
Research question: o is focused and clearly stated under the heading “Research Question”. o includes the relevant independent variable (IV) with units/range. o includes the relevant dependent variable (DV) with units. o is phrased as ‘what is the effect of x on y?’ or something similar. o Includes scientific names of any organisms used (+ gender and age where possible)
Background information is appropriate and relevant (citation needed)
Hypothesis: o is properly stated and include the IV and DV. o includes biological reasoning/ thoroughly explained (in background information) o sketch graph is included, where possible. o Theory is included
The IV (what you are changing, X) with units/range is identified / how was it changed/ instrument used (this should be explained when listing the variables and in the method).
Range of IV is clearly stated. An explanation of how and why this range was chosen.
The DP (what you are measuring, Y) with units is identified / how was it measured?/ instrument and process (this should be explained when listing the variables and in the method).
The controlled variables (what is kept constant) are listed and identified clearly with values (in a table) / how was it controlled? Include all values and equipment used to measure these values (this should be explained when listing the variables and in the method).
Uncontrolled variables if present / how was it monitored if not controlled.
All materials and chemicals are listed with specific amounts, SI units and concentrations. Equipment with proper sizes must be listed.
When appropriate, a well labeled and clear diagram with clear measurements is drawn/ a photo could be used
The method allow for sufficient relevant data to be collected.
Minimum of 5 increments over a suitable range for the IV.
Minimum of 5 trials of each independent variable is needed.
Method is clear and includes all relevant details.
The choice of data presentation method (chart or graph type) is stated and explained in the method.
When appropriate, evidence of full awareness of safety, ethical or environmental issues that are relevant to the methodology.
By Marwa Bkerat – Updated December 2016 Page 15 of 47
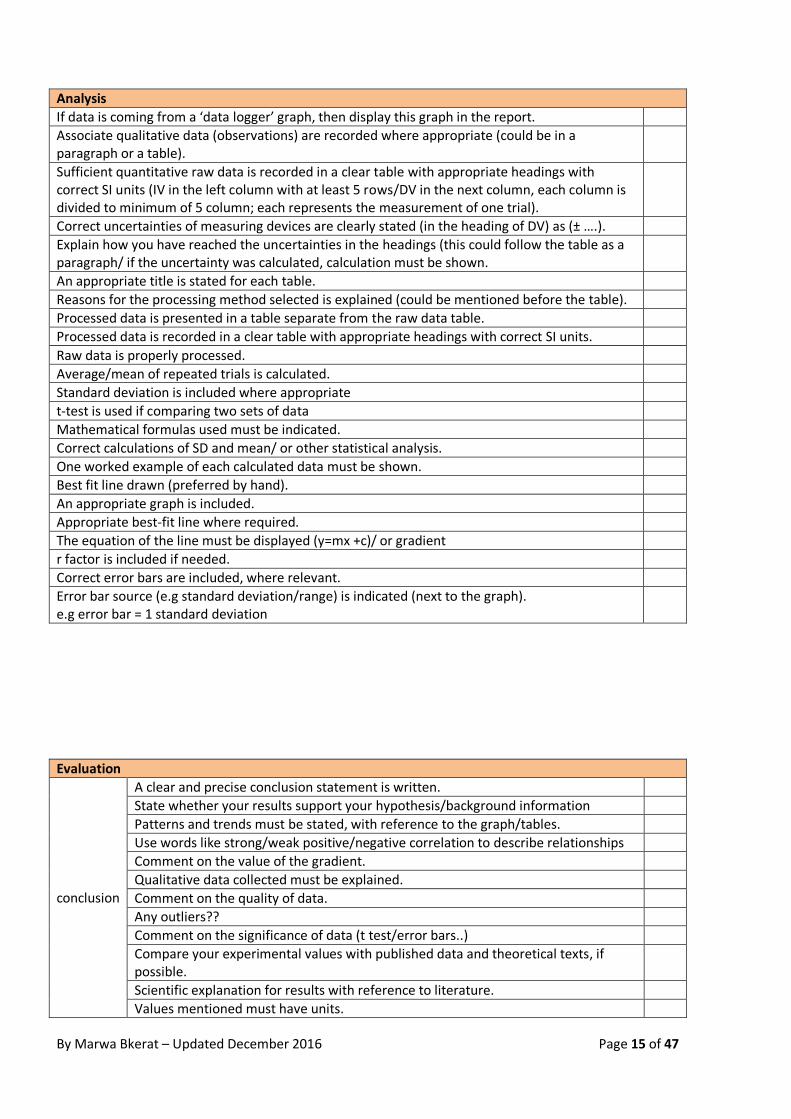
Analysis
If data is coming from a ‘data logger’ graph, then display this graph in the report.
Associate qualitative data (observations) are recorded where appropriate (could be in a paragraph or a table).
Sufficient quantitative raw data is recorded in a clear table with appropriate headings with correct SI units (IV in the left column with at least 5 rows/DV in the next column, each column is divided to minimum of 5 column; each represents the measurement of one trial).
Correct uncertainties of measuring devices are clearly stated (in the heading of DV) as (± ….).
Explain how you have reached the uncertainties in the headings (this could follow the table as a paragraph/ if the uncertainty was calculated, calculation must be shown.
An appropriate title is stated for each table.
Reasons for the processing method selected is explained (could be mentioned before the table).
Processed data is presented in a table separate from the raw data table.
Processed data is recorded in a clear table with appropriate headings with correct SI units.
Raw data is properly processed.
Average/mean of repeated trials is calculated.
Standard deviation is included where appropriate
t-test is used if comparing two sets of data
Mathematical formulas used must be indicated.
Correct calculations of SD and mean/ or other statistical analysis.
One worked example of each calculated data must be shown.
Best fit line drawn (preferred by hand).
An appropriate graph is included.
Appropriate best-fit line where required.
The equation of the line must be displayed (y=mx +c)/ or gradient
r factor is included if needed.
Correct error bars are included, where relevant.
Error bar source (e.g standard deviation/range) is indicated (next to the graph). e.g error bar = 1 standard deviation
Evaluation
conclusion
A clear and precise conclusion statement is written.
State whether your results support your hypothesis/background information
Patterns and trends must be stated, with reference to the graph/tables.
Use words like strong/weak positive/negative correlation to describe relationships
Comment on the value of the gradient.
Qualitative data collected must be explained.
Comment on the quality of data.
Any outliers??
Comment on the significance of data (t test/error bars..)
Compare your experimental values with published data and theoretical texts, if possible.
Scientific explanation for results with reference to literature.
Values mentioned must have units.

By Marwa Bkerat – Updated December 2016 Page 16 of 47
Evaluation
Strengths identified
Identify any limitations or weaknesses in the procedure, equipment used and time management. (minimum of 4 limitations)
Analyse the sufficiency/reliability of data collected.
Comment on the range of IV values.
Discuss any random errors (e.g variation of biological tissue) in the design or in the process of collecting data.
Discuss any systematic errors in the design or in the process of collecting data.
Discuss errors due to precision of equipment (e.g balance)/mention degree of precision.
Comment on whether you managed to keep the controlled variables constant.
Comment on the equipment used and their precision (uncertainty).
Comment on the method in which you used the equipment.
Outliers must be identified and explained.
Comment on the error bars; range of data collected (close to mean/widely distributed around mean).
State weaknesses in the design of the experiment/equipment (at least 5) and their impact on the experiment.
Values mentioned must have units.
Suggest an improvement for each weakness mentioned above.
Suggested improvements are realistic and achievable.
Suggested improvements are specific and detailed.
When addressing the issue of precision, the degree of precision for the suggested equipment must be mentioned.
Comment on how to reduce error.
Comment on how to how to better control variables.
Suggest an improvement for each weakness mentioned above.
Communication
IA is well presented and coherent
Well-structured with clear headings/ page numbers included
IA pages: 6-12 pages
Proper scientific language is used
Proper citation of back ground information/graphs/diagrams/conclusion/ others.
Correct use of units (SI units)
Tables must: - Have a number and a title - appropriate headings for each row and column - Columns and rows must have borders. - The headings (IV and DV) of data recorded must have the correct SI units. - Decimal points are consistent throughout. - Decimal points are consistent with the uncertainties listed.
Graphs must: - An appropriate title is stated for each graph (include units). - The appropriate type of graph (bar, line..) is chosen. - Graphs must be colored and clear. - Axes are labeled clearly (IV on X axis/DV on Y axis), including SI units and uncertainties. - Axes are scaled appropriately.
Clear presentation: effective use of spaces, tables and graphs don’t break across pages.

By Marwa Bkerat – Updated December 2016 Page 17 of 47
Parts of the investigation
1. Topic
2. Research Question
3. Purpose
4. Introduction
5. Hypothesis
6. Background information
7. Variables
8. Materials
9. Safety Measures
10. Method
11. Data Collection
12. Data Processing
13. Conclusion
14. Evaluation
15. Bibliography
The lab investigation should be between 6-12 pages.

By Marwa Bkerat – Updated December 2016 Page 18 of 47
1. Topic - has to be identified. -------------------------------------------------------------------------------------------------------------------------------------------------------- 2. Research Question
Has to be precised and focused.
Must include the relevant independent variable (IV) with units/range.
Must include the relevant dependent variable (DV) with units.
Has to be phrased as ‘what is the effect of changing X (independent variable) on Y (dependent variable)?’ or something similar.
Must include scientific names of any organisms used (+ gender and age where possible). Eg. What is the effect of a changing glucose concentration on cell respiration in yeast, measured by the ? Independent variable: glucose concentration Dependent variable: cell respiration in yeast E.g. How does the speed of movement of chloroplasts in Elodea leaf cells vary with light intensity? E.g. Does ethanol concentration affects the activity of bovine catalase, measured by the volume of oxygen gas produced?”
--------------------------------------------------------------------------------------------------------------------------------------------------------
3. Purpose
Indicate the purpose and/or rationale of the investigation.
Justify your personal interest, significance or curiosity.
--------------------------------------------------------------------------------------------------------------------------------------------------------
4. Introduction
This should be brief and contain a simple outline of what you aim to do.
E.g. Five different concentrations of glucose (0.0 M, 0.25 M, 0.50M, 0.75M and 1M) will be used to see how the growth of
yeast changes. The growth of yeast will be measured by the volume of CO2 produced which is an indication of the amount of
cell respiration taking place. It is expected that increasing the glucose concentration will increase the volume of C02
produced which will suggest that the rate of cell respiration has increased.
--------------------------------------------------------------------------------------------------------------------------------------------------------
5. Hypothesis
Though a hypothesis is not needed, but in biology it is preferred to have one (if possible). If you include a hypothesis, then
your hypothesis must be supported with an explanation. It should look like “It is expected that …………… and this is because
…………….” This should link to the background information.
Eg. If the glucose concentration is increased, then the volume of C02 produced will also increase. This is because glucose is
used by yeast to make ATP through cellular respiration. The more glucose that is available, the faster the rate of cell
respiration, and the more C02 that will be produced. C02 is a product of cell respiration in yeast, so the more C02 the faster
the rate of cell respiration.
--------------------------------------------------------------------------------------------------------------------------------------------------------
6. Background Information
background information about the topic
biological reasoning

By Marwa Bkerat – Updated December 2016 Page 19 of 47
provide relevant research which must show understanding and thorough explanation.
include graphs from theory, where possible (citation of graphs is required)
include theory
Citation is included (in-text or footnotes).
--------------------------------------------------------------------------------------------------------------------------------------------------------
7. Variables
Correctly categorize your variables.
Use the table below to present the variables in your report.
Category Identify Variable How to be controlled/manipulated/measured?
Independent Variable
This is what you are changing (X) – only one variable
Range must be stated. Minimum of 5 values (preferred to be evenly spread)
Selected values must allow
you to analyse your results
and draw a conclusion.
Some experiments will
benefit from the use of a
control. For example, if you
are investigating the effect of
acidity on enzyme activity.
Then the control would be
the substrate with acid and
no enzyme.
Units must be identified.
How was it changed? What was the instrument used? Why this range was chosen?
Dependent Variable
This is what is measured (Y).
Identify units.
How was it measured? What was the instrument used? What was the process for measuring?
Controlled Variables
This is what is kept constant.
Include all values and units. Think of as many controlled
variables as you can.
Don’t include controlled variable that aren’t significant.
E.g Total volume of a
reaction mixture. Temperature pH concentration of
solutions Volume of solutions Surface area Time Light intensity Source of biological
material used
How was it controlled? What was the instrument used for controlling it? What was the process for controlling it?

By Marwa Bkerat – Updated December 2016 Page 20 of 47
Uncontrolled Variables
May not be present
May include factors such as
environmental conditions or
certain features of living
organisms.
You should try to minimize
the effect they will have. If
you can’t control them then
you should monitor them.
E.g room temp.
How to monitor it?
--------------------------------------------------------------------------------------------------------------------------------------------------------
8. Material
Make sure you include the following:
• The sizes of glassware such as beakers, flasks, etc. (eg Beaker 100 cm3)
• The concentration of chemicals (eg hydrochloric acid, 2.0 M). • The amounts (Mass/Volume) of chemicals (eg magnesium, 0.50 g). • The range of a thermometer (eg –20°C to 120°C) • The volume of each solution (eg 200 cm3) • SI Units:
Measurement SI Units and accepted non SI units Symbols
Distance Metres, centimetres, millimeters m, cm, mm
Mass Kilograms, grams kg, g
Volume Decimeters cubed, centimetres cubed dm3, cm3
Concentration Moles, millimoles mol, nmol
Time Seconds, minutes s, min
When the unit is ‘per’, as in centimetres per second, always use the minus sign, as in cm s-1. Never use / as this is used to separate the description from the units. E.g. Rate of movement of bubble/ cm s-1
--------------------------------------------------------------------------------------------------------------------------------------------------------
9. Safety Measures
Safety, ethical and/or environmental issues must be addressed. Ensure to describe the procedures you will follow to minimize any risks posed by any of the following:
• When using sharp items such as dissecting instruments or a knife for cutting
• When using a Bunsen burner or hot water
• When using corrosive chemicals such as HCL
When dealing with participants in your experiment, ensure describing the procedures you will follow to ensure it is an ethical
practice:
• Ensure the medical history of the participants is taken into consideration
• Ensure the procedure is explained to the participants
• Ensure consent is collected from each participant.
--------------------------------------------------------------------------------------------------------------------------------------------------------

By Marwa Bkerat – Updated December 2016 Page 21 of 47
10. Method
• Indicate every step to take place.
• The method allow for sufficient relevant data to be collected (Minimum of 5 increments over a suitable range for
the IV/ Minimum of 5 trials of each independent variable is needed).
• Don’t use personal language such as “I”, “we”, “they”, “you” etc.
Eg: “I weighed out 0.50 g of magnesium and then I added 2.0 cm3 of 2M hydrochloric acid” should be rewritten as “Add 0.5 g magnesium to 200 cm3 of 2M hydrochloric acid”
• Record the amounts (mass/volume) of materials used. Ensure values follow the precision of the instrument used.
Eg: If you weighed 20 g of magnesium using a volumetric pipette this should be recorded as 20.00 g and not just 20
g.
• Include the size of all equipment used.
E.g measure 100 cm3 of 2M hydrochloric acid using a 100 cm3 measuring cylinder.
• Don’t include “obvious” steps in your methods. Steps such as:
“collect and put on safety equipment” “clean up bench and return apparatus to the trolley”
• Include how the IV, DV and controlled variables were changed, measured and manipulated. Include all values and equipment used.
• Include sufficient repeats of trials (minimum of 5).
• Include which statistical analysis method will be used (mean, standard deviation, t-test, chi-square, etc.).
• Explain why you chose this analysis method.
• The choice of data presentation method (chart or graph type) is stated and explained in the method.
• When appropriate, a well labeled and clear diagram with clear measurements is drawn/ a photo could be used. --------------------------------------------------------------------------------------------------------------------------------------------------------
11. Data Collection
• Must record the following: Qualitative data (i.e. observations) – where appropriate (could be in a paragraph or a table). Quantitative data (i.e. numerical values) - must be recorded in a clear table with appropriate headings with
correct SI units (IV in the left column with at least 5 rows/DV in the next column, each column is divided to minimum of 5 column; each represents the measurement of one trial).
• Correct uncertainties of measuring devices are clearly stated (in the heading of DV) as (± ….). • Explain how you have reached the uncertainties in the headings (this could follow the table as a paragraph/ if the
uncertainty was calculated, calculation must be shown. • An appropriate title is stated for each table. • Decimal places of all values should be consistent with the uncertainty.
Eg: If you are interested in the change (e.g temperature) of a reaction record the Initial and final readings. • Ensure all tables and columns have borders • The data in a column needs to be centered in the column. • Anomalies must be identified and treated.
Note: - Avoid to use the terminology ‘amount’ – use mass/volume/etc. instead - Use one terminology e.g mean or Average but not both - Do not split tables over two pages.

By Marwa Bkerat – Updated December 2016 Page 22 of 47
E.g Table 1: Volume of gas evolved from magnesium on addition of hydrochloric acid at different temperatures.
Temperature/ oC ± 0.5 oC Volume of Hydrogen gas evolved in 10 minutes/ cm3 ± 0.5 cm3
Trial 1 Trial 2 Trial 3 Trial 4 Trial 5
0.0 5.6
20.0 6.0
40.0
60.0
80.0 Uncertainty
• The uncertainty for an apparatus is on the apparatus (eg burette, volumetric glassware) or is half the smallest measurable value.
E.g if the smallest unit for a measuring cylinder is 0.1 cm3, then the uncertainty is ± 0.05 cm3
• For all digital instruments, the uncertainty is the smallest division.
Eg: If a balance can measure to two decimal places (0.01 g) then the error in a mass reading with this balance is ±0.01 g.
• An exception to the uncertainty being half the smallest instrument value is when using a ruler. --------------------------------------------------------------------------------------------------------------------------------------------------------
12. Data Processing
Processed data must be presented in a table – could be in the same table of raw data or separate from the raw data table.
Processed data must be recorded in a clear table with appropriate title/ headings with correct SI units and uncertainty (see table above)
e.g Table 2: The Average and standard Deviation of the Volume of gas evolved from magnesium on addition of hydrochloric acid at different temperatures.
Temperature/ oC ± 0.5 oC
Volume of Hydrogen gas evolved in 10 minutes/ cm3 ± 0.5 cm3
Average Standard Deviation
0.0 5.6 1.2
20.0 6.0 0.2 40.0 7.0 0.1
60.0 7.5 0.2
80.0 8.0 0.1
Correct calculations of SD and mean/ or other statistical analysis.
Data processing is appropriate (change, mean, SD, t-test, chi-square test, etc.)
Reasons for the processing method selected is explained (could be mentioned before the table). E.g t-test when comparing two sets of data.

By Marwa Bkerat – Updated December 2016 Page 23 of 47
Calculations
Mathematical formulas/ method (spreadsheet) used must be indicated.
One worked example of each calculated data must be shown/ units must be included.
An explanation/ calculation of how the uncertainty was reached. Graphs
An appropriate titled graph should be included.
Proper Y and X axis labelling – include units/ uncertainties/ consistent decimal places (same as the uncertainty indicated in the table).
Include an appropriate best-fit line where required. The equation of the line must be displayed (y=mx +c)/ or gradient
Include the r factor is if needed.
Correct error bars must be included, where relevant.
Error bar source (e.g standard deviation/range) is indicated (next to the graph). e.g error bar = 1 standard deviation
Ensure your graph is a suitable size (half page) and not too narrow in either direction. -------------------------------------------------------------------------------------------------------------------------------------------------------- 13. Conclusion
A clear and precise conclusion statement must be written. The conclusion statement must connect to the RQ.
State whether your results (from tables/graphs) support your hypothesis/background information. Don’t say ‘my prediction was correct’ but say ‘results obtained support the background information/hypothesis’.
Patterns and trends must be stated, with reference to the graph/tables. Use words like strong/weak positive/negative correlation to describe relationships.
Refer to the qualitative data (observations) collected. Mention if they support or not your hypothesis/background information.
Comment on the value of the gradient (slope) if indicated. Does it show a + or -/ strong or weak correlation?
Comment on the value of r if indicated. Does it show a + or -/ strong or weak correlation?
Comment on outliers if present.
Comment on the error bars
e.g larger error bars indicate wider variation in data collected. e.g Overlapping error bars in a bar graph indicate no significant difference.
If t-text, comment on the significance of values. State the null hypothesis and the alternative hypothesis based on your research question.
Conclusion must be justified.
Compare your experimental values with theoretical ones.
Refer to literature and include in-text citation or footnotes.
All values mentioned must have units. --------------------------------------------------------------------------------------------------------------------------------------------------------

By Marwa Bkerat – Updated December 2016 Page 24 of 47
14. Evaluation
Strengths must be identified.
Comment on the reliability of your data (error bars/ SD)
Use the table below for your evaluation.
Weakness/ Error Impact of Weakness Improvement suggested
1.
2.
3.
4.
5. Weaknesses & their impact
Identify any limitations or weaknesses in the procedure, equipment used and time management.
State weaknesses in the design of the experiment/equipment (at least 5) and their impact on the experiment.
Analyse the sufficiency/reliability of data collected. Are the measurements and observations reliable?
Comment on the range of IV values.
Discuss any random errors (e.g variation of biological tissue) in the design or in the process of collecting data.
Discuss any systematic errors in the design or in the process of collecting data.
Discuss errors due to precision of equipment (e.g balance)/mention degree of precision (uncertainty).
Comment on whether you managed to keep the controlled variables constant. Were important variables not controlled? E.g temperature
Comment on the method in which you used the equipment.
Outliers must be identified and explained.
Comment on the error bars; range of data collected (close to mean/widely distributed around mean).
Values mentioned must have units.
Improvements suggested
Suggest an improvement for each weakness mentioned above.
Suggested improvements are realistic and achievable.
Suggested improvements are specific and detailed.
When addressing the issue of precision, the degree of precision for the suggested equipment must be mentioned.
Comment on how to reduce error.
Comment on how to how to better control variables. --------------------------------------------------------------------------------------------------------------------------------------------------------
By Marwa Bkerat – Updated December 2016 Page 25 of 47
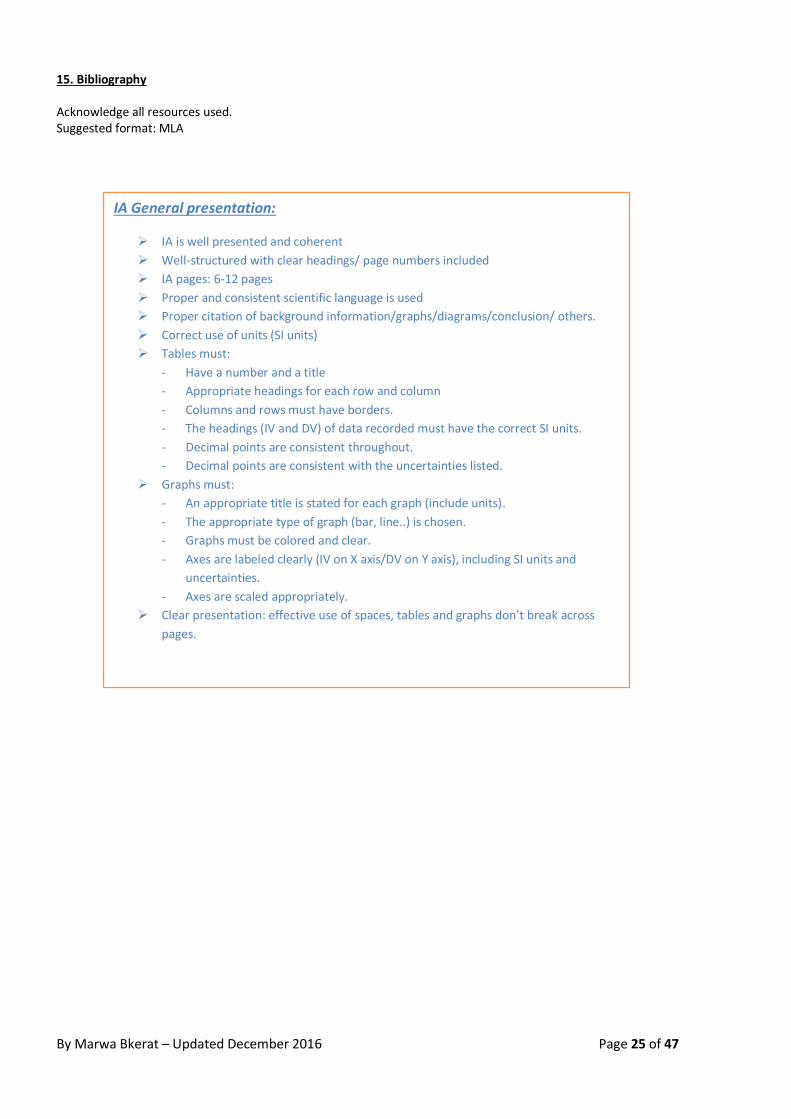
15. Bibliography Acknowledge all resources used. Suggested format: MLA
IA General presentation:
IA is well presented and coherent
Well-structured with clear headings/ page numbers included
IA pages: 6-12 pages
Proper and consistent scientific language is used
Proper citation of background information/graphs/diagrams/conclusion/ others.
Correct use of units (SI units)
Tables must:
- Have a number and a title
- Appropriate headings for each row and column
- Columns and rows must have borders.
- The headings (IV and DV) of data recorded must have the correct SI units.
- Decimal points are consistent throughout.
- Decimal points are consistent with the uncertainties listed.
Graphs must:
- An appropriate title is stated for each graph (include units).
- The appropriate type of graph (bar, line..) is chosen.
- Graphs must be colored and clear.
- Axes are labeled clearly (IV on X axis/DV on Y axis), including SI units and
uncertainties.
- Axes are scaled appropriately.
Clear presentation: effective use of spaces, tables and graphs don’t break across
pages.

By Marwa Bkerat – Updated December 2016 Page 26 of 47
Statistical Analysis Tips:
It is the average of a set of values
Mean = sum of all samples Sample size
X = Σ x
n e.g. Find the mean for the following set of data. Heights of bean plants at 10 days are 10,11, 12, 9, 8, and 7 centimetres. X = 57 = 9.5 cm
6 It is the measure of the spread of data; the difference between the largest and the smallest
observed values. e.g. Find the range for the above set of data. range = 12 – 7 = 5 Very small or vary large value → outlier (exclude in range calculation)
It is a measure of how the individual observations of a data set are spread out around the mean; deviation from the mean.
How to find the SD?
Range = largest value – smallest value
Mean (Average)
Standard Deviation
Range
Using Excel spreadsheet: 1. Place cursor in cell next to or below
set of data 2. Click on fx 3. Select a category – Statistical 4. Select a function – STDEV 5. Click OK 6. Click Format 7. Click Cells 8. Click Number 9. Select category Number 10. Choose 1 or 2 decimal places as
appropriate 11. Click OK

By Marwa Bkerat – Updated December 2016 Page 27 of 47
Note: 68 % of the values fall within ±1 SD of the mean while 95 % of the values fall within ±2 SD of the mean.
Bell Curve If SD is less than 33% of the mean → SD is Small → the data is close to the mean (less variation) If SD is more than 33% of the mean → SD is Large → the data is widely spread around the mean (more variation) How to know? Less than 33% SD is Small
SD X 100 = Mean More than 33% SD is Large
e.g. SD = 1.5 , mean = 3, is the SD small or large? 1.5 X 100 = 50% , More than 33% (Large SD) 3 e.g. What is the SD for the values 7, 7, 7, 7 ? SD = zero Comparing the means and spread of data between two or more samples e.g.
Data Set 1 Data Set 2 124 131
120 60
153 160
98 212
123 117
142 65
156 155
128 160
139 145
117 95
Mean 130 130
SD 17.8 47.02
Higher SD; very wide spread of data around the mean 2 sets of data might have the same mean but different SD Can be used to show either the range of data or the standard deviation on a graph. If SD is 1 cm, the error bar will be drawn 1 cm above the mean and 1 cm below the mean.
SD has the same unit
as the data values
Answer %
Error Bars

By Marwa Bkerat – Updated December 2016 Page 28 of 47
The smaller the error bar, the less SD, the more confident we are ( data is close to the mean/less variation) The larger the error bar, the more SD, the less confident we are ( data is widely spread around the mean/ more variable) Used to compare 2 sets of data / used when the sample’s values are so wide
spread around the mean/ minimum of 10 values
Using GDC: 1. Stat 2. Enter (edit) 3. To get rid of data in L1/L2: scroll up, clear, enter 4. Enter data in L1 & L2 5. Stat 6. Edit, scroll right, calc, Tests 7. Scroll to no. 4 (2-sample Test) 8. Enter 9. Scroll down to u1 ≠ u2 10. Pooled (select yes)/ select calculate
t-value & p-value P-value indicates probability that chance alone could produce the difference. What to conclude from the p-value? Null Hypothesis: Is there no significant difference between the two samples except as caused by chance selection of data. OR Alternative hypothesis: Is there a significant difference between the two samples (e.g height of shells in sample A and sample B). So the question 'Is there a significant difference between these two populations? p-value = 0.05
- probability that chance alone could produce the difference = 5% - confidence level = 95% (confident that the difference is a real
difference and not due to chance only) - the difference is significant - reject Null hypothesis / accept alternative hypothesis
p-value = 0.5
- probability that chance alone could produce the difference = 50% - confidence level = 50% - No significant difference - Accept null hypothesis
t-test
If p ≤ 5% → significant difference (reject Null hypothesis / accept alternative hypothesis )
If p > 5% → no significant
difference (Accept null
hypothesis

By Marwa Bkerat – Updated December 2016 Page 29 of 47
Two variables, V1 and V2 may be linked.
The existence of a correlation doesn’t mean that there is a casual relationship between the two variables; correlation doesn’t mean causation; observations only are not enough for causation; Experiments must be done to show the cause of the correlation that we are measuring. e.g. For years we have known that there is a high positive correlation between smoking and lung cancer. Does this high positive correlation prove that smoking causes lung cancer? No, it doesn’t prove that smoking causes lung cancer. Only data collected from a well-designed experiment can show cause. Correlation is represented by r value: r value ranges between +1 (completely positive correlation) to 0 (no correlation) to -1 (completely negative correlation). E.g. r= 0.88 (positive correlation)
Correlations & Causation

By Marwa Bkerat – Updated December 2016 Page 30 of 47
Biology Internal Assessment Purpose
My interest in the ripening of fruit developed from an observation that fruits bought in my local supermarket do not always ripen effectively. This stimulated me to find out more about the process of ripening in fruits. I chose nectarines as my material because they were in season and they seemed to be the worst affected by the problem of ripening. Research Question
How do two different methods of fruit ripening affect the metabolism of starch to glucose in nectarines (Prunus persica) over 7 days? Introduction
1
Glucose is one of the most important carbohydrates in biochemistry and is pivotal in the key biological processes of photosynthesis and cellular respiration. In the ripening process, starch molecules (polysaccharides) are broken down by digestive enzymes to glucose (monosaccharide). This process is made possible by the induction of ethene gas.23 Ethene gas is biological hormone that is used in plants to stimulate key processes, for example the germination of seeds, fruit abscission and the ripening process. It is more readily produced by some fruit, in particular bananas and apples, and will hasten the ripening of fruit when in a contained environment, for example inside a plastic bag or box. Another method suggested is to bury the fruit in rice. It is supposed to retain the ethylene gas produced by the fruit longer.4 This experiment aims to simulate three different ripening conditions, all of which are presumed to induce the ripening process. In the first trial, a banana will be placed with a nectarine in a closed bag. In the second, a nectarine will be placed under rice in a plastic box. Thirdly, a control whereby a nectarine is placed alone in a plastic bag, will be set up as the null hypothesis, supporting the assumption that the production of ethene gas and the concentration of glucose are independent of one another. It is important that all three trials be conducted in closed environments, which favour the retention of ethene gas.
The presence of glucose has been used in this experiment to indicate the extent to which ethene gas has affected the metabolism of starch and the concentration of simple sugars in nectarines.
1http://mwsu-bio101.ning.com/profiles/b!ogs/the-rnolecu!es-within-you-1 2http://www.newton.dep.anl.gov/askasci/bot00/bot00553.htm 3J.H.LaRue & R.S.Johnson (1989) Peaches Plumbs and Nectarines U Cal Google Books
http://books.google.fr/books?id=0EEtgcbJaAIC&pg=PA163&lpg=PA163&dq=starch+in+nectarines&source=bl&ots=8Iab1znGzd&sig=bjD1Nk0gCGTwj3zlbRenFlbREms&hl=en&sa=X&ei=wzo6T_C3LYfL0QWKk42QCw&redir_esc=y#v=onepage&q=starch%20in%20nectarines&f=false 4Matthew Rogers 14/06/11 http://lifehacker.com/5811686/ripen-fruit-faster-by-burying-it-in-rice
IA Sample
By Marwa Bkerat – Updated December 2016 Page 31 of 47
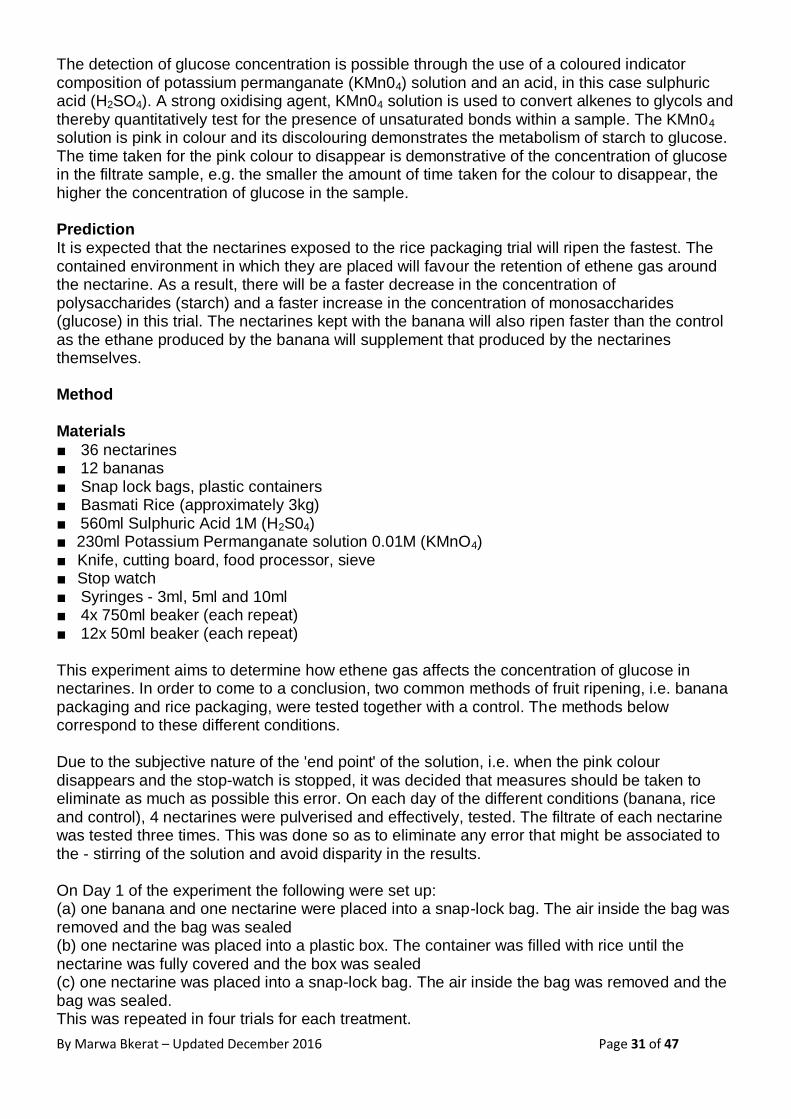
The detection of glucose concentration is possible through the use of a coloured indicator composition of potassium permanganate (KMn04) solution and an acid, in this case sulphuric acid (H2SO4). A strong oxidising agent, KMn04 solution is used to convert alkenes to glycols and thereby quantitatively test for the presence of unsaturated bonds within a sample. The KMn04 solution is pink in colour and its discolouring demonstrates the metabolism of starch to glucose. The time taken for the pink colour to disappear is demonstrative of the concentration of glucose in the filtrate sample, e.g. the smaller the amount of time taken for the colour to disappear, the higher the concentration of glucose in the sample. Prediction It is expected that the nectarines exposed to the rice packaging trial will ripen the fastest. The contained environment in which they are placed will favour the retention of ethene gas around the nectarine. As a result, there will be a faster decrease in the concentration of polysaccharides (starch) and a faster increase in the concentration of monosaccharides (glucose) in this trial. The nectarines kept with the banana will also ripen faster than the control as the ethane produced by the banana will supplement that produced by the nectarines themselves. Method Materials
■ 36 nectarines ■ 12 bananas ■ Snap lock bags, plastic containers ■ Basmati Rice (approximately 3kg) ■ 560ml Sulphuric Acid 1M (H2S04) ■ 230ml Potassium Permanganate solution 0.01M (KMnO4) ■ Knife, cutting board, food processor, sieve ■ Stop watch ■ Syringes - 3ml, 5ml and 10ml ■ 4x 750ml beaker (each repeat) ■ 12x 50ml beaker (each repeat) This experiment aims to determine how ethene gas affects the concentration of glucose in nectarines. In order to come to a conclusion, two common methods of fruit ripening, i.e. banana packaging and rice packaging, were tested together with a control. The methods below correspond to these different conditions. Due to the subjective nature of the 'end point' of the solution, i.e. when the pink colour disappears and the stop-watch is stopped, it was decided that measures should be taken to eliminate as much as possible this error. On each day of the different conditions (banana, rice and control), 4 nectarines were pulverised and effectively, tested. The filtrate of each nectarine was tested three times. This was done so as to eliminate any error that might be associated to the - stirring of the solution and avoid disparity in the results. On Day 1 of the experiment the following were set up: (a) one banana and one nectarine were placed into a snap-lock bag. The air inside the bag was removed and the bag was sealed (b) one nectarine was placed into a plastic box. The container was filled with rice until the nectarine was fully covered and the box was sealed (c) one nectarine was placed into a snap-lock bag. The air inside the bag was removed and the bag was sealed. This was repeated in four trials for each treatment.

By Marwa Bkerat – Updated December 2016 Page 32 of 47
One untreated nectarine was retained on Day 1 to establish the initial glucose levels. The fruit were left for 3, 5 or 7 days in room temperature conditions. At the end of the period the nectarines were removed and qualitative observations and measurements of the glucose levels were made in the following way. 1. The flesh of the nectarine was removed and placed into a food processor. 500ml of distilled
water were then placed in the same processor and pulsed for 30 seconds. The liquid was filtered, through a sieve, into a 750ml beaker.
2. 10ml of the nectarine filtrate was placed into a 50ml beaker. In addition to this, 2ml of KMn04 solution and 5ml of H2SO4 solution were added into the beaker simultaneously. The stopwatch was started immediately. The solution was swirled in a constant motion and at a constant speed.
3. When the pink colour of the solution had disappeared, the stopwatch was stopped and the time taken was recorded. This was repeated three times from the filtrate from each nectarine.
Variables
Variable Identify variable How to control variable
Independent Conditions that the nectarines are exposed to, i.e. banana packaging, rick packaging and controlled environment
Dependent Time taken for the pink colour of potassium permanganate solution to disappear (demonstrative of glucose concentration)
Controlled Source and age of nectarines
All the nectarines were picked on the same day and sourced from the same supplier. When chosen, it was observed that they were of similar colour, size and firmness.
Source and age of bananas
All the bananas were picked on the same day and sourced from the same supplier. When chosen, it was observed that they were of similar colour, size and firmness.
Indicator composition Remained constant. The ability of KMnO4 solution to react with impurities meant that the same solution had to be maintained throughout trials.
Same concentration of KMnO4 and H2SO4
Ensures consistency. Pour a standard solution at beginning of experiment and use throughout
Initial concentration of glucose
One nectarine was tested and used as an initial value. This value was used across all my trials.
Nectarine sample The entire nectarine flesh was pulverized to a filtrate on all repeats.
Judgement of end point The ‘end-point’ of the experiment had to be decided on. Therefore same person had to conduct the experiment to ensure valid results.
Constant temperature Temperature affects enzyme activity, i.e. will affect the rate of ripening. Conduct experiment in closed environment.
Closed environment Mold and other microorganisms require oxygen to grow, therefore, restricting the amount of oxygen in samples will restrict the development of mold.

By Marwa Bkerat – Updated December 2016 Page 33 of 47
Risk Assessment
All apparatus was labelled with relevant information (name, date class nature of materials and experiment) All unnecessary materials were cleared away from the work space. Glassware is fragile it was used towards the centre of the bench with stable supports. Sharp cutting tools and the blender were used with care. Electrical apparatus
The connections of the balance, magnetic stirrer and blender, were kept away from running water and trailing cables were avoid Spills were cleaned up Chemicals
Sulphuric acid is corrosive and toxic. KMnO4 is a powerful oxidiser and can cause fires. Eye protection, gloves and lab jacket were worn when handling these chemicals.

By Marwa Bkerat – Updated December 2016 Page 34 of 47
Results
Table showing the observations of the three methods on the ripening process
Banana Rice Control
Day 1 One nectarine was used for all of the trials to ensure that the initial concentration of all the repeats was constant. All nectarines on Day 1 where firm, white/yellow in colour and had no visible mould on their surfaces.
Day 3 Nectarines 1 and 4 showed signs of developing mould. The bananas of these nectarines were discolouring and condensation was visible inside the snap lock bags.
Nectarines were 90-100% covered by the rice. There was minimal condensation inside the box. No mould present.
No mould. No condensation. White/yellow in colour. Firm.
Day 5 All nectarines were softer. Signs of mould. White residue on nectarine 4. Flesh was noticeable darker. Condensation inside of bag.
All nectarines were mouldy, with nectarines 2 and 4 showing the largest mould colonies. White residue. Condensation inside the box. Nectarines were mostly covered by rice, one nectarine was only 75% covered.
No mould. Minimal condensation. Pinkish in colour.
Day 7 All nectarines are at least partially covered by mould and are emitting white residue.
All nectarines at least 9.0% covered in mould. The flesh is a deep brown colour. White residue.
Pink and white in colour. No mould. 'Bruising' patches (soft spots on surface).

Page 35 of 47
Table showing the amount of time taken for the pink colour of the potassium
permanganate solution to disappear N.B There is only one value for Day 1 as only one nectarine was used to test for the initial concentration of glucose. This value was used as the initial value (Day 1 value) for all of the subsequent trials.
Time for KMnO4 colouration to disappear / s ± 0.05s
Banana Rice Control
Day 1 3 5 7 1 3 5 7 1 3 5 7
Trial 1 76.23 52.37 47.00 33.03 76.23 56.09 30.57 56.78 76.23 54.33 47.13 36.96
52.98 48.87 34.31 54.59 31.00 57.23 54.67 46.98 36.78
52.66 47.96 35.97 54.35 30.76 57.13 55.13 47.96 35.98
Trial 2 54.34 48.28 44.53 50.50 30.19 25.19 54.78 46.56 37.23
55.65 47.88 45.66 49.86 28.20 26.63 54.65 46.78 37.65
54.23 48.53 45.17 50.06 29.37 24.78 55.07 46.99 37.98
Trial 3 54.75 47.76 44.27 48.98 29.22 26.78 55.02 47.12 36.87
54.17 48.22 43.18 49.43 30.45 25.87 55.34 47.56 36.45
54.23 47.89 44.73 49.56 30.76 26.98 54.69 47.32 36.22
Trial 4 53.98 45.66 38.97 56.33 28.25 57.43 54.79 46.98 36.87
54.37 46.76 39.24 57.19 27.91 56.91 54.99 47.51 36.98
54.21 46.23 39.58 56.74 27.65 56.50 55.34 47.35 36.56
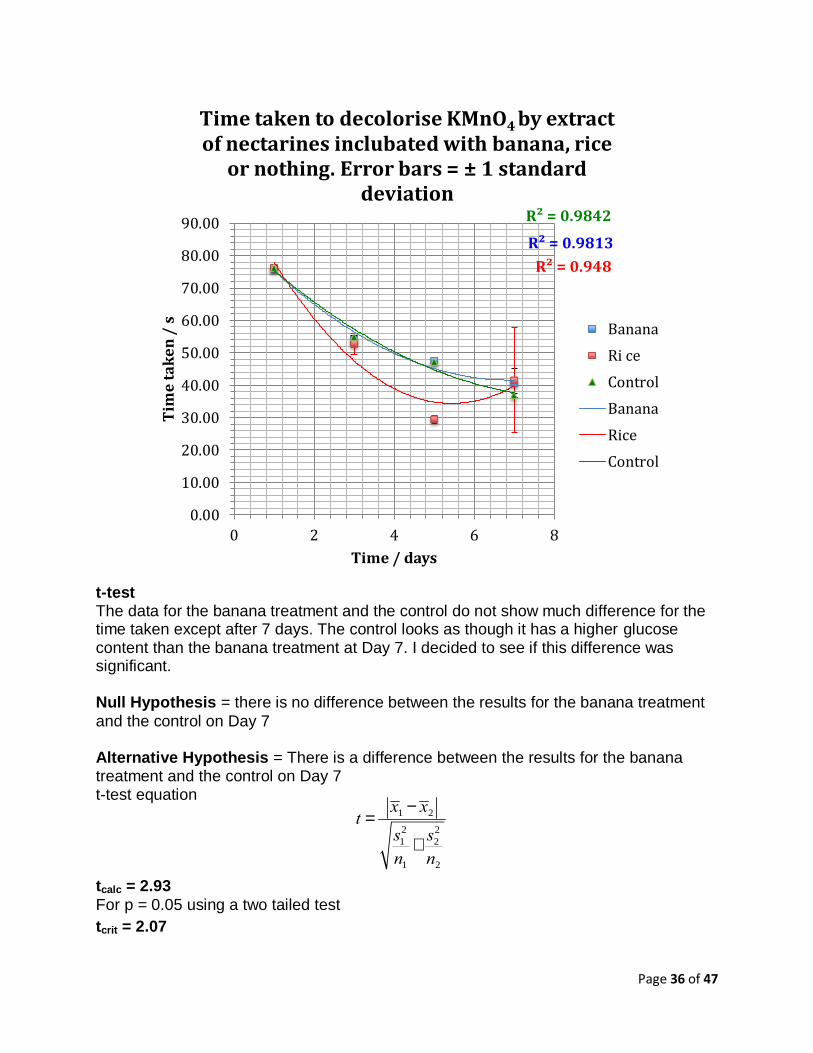
Mean 76.23 54.00 47.59 40.72 76.23 52.81 29.53 41.52 76.23 54.90 47.19 36.88
St Dev 0.00 0.91 0.97 4.50 0.00 3.32 1.25 16.18 0.00 0.30 0.38 0.56
Page 36 of 47
t-test The data for the banana treatment and the control do not show much difference for the time taken except after 7 days. The control looks as though it has a higher glucose content than the banana treatment at Day 7. I decided to see if this difference was significant. Null Hypothesis = there is no difference between the results for the banana treatment
and the control on Day 7 Alternative Hypothesis = There is a difference between the results for the banana treatment and the control on Day 7 t-test equation tcalc = 2.93
For p = 0.05 using a two tailed test
tcrit = 2.07
R² = 0.9813
R² = 0.948
R² = 0.9842
0.00
10.00
20.00
30.00
40.00
50.00
60.00
70.00
80.00
90.00
0 2 4 6 8
Tim
e t
ak
en
/ s
Time / days
Time taken to decolorise KMnO4 by extract of nectarines inclubated with banana, rice
or nothing. Error bars = ± 1 standard deviation
Banana
Ri ce
Control
Banana
Rice
Control
t =x1 - x2
s12
n1
+s2
2
n2

Page 37 of 47
There for there is a significant difference the alternative hypothesis is retained the null hypothesis is rejected. However, this difference is not great, it is only significant to p = 0.01 Standard Reference Curve for Glucose Concentration
Glucose calibration
Glucose / % Time taken / s ± 0.05s
1 280.00
2 194.00
3 150.00
4 126.00
5 115.00
6 105.00
7 96.00
8 91.00
9 87.00
10 83.00
Unfortunately the data obtained was outside of the range of the standard curve so curve could not be used to obtain an estimate of the glucose content of the filtrate.
0
50
100
150
200
250
300
0 2 4 6 8 10
Tim
e t
ak
en
to
de
colo
rise
/ s
Glucose / %
Glucose calibration curve

Page 38 of 47
Error and Limitations It was acknowledged that the method for this experiment contained certain flaws and that the results obtained from the trials were subject to error. Error-reducing methods were implemented where possible. Uncertainties were accounted for and are recorded below:
Identify uncertainty Degree of uncertainty
Stopwatch Reaction time + 0.05 s
3ml syringe + 0.1ml
5ml syringe + 0.1ml
10ml syringe + 0.2ml
Beakers + 1.0ml
Because the glassware used in the experiment was not altered from trial to trial, the level of uncertainty in each trial would have remained constant. Care was taken to measure exact values, for example the amount of water added to the food processor and the volume of sulphuric acid, potassium permanganate solution and nectarine filtrate added to each trial. The stopwatch would have caused the greatest amount of uncertainty in the method as it relied on the reaction time of the person conducting the experiment. While the observer was constant throughout all of the trials, a number of different factors could have affected how quickly the stopwatch was started/stopped and subsequently, the time that was recorded. In improving the method, the 'end-point' could be objectively tested for using colorimetric methods. A standard solution could be passed through the colorimeter and the time taken for the solution to reach a certain percentage of light absorption recorded. Each trial would be tested for in a similar way. Potassium Permanganate, which was used as the indicator solution for this experiment, is a strong oxidising agent. With the ability to convert alkenes to glycols and thereby detect the presence of unsaturated bonds in a solution, the potassium permanganate could have reacted with impurities in the nectarine filtrate. In such a case, this would have affected the results considerably as the time taken for the pink colour of the potassium permanganate solution to disappear might not have been just testing for glucose. Thus the person conducting the experiment was in reality testing for another variable, the metabolism of impurities in the filtrate, which had not been accounted for in the method. In order to reduce this error, another indicator solution, which does not react with impurities to the same extent as potassium permanganate, could be used, for example iodine solution. Deep blue in colour, iodine solution detects the presence of starch in biological samples. Recognising that starch hydrolyses into glucose molecules, iodine could be used to show the concentration of starch in the nectarine filtrate, diminishes with the ripeness of the fruit. Alternatively a specific glucose test such as that used by diabetics could be used. In the method, it was decided that each individual fruit should be tested three times, i.e. the time it took for the pink colour of potassium permanganate solution to disappear

Page 39 of 47
when placed with the filtrate was tested three times using a constant solution. Due to the subjective nature of the 'end-point' test, where we look for a change in colour to indicate the metabolism of carbohydrates to glucose, testing each solution three times limited any error that might be associated to the stirring of the solution and minimised the possibility of outliers in my results. Each repeat was independent of one another, i.e. the nectarines from Day 3 and Day 5 trials had no relation to one another. A variety of different factors, which were not accounted for in this experiment and which could have been present in the repeats, for example the presence of pesticides and artificial ripening agents, or a former exposure to ethene gas, could have influenced the results. In effect, this meant that the method relied on commonalities between all of the nectarines in determining a relationship between the production of ethene gas and glucose concentration. The standard deviations remain reasonable except for the rice packaging treatment on Day 7. In general the standard deviation increased with the duration of the ripening. This might be expected as the fruits will vary at slightly different rates. The abscission zone, or the region the closest to the stem of the fruit, has been shown to contain higher concentrations of glucose5. In order to minimise this factor, when pulverising the nectarines into a filtrate, the person conducting the experiment made use of all of the flesh of all the nectarines. This meant that the variation of glucose concentration within the fruit would remain constant throughout the experiment. The biodegradation process, whereby microbes chemically digest materials, was one of the largest sources of error in this experiment. Mould, which develops as a result of an excess of moisture in an environment, was observed on all nectarines in the banana and rice trials after Day 5. The extent to which the propagation of mould had on the results can be seen in the calculated standard deviation values for the rice packaging trial. Day 7, in particular, had a massive standard deviation (16.18s), indicating that there was an enormous spread of data. Furthermore, because chance was a major factor in these results, they are not reliable and could probably not be reproduced again. The reproduction of microorganisms is affected by temperature. Therefore, the maintenance of a constant and relatively low (around 15°C) temperature would restrict the development of microorganism reproduction without significantly affecting the temperature required by the ripening process (remembering that the enzymes involved in the conversion of polysaccharides to monosaccharides work within a specific and narrow temperature range). The contamination of the fruit by microbes might be reduced by making sure the fruit is thoroughly cleaned on its surface before use. A sterilisation solution might be used. Certain measures were taken to achieve environmental controls, for example temperature and exposure to light. The experiment was conducted in room temperature
5Studies on locating the signal for fruit abscission in the apple tree. J. Beruter and Ph. Droz, Swiss Federal Research Station for Fruit-Growing, Viticulture and Horticulture, CH-8820 WadenswilSwitzerland, Accepted 8 October 1990- Available online 14 October 2003

Page 40 of 47
conditions, with the temperature of the laboratory being recorded twice each day. It was observed that the temperature fluctuated between 28°C and 29.5°C during the day. No recordings were taken between 3pm and 8am, There would have been great variation at night; however, this could not be controlled by the observer due to practical reasons, ideally, the experiment would be left in a consistently controlled environment, for example an incubator, where a constant temperature could be maintained. The standard reference curve for glucose concentration that was produced proved to be irrelevant for the data. The data obtained was outside of the range of the standard curve. It was not possible to extrapolate the standard curve to cover the range of outcomes and therefore to infer the glucose concentration arising from the experimental trials. A calibration curve using higher concentrations of glucose would have to be reproduced. Due to time constraints each trial was only repeated four times. In order to be able to draw concrete conclusions, 20 repeats would be required. This was taken into account when processing the results and it was acknowledged that any conclusions drawn from this experiment may or may not be wholly accurate. Evaluation and Conclusion
It was hypothesised that the nectarines exposed to the rice-packaging trial would contain the highest concentration of glucose. It was thought that the rice would be conducive to the retention of ethane gas produced by the nectarines themselves around the fruit, hastening the ripening process and increasing the rate at which starch metabolised to glucose. In addition, the rice and nectarine were stored in a container from which air had not been removed. By contrast, the air had been removed from the plastic bags containing the fruit from the other two trials. It is possible that the higher concentration of oxygen in the box would have helped promote the metabolic process and the propagation of mould. Bananas are used in both traditional and industrial situations to induce the ripening of fruit, due to their ethene-producing characteristics. This assertion, however, cannot be seen in the results. Whilst the bananas might have produced a small amount of ethene, on Day 7 of the experiment the control trial had a higher concentration of glucose though the results are not very different from the banana treatment though this difference is significant according to the t-test carried out on these data. The fact that the nectarines placed into plastic bags individually ripened at a faster rate than the nectarines that were placed with the bananas points to two possible conclusions. Firstly, methodological error meant that the conditions in which the bananas were placed were not conducive to the production of ethene. Or, secondly, that the nectarines used in the control trial were affected by factors that were not accounted for in this experiment, for example they contained higher concentrations of glucose at the beginning of the experiment. It can be seen in Figure 1 that in all three of the trials the nectarines increased their glucose concentration at a similar rate from Day 1 to Day 3. We can thus assume that in

Page 41 of 47
this time period, the nectarines metabolised starch at a similar rate and produced similar amounts of ethene gas. It can be seen in the Qualitative Data Table that on Day 3 there were no definitive signs of mould, except on Nectarines 1 and 4 of the banana trial. On Day 5 of the experiment, the banana and controlled trials continued to increase their glucose concentrations at a similar rate, albeit slower than the rate increase from Day 1 to Day 3. The rice packaging trial, however, had continued to increase its glucose concentration at the same rate, demonstrating a linear relationship between the concentration of glucose (y-axis) and time (x-axis). All of the nectarines subjected to these conditions were mouldy and were secreting a white residue. This was not the case with the nectarines in the banana and controlled trials, which showed little to no mould. One can deduce that it was the presence of mould that caused the sharp increase in glucose concentration. The enzymes from the mould are probably hydrolysing the starch of the nectarines. As the nectarines in the banana and controlled trials continued to increase their glucose concentrations from Day 5 to Day 7, the nectarines in the rice packaging trial began to decrease in glucose concentration. Probably consumed by the microbes. At the same time, it was observed that all of the nectarines in this trial had become increasingly mouldy -all were at least 90% covered in mould - and that all nectarines were secreting a white residue. One possible conclusion that can be drawn from this observation is that there exists a 'threshold' whereby the increasing glucose concentration is counteracted by the increasing development of mould colonies. As large starch molecules are metabolised there will be a rise in the concentration of glucose. This process develops parallel to the growth of mould and bacterial colonies, which will feed off the increasing concentration of simple sugars and 'spoil' the fruit. From the results obtained in this experiment, it can be seen that the glucose concentration corresponding to the 29.53 seconds it took for the pink colour of the potassium permanganate solution to disappear is the highest attainable concentration of glucose. After this, the amount of glucose consumed by the microbial colonies outnumbers the amount of glucose being produced by the hydrolysis of starch, and thus a decrease in glucose concentration can be observed. As seen in all three of the trials, the development of mould before this 'threshold' does not have a significant affect on the increasing glucose concentration. The only differentiating factor that could be observed in this experiment was the removal of air (oxygen) from the plastic bags. On Day 5, the controlled and banana trials possessed relatively similar glucose concentrations and in both of these trials, the air had been removed. Therefore it is unlikely that ethene gas produced by the banana was a significant factor in the conversion of starch to glucose. In the rice trial, where air was not removed from the box, the glucose concentration was significantly higher. The hypothesis that the presence of rice caused the ethene to be concentrated around the fruit does not hold up as ethene gas would equally have been retained around the fruit in the control trial. It is more likely that it was the presence of air, and oxygen in particular, that promoted both the growth of mould and the higher glucose concentration.

Page 42 of 47
All of trials produced more or less the same outcome (the final values all lay within a 4 second period except Day 7 of the rice treatment). Qualitatively, all of the nectarines were observed as being rotten and covered in mould. The large standard deviations that were calculated from these results emphasised the wide spread of data around these three points and demonstrated the unreliability of the data on Day 7 of the rice treatment. The R2 values remain high for the control and banana treatment remain high but the rice treatment R2 is lower, reflecting the problems with these fruits. As the nectarines were observed as being covered in mould and at this stage, it was likely that other significant chemical reactions were taking place within the fruits. The rice packaging trial had a standard deviation of 17.8 seconds, producing an error bar that encompassed all of the experimental results of the other trials (see Figure 1). The results of the experiment are in part due to processes that were not initially anticipated. Bibliography J. Beruter and Ph. Droz Studies on locating the signal for fruit abscission in the apple tree., Swiss Federal Research Station for Fruit-Growing, Viticulture and Horticulture, CH-8820 WadenswilSwitzerland, Accepted 8 October 1990- Available online 14 October 2003 Antony Brach and Christopher Perkins 20/01/05 http://www.newton.dep.anl.gov/askasci/bot00/bot00553.htm J.H.LaRue & R.S.Johnson (1989) Peaches Plumbs and Nectarines U Cal Google Books http://books.google.fr/books?id=0EEtgcbJaAIC&pg=PA163&lpg=PA163&dq=starch+in+nectarines&source=bl&ots=8Iab1znGzd&sig=bjD1Nk0gCGTwj3zlbRenFlbREms&hl=en&sa=X&ei=wzo6T_C3LYfL0QWKk42QCw&redir_esc=y#v=onepage&q=starch%20in%20nectarines&f=false Pearson http://mwsu-bio101.ning.com/profiles/b!ogs/the-rnolecu!es-within-you-1 Principles of Biology Webmaster Sean Nash 2011 last visited 06/06/11 Matthew Rogers 14/06/11 http://lifehacker.com/5811686/ripen-fruit-faster-by-burying-it-in-rice

Page 43 of 47
Title of Investigation: Bio TSM 4 Different methods of fruit ripening and the metabolism of starch to
glucose in nectarines Good
Criterion Personal Engagement (2)
Exploration (6)
Analysis (6)
Evaluation (6)
Communication (4)
Total (24)
Achievement level awarded
2 5 5 4 3 19
IA Sample Marking

Page 44 of 47
Exploration: This criterion assesses the extent to which the student establishes the scientific context for
the work, states a clear and focused research question and uses concepts and techniques appropriate to
Diploma level. Where appropriate, this criterion also assesses awareness of safety, environmental, and ethical
considerations.
Mark Descriptor
0 The student’s report does not reach a standard described by the descriptors below.
1-2 The topic of the investigation is identified and a research question of some relevance is
stated but it is not focussed.
The background information provided for the investigation is superficial or of limited
relevance and does not aid the understanding of the context of the investigation.
The methodology of the investigation is only appropriate to address the research
question to a very limited extent since it takes into consideration few of the significant
factors that may influence the relevance, reliability and sufficiency of the collected data.
The report shows evidence of limited awareness of the significant safety, ethical or
environmental issues that are relevant to the methodology of the investigation
3-4 The topic of the investigation is identified and a relevant but not fully focused research
question is described.
The background information provided for the investigation is mainly appropriate and
relevant and aids the understanding of the context of the investigation.
The methodology of the investigation is mainly appropriate to address the research
question but has limitations since it takes into consideration only some of the significant
factors that may influence the relevance, reliability and sufficiency of the collected data.
3
The report shows evidence of some awareness of the significant safety, ethical or
environmental issues that are relevant to the methodology of the investigation.
5-6 The topic of the investigation is identified and a relevant and fully focused research
question is clearly described. 5
The background information provided for the investigation is entirely appropriate and
relevant and enhances the understanding of the context of the investigation. 5
The methodology of the investigation is highly appropriate to address the research
question because it takes into consideration all, or nearly all, of the significant factors
that may influence the relevance, reliability and sufficiency of the collected data.
The report shows evidence of full awareness of the significant safety, ethical or
environmental issues that are relevant to the methodology of the investigation. 6
Moderators
Award
5
Moderators Comment
The research question is reasonably focussed and relevant background information is
provided. The source of this information is cited in footnotes. The methodology is appropriate
but it probably would not result in determining the glucose concentrations that the student is
after and there is not attempt to establish that starch is there initially.

Page 45 of 47
Analysis: This criterion assesses the extent to which the student’s report provides evidence that the
student has selected, recorded, processed and interpreted the data in ways that are relevant to the
research question and can support a conclusion.
Mark Descriptor
0 The student’s report does not reach a standard described by the descriptors below
1-2 The report includes insufficient relevant raw data to support a valid conclusion to
the research question.
Some basic data processing is carried out but is either too inaccurate or too
insufficient to lead to a valid conclusion.
The report shows evidence of little consideration of the impact of measurement
uncertainty on the analysis.
The processed data is incorrectly or insufficiently interpreted so that the conclusion is
invalid or very incomplete.
3-4 The report includes relevant but incomplete quantitative and qualitative raw data
that could support a simple or partially valid conclusion to the research question.
Appropriate and sufficient data processing is carried out that could lead to a broadly
valid conclusion but there are significant inaccuracies and inconsistencies in the
processing.
The report shows evidence of some consideration of the impact of measurement
uncertainty on the analysis
The processed data is interpreted so that a broadly valid but incomplete or limited
conclusion to the research question can be deduced. 4
The report includes sufficient relevant quantitative and qualitative raw data that
could support a detailed and valid conclusion to the research question. 5
Appropriate and sufficient data processing is carried out with the accuracy required
to enable a conclusion to the research question to be drawn that is fully consistent
with the experimental data. 5
The report shows evidence of full and appropriate consideration of the impact of
measurement uncertainty on the analysis. 5
The processed data is correctly interpreted so that a completely valid and detailed
conclusion to the research question can be deduced
Moderators
Award
5
Moderators Comment
The report includes sufficient relevant data (both quantitative and qualitative) except for
the measurement of the initial glucose content where more samples ought to have been
taken and it is a shame the calibration curve was not extended to include the
experimental data in its range. The candidate's interpretation is a logical one given the

Page 46 of 47
evidence available (significant decomposition of the fruit).
Evaluation: This criterion assesses the extent to which the student’s report provides evidence of
evaluation of the investigation and the results with regard to the research question and the accepted
scientific context.
Mark Descriptor
0 The student’s report does not reach a standard described by the descriptors below.
1-2 A conclusion is outlined which is not relevant to the research question or is not
supported by the data presented.
The conclusion makes superficial comparison to the accepted scientific context.
Strengths and weaknesses of the investigation, such as limitations of the data and sources
of error, are outlined but are restricted to an account of the practical or procedural
issues faced.
The student has outlined very few realistic and relevant suggestions for the improvement
and extension of the investigation.
3-4 A conclusion is described which is relevant to the research question and supported by the
data presented. 4
A conclusion is described which makes some relevant comparison to the accepted
scientific context. 4
Strengths and weaknesses of the investigation, such as limitations of the data and sources
of error, are described and provide evidence of some awareness of the methodological
issues* involved in establishing the conclusion.
The student has described some realistic and relevant suggestions for the improvement
and extension of the investigation.
5-6 A conclusion is described and justified which is relevant to the research question and
supported by the data presented.
A conclusion is correctly described and justified through relevant comparison to the
accepted scientific context.
Strengths and weaknesses of the investigation, such as limitations of the data and sources
of error, are discussed and provide evidence of a clear understanding of the
methodological issues* involved in establishing the conclusion. 5
The student has discussed realistic and relevant suggestions for the improvement and
extension of the investigation. 5
Moderators
Award
Moderators Comment
Despite an experiment that did not turn out as expected, there is very good evidence of
insightful and reflective approach resulting in a reasonably sound conclusion. The main

Page 47 of 47
4 weakness comes in the initial assumption that the test will detect glucose production only.
Communication: This criterion assesses whether the investigation is presented and reported in a way
that supports effective communication of the focus, process and outcomes.
Mark Descriptor
0 The student’s report does not reach a standard described by the descriptors below.
1-2 The presentation of the investigation is unclear, making it difficult to understand the focus,
process and outcomes.
The report is not well structured and is unclear: The necessary information on focus,
process and outcomes is missing or is presented in an incoherent or disorganized way.
The understanding of the focus, process and outcomes of the investigation is obscured by
the presence of inappropriate or irrelevant information.
There are many errors in the use of subject specific terminology and conventions*.
3-4 The presentation of the investigation is clear. Any errors do not hamper understanding of
the focus, process and outcomes.
The report is well structured and clear: the necessary information on focus, process and
outcomes is present and presented in a coherent way. 4
The report is relevant and concise thereby facilitating a ready understanding of the focus,
process and outcomes of the investigation. 3
The use of subject specific terminology and conventions is appropriate and correct. Any
errors do not hamper understanding. 3
Moderators
Award
3
Moderators Comment
The report is well structured providing the necessary information. It could be a more concise
(there is a bit of repetition). The terminology is globally correct with a few errors and the
conventions are correctly applied in tables and graphs.