bioinformatics and brain imaging: recent...
TRANSCRIPT

BIOINFORMATICS AND BRAIN IMAGING:RECENT ADVANCES AND NEUROSCIENCE APPLICATIONS
Paul M. Thompson, Ph.D.
Assistant Professor of NeurologyLaboratory of Neuro Imaging, Brain Mapping Division and Brain Research Institute
UCLA School of Medicine, Los Angeles [email protected]
http://www.loni.ucla.edu/~thompson/thompson.html
Tutorial Chapter for a Short Course in Bioinformatics (Robert W. Williams, Organizer)Society for Neuroscience, Orlando, FL, Nov. 2-7, 2002.
ABSTRACT
This chapter reviews some exciting new techniques for analyzing brain imaging data. We describe computeralgorithms that can discover patterns of brain structure and function associated with Alzheimer’s disease,schizophrenia, and normal and abnormal brain development, based on imaging data collected in largehuman populations. Extraordinary patterns can be discovered with these techniques: dynamic brain mapsreveal how the brain grows in childhood, and how it changes in disease, or responds to medication. Geneticbrain maps reveal which aspects of brain structure are inherited, shedding light on the nature/nurturedebate. They also identify deficit patterns in those at genetic risk for disease. Probabilistic brain atlasesnow store thousands of these brain maps, models, and images, collected with an array of imaging devices(MRI/fMRI, PET, 3D cryosection imaging, histology). These atlases capture how the brain varies with age,gender, demographics, and in disease. They relate these variations to cognitive, therapeutic, and geneticparameters. With the appropriate computational tools, these atlases can be stratified to create averagemaps of brain structure in different diseases, revealing unsuspected features. We describe the tools t ointeract with these atlases. We also review some of the technical and conceptual challenges in comparingbrain data across large populations, highlighting some key neuroscience applications.
Introduction
The last few years has seen an explosion in the scope and scale of brain imaging studies. Imagingtechnology has rapidly advanced (see Fig. 1) and so have the computational methods to analyze images.Patterns of brain structure associated with the major diseases of the brain can be visualized and analyzed.Brain changes over time can be tracked with unprecedented sensitivity, shedding light on development anddisease. Dynamic effects of drug treatment on the brain can also be mapped. In the near future, a secondrevolution in our understanding will come from the merging of large-scale neuroimaging and large-scalegenetic studies. These advances will capitalize on sophisticated techniques from both disciplines.
We briefly describe a set of algorithms to detect and visualize effects of disease and genetic factors on thebrain. We explain some of the processing steps that occur in a typical neuroscience study, for creatingmaps and models on the brain. Analysis steps that were recently carried out only on high-performanceworkstations are now within the reach of most desktop computers. Nonetheless, some computer-intensiveanalyses involve hundreds or even thousands of subjects. For these, supercomputing technology isincreasingly used. Image processing tasks can now be executed over high-speed networks, using client-server pipelines, bringing the power of parallel computers to a desktop machine.

Brain Variations. Somechallenges in brain imaging aremathematical and statistical aswell. Brain structure is extremelycomplex and variable acrosssubjects. The cerebral cortex, forexample, is the target of mostfunctional and structural imagingstudies. Nonetheless, gyralpatterning variations make itdifficult to compare brain datafrom one individual to another.Neuroimaging studies nowtypically use mathematics basedon random field theory, partialdifferential equations (PDEs),differential geometry and imageprocessing to encode anatomic orfunctional variations in a subjectgroup. This disentangles structuraland functional differences fromnormal variations. Below we showsome examples where population-specific patterns of corticalorganization, asymmetry, anddisease-specific trends areresolved that are not apparent inindividual brain images.
Aligning Data to a Brain Atlas.
The first step in most structural(or functional) brain imaginganalyses is to align individualbrain scans to match a
standardized template of anatomy, or brain atlas.
Brain atlases (e.g. [1,2,3]) provide a structural framework in which individual brain maps can beintegrated. Most brain atlases are based on a detailed representation of a single subject’s anatomy in astandardized 3D coordinate system, or stereotaxic space. The chosen data set acts as a template on whichother brain maps (such as functional images) can be overlaid. The anatomic data provides the additionaldetail necessary to accurately localize activation sites, as well as providing other structural perspectivessuch as chemoarchitecture. Digital mapping of structural and functional image data into a common 3Dcoordinate space is a prerequisite for many types of brain imaging research, as it supplies a quantitativespatial reference system in which brain data from multiple subjects and modalities can be compared andcorrelated.
In atlases, spatial normalization systems are typically employed to reference a given brain with an atlasbrain [1]. This allows individual data to be superimposed on the data in the atlas - in other words, to betransformed to match the space occupied by the atlas. While stereotaxic methods provide a commoncoordinate system for pooling activation data and multi-subject comparisons, the accuracy and utility ofthe atlas is equally dependent on the anatomical template itself [4]. The Talairach atlas was initially widelyused in international brain imaging studies. Designed as a coordinate based reference system forneurosurgical studies, the Talairach templates were based on post mortem brain sections from a 60 year-old
Figure 1: Diversity of Brain Maps. Rapid advances in imaging technology havemade it possible to create comprehensive maps of brain structure and function,with a broad range of imaging devices, and at a variety of spatial scales. Maps ofbrain structure are typically based upon 3D tomographic images - magneticresonance images (MRI), computerized axial tomography (CAT) scans, or anatomicspecimens (cryo). A variety of histologic preparations (histo) can also revealcytoarchitecture and regional molecular content such as myelination patterns,receptor binding sites, protein densities and mRNA distributions. Other brainmaps have concentrated on function, quantified by positron emission tomography(PET), functional MRI, optical intrinsic signal imaging (OIS) or electrophysiology.Additional maps have been developed to represent neuronal connectivity andcircuitry, based on compilations of empirical evidence. This diverse array ofphenotypes will ultimately be correlated with changes in gene expression (bottomright).

female subject. This poorlyreflects the in vivo anatomy ofsubjects in activation studies.Atlas plates from orthogonalplanes were also inconsistent.To address these limitations, acomposite MRI dataset (see Fig.2; ICBM template) wasconstructed from young normalsubjects whose scans wereindividually mapped into theTalairach system by lineartransformation, intensitynormalized, and averaged on avoxel-by-voxel basis [5]. Thisaverage intensity template ispart of the widely usedStatistical Parametric Mappingpackage (SPM; [6]). Automatedmethods can be used t ooptimally align new MR andPET data with this template(see Fig. 2, step 1). These tunethe parameters of thealignment transformation(typically rotations,translations, scales, and shears)to maximize a measure ofintensity similarity between thescan being aligned and thetarget. The similarity measureis typically 3D cross-correlation [7], squaredintensity mismatch [8,9], ormutual information [10,11];(see [12], for practicaldifferences in theseapproaches).
Any alignment defined for onemodality, such as MRI, can beidentically applied to another
modality, such as PET, if a previous cross-modality intrasubject registration has been performed [8].
Population-Based Atlases. After aligning data into a stereotaxic coordinate space, anatomical structurescan be referred to in standardized coordinates. Digital models of brain structures can also be built, and theirboundary coordinates stored as a list of 3D locations in stereotaxic space. These coordinates provide aninternational standard for reporting imaging findings, such as functional activation sites, or maps ofstructural differences. However, even in stereotaxic space, brain structures vary from one individual t oanother in every metric: shape, size, complexity, and orientations relative to one another. To helpunderstand this variation and resolve typical anatomic patterns, it would be ideal if an averagerepresentation of brain structure could be developed for a particular subject group, such as patients withdementia or schizophrenia. Normal anatomic variations relative to this average could then be encodedstatistically, and used to map regions of significant abnormality in disease. Probabilistic brain atlases
Figure 2: Creating Brain Maps and Anatomical Models. An image analysispipeline [12] is shown here. It can be used to create maps that reveal how brainstructure varies in large populations, differs in disease, and is modulated bygenetic or therapeutic factors. This approach aligns new 3D MRI scans frompatients and controls (1) with an average brain template based on a population(here the ICBM template is used, developed by the International Consortium forBrain Mapping [5]). Tissue classification algorithms then generate maps of graymatter, white matter and CSF (2). To help compare cortical features from subjectswhose anatomy differs, individual gyral patterns are flattened (3) and aligned witha group average gyral pattern (4). If a color code indexing 3D cortical locations i sflowed along with the same deformation field (5), a crisp group average model ofthe cortex can be made (6), relative to which individual gyral pattern differences(7), group variability (8) and cortical asymmetry (9) can be computed. Onceindividual gyral patterns are aligned to the mean template, differences in graymatter distribution or thickness (10) can be mapped, pooling data fromhomologous regions of cortex. Correlations can be mapped between disease-relateddeficits and genetic risk factors (11). Maps may also be generated visualizinglinkages between deficits and clinical symptoms, cognitive scores, and medicationeffects.
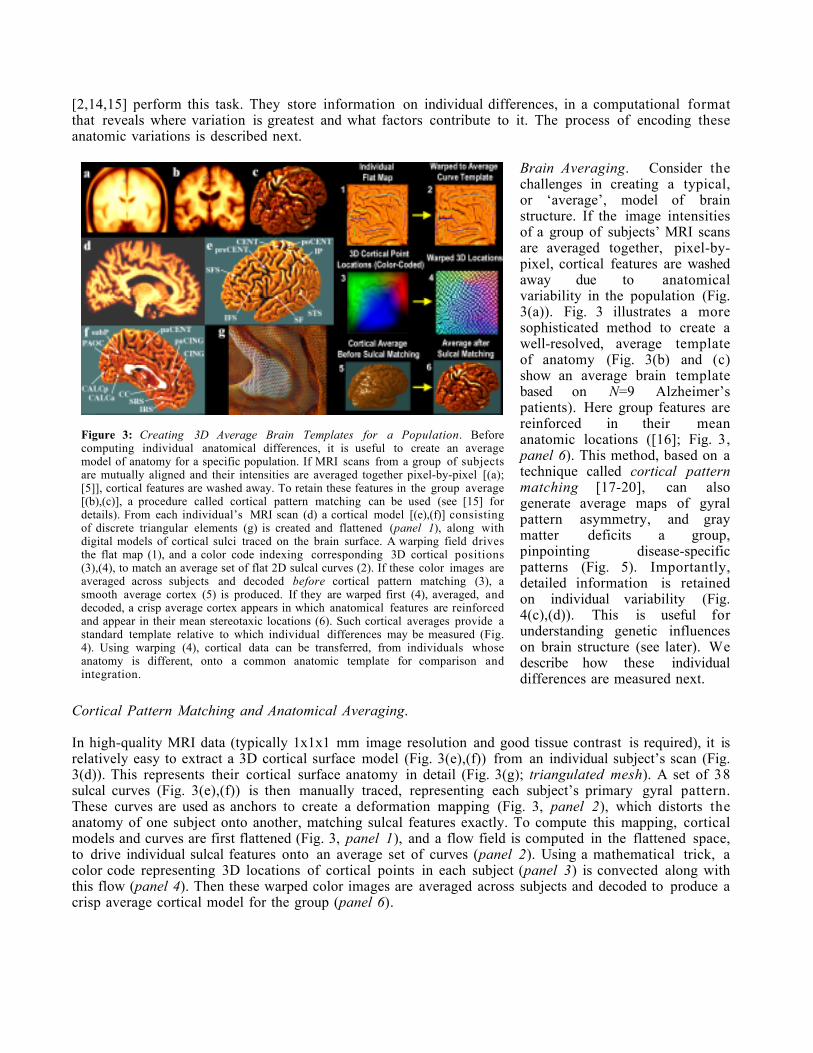
[2,14,15] perform this task. They store information on individual differences, in a computational formatthat reveals where variation is greatest and what factors contribute to it. The process of encoding theseanatomic variations is described next.
Brain Averaging. Consider thechallenges in creating a typical,or ‘average’, model of brainstructure. If the image intensitiesof a group of subjects’ MRI scansare averaged together, pixel-by-pixel, cortical features are washedaway due to anatomicalvariability in the population (Fig.3(a)). Fig. 3 illustrates a moresophisticated method to create awell-resolved, average templateof anatomy (Fig. 3(b) and (c)show an average brain templatebased on N=9 Alzheimer’spatients). Here group features arereinforced in their meananatomic locations ([16]; Fig. 3,panel 6). This method, based on atechnique called cortical patternmatching [17-20], can alsogenerate average maps of gyralpattern asymmetry, and graymatter deficits a group,pinpointing disease-specificpatterns (Fig. 5). Importantly,detailed information is retainedon individual variability (Fig.4(c),(d)). This is useful forunderstanding genetic influenceson brain structure (see later). Wedescribe how these individualdifferences are measured next.
Cortical Pattern Matching and Anatomical Averaging.
In high-quality MRI data (typically 1x1x1 mm image resolution and good tissue contrast is required), it isrelatively easy to extract a 3D cortical surface model (Fig. 3(e),(f)) from an individual subject’s scan (Fig.3(d)). This represents their cortical surface anatomy in detail (Fig. 3(g); triangulated mesh). A set of 38sulcal curves (Fig. 3(e),(f)) is then manually traced, representing each subject’s primary gyral pattern.These curves are used as anchors to create a deformation mapping (Fig. 3, panel 2), which distorts theanatomy of one subject onto another, matching sulcal features exactly. To compute this mapping, corticalmodels and curves are first flattened (Fig. 3, panel 1), and a flow field is computed in the flattened space,to drive individual sulcal features onto an average set of curves (panel 2). Using a mathematical trick, acolor code representing 3D locations of cortical points in each subject (panel 3) is convected along withthis flow (panel 4). Then these warped color images are averaged across subjects and decoded to produce acrisp average cortical model for the group (panel 6).
Figure 3: Creating 3D Average Brain Templates for a Population. Beforecomputing individual anatomical differences, it is useful to create an averagemodel of anatomy for a specific population. If MRI scans from a group of subjectsare mutually aligned and their intensities are averaged together pixel-by-pixel [(a);[5]], cortical features are washed away. To retain these features in the group average[(b),(c)], a procedure called cortical pattern matching can be used (see [15] fordetails). From each individual’s MRI scan (d) a cortical model [(e),(f)] consistingof discrete triangular elements (g) is created and flattened (panel 1), along withdigital models of cortical sulci traced on the brain surface. A warping field drivesthe flat map (1), and a color code indexing corresponding 3D cortical positions(3),(4), to match an average set of flat 2D sulcal curves (2). If these color images areaveraged across subjects and decoded before cortical pattern matching (3), asmooth average cortex (5) is produced. If they are warped first (4), averaged, anddecoded, a crisp average cortex appears in which anatomical features are reinforcedand appear in their mean stereotaxic locations (6). Such cortical averages provide astandard template relative to which individual differences may be measured (Fig.4). Using warping (4), cortical data can be transferred, from individuals whoseanatomy is different, onto a common anatomic template for comparison andintegration.

Measuring Individual Brain Differences. Thesedeformation maps represent the complexdistortion required to match one cortex to agroup average (Fig. 4(a),(b)). They also storelocal information on individual differences ingyral patterns. In a normal population, theamount of variability can be mapped byconverting these differences into local measuresof variance (3D r.m.s. deviation from theaverage anatomy). Gyral pattern variation isfound to be greatest in perisylvian language-related cortices (red colors, Fig. 4(c)).Directional biases in gyral pattern variation canalso be visualized (elongated ellipsoids, Fig. 4(d)).Group features of anatomy also emerge that arenot apparent in individual subjects. The atlaslocalizes a prominent asymmetry in perisylviancortices: right hemisphere structures are, onaverage, torqued forward relative to theircounterparts on the left ([21]; see Fig. 4(e),(f)).
Gray Matter Differences. Among the structuralfeatures that are genetically regulated and haveimplications for cortical function is thedistribution of gray matter across the cortex.This varies widely across normal individuals, withdevelopmental waves of gray matter gain and losssubsiding by adulthood [22,23]. Complex deficitpatterns are observed in Alzheimer’s disease,schizophrenia [24,13], and healthy subjects atgenetic risk for these disorders [25]. Figure 3shows the average profile of gray matter deficitsin early Alzheimer’s disease, based on MRI datafrom 26 AD patients and 20 healthy controls.To produce these maps, a tissue classifier createsmaps of gray matter (green colors, Fig. 5(a)) ineach subject. This type of algorithm separatesthe voxels of an MRI scan into gray matter,white matter, and CSF, and a background (non-brain) class, typically by computing parametersof their intensity distributions. Rather thancompute cortical thickness, which is extremelydifficult in MRI data, a related measure, termed‘gray matter density’ is more commonly used
[26,24,9]. This describes the proportion of pixels segmenting as gray matter in a small spherical regionaround each cortical point. By storing individual variations in gray matter density at each cortical point,differences between the diseased group and the healthy control group can be expressed as a percentagedeficit, or as a significance map (Fig. 5(c)). Significance maps report the results of a statistical test,assessing the evidence for a group difference, at each cortical point; they plot these results in color as acolor-coded map. An advantage of this approach relative to volumetric studies is the ability to localizeeffects on brain structure in the form of a map. When trying to detect systematic effects on brainstructure, cortical pattern matching also increases signal to noise by associating gray matter measures fromcorresponding cortical regions; this also adjusts for shape changes in longitudinal studies (Fig. 5(d),(e)). Inthe resulting maps, regions of comparatively spared tissue may appear sharply delimited from regions with
Figure 4: Measuring Individual Brain Differences andPopulation Variability. When a individual brain (brown mesh,(a)) is globally aligned and scaled to match a group averagecortical model (white surface), a 3D deformation is computed tomatch its gyral anatomy with the group average (pink colors:large deformations, (b)). The 3D root mean square magnitude ofthese deformation vectors (variability map, (c)) shows thatgyral pattern variability is greatest in perisylvian languageareas (red colors). 3D confidence regions for gyral variationscan be also stored locally to detect cortical abnormalities ((d),[14]). Ellipsoids, (d), are elongated along directions in whichnormal variation is greatest; pink colors denote greatestanatomic variation. Deformations that match the gyral anatomyof one hemisphere with a reflected version of the oppositehemisphere can be averaged across subjects to detect anatomicasymmetries. These are greatest in perisylvian cortices (redcolors, (e),(f); [13]; Geschwind and Levitsky [21] first observedthis feature in a volumetric study). All these maps providedetailed structural phenotypes that can be mined for geneticinfluences. The maps shown here are based on a group of 20healthy elderly subjects, but can be recomputed for anypopulation.

significant loss (Fig. 5(b)) or progressive loss (Fig. 5(d),(e)).
Genetic Influences on Brain Structure. Specialized methods have also been developed to assess how genesand environment affect brain function. Typically the goal is to shed light on the mechanism andtransmission of disease, or to help understand the effects of genes and environmental factors on cognitive
skills and behavior. Brainmapping methods to assessindividual differences can also beapplied to help test behavioralgenetic models of individualvariation. Rather than displaystatistics that describe thesignificance of disease effects onbrain structure, genetic modelstypically describe the proportionof variability in brain structurethat is due to genetic factors,environmental factors, or theirinteraction (see [27] for areview). Estimated modelparameters, their error variance,and their goodness of fit (e.g. c2)may also be displayed as color-coded maps, as well as simplermeasures of intraclasscorrelations and heritabilitycoefficients, which are describednext.
Genetic Brain Maps. Fig. 6 shows the intraclass correlations in gray matter (Fig. 6, left columns) ingroups of monozygotic (MZ) and dizygotic (DZ) twins. Note that this type of map captures individualdifferences. In a sense it is the opposite of the group average maps, which map patterns that characterize agroup overall. These maps were computed as part of a study to determine genetic influences on brainstructure [29,27,30]. Genetic influences on any trait are typically estimated by measuring similaritiesamong relatives with different degrees of genetic affinity. Here the measured trait is gray matter
distribution, but the methods arethe same as those for estimatingthe heritability of height, weight,or a particular disease such asschizophrenia or autism. In theclassical twin design, a feature isregarded as heritable if it shows agenetic cascade in which within-pair correlations (typically calledintraclass correlations, or ICCs)are higher for pairs of MZ twins(who share all their genes, exceptfor rare somatic mutations), andlower for same-sex DZ twin pairs(who on average share half theirgenes). Falconer’s method [31]computes heritability as twice thedifference between these
Figure 5: Mapping Gray Matter Deficits in a Population. Measures of gray matter(a) can be computed from MRI scans and compared across individuals and groups.Data from corresponding cortical regions are compared using cortical patternmatching (Fig. 3). Patients with mild to moderate Alzheimer’s disease show asevere loss of gray matter [(b),(c)] relative to matched healthy controls, especiallyin temporal cortices (where deficits approach 30% locally – red colors). Patientswith childhood onset schizophrenia show a progressive loss of gray matter,especially in temporal and superior frontal cortices [(d),(e)]. These structuralmeasures are tightly correlated with worsening symptoms [18,28], offering apromising endophenotype (biological marker) for genetic studies. Thesebiological markers are likely to be more directly influenced by genes coding forstructural proteins, regulatory elements, and signaling molecules, than clinicalsymptoms, such as hallucinations or disordered thinking.
Figure 6: Mapping Genetic Influences on Brain Structure: Heritability Maps.Color-coded maps (left columns) show local gray matter correlations between MZand DZ twins. Falconer’s heritability formula [31] is applied to data fromcorresponding cortical regions (within and across twin pairs). The resulting valueof h2, and its significance (lower right panel) is plotted at each cortical point. Notethe significant genetic control in an anatomical band encompassing parietal,sensorimotor, and frontal cortices.

correlations. High values, near 1.0, are found for the most genetically determined traits, and near-zerovalues for traits that are unaffected by individual genetic differences. MZ within-pair gray matterdifferences are almost zero (intraclass r~0.9 and higher, p<0.0001 corrected; Fig. 6, left column) in a broadanatomical band encompassing frontal, sensorimotor and linguistic cortices, including Broca’s speech andWernicke’s language comprehension areas. Since MZ twins are genetically identical (except for raresomatic mutations), any regional differences are attributed to environmental effects or gene-environmentinteractions. The maps show how sensorimotor and parietal occipital, but not frontal, territory issignificantly more similar in DZ twins than random pairs. Affinity is greatest in the MZ pairs, suggesting agenetic continuum in the determination of structure. Middle frontal regions, in the vicinity of Brodmannareas 9 and 46, displayed a 90-95% genetic determination of structure (i.e., h2 ~ 0.90-0.95). Many regionsare under tight genetic control (bilateral frontal and sensorimotor regions, p<0.0001; Fig. 6; right column),and heritability estimates are comparable with twin-based estimates for the most highly genetically-determined human traits, including fingerprint ridge count (h2=0.98), height (h2=0.66-0.92), and systolicblood pressure (h2=0.57).
Permutation Testing. The significance of these statistical genetic brain maps, and the previous maps ofdisease effects, is typically assessed using either parametric or nonparametric methods. In each caseappropriate adjustments must be made for multiple comparisons, as is conventional in functional brainimaging (see [12] for current approaches). These adjustments note that thousands of statistical tests areperformed at different points on the brain surface, but they are certainly not independent tests, as theirresults are highly spatially correlated. Typically, to assess whether an observed pattern of statistics orsignificance values could have occurred by accident, a Monte Carlo simulation is run in which subjects arerandomly assigned to groups. A null distribution is then assessed for the statistic of interest, and the chanceof accidentally finding the pattern that occurred in the experiment is assessed [12]. These operations arecomputer-intensive, and their power is not optimal. The development of analytical formulas for statisticaldistributions on manifolds is therefore an active topic of research, and is likely to empower future brainmapping studies [12,32].
Dynamic Brain Maps
Everyone’s brain shrinks with age, and not in a uniform way. Diseases such as Alzheimer’s cause changes inthe overall rates, and patterns, of brain change. Population-based atlases can store key statistics on therates of these brain changes. These are especially relevant to the understanding of development [33] aswell as relapsing-remitting diseases such as multiple sclerosis and tumor growth [34,35]. They also providenormative criteria for early brain change in patients with dementia [36,37,13], with mild cognitiveimpairment [38], or in those at genetic risk for Alzheimer’s disease [39]. An interesting application is thecompilation of dynamic maps to characterize brain growth in development or degenerative change, whichwe illustrate next.
Tensor Maps of Brain Change. Maps of brain change over time can be created based on a deformationmapping concept. In this approach, a 3D elastic deformation is calculated (Fig. 7). This deformation, orwarping field, drives an image of a subject’s anatomy at a baseline timepoint to match its shape in a laterscan. Dilation and contraction rates, and even the principal directions of growth, are derived by examiningthe eigenvectors of the deformation gradient tensor, or the local Jacobian matrix of the transform thatmaps the earlier anatomy onto the later one. Applications include the mapping of brain growth patterns inchildren [40], measuring tumor response to novel chemotherapy agents [34], and the mapping ofdegenerative rates in Alzheimer’s disease (Fig. 7). By building probability densities on registered tensorfields (e.g. [40]), a quantitative framework can be used to detect normal and aberrant brain change, andhow medication affects these changes in clinical trials (see [16] for a review).

Conclusion
There are numerousimplementations and applicationsof brain maps to studymorphology. Each new approachin brain morphology has thecapacity to measure, visualize,compare and summarize brainimages. There are many varieties,from descriptions of structure t ofunction of the whole brain t omaps of groups or populations.Maps enable comparison acrossindividuals, modalities or states.While dependent uponappropriate coordinate systems,deformation methods andvisualization strategies, accurateand representative brain mapshold enormous promise forhelping to create acomprehensive understanding ofbrain in health and disease. Themerger of methods from imagingand genetics is likely to expeditea second revolution in ourunderstanding of the brain.
Acknowledgments
This work was generously supported by research grants from the National Library of Medicine(LM/MH05639), NCRR (RR13642), and by a Human Brain Project grant known as the InternationalConsortium for Brain Mapping, which is funded jointly by NIMH and NIDA (P20 MH/DA52176). Specialthanks go to Arthur Toga, Tyrone Cannon, Judith Rapoport, Jay Giedd, Michael Mega, Christine Vidal,Kira Hayashi, Katherine Narr, Roger Woods, Elizabeth Sowell, John Mazziotta, David MacDonald, AlanEvans, Greig de Zubicaray, Andrew Janke, and the members of the UCLA Laboratory of Neuro Imagingfor their work and support in these studies. We also thank Jaakko Kaprio and his colleagues for theircollaborative work on our twin project.
Further Reading
Genes, Brain, and Cognitionhttp://www.loni.ucla.edu/~thompson/MEDIA/NN/Press_Release.html
Mapping Brain Growth in Childrenhttp://www.loni.ucla.edu/~thompson/MEDIA/press_release.html
Brain Mapping in Schizophreniahttp://www.loni.ucla.edu/~thompson/MEDIA/PNAS/Press_release.html
References
1. Talairach J, Tournoux P (1988). Co-planar Stereotaxic Atlas of the Human Brain, New York: Thieme.
Figure 7: Tensor Maps of Brain Change: Visualizing Growth and Atrophy. If follow-up (longitudinal) images are available, the dynamics of brain change can be measuredwith tensor mapping approaches [40]. These map volumetric change at a local level,and show local rates of tissue growth or loss. Fastest growth is detected in theisthmus of the corpus callosum in two young girls identically scanned at ages 6 and7 (a), and at ages 9 and 13 (b). Maps of loss rates in tissue can be generated for thedeveloping caudate ((c), here in a 7-11 year old child), and for the degeneratinghippocampus [(d),(e)]. In (e), a female patient with mild Alzheimer’s disease wasimaged at the beginning and end of a 19 month interval with high-resolution MRI.The patient, aged 74.5 years at first scan, exhibits faster tissue loss rates in thehippocampal head (10% per year, during this interval) than in the fornix. These mapscan help elucidate the dynamics of therapeutic response in an individual or apopulation [18,34].

2. Mazziotta JC, Toga AW, Evans AC, Fox P, Lancaster J (1995) A Probabilistic Atlas of the Human Brain: Theory and Rationalefor its Development, NeuroImage 2: 89-101.3. Kikinis R, Shenton ME, Iosifescu DV, McCarley RW, Saiviroonporn P, Hokama HH, Robatino A, Metcalf D, Wible CG, PortasCM, Donnino R, Jolesz F (1996). A Digital Brain Atlas for Surgical Planning, Model-Driven Segmentation, and Teaching, IEEETrans. on Visualization and Comp. Graphics, Sept. 1996, 2(3):232-241.4. Roland PE, Zilles K. The developing European computerized human brain database for all imaging modalities. Neuroimage.1996 Dec;4(3 Pt 2):S39-47.5. Evans AC, Collins DL, Neelin P, MacDonald D, Kamber M, Marrett TS (1994). Three-Dimensional Correlative Imaging:Applications in Human Brain Mapping, in: Functional Neuroimaging: Technical Foundations, Thatcher RW, Hallett M, Zeffiro T,John ER, Huerta M [eds.], 145-162.6. Friston KJ, Holmes AP, Worsley KJ, Poline JP, Frith CD, Frackowiak RSJ (1995). Statistical Parametric Maps in FunctionalImaging: A General Linear Approach, Human Brain Mapping 2:189-210.7. Collins DL, Holmes CJ, Peters TM, Evans AC (1995). Automatic 3D Model-Based Neuroanatomical Segmentation, HumanBrain Mapping 3:190-208.8. Woods RP, Grafton ST, Watson JDG, Sicotte NL, Mazziotta JC (1998). Automated image registration: II. Intersubjectvalidation of linear and nonlinear models. J. Computer Assisted Tomography 1998.9. Ashburner J. Friston KJ. Voxel-based morphometry--the methods. Neuroimage 11, 6:805-21 (2000).10. Viola PA, Wells WM (1995). Alignment by Maximization of Mutual Information, 5th IEEE Int. Conf. on Computer Vision, 16-23, Cambridge, MA.11. Wells WM, Viola P, Atsumi H, Nakajima S, Kikinis R (1997). Multi-Modal Volume Registration by Maximization of MutualInformation, Medical Image Analysis 1(1):35-51.12. Thompson PM et al., Brain Image Analysis and Atlas Construction, in: Fitzpatrick M, Sonka M (ed.), Handbook on MedicalImage Analysis, SPIE Press (2000).13. Thompson PM, Mega MS, Vidal C, Rapoport JL, Toga AW (2001). Detecting Disease-Specific Patterns of Brain Structure usingCortical Pattern Matching and a Population-Based Probabilistic Brain Atlas, IEEE Conference on Information Processing inMedical Imaging (IPMI), UC Davis, 2001, in: Lecture Notes in Computer Science (LNCS) 2082:488-501, M Insana, R Leahy [eds.],Springer-Verlag.14. Thompson PM, MacDonald D, Mega MS, Holmes CJ, Evans AC, Toga AW (1997). Detection and Mapping of Abnormal BrainStructure with a Probabilistic Atlas of Cortical Surfaces, J. Comp. Assist. Tomogr. 21(4):567-581, Jul.-Aug. 1997.15. Thompson PM, Woods RP, Mega MS, Toga AW. Mathematical/computational challenges in creating deformable andprobabilistic atlases of the human brain. Human Brain Mapping 9(2):81-92 (2000).16. Thompson PM, Toga AW (2002). A Framework for Computational Anatomy [Invited Paper], Computing and Visualization inScience, 5:1-12.17. Thompson PM, Toga AW (1996). A Surface-Based Technique for Warping 3-Dimensional Images of the Brain, IEEETransactions on Medical Imaging, Aug. 1996, 15(4):1-16.18. Thompson PM, Hayashi KM, de Zubicaray G, Janke AL, Rose SE, Semple J, Doddrell DM, Cannon TD, Toga AW (2002).Detecting Dynamic and Genetic Effects on Brain Structure using High-Dimensional Cortical Pattern Matching, Proc. InternationalSymposium on Biomedical Imaging (ISBI2002), Washington, DC, July 7-10, 2002.18. Thompson PM, Vidal CN, Giedd JN, Gochman P, Blumenthal J, Nicolson R, Toga AW, Rapoport JL (2001). MappingAdolescent Brain Change Reveals Dynamic Wave of Accelerated Gray Matter Loss in Very Early--Onset Schizophrenia,Proceedings of the National Academy of Sciences of the USA, 98(20):11650-11655, September 25, 2001.19. Davatzikos C (1996). Spatial Normalization of 3D Brain Images using Deformable Models, J. Comp. Assisted Tomography20(4):656-665, Jul.-Aug. 1996.20. Fischl B, Sereno MI, Tootell RBH, Dale AM (1999). High-Resolution Inter-Subject Averaging and a Coordinate System for theCortical Surface, Hum Brain Mapp. 1999;8(4):272-84.21. Geschwind N, Levitsky W. Human brain: left-right asymmetries in temporal speech region. Science. 1968 Jul12;161(837):186-7. Geschwind DH, Miller BL, DeCarli C, Carmelli D. Heritability of lobar brain volumes in twins supportsgenetic models of cerebral laterality and handedness. Proc Natl Acad Sci U S A. 2002 Mar 5;99(5):3176-81.22. Sowell ER et al. In vivo evidence for post-adolescent brain maturation in frontal and striatal regions. Nat. Neurosci.2,10:859-61 (1999).23. Giedd JN et al. Brain development during childhood and adolescence: a longitudinal MRI study. Nat. Neurosci. 2,10:861-3(1999).24. Thompson PM et al. Cortical change in Alzheimer's disease detected with a disease-specific population-based brain atlas.Cerebral Cortex 11, 1-16 (2001). 25. Cannon TD, Thompson PM, van Erp T, Toga AW, Poutanen V-P, Huttunen M, Lönnqvist J, Standertskjöld-Nordenstam C-G,Narr KL, Khaledy M, Zoumalan CI, Dail R, Kaprio J (2002). Cortex Mapping Reveals Regionally Specific Patterns of Genetic andDisease-Specific Gray-Matter Deficits in Twins Discordant for Schizophrenia, Proceedings of the National Academy of Sciences ofthe USA, vol. 99, no. 5: 3228-3233, February 26, 2002.26. Wright IC et al. A voxel-based method for the statistical analysis of gray and white matter density applied to schizophrenia.Neuroimage 2, 4:244-52 (1995).27. Thompson PM, Cannon TD, Toga AW (2002). Mapping Genetic Influences on Human Brain Structure [Review], Annals ofMedicine, 2002.28. Thompson PM, Mega MS, Toga AW (2000). Disease-Specific Brain Atlases, Invited Chapter in: Brain Mapping: TheDisorders, Toga AW, Mazziotta JC [eds.], Academic Press, July 2000.

29. Thompson PM, Cannon TD, Narr KL, van Erp T, Khaledy M, Poutanen V-P, Huttunen M, Lönnqvist J, Standertskjöld-Nordenstam C-G, Kaprio J, Dail R, Zoumalan CI, Toga AW (2001). Genetic Influences on Brain Structure, Nature Neuroscience4(12):1253-8, Dec. 2001.30. Plomin R, Kosslyn SM (2001). Genes, brain and cognition. Nature Neuroscience 4(12):1153-4.31. Falconer DS. Introduction to Quantitative Genetics, Longman, Essex, UK, ed. 3 (1989).32. Taylor JE, Adler RJ. Euler characteristics for Gaussian fields on manifoldshttp://www.math.mcgill.ca/jtaylor/publications/index.html (2002 ).33. Lange N, Giedd JN, Castellanos FX, Vaituzis AC, Rapoport JL (1997). Variability of human brain structure size: ages 4-20years.34. Haney S, Thompson PM, Cloughesy TF, Alger JR, Frew A, Torres-Trejo A, Mazziotta JC, Toga AW (2001). Mapping Responsein a Patient with Malignant Glioma, J. Computer Assisted Tomography, 2001.35. Haney S, Thompson PM, Cloughesy TF, Alger JR, Toga AW (2001). Tracking Tumor Growth Rates in Patients with MalignantGliomas: A Test of Two Algorithms, American Journal of Neuroradiology (AJNR) 22(1):73-82, Jan. 2001.36. Jernigan TL, Archibald SL, Fennema-Notestine C, Gamst AC, Stout JC, Bonner J, Hesselink JR (2001). Effects of age on tissuesand regions of the cerebrum and cerebellum. Neurobiol Aging. 2001 Jul-Aug;22(4):581-94.37. Janke AL, Zubicaray Gd, Rose SE, Griffin M, Chalk JB, Galloway GJ (2001). 4D deformation modeling of cortical diseaseprogression in Alzheimer's dementia. Magn Reson Med. 2001 Oct;46(4):661-6.38. Studholme C, Cardenas V, Schuff N, Rosen H, Miller B, Weiner MW (2001). Detecting Spatially Consistent StructuralDifferences in Alzheimer's and Fronto Temporal Dementia Using Deformation Morphometry. MICCAI 2001, 41-48.39. Small GW, Ercoli LM, Silverman DH, Huang SC, Komo S, et al. Cerebral metabolic and cognitive decline in persons at geneticrisk for Alzheimer's disease. Proc Natl Acad Sci U S A. 2000 May 23;97(11):6037-42.40. Thompson PM, Giedd JN, Woods RP, MacDonald D, Evans AC, Toga AW (2000). Growth Patterns in the Developing BrainDetected By Using Continuum-Mechanical Tensor Maps, Nature, 404:(6774) 190-193, March 9, 2000.…