biodegradation of sulfolane in soil using aerobic … of sulfolane in soil using aerobic biopile...
TRANSCRIPT
Biodegradation of Sulfolane in Soil
Using Aerobic Biopile Technology
Successful Collaboration Between Academia and Industry
– Breaking Open Sulfolane Remediation strategies
Linlong Yu, University of Calgary
Ian Keir, Bonavista Energy Corporation
Schulich School of Engineering
12-Oct-2017
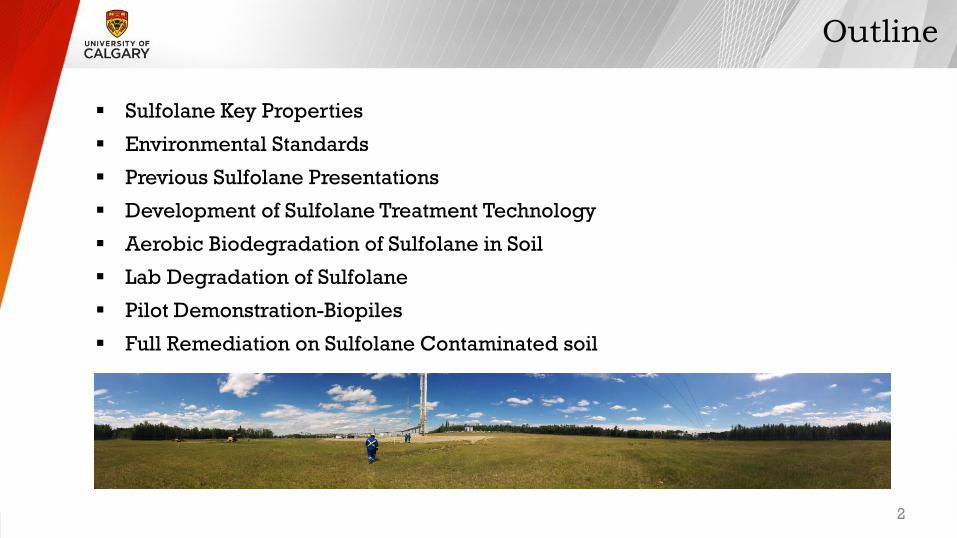
Outline
2
Sulfolane Key Properties
Environmental Standards
Previous Sulfolane Presentations
Development of Sulfolane Treatment Technology
Aerobic Biodegradation of Sulfolane in Soil
Lab Degradation of Sulfolane
Pilot Demonstration-Biopiles
Full Remediation on Sulfolane Contaminated soil
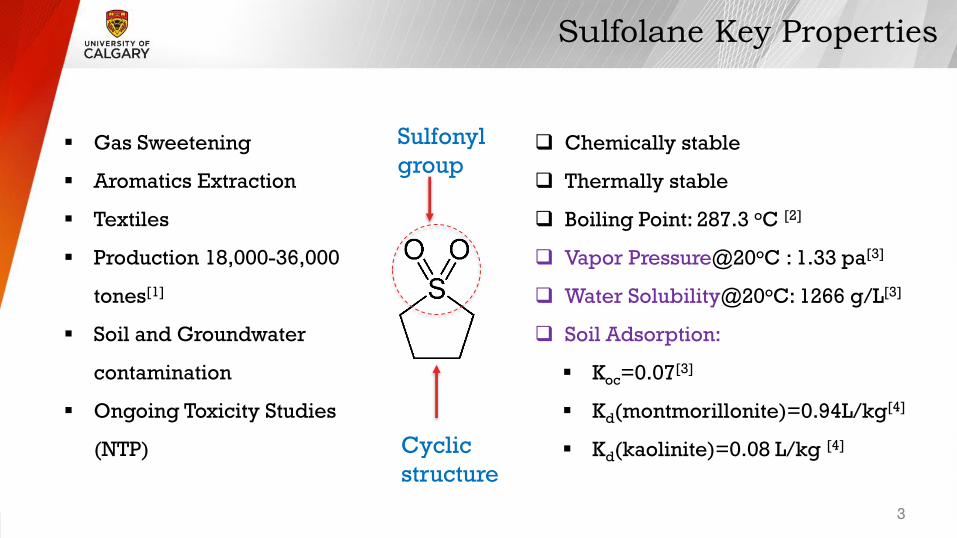
Sulfolane Key Properties
Gas Sweetening
Aromatics Extraction
Textiles
Production 18,000-36,000
tones[1]
Soil and Groundwater
contamination
Ongoing Toxicity Studies
(NTP)
3
Chemically stable
Thermally stable
Boiling Point: 287.3 oC [2]
Vapor Pressure@20oC : 1.33 pa[3]
Water Solubility@20oC: 1266 g/L[3]
Soil Adsorption:
Koc=0.07[3]
Kd(montmorillonite)=0.94L/kg[4]
Kd(kaolinite)=0.08 L/kg [4]
Sulfonyl
group
Cyclic
structure
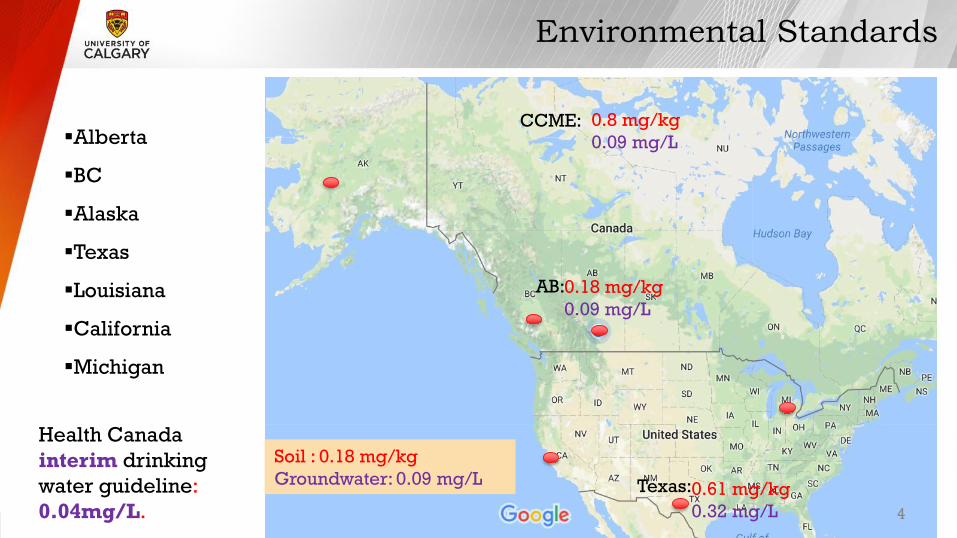
Environmental Standards
4
0.18 mg/kg
0.09 mg/L
Soil : 0.18 mg/kg
Groundwater: 0.09 mg/L
0.8 mg/kg
0.09 mg/LAlberta
BC
Alaska
Texas
Louisiana
California
Michigan
Health Canada
interim drinking
water guideline:
0.04mg/L.0.61 mg/kg
0.32 mg/L
CCME:
AB:
Texas:
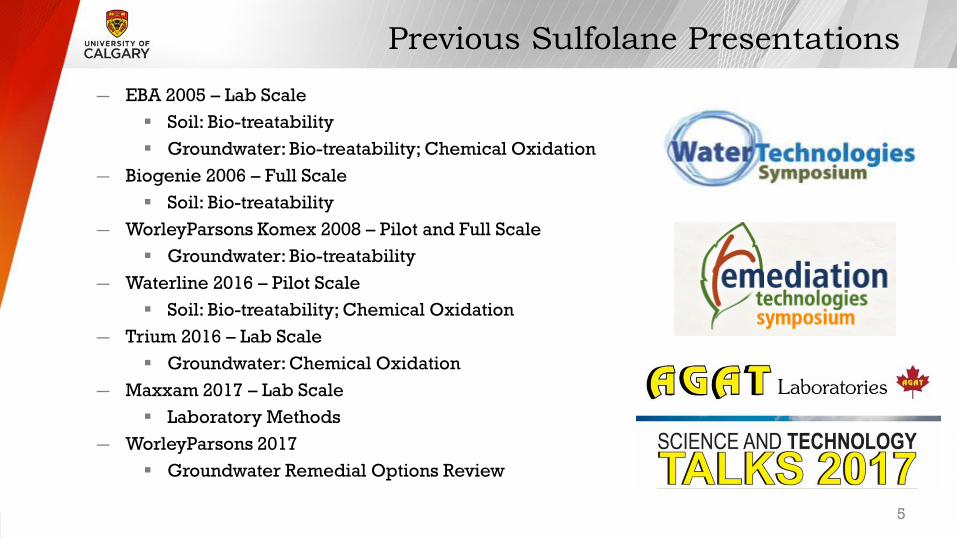
Previous Sulfolane Presentations
— EBA 2005 – Lab Scale
Soil: Bio-treatability
Groundwater: Bio-treatability; Chemical Oxidation
— Biogenie 2006 – Full Scale
Soil: Bio-treatability
— WorleyParsons Komex 2008 – Pilot and Full Scale
Groundwater: Bio-treatability
— Waterline 2016 – Pilot Scale
Soil: Bio-treatability; Chemical Oxidation
— Trium 2016 – Lab Scale
Groundwater: Chemical Oxidation
— Maxxam 2017 – Lab Scale
Laboratory Methods
— WorleyParsons 2017
Groundwater Remedial Options Review
5
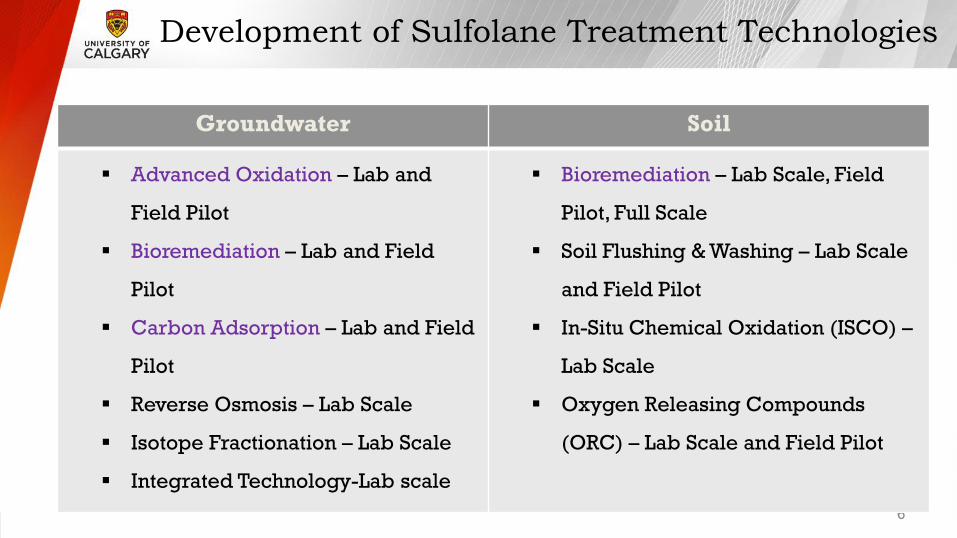
Development of Sulfolane Treatment Technologies
6
Groundwater Soil
Advanced Oxidation – Lab and
Field Pilot
Bioremediation – Lab and Field
Pilot
Carbon Adsorption – Lab and Field
Pilot
Reverse Osmosis – Lab Scale
Isotope Fractionation – Lab Scale
Integrated Technology-Lab scale
Bioremediation – Lab Scale, Field
Pilot, Full Scale
Soil Flushing & Washing – Lab Scale
and Field Pilot
In-Situ Chemical Oxidation (ISCO) –
Lab Scale
Oxygen Releasing Compounds
(ORC) – Lab Scale and Field Pilot
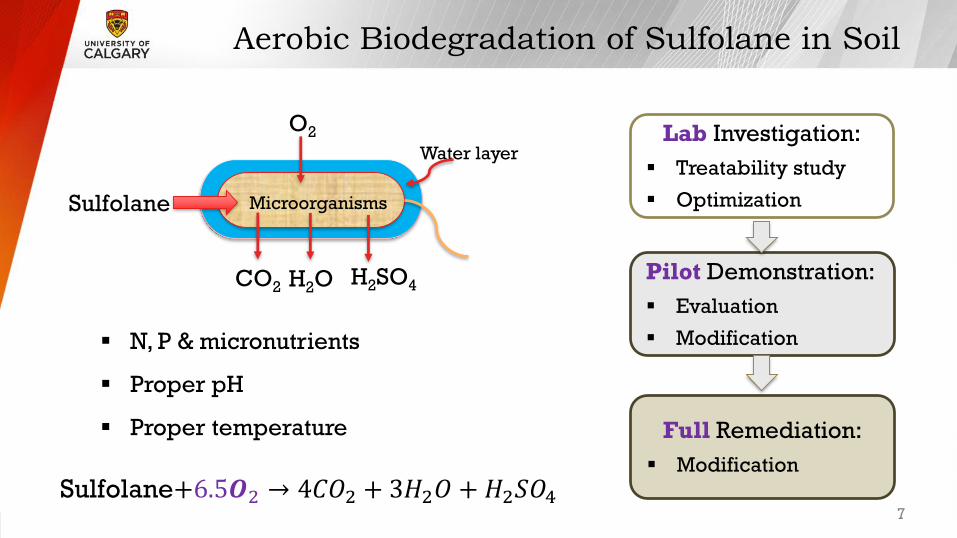
Aerobic Biodegradation of Sulfolane in Soil
N, P & micronutrients
Proper pH
Proper temperature
Sulfolane+6.5𝑶2 → 4𝐶𝑂2 + 3𝐻2𝑂 + 𝐻2𝑆𝑂4
Lab Investigation:
Treatability study
Optimization
Pilot Demonstration:
Evaluation
Modification
Full Remediation:
Modification
7
Sulfolane Microorganisms
O2
CO2 H2O H2SO4
Water layer
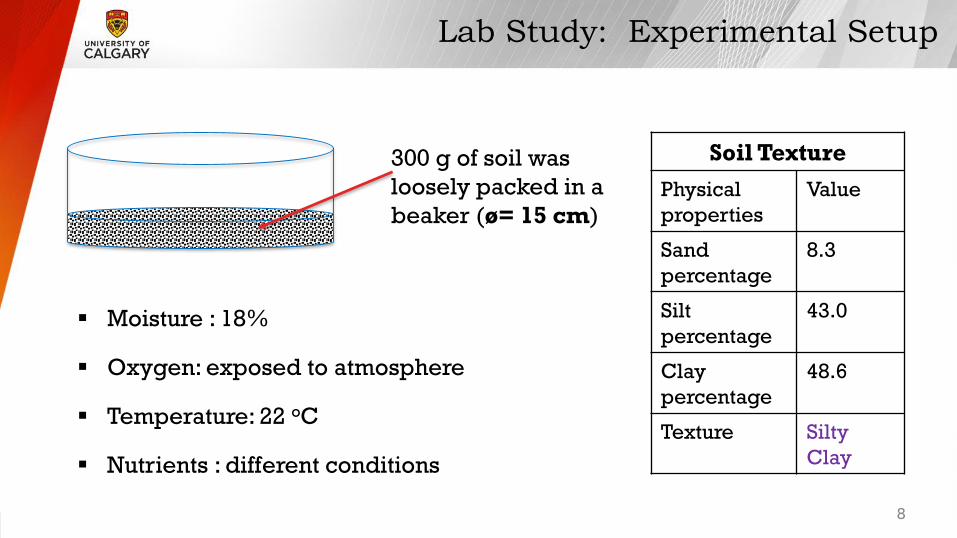
Lab Study: Experimental Setup
Soil Texture
Physical
properties
Value
Sand
percentage
8.3
Silt
percentage
43.0
Clay
percentage
48.6
Texture Silty
Clay
300 g of soil was
loosely packed in a
beaker (ø= 15 cm)
Moisture : 18%
Oxygen: exposed to atmosphere
Temperature: 22 oC
Nutrients : different conditions
8
0
50
100
150
200
250
300
350
Day 0 Day 3 Day 6 Day 13 Day 16
Co
nc
. (m
g/k
g)
Urea +phosphate amendment
Urea amendment
Control
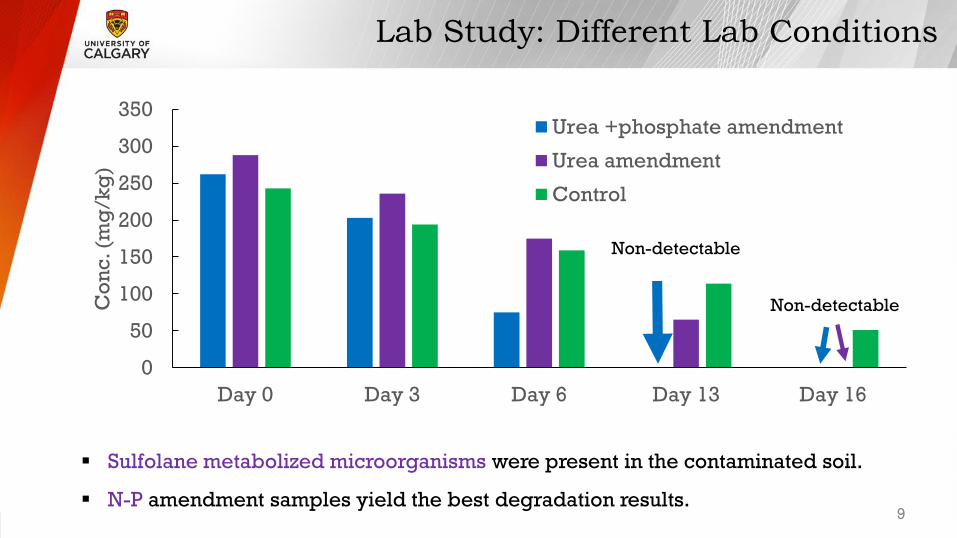
Lab Study: Different Lab Conditions
Sulfolane metabolized microorganisms were present in the contaminated soil.
N-P amendment samples yield the best degradation results.
Non-detectable
Non-detectable
9
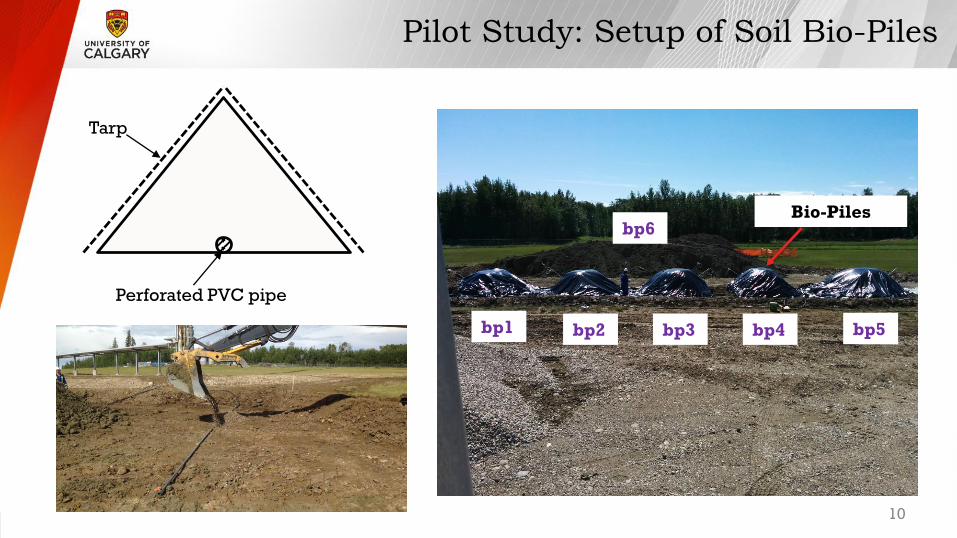
Pilot Study: Setup of Soil Bio-Piles
Tarp
Perforated PVC pipe
bp1 bp2 bp3 bp4 bp5
bp6Bio-Piles
10
Soil
pile
Size of
pile (m3)
Covered
with Tarps
Nutrient Amendment
AerationNitrogen
nutrient
Phosphate
nutrient
Alfalfa
green
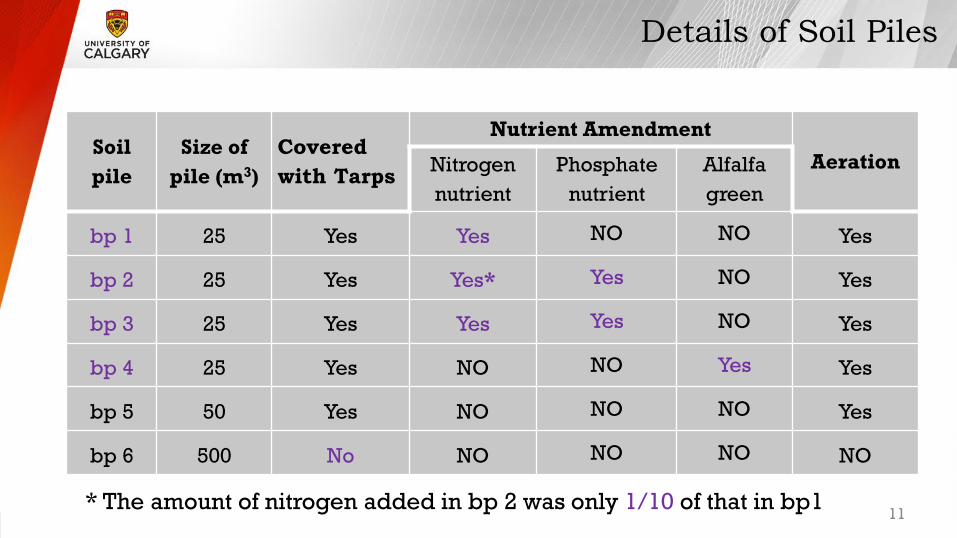
bp 1 25 Yes Yes NO NO Yes
bp 2 25 Yes Yes* Yes NO Yes
bp 3 25 Yes Yes Yes NO Yes
bp 4 25 Yes NO NO Yes Yes
bp 5 50 Yes NO NO NO Yes
bp 6 500 No NO NO NO NO
Details of Soil Piles
* The amount of nitrogen added in bp 2 was only 1/10 of that in bp111
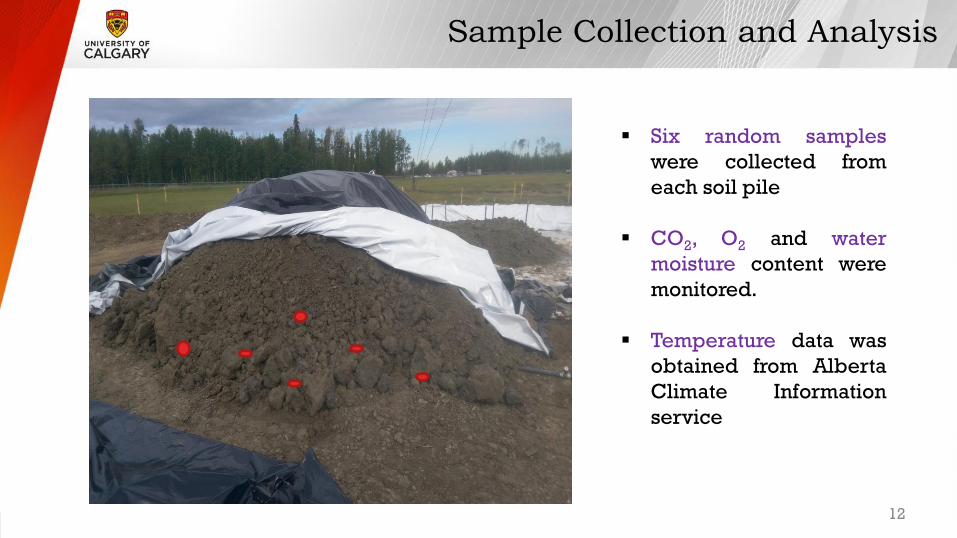
Six random samples
were collected from
each soil pile
CO2, O2 and water
moisture content were
monitored.
Temperature data was
obtained from Alberta
Climate Information
service
Sample Collection and Analysis
12
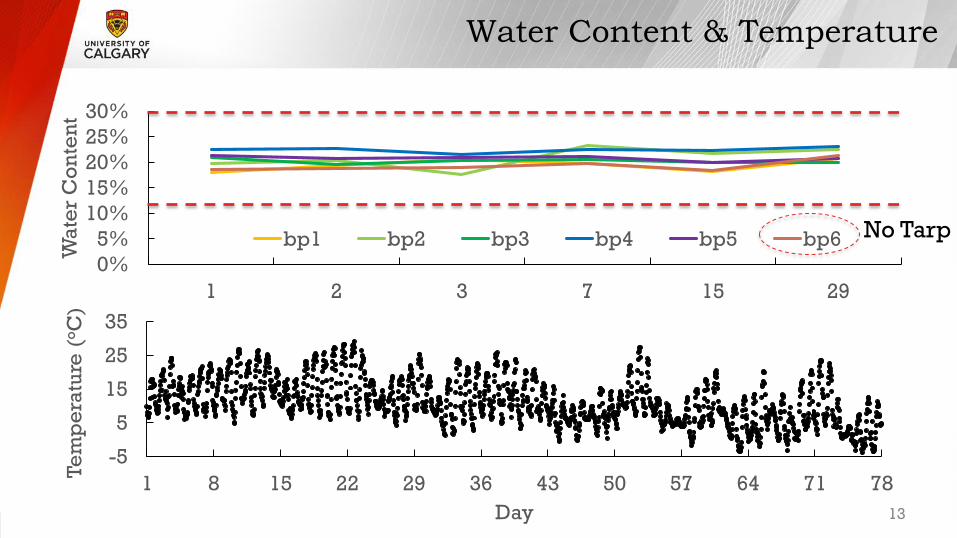
Water Content & Temperature
-5
5
15
25
35
1 8 15 22 29 36 43 50 57 64 71 78
Te
mp
era
ture
(oC
)
Day
0%
5%
10%
15%
20%
25%
30%
1 2 3 7 15 29
Wa
ter
Co
nte
nt
bp1 bp2 bp3 bp4 bp5 bp6
13
No Tarp
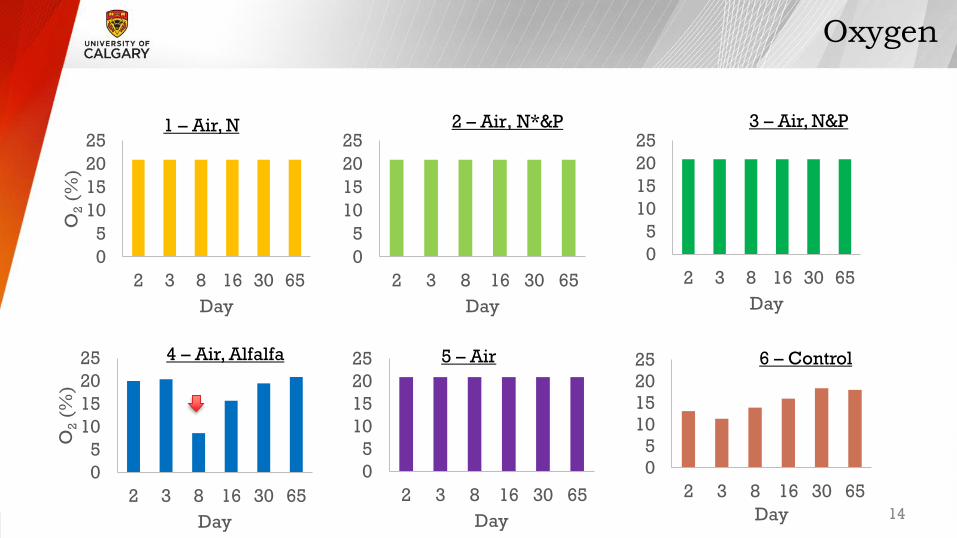
Oxygen
0
5
10
15
20
25
2 3 8 16 30 65
O2
(%)
Day
0
5
10
15
20
25
2 3 8 16 30 65
O2
(%)
Day
0
5
10
15
20
25
2 3 8 16 30 65
Day
0
5
10
15
20
25
2 3 8 16 30 65
Day
2 – Air, N*&P
0
5
10
15
20
25
2 3 8 16 30 65
Day
0
5
10
15
20
25
2 3 8 16 30 65
Day
1 – Air, N 3 – Air, N&P
4 – Air, Alfalfa 5 – Air 6 – Control
14
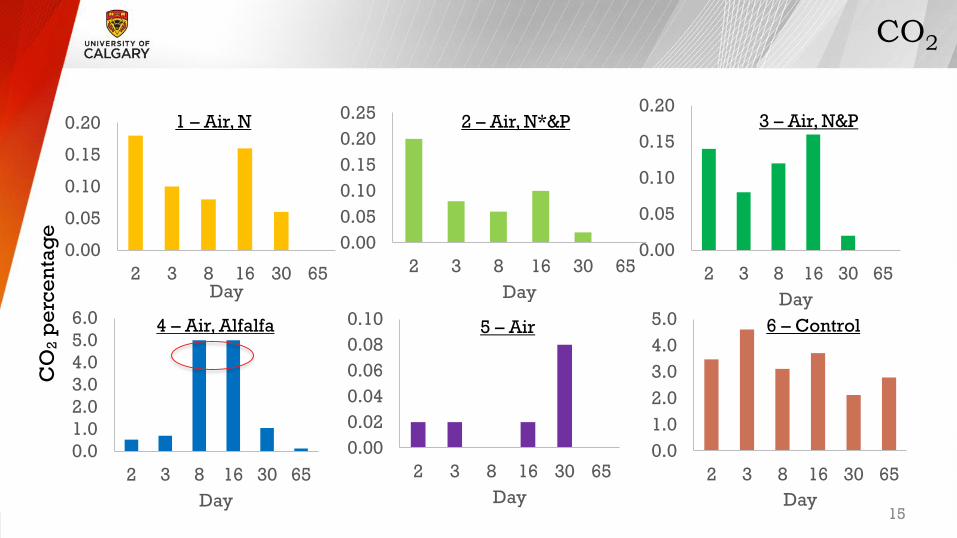
CO2
0.00
0.05
0.10
0.15
0.20
2 3 8 16 30 65Day
0.00
0.05
0.10
0.15
0.20
0.25
2 3 8 16 30 65
Day
2 – Air, N*&P
0.00
0.05
0.10
0.15
0.20
2 3 8 16 30 65
Day
0.0
1.0
2.0
3.0
4.0
5.0
6.0
2 3 8 16 30 65
Day
4 – Air, Alfalfa
0.00
0.02
0.04
0.06
0.08
0.10
2 3 8 16 30 65
Day
5 – Air
0.0
1.0
2.0
3.0
4.0
5.0
2 3 8 16 30 65
Day
6 – Control
CO
2p
erc
en
tag
e
1 – Air, N 3 – Air, N&P
15
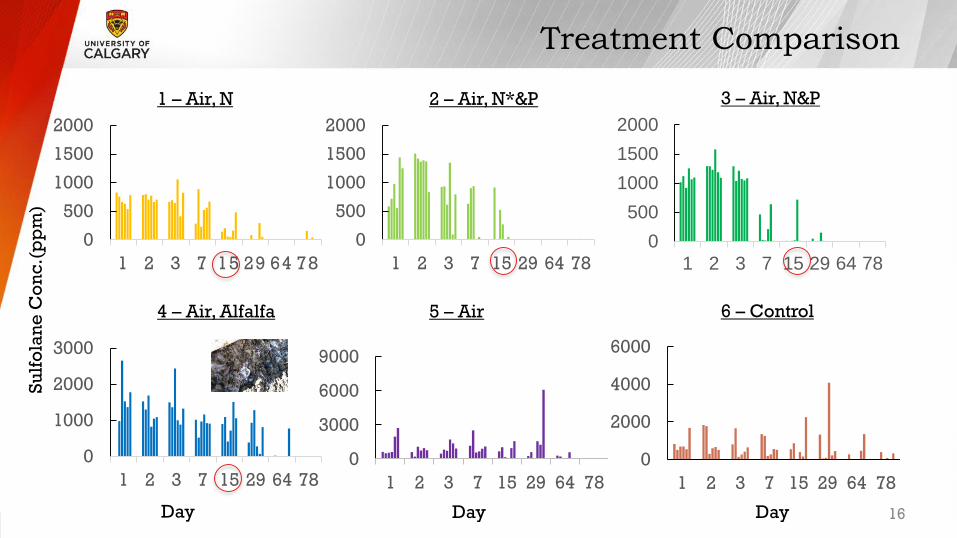
Treatment Comparison
0
2000
4000
6000
1 2 3 7 15 29 64 78
0
3000
6000
9000
1 2 3 7 15 29 64 78
0
500
1000
1500
2000
1 2 3 7 15 29 64 78
0
500
1000
1500
2000
1 2 3 7 15 29 64 78
0
500
1000
1500
2000
1 2 3 7 15 29 64 78
0
1000
2000
3000
1 2 3 7 15 29 64 78
1 – Air, N 2 – Air, N*&P 3 – Air, N&P
4 – Air, Alfalfa 5 – Air 6 – Control
Day Day Day
Su
lfo
lan
eC
on
c.(
pp
m)
16
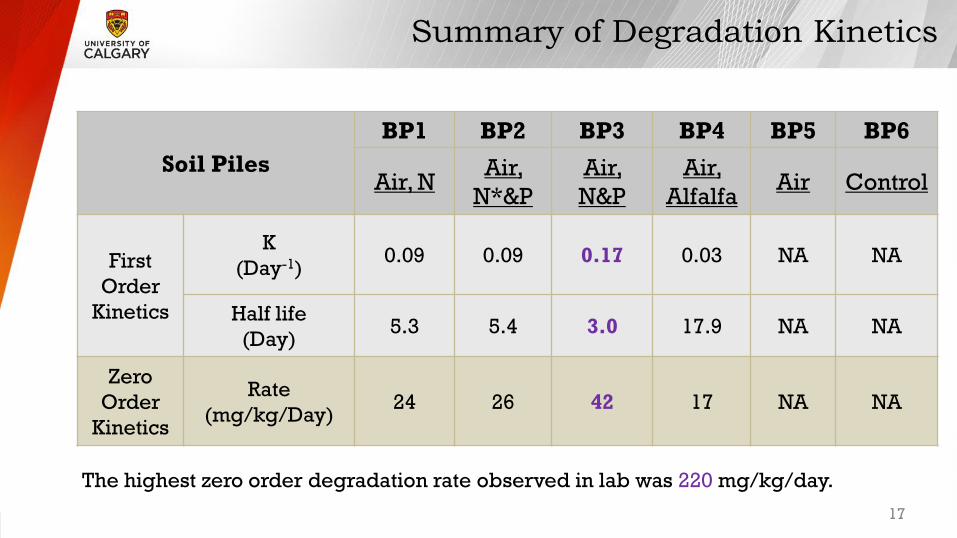
Soil Piles
BP1 BP2 BP3 BP4 BP5 BP6
Air, NAir,
N*&P
Air,
N&P
Air,
AlfalfaAir Control
First
Order
Kinetics
K
(Day-1)0.09 0.09 0.17 0.03 NA NA
Half life
(Day)5.3 5.4 3.0 17.9 NA NA
Zero
Order
Kinetics
Rate
(mg/kg/Day)24 26 42 17 NA NA
Summary of Degradation Kinetics
17
The highest zero order degradation rate observed in lab was 220 mg/kg/day.
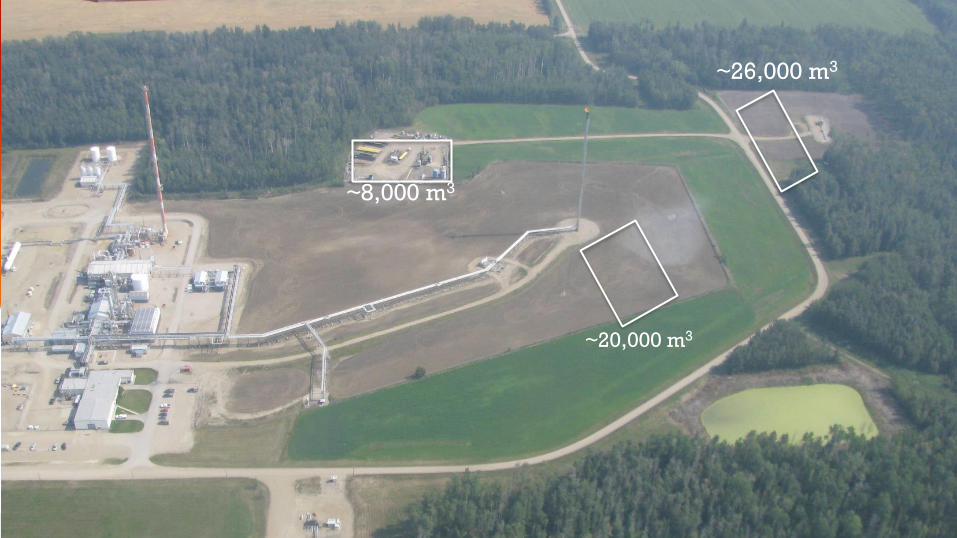
Remediation Program-Contaminated Site
18
~8,000 m3
~26,000 m3
~20,000 m3
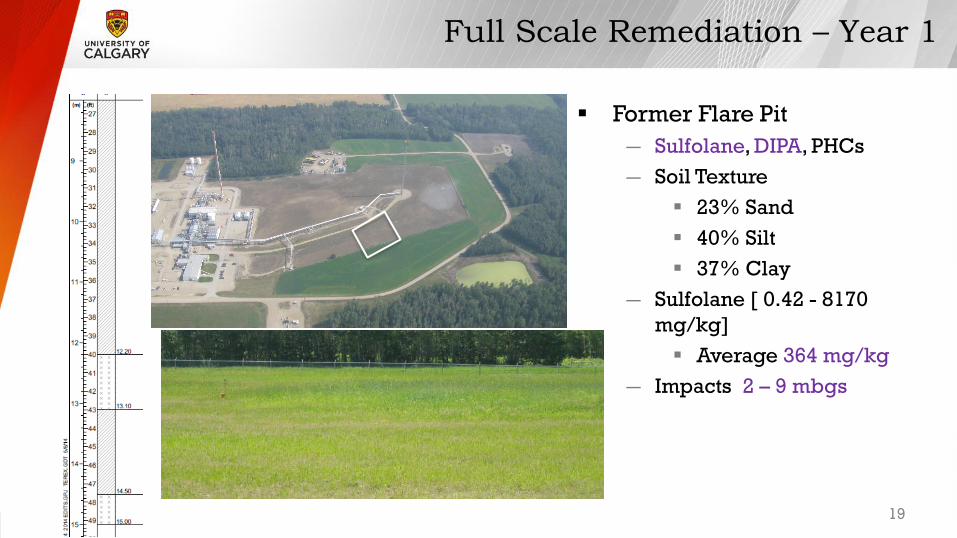
Full Scale Remediation – Year 1
19
Former Flare Pit
— Sulfolane, DIPA, PHCs
— Soil Texture
23% Sand
40% Silt
37% Clay
— Sulfolane [ 0.42 - 8170
mg/kg]
Average 364 mg/kg
— Impacts 2 – 9 mbgs
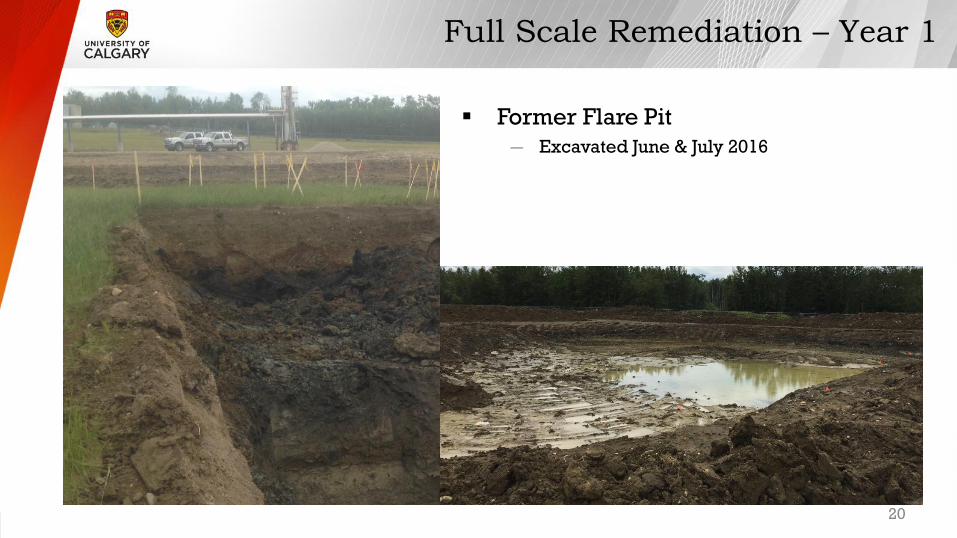
Full Scale Remediation – Year 1
20
Former Flare Pit
— Excavated June & July 2016
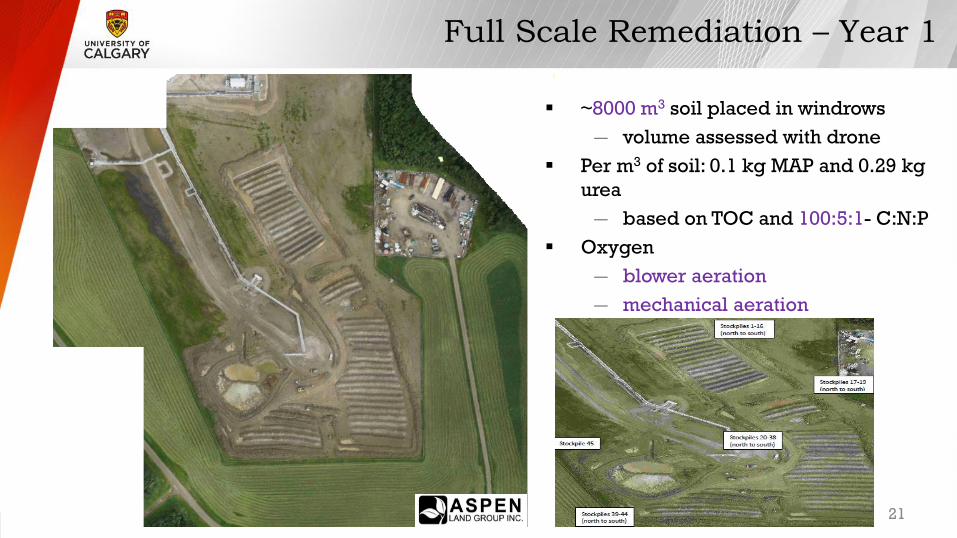
Full Scale Remediation – Year 1
21
~8000 m3 soil placed in windrows
— volume assessed with drone
Per m3 of soil: 0.1 kg MAP and 0.29 kg
urea
— based on TOC and 100:5:1- C:N:P
Oxygen
— blower aeration
— mechanical aeration
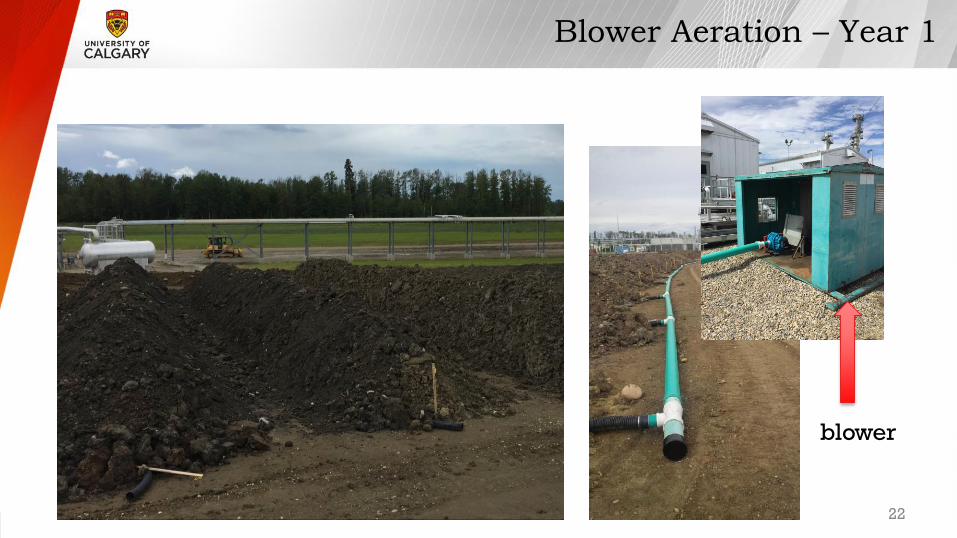
blower
Blower Aeration – Year 1
22
Full Scale Remediation – Year 1
23
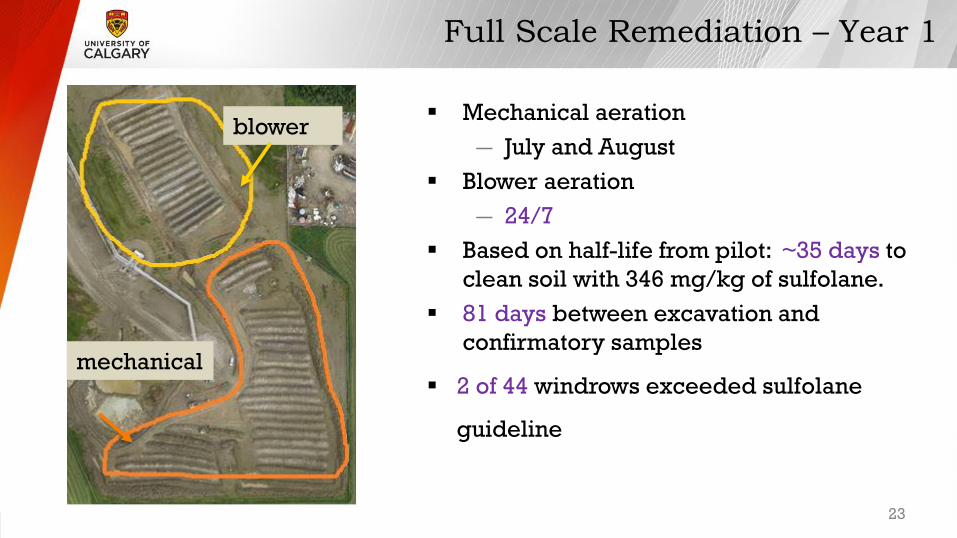
blower
mechanical
Mechanical aeration
— July and August
Blower aeration
— 24/7
Based on half-life from pilot: ~35 days to
clean soil with 346 mg/kg of sulfolane.
81 days between excavation and
confirmatory samples
2 of 44 windrows exceeded sulfolane
guideline
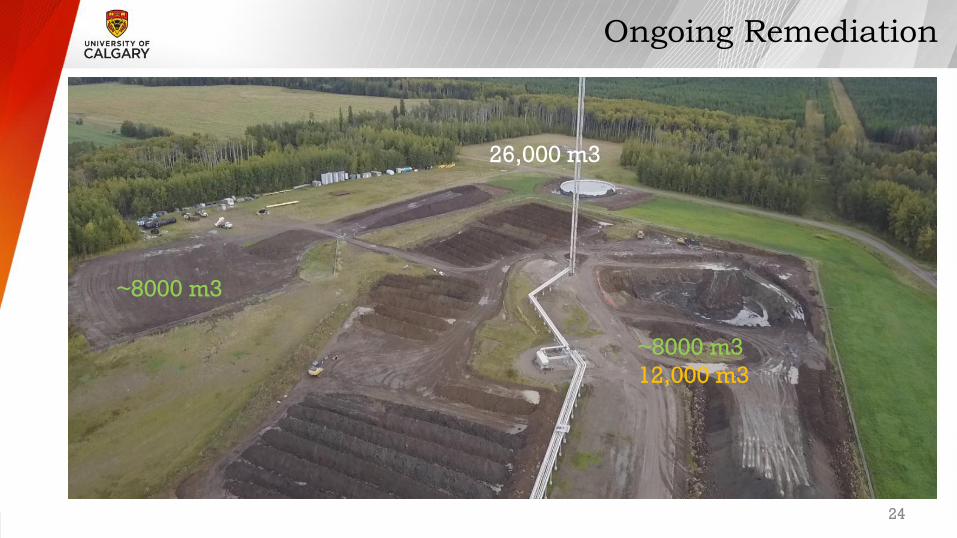
Ongoing Remediation
24
~8000 m3
26,000 m3
~8000 m3
12,000 m3
Summary
25
0
500
1000
1500
1 2 3 7 15 29 64 78
Su
lfo
lan
e(p
pm
)
Days
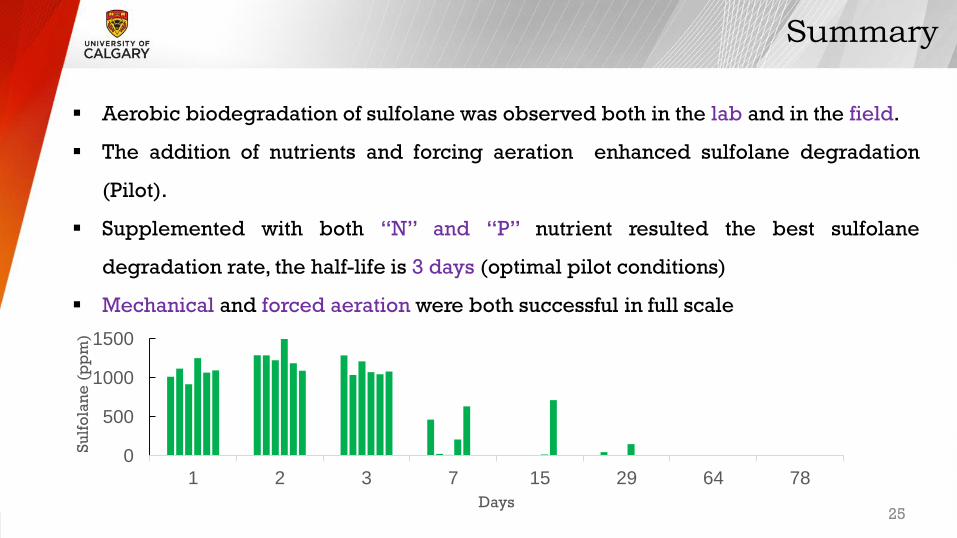
Aerobic biodegradation of sulfolane was observed both in the lab and in the field.
The addition of nutrients and forcing aeration enhanced sulfolane degradation
(Pilot).
Supplemented with both “N” and “P” nutrient resulted the best sulfolane
degradation rate, the half-life is 3 days (optimal pilot conditions)
Mechanical and forced aeration were both successful in full scale
References
[1] CCME. 2006. Canadian Environmental Quality Guidelines for Sulfolane:Water and
Soil.
[2] Kirk-Othmer. 1999. Encyclopedia of Chemical Technology. Fourth Edition, 1999.
John Wiley & Sons.
[3] Shell Chemicals Europe Limited. 1994. Sulfolane Data Sheet, Shell Chemicals UK
Ltd.
[4] Luther, S.M., Dudas, M.J. and Fedorak, P.M. 1998. Sorption of sulfolane and
diisopropanolamine by soils, clays and aquifer materials. Journal of contaminant
hydrology, 32(1), pp.159-176.
26
Co-Authors
27
Linlong Yu, University of Calgary
Ian Keir, Bonavista Energy Corporation
Gopal Achari, University of Calgary
Art Giurici, Terex Environmental Group
Collin Hennel, Bonavista Energy Corporation
Thank you!
Questions? 28