biochemical and molecular … · biochemical and molecular characterization of microbial...
TRANSCRIPT

BIOCHEMICAL AND MOLECULAR CHARACTERIZATION OF MICROBIAL
COMMUNITIES FROM A METAL CONTAMINATED AND RECLAIMED
REGION
BY
RAMYA NARENDRULA
A THESIS SUBMITTED IN PARTIAL FULFILLMENT OF THE
REQUIREMENTS FOR THE DEGREE OF
DOCTOR OF PHILOSOPHY (PHD) IN BIOMOLECULAR SCIENCES
THE FACULTY OF GRADUATE STUDIES
LAURENTIAN UNIVERSITY
SUDBURY, ONTARIO, CANADA
© RAMYA NARENDRULA, 2017

ii
THESIS DEFENCE COMMITTEE/COMITÉ DE SOUTENANCE DE THÈSE
Laurentian Université/Université Laurentienne
Faculty of Graduate Studies/Faculté des études supérieures
Title of Thesis
Titre de la thèse BIOCHEMICAL AND MOLECULAR CHARACTERIZATION OF MICROBIAL
COMMUNITIES FROM A METAL CONTAMINATED AND RECLAIMED
REGION
Name of Candidate
Nom du candidat Narendrula, Ramya
Degree
Diplôme Doctor of Philosophy Science
Department/Program Date of Defence
Département/Programme Biomolecular Sciences Date de la soutenance April 18, 2017
APPROVED/APPROUVÉ
Thesis Examiners/Examinateurs de thèse:
Dr. Kabwe NKongolo
(Supervisor/Directeur(trice) de thèse)
Dr. Aseem Kumar
(Committee member/Membre du comité)
Dr. Gary Ferroni
(Committee member/Membre du comité)
Approved for the Faculty of Graduate Studies
Approuvé pour la Faculté des études supérieures
Dr. David Lesbarrères
Monsieur David Lesbarrères
Dr. Sreekumari Kurissery Dean, Faculty of Graduate Studies
(External Examiner/Examinateur externe) Doyen, Faculté des études supérieures
Dr. Graeme Spiers
(Internal Examiner/Examinateur interne)
ACCESSIBILITY CLAUSE AND PERMISSION TO USE
I, Ramya Narendrula, hereby grant to Laurentian University and/or its agents the non-exclusive license to archive
and make accessible my thesis, dissertation, or project report in whole or in part in all forms of media, now or for the
duration of my copyright ownership. I retain all other ownership rights to the copyright of the thesis, dissertation or
project report. I also reserve the right to use in future works (such as articles or books) all or part of this thesis,
dissertation, or project report. I further agree that permission for copying of this thesis in any manner, in whole or in
part, for scholarly purposes may be granted by the professor or professors who supervised my thesis work or, in their
absence, by the Head of the Department in which my thesis work was done. It is understood that any copying or
publication or use of this thesis or parts thereof for financial gain shall not be allowed without my written
permission. It is also understood that this copy is being made available in this form by the authority of the copyright
owner solely for the purpose of private study and research and may not be copied or reproduced except as permitted
by the copyright laws without written authority from the copyright owner.

iii
ABSTRACT
Metal contamination in the Greater Sudbury Region (GSR) resulted in severe
environmental degradation. Soil liming and tree planting have been the main approaches to
restoring the damaged ecosystem. The specific objective of the present study was to assess the
effects of soil metal contamination and liming on 1) microbial biomass and abundance, 2)
bacterial and fungal diversity, and 3) enzymatic activities and soil respiration. Phospholipid fatty
acid (PLFA) analysis and 454 pyrosequencing were used to address these research objectives.
Total biomasses for bacteria, arbuscular fungi (AM fungi), other fungi and eukaryotes were
significantly lower in metal contaminated compared to uncontaminated reference areas. Analysis
of bacterial communities revealed Chao1 index values of 232 and 273 for metal contaminated
and reference soils, respectively. For fungi, the Chao index values were 23 for metal
contaminated and 45 for reference sites. There was a significant increase of total microbial
biomass in limed sites (342.15 ng/g) compared to unlimed areas (149.89 ng/g). Chao1 estimates
followed the same trend. But the total number of OTUs (Operational Taxonomic Units) in limed
(463 OTUs) and unlimed (473 OTUs) soil samples for bacteria were similar. For fungi, OTUs
were 96 and 81 for limed and unlimed soil samples, respectively. Bacterial and fungal groups that
were specific to either limed or unlimed sites were identified. Bradyrhizobiaceae family with 12
genera including the nitrogen fixing Bradirhizobium genus was more abundant in limed sites
compared to unlimed areas. For fungi, Ascomycota was the most predominant phylum in unlimed
soils (46.00%) while Basidiomycota phylum represented 85.74% of all fungi in the limed areas.
Detailed analysis of the data showed that although soil liming increases significantly the amount
of microbial biomass, the level of species diversity remained statistically unchanged. Soil
respiration rates were higher in limed soils (65 ppm) compared to unlimed soils (35 ppm). They

iv
were significantly lower in metal contaminated sites (55 ppm) compared to reference sites (90
ppm). β-glucosidase (BG), cellobiohydrolase (CBH), β-N-acetylglucosaminidase (NAGase), aryl
sulfatase (AS), acid phosphatase (AP), alkaline phosphatase (AlP), glycine aminopeptidase
(GAP), and leucine aminopeptidase (LAP) activites were significantly higher in limed compared
to unlimed sites. Metal contamination significantly reduced the activities of these enzymes with
the exception of LAP. An opposite trend was observed for peroxidase (PER) enzyme activity that
was higher in unlimed and metal contaminated sites compared to limed and reference areas.
Keywords: Metals, Soil pH, CEC, PLFA Analysis, Pyrosequencing, Bacterial and Fungal
Community, Soil Microbial Diversity and Abundance, Soil Respiration, Microbial Activity.

v
ACKNOWLEDGMENTS
I would like to take this opportunity to thank the following people that have helped me
throughout my thesis. First and foremost, I would like to express my sincere appreciation to my
supervisor Dr. Kabwe Nkongolo for giving me an opportunity to work in his lab and for all his
guidance, encouragement, help and dedication throughout the research. I have known Dr.
Nkongolo for nearly 10 years and I would have not achieved this accomplishment today if Dr.
Nkongolo was not there at every step. Any words would not do justice to extend my gratitude to
Dr. Nkongolo who stood behind me through all times during the project. Thanks to Dr. Garry
Ferroni and Dr. Aseem Kumar, members of my supervision team for their advice and input that
were valuable for the completion of this thesis.
I am extremely grateful to my loving and supportive parents, amazing sister, beloved
husband, all family members and friends, for all their love, support and encouragement in
pursuing and completing my Ph.D. I would like to extend my appreciation to Dr. Paul Michael,
Dr. Melanie Mehes-Smith, Dr. Gabriel Theriault, Grace Daniel, Kersey Kalubi, Sabrina Rainville
and Meagan Makela for all their help, guidance, and encouragement in the lab, and for their
assistance during sampling and research work. Finally, I would like to thank my committee
members for all their helpful input and for reviewing my work so promptly. I would also like to
thank all my friends in the Department of Biology and Biomolecular Sciences for all their help
and support. All of you have been truly helpful in the completion of my thesis.

vi
TABLE OF CONTENTS
ABSTRACT .................................................................................................................................. iii
ACKNOWLEDGMENTS ............................................................................................................ v
TABLE OF CONTENTS ............................................................................................................. vi
LIST OF FIGURES .................................................................................................................... xii
LIST OF APPENDICES ............................................................................................................. xv
CHAPTER 1: LITERATURE REVIEW .................................................................................... 1
1.1 Soil and Ecosystem .......................................................................................................... 1
1.1.1 Soil Horizons ................................................................................................................. 2
1.1.2 Soil Organic Matter (SOM) and Rhizosphere ............................................................... 4
1.1.3 Cation Exchange Capacity (CEC) ................................................................................. 6
1.1.4 Soil pH ........................................................................................................................... 7
1.2 History of Metal Contamination in the Greater Sudbury Region (GSR) .................. 8
1.3 Effects of Metal Contamination on Terrestrial Ecosystem ....................................... 13
1.4 Remediation Technologies of Soils Contaminated by Metals .................................... 18
1.4.1 Physical Remediation ................................................................................................... 19
1.4.2 Chemical Remediation ................................................................................................. 20
1.4.3 Biological Remediation ............................................................................................... 24
1.5 Soil Microbial Community and its Biodiversity ......................................................... 29
1.5.1 Biodiversity .................................................................................................................. 31
1.5.2 Soil Biodiversity .......................................................................................................... 31
1.6 Microbial Community Assessment Methods .............................................................. 32
1.6.1 Phospholipid Fatty Acid Analysis (PLFA) .................................................................. 32
1.6.2 454 Pyrosequencing ..................................................................................................... 36

vii
1.7 Microbial Activity and Functionality Measurement .................................................. 40
1.7.1 Soil Respiration ............................................................................................................ 40
1.7.2 Soil Enzymatic Activity ............................................................................................... 45
1.8 Rationale ......................................................................................................................... 47
1.9 Objectives ....................................................................................................................... 48
CHAPTER 2: BACTERIAL AND FUNGAL COMMUNITY STRUCTURE AND
DIVERSITY IN THE GREATER SUDBURY REGION UNDER LONG-TERM METAL
EXPOSURE REVEALED BY PHOSPHOLIPID FATTY ACID AND
PYROSEQUENCING ANALYSIS ........................................................................................... 49
2.1 Abstract .......................................................................................................................... 50
2.2 Introduction ................................................................................................................... 51
2.3 Materials and Methods ................................................................................................. 54
2.3.1 Study Site and Soil Sample Collection ........................................................................ 54
2.3.2 Soil Chemical Analysis ................................................................................................ 56
2.3.3 Phospholipid Fatty Acid Analysis ............................................................................... 56
2.3.4 Microbial DNA Extraction and Purification ................................................................ 56
2.3.5 PCR Amplification and Pyrosequencing ..................................................................... 57
2.3.6 Data Processing ............................................................................................................ 57
2.3.7 Statistical Analysis ....................................................................................................... 58
2.4 Results ............................................................................................................................. 60
2.4.1 Characteristics of the Soil Samples .............................................................................. 60
2.4.2 Phospholipid Fatty Acid Analysis ............................................................................... 64
2.4.3 Pyrosequencing Analysis ............................................................................................. 66
2.4.3.1 Bacterial Community Composition and Diversity Analysis .............................. 66

viii
2.4.3.2 Fungal Community Composition and Diversity Analysis ................................. 76
2.5 Discussion ....................................................................................................................... 82
2.5.1 Soil Chemistry ............................................................................................................. 82
2.5.2 Phospholipid Fatty Acid Analysis ............................................................................... 83
2.5.3 Pyrosequencing Derived Data ...................................................................................... 84
2.5.3.1 Bacterial Communities' Analysis ...................................................................... 85
2.5.3.2 Fungi Communities' Analysis ........................................................................... 88
2.5.4 Microbial Diversity ...................................................................................................... 91
2.5.5 PLFA vs Pyrosequencing Analysis .............................................................................. 93
2.6 Conclusions ....................................................................................................................... 94
2.7 Acknowledgments ............................................................................................................. 95
CHAPTER 3: MICROBIAL RESPONSE TO SOIL LIMING OF DAMAGED
ECOSYSTEMS IN THE GREATER SUDBURY REGION REVEALED BY
PYROSEQUENCING AND PHOSPHOLIPID FATTY ACID ANALYSES ....................... 96
3.1 Abstract .......................................................................................................................... 97
3.2 Introduction ................................................................................................................... 99
3.3 Materials and Methods ............................................................................................... 102
3.3.1 Site Characterization and Sampling ........................................................................... 102
3.3.2 Soil Chemistry Analysis ............................................................................................ 103
3.3.3 Phospholipid Fatty Acid (PLFA) Analysis ................................................................ 104
3.3.4 Microbial DNA Extraction and Purification .............................................................. 104
3.3.5 PCR Amplification and 454 Pyrosequencing ............................................................ 105
3.3.6 Data Processing .......................................................................................................... 106
3.3.7 Statistical Analyses .................................................................................................... 106

ix
3.4 Results ........................................................................................................................... 108
3.4.1 Soil Chemistry ........................................................................................................... 108
3.4.2 Phospholipid Fatty Acid Analysis ............................................................................. 108
3.4.3 Pyrosequencing Analyses .......................................................................................... 113
3.4.3.1 Bacterial Community Composition and Diversity Analysis ............................ 113
3.4.3.2 Fungal Community Composition and Diversity Analysis ............................... 124
3.5 Discussion ..................................................................................................................... 129
3.5.1 Phospholipid Fatty Acid Analysis ............................................................................. 129
3.5.3 Pyrosequencing Analysis ........................................................................................... 131
3.5.3.1 Fungal Populations ......................................................................................... 133
3.5.3.2 Bacterial and Fungal Diversity ...................................................................... 134
3.5.4 Pyrosequencing and PFLA Comparison .................................................................... 135
3.6 Conclusions................................................................................................................... 136
3.7 Acknowledgements ...................................................................................................... 136
CHAPTER 4: CHANGES IN ENZYMATIC ACTIVITIES IN METAL CONTAMINATED
AND RECLAIMED LANDS IN THE GREATER SUDBURY REGION .......................... 138
4.1 Abstract ........................................................................................................................ 139
4.2 Introduction ................................................................................................................. 140
4.3 Experimental Procedures ............................................................................................ 142
4.3.1 Study Sites ................................................................................................................. 142
4.3.2 Soil Sampling ............................................................................................................. 142
4.3.3 Soil Respiration .......................................................................................................... 143
4.3.4 Enzyme Activities ...................................................................................................... 143

x
4.3.5 Statistical Analysis ..................................................................................................... 145
4.4 Results ........................................................................................................................... 146
4.4.1 Soil Respiration .......................................................................................................... 146
4.4.2 Soil Enzyme Activities .............................................................................................. 146
4.5 Discussion ..................................................................................................................... 155
4.5.1 Soil Respiration .......................................................................................................... 155
4.5.1.1 Effects of Liming ............................................................................................. 155
4.5.1.2 Effects of Metal Contamination ...................................................................... 155
4.5.2 Soil Enzyme Activity ................................................................................................. 156
4.5.2.1 Activity of β-glucosidase ................................................................................. 157
4.5.2.2 Activity of Cellobiohydrolase .......................................................................... 158
4.5.2.3 Activity of β-N-acetylglucosaminidase ........................................................... 158
4.5.2.4 Activity of Arylsulfatase .................................................................................. 159
4.5.2.5 Activity of Acid and Alkaline Phosphatase ..................................................... 159
4.5.2.6 Activity of Aminopeptidase ............................................................................. 160
4.5.2.7 Activity of Peroxidase ..................................................................................... 161
4.6 Conclusions................................................................................................................... 162
4.7 Acknowledgements ...................................................................................................... 162
CHAPTER 5: GENERAL CONLUSIONS ............................................................................. 163
REFERENCES .......................................................................................................................... 167
APPENDICES ........................................................................................................................... 188
PUBLICATIONS ...................................................................................................................... 210

xi
LIST OF TABLES
Table 1: Basic description of mineral and organic soil horizons of soil classification. .................. 3
Table 2: Mean values of basic cations (Ca2+
, Mg2+
, K+ and Na
+), sum of cations, CEC, pH and
total C and N in the Greater Sudbury Region. ............................................................................... 63
Table 3: Microbial organisms identified using phospholipid fatty acid (PLFA) analysis in soil
samples from the GSR. Data in ng/g. ............................................................................................. 65
Table 4: Main bacterial and fungal phyla and their relative abundance identified in soil samples
from the GSR. Data in percentage. ................................................................................................ 69
Table 5: Bacterial and fungal diversity parameters and indices in different soil types in the GSR.
........................................................................................................................................................ 75
Table 6: Mean values of basic cations (Ca2+
, Mg2+
, K+ and Na
+), sum of cations, CEC and pH.
...................................................................................................................................................... 109
Table 7: Microorganisms identified using phospholipid fatty acid (PLFA) analysis in soil
samples from the Greater Sudbury Region (GSR). Data in ng/g. ................................................ 111
Table 8: Phospholipid fatty acid (PLFA) ratios of main microbial groups in soil samples from the
Greater Sudbury Region (GSR) ................................................................................................... 112
Table 9: The main phylogenetic groups of bacteria and fungi, and their relative abundance in soil
samples from the Greater Sudbury Region (GSR). ...................................................................... 116
Table 10: Microbial diversity index values for bacterial and fungal communities from the Greater
Sudbury Region (GSR). ............................................................................................................... 122
Table 11: Pair wise microbial diversity analysis for bacteria and fungi communities in the
Greater Sudbury Region (GSR). .................................................................................................. 123
Table 12: Enzyme assays measured, their function and the substrate used. ............................... 144

xii
LIST OF FIGURES
Figure 1: Geographical locations of the sampling area from the Greater Sudbury Region (GSR)
in Northern Ontario. ....................................................................................................................... 55
Figure 2: Total metal concentration (mg/kg dry wt) of elements in soil from the GSR in Northern
Ontario. ........................................................................................................................................... 61
Figure 3: Bioavailable metal concentration (mg/kg dry wt) of elements in soil from the GSR in
Northern Ontario. ........................................................................................................................... 62
Figure 4: Venn diagram showing distribution of bacterial classes identified in metal
contaminated and reference soil samples from the GSR. ............................................................... 70
Figure 5: Venn diagram showing distribution of bacterial families identified in metal
contaminated and reference soil samples from the GSR. ............................................................... 72
Figure 6: Venn diagram showing distribution of bacterial genera/species identified in metal
contaminated and reference soil samples from the GSR. ............................................................... 74
Figure 7: Venn diagram showing distribution of fungal classes identified in metal contaminated
and reference soil samples from the GSR. ..................................................................................... 79
Figure 8: Venn diagram showing distribution of fungal families identified in metal contaminated
and reference soil samples from the GSR. ..................................................................................... 80
Figure 9: Venn diagram showing distribution of fungal genera identified in metal contaminated
and reference soil samples from the GSR. ..................................................................................... 81
Figure 10: Geographical locations of the sampling area from the Greater Sudbury Region (GSR)
in Northern Ontario. ..................................................................................................................... 103
Figure 11: Patterns of pH and Cations Exchange Capacity (CEC) in samples from limed and
unlimed sites in the Greater Sudbury Region (GSR) in Northern Ontario. ................................. 110
Figure 12: Venn diagram showing distribution of bacterial classes identified in limed and
unlimed soil samples from the GSR. ............................................................................................ 117

xiii
Figure 13: Venn diagram showing distribution of bacterial families identified in limed and
unlimed soil samples from the GSR. ............................................................................................ 119
Figure 14: Venn diagram showing distribution of bacterial genera/species identified in limed and
unlimed soil samples from the GSR. ............................................................................................ 121
Figure 15: Venn diagram showing distribution of fungal classes identified in limed and unlimed
soil samples from the GSR. .......................................................................................................... 125
Figure 16: Venn diagram showing distribution of fungal families identified in limed and unlimed
soil samples from the GSR. .......................................................................................................... 126
Figure 17: Venn diagram showing distribution of fungal genera identified in limed and unlimed
soil samples from the GSR. .......................................................................................................... 127
Figure 18: Mean soil respiration rates in the organic layer (0-5cm) from various limed and
unlimed sites from GSR. .............................................................................................................. 147
Figure 19: Mean soil respiration rates in the organic layer (0-5cm) from various metal
contaminated and reference sites from GSR.. .............................................................................. 148
Figure 20: The activities of selected hydrolytic enzymes from limed and unlimed soil samples
from the GSR (n = 72) using p-nitrophenol (pNP) linked substrates. BG = β-glucosidase; CBH =
Cellobiohydrolase; NAG = β-N-acetylglucosaminidase; AS = Aryl sulfatase. ........................... 149
Figure 21: The activities of selected hydrolytic enzymes from limed and unlimed soil samples
from the GSR (n = 72) using p-nitrophenol (pNP) linked substrates........................................... 150
Figure 22: The activities of selected hydrolytic and oxidoreductase enzymes from limed and
unlimed soil samples from the GSR (n = 72) using p-nitroanilide linked substrate for glycine and
leucine aminopeptidase (GAP and LAP), and L-3,4-dihydroxyphenylalanine (DOPA) linked
substrates for peroxidase (PER) activity. ..................................................................................... 151
Figure 23: The activities of selected hydrolytic enzymes in metal contaminated and reference
soil samples from the GSR (n = 54) using p-nitrophenol (pNP) linked substrates. BG = β-
glucosidase; CBH = Cellobiohydrolase; NAGase = β-N-acetylglucosaminidase; AS = Aryl
sulfatase. ....................................................................................................................................... 152

xiv
Figure 24: The activities of selected hydrolytic enzymes in metal contaminated and reference
soil samples from the GSR (n = 54) using p-nitrophenol (pNP) linked substrates. ..................... 153
Figure 25: The activities of selected hydrolytic and oxidoreductase enzymes in metal
contaminated and reference soil samples from the GSR (n = 54) using p-nitroanilide linked
substrate for glycine and leucine aminopeptidase (GAP and LAP), and L-3,4-
dihydroxyphenylalanine (DOPA) linked substrates for peroxidase (PER) activity. .................... 154

xv
LIST OF APPENDICES
Table S1: Study locations and their coordinates. ........................................................................ 189
Table S2: Site-specific bacterial groups and their relative abundance identified in metal
contaminated and reference soil samples from the GSR. ............................................................. 190
Table S3: All the bacterial groups and their relative abundance identified in metal contaminated
and reference soil samples from the GSR. ................................................................................... 191
Table S4: The weighed UniFrac distance matrix between sites for bacterial community. ......... 195
Table S5: Site-specific fungal groups and their relative abundance identified in metal
contaminated and reference soil samples from the GSR. ............................................................. 196
Table S6: All the fungal species and their relative abundance identified in metal contaminated
and reference soil samples from the GSR. ................................................................................... 197
Table S7: The weighed UniFrac distance matrix between sites for fungal community. ............. 199
Table S8: Bacterial species and its relative abundance identified unique to sites from the GSR.
...................................................................................................................................................... 200
Table S9: Fungi species and its relative abundance identified unique to sites from the GSR. ... 201
Table S10: 149 bacterial species and their relative abundance identified from soil samples from
the GSR. ....................................................................................................................................... 202
Table S11: The weighed UniFrac distance matrix between sites for bacterial community. ....... 206
Table S12: A total of 70 fungal species and their relative abundance identified from soil samples
from the GSR. .............................................................................................................................. 207
Table S13: The weighed UniFrac distance matrix between sites for fungal community. ........... 209

1
CHAPTER 1: LITERATURE REVIEW
1.1 Soil and Ecosystem
Ecosystem serves as the level of biological organization where organisms interact with each
other and with their environment [1]. It includes living organisms, dead organic matters and the
abiotic environment within which the organisms live and exchange components such as
atmosphere, water, and soil [1,2]. An important factor influencing the productivity of various
ecosystems is the nature of their soil which is the foundation of entire biosphere. It plays a major
role in the development of earth system and it continues to support the needs of contemporary
societies [2,3].
Healthy soils function in regulating water flow, cycling nutrients, transforming organic and
inorganic materials [4]. They are able to balance a range of functions to meet the needs of both
community and agriculture industry [4,5]. This implies that the interactions among soil’s internal
components are optimal and that soil interactions with its external environment and the
production system are sustainable [5]. There is a strong interaction among soil biological
activities, organic matter content, pH, and water availability [2,5].
Soils provide an immense array of habitats that contain a vast and still largely unknown
biodiversity [2,3]. Several studies on soil have been conducted to understand the distribution, the
nature, and specific characteristics of minerals and organic components [2,3,6]. Ecologists and
agronomists have detailed how soils provide nutrients and substrates for plant growth [2,3].
However, analysis of how soil functions as a habitat and the way organisms create and live in
their habitats has been understudied.

2
1.1.1 Soil Horizons
Soil scientists have described the vertical gradation of soil horizons using a classification
system [2,3,7]. A soil horizon is a layer of mineral or organic material parallel to the soil crust
whose characteristics differ from the layers above and beneath [3,7]. It differs from other
horizons in properties such as color, structure, texture and consistence, as well as in chemical,
biological, and mineralogical composition [2,3,7]. Layers are assigned distinctive alphabetic
symbols as a form of shorthand for their characteristic and they are split into two distinct groups:
1) organic horizons – those that contain 17% or more organic carbon (C) and, 2) mineral horizons
– with less than 17% organic C (about 30% less organic matter) by weight (Table 1) [2,7].
The major mineral horizons are A, B, and C whereas, O, L, F, and H are the major organic
horizons, that are mainly forest litter at various stages of decomposition (Table 1) [2,7]. Plant
roots and microorganisms often extend below B horizon in humid regions leading to chemical
changes in soil water, biochemical weathering of the regolith (layer of loose, dirt, dust and rocks
sitting on top of bedrock), and forming C horizon [2,7]. Horizons are also further divided into
subdivisions which are labeled by adding lower case suffixes to some of the major horizon
symbols such as Ae or Ah (Table 1) [7]. Other layers are either non-soil layers such as rock and
water or layers of unconsolidated material considered to be unaffected by soil forming processes.
They are labeled as R, W and IIC, respectively [2,7].
The organically enriched horizon A at the soil surface where most of microorganisms and
plant roots are found is also referred to as topsoil [2]. This is a zone that can be altered by
enhancing the supply of nutrients, air and water by mixing organic and inorganic materials,

3
Table 1: Basic description of mineral and organic soil horizons of soil classification.
Soil Horizons Suffix Description
Mineral Horizon
A Layer nearest to the soil surface dominated by mineral particles
Ah Enriched with soil organic matter (SOM)
Ae Characterized by the eluviations of clay, Fe (iron), Al (aluminum),
SOM
B Formed by the accumulation of material removed from Ae horizon
or by alteration of the parent material
Bh Accumulation of SOM
Bf Accumulation of Fe and/or Al
Bn Strong soil structure and significant amounts of exchangeable Na
(sodium)
C Horizon comparatively unaffected by the pedogenic processes
(least weathered part of the soil profile)
Cca Accumulation of Ca (calcium) and Mg (magnesium) carbonates
Cs Accumulation of soluble salts
Ck Original Ca and Mg carbonates
Organic Horizon
O Organic horizon derived mainly from wetland vegetation
Of Fibrous materials of readily recognizable origin
Om Organic material in an intermediate stage of decomposition
Oh Highly decomposed organic material
L, F, H Organic materials that occur from the accumulation of leaves,
twigs and woody materials which overlies a mineral soil
L Leaf litter
F Partially decomposed leaf and twig materials
H Decomposed organic materials

4
loosening the structure, and applying irrigation [2,3]. Subsoils are layers that underlie topsoil.
They supply nutrients and much of the water needed by plants [2,3]. Compared to subsoil, topsoil
has properties that are far more beneficial for plant growth. Hence productivity is often correlated
with the thickness of topsoil [2,3,7]. Studies have shown that subsoil layers that are too dense,
acidic or wet can impede root growth [2]. Many of the chemical, biological, and physical
processes that take place in the upper soils layers are also observed to some extent in the C
horizon [2].
The relative proportions of air, water and inorganic matter greatly influence soil behavior
and productivity [2,6]. In addition, soil texture, content, and structure also play an important role
in soil fertility [2,3,6].
1.1.2 Soil Organic Matter (SOM) and Rhizosphere
Organic matter consists of vast arrays of carbon compounds in soils that play a variety of
roles in nutrient, water and biological cycles. SOMs provide nutrients and habitat to organisms
and they bind soil particles into aggregates thereby improving the water holding capacity [2,6].
They include living organisms, carbonaceous remains of organisms as well as organic
compounds produced by current and past metabolism in the soil [2,6]. They affect chemical and
physical properties and the overall soil health [2,6]. SOM composition and breakdown rate
greatly affect: 1) soil structure and porosity, 2) water infiltration rate and moisture holding
capacity, 3) diversity and biological activities of soil organisms, and 4) plant nutrient availability
[2,6].
The importance of soil structure as a component of soil fertility is evident as documented
by several reports. For example, plant roots must spread to access nutrients and they only thrive if

5
there is an adequate supply of air and water [2,3,6]. Further, soil microorganisms produce organic
matters and growth stimulating compounds which play a major role in plant growth and
development [2,3,6]. Deterioration of soil affects vegetation as well as soil microorganisms
which have a significant influence on soil structure [2,3,6]. Organic matter is a major source of
plant nutrients: C, nitrogen (N), phosphorous (P), and sulfur (S) [2,6]. These elements are
released as soluble ions and they are taken up by plant roots when SOM decays. In addition,
SOM including plant and animal residues is the main food that provides C and energy to soil
organisms [2,3,6]. Overall, SOM formation, decomposition and transformation are of great
importance for microorganisms, sustainable soil fertility, soil structure, and plant health [2,3,6].
Soil pollution is detrimental to soil health and its function. Rhizosphere is the area that is
affected by soil contaminants [2,3,8]. It represents a narrow region of soil that is directly
influenced by plant root secretions and associated soil microorganisms [2,3,8]. Enhanced
microbial abundance and metabolic activities have been reported in the proximity of plant roots
[2,8,9]. Root exudation patterns and associated microbial communities greatly depend on plant
species, their developmental stage, and nutritional status [2,8,9]. Different factors including soil
type, climate change, soil contamination, pathogen exposure, and agriculture practices
significantly affect microbial community composition and its diversity in the rhizosphere
[2,3,8,9]. Microorganisms in rhizosphere, in turn, exert strong effects on plant growth,
development, and health by nutrient solubilization, N fixation and production of plant hormones
[2,3,8,9]. Overall, both bacterial and fungal communities are influenced by plants and vice versa
[2,3,8,9].

6
Soil electrochemical properties are also fundamentally important in understanding physio-
chemical phenomena affecting nutrient availability for plants and microorganisms [6,10].
Defined as the capacity of soil to supply plants with essential nutrients, soil fertility is a very
complex conservation and management concept and it is closely linked to nutrient bioavailability
[6,10]. This refers to the availability of an element in a chemical form that plant is able to absorb
rapidly [2,10]. It is affected by soil characteristics such as density of soil layers, nutrient
diffusion, and root oxygenation [2,6,10]. In addition, electrochemical properties directly
influence the behavior of soil elements [2,6,10]. Cation exchange capacity (CEC) is a soil
property that is the most related to the control of nutrient movement and immobilization
[2,10,11].
1.1.3 Cation Exchange Capacity (CEC)
CEC is commonly used to evaluate soil fertility as it gives an estimate of soils ability to
attract, retain, and exchange cation (positively charged) elements [2,10,11]. It is defined as the
total sum of the exchangeable cationic charges that a soil can adsorb [2,12]. CEC is expressed as
the number of moles of positive charge adsorbed per unit mass and its values are reported as
centimoles of charge per kilogram (cmol/kg) [2,12]. For example, a CEC of 15 cmol/kg, indicates
that 1 kg of soil can hold 15 cmol of H+ ions, and can exchange this amount of charges from H
+
(hydrogen ions/protons) for the same level of charges from any other cation [2,12].
Weil and Brady [2] described the common range of CEC for different soils as well as other
organic and inorganic exchange materials. Lower CECs are reported in sandy soils (low in all
colloidal material) than in silt loams and clay loams [2,10–12]. In addition, very high CECs were

7
associated with organic matter and not to inorganic clays (kaolinite, Fe and Al oxides) [2]. CEC
increases at higher pH levels which improves soil capacity to supply nutrients to plants [2,10,11].
1.1.4 Soil pH
Soil pH is a logarithmic scale used to measure soil acidity or alkalinity [2,6]. Soil water pH
is a measure of pH of the soil solution and it is considered the active pH that affects plant growth
[2,6]. The acidity is caused by a dominance of H+ and alkalinity by a prevalence of OH
-
(hydroxyl ions) in soil solution [2,6]. In general, pH scale ranges from 0 to 14, where 7.0 is
neutral and values < 7.0 indicate acidic conditions and > 7.0 alkaline [6,13]. The levels of pH for
most natural soils vary between 3.0 (extremely acidic) and 8.0 (weakly alkaline) [6]. Plants grow
at optimal rate in soils that are slightly acidic to neutral (pH 6.0 to 7.0). Whereas, some plant
species such as blueberries (Vaccinium myrtillus), cranberries (Vaccinium macrocarpon), and
blackberries (Rubus Fruticosus) and microorganisms require acidic soils (pH 4.5 to 5.5). Other
plant species including alfalfa (Medicago sativa), thale cress (Arabidopsis thaliana), gum tress
(Eucalypts), and citrus tolerate slightly alkaline soil (pH 7.0 to 7.5) [13–15].
Biochemical reactions in soils are influenced by H+ activity. The solubilities of various
compounds (e.g. metals) as well as microbial activities are influenced by soil pH [2,6]. The
optimum pH values for pollutant degrading microorganisms range from 6.5 to 7.5 [2,6,13]. Soil
pH is influenced by various factors such as types of organic and inorganic constituents,
soil/solution ratio, salt or electrolyte content, and CO2 (carbon dioxide) [2,6]. Soil pH is the
foundation of essentially all soil chemistry and nutrient reactions [2,6].
Overall, soils play a major role in the global ecosystem whether occurring in a farm, forest
or a regional watershed. Soils support plant growth, by providing habitat for roots and nutrient

8
elements. Their properties determine the nature of vegetation and also the number and types of
organisms (including animals and humans) that the vegetation can support. Soils regulate water
supplies and conditions including water loss, utilization, contamination, and purification. Soils
also function as nature’s recycling system. In fact, waste products and dead plants, and animals
are assimilated within the soil and their basic elements are made available to the next generation
of life. Further, soils are home to many creatures from small mammals and reptiles to tiny insects
and microorganisms of unimaginable numbers and diversity. In addition, soils influence
atmospheric composition by taking up and releasing large quantities of CO2, O2 (oxygen), and
other gases.
1.2 History of Metal Contamination in the Greater Sudbury Region (GSR)
The discovery and exploitation of nickel (Ni) and copper (Cu) deposits in Greater Sudbury
Region (GSR) (Ontario, Canada) in the late 1800s led to intense sulfur dioxide (SO2) fumigation,
soil contamination by aerial fallout and acid precipitation in the region [15–17]. In fact, mining
and smelting of sulphide ore, released more than 107 tonnes of SO2 as well as tens of thousands
of tonnes of cobalt (Co), Cu, iron (Fe), and Ni biproducts into the atmosphere [15,17,18]. These
factors led to soil acidification (pH of 2.0 – 4.0), which resulted in increased aluminum (Al), Ni,
and Cu solubility.
Overall, these conditions made the GSR one of the most ecologically disturbed regions in
Canada with barren (20,000 ha) and semi barren (80,000ha) lands [15,19–21]. Nieboer et al. [22]
reported a drastic decrease in lichens populations close to smelters and only a few crustose
lichens were observed in highly polluted areas. Gorham and Gordon [23], Gunn et al. [19], and
Gunn et al. [24] reported a decrease in plant growth, natural recolonization, and population
9
diversity closer to smelters. They also documented the effects of acid precipitation in aquatic
systems. Increased soil acidity caused major changes in soil chemistry characterized by an
elevated level of bioavailable metals, and a decrease in available nutrients [15,19]. High level of
metals in soil and vegetation within short distances of the smelters (24 km radius) in the GSR are
still being reported [25,26].
Total concentrations of Cu and Ni were found to be 9700 µg/g and 6960 µg/g in Sudbury
soil and the bioavailable levels ranged from 300 to 900 µg/g for Cu and Ni, respectively [15,27].
These values are much higher than those reported in most temperate and boreal soils where total
Ni and Cu content range from 20 - 40 µg/g [15]. Recent analysis by Narendula and Nkongolo
[28] reported total concentrations of 318 µg/g and 1600 µg/g and the bioavailable levels of 14
µg/g and 53 µg/g for Cu and Ni, respectively [28]. Phytotoxic symptoms appear in plants at
bioavailable Cu and Ni levels ranging between 25 and 50 µg/g, and symptoms become extremely
severe as pH decreases [15,27]. Detailed analysis revealed that Sudbury’s soils are contaminated
with Co, Cu, cadmium (Cd), chromium (Cr), Fe, manganese (Mn), Ni, S, and zinc (Zn) [29].
Metals such as Cu and Zn are essential for plant growth and development however, elevated
concentrations of essential and non-essential metals in soil lead to toxicity symptoms and
inhibition of growth in most plants [15,30].
In addition to metal contamination, SO2 emissions released into the atmosphere oxidized to
SO4 (sulfate) through acid precipitation [15]. Similar to metal contamination, effect of acid
depositions on ecosystem depends on the concentration of SO4, amount of precipitation, and CEC
of soil [9]. Even low levels of acid depositions result in soil acidification, which have adverse
effects on plants, animals, and microorganisms [9,31]. Acid deposition leads to soil acidity,

10
reduced concentration of divalent cations (Ca2+
, Mg2+
) which results in mobilization and
increased bioavailability of metals and other toxic compounds [9,15,19]. Soil acidification and
metal availability reduces SOM solubility [9,15]. Increased soil acidity has been also shown to
significantly reduce plant and microbial growth rate, activity, community composition, and
diversity [9,15,31].
Since the early 1970s, The Ministry of the Environment has been sampling soil and
vegetation in the GSR. In September of 2001, the ministry released a report called Metals in Soil
and Vegetation in the Sudbury Area. Total of 103 samples from various locations were collected
to assess environmental impact of mining and smelting operations in the GSR [32]. The study
reported that some metals are elevated in the GSR and the highest metal concentrations are
typically found in the top soil layers, indicating air emissions as the source [32]. The soil metal
levels in GSR are comparable or lower than those found in other Ontario mining communities
where elevated soil concentrations are found as a result of historical mining activity [32]. The
results confirmed that emissions from over 100 years of mining, smelting, and refining resulted in
elevated levels of metals in soil over a large area. Levels of arsenic (As), Co, Cu, Ni, and lead
(Pb) were higher in the areas around the three industrial centers of Copper Cliff, Coniston, and
Falconbridge compared to other sites. These findings are consistent with periodical ministry
reports.
GSR soils were highly acidic which resulted in decreased macronutrients solubility and
increased solubility of other micronutrients to toxic levels [15]. This led to a decline in plant and
vegetation growth causing soil erosion resulting in severe depletion of topsoil. In fact, chemical
analyses revealed significant soil deficiency in available nutrients (P, N, Ca, Mg, and Mn)

11
[15,19]. In addition, a decrease in number of soil fungi and bacteria has been observed in the
vicinity of smelters in the GSR [15,33–35]. It has been shown that revegetation of barren lands is
extremely slow due to lack of microorganisms [33,36]. Composition of soil microorganisms is
known to affect plant growth, alter species composition, and affect species ability to colonize
lands [11,33,36].
In the past 40 years, production of Ni, Cu, and other metals has remained high while SO2
emissions have been reduced drastically through the combinations of plant closures, major
reductions in emissions, greater dispersal through tall stacks, and combination of industrial
technological developments and legislated controls [19,24]. Reduced emissions allowed for some
degree of recovery to occur such as improved air quality and natural recovery of damaged
ecosystems in the GSR [15,19,24]. In 1969 and 1970, barren lands still showed almost total plant
mortality indicating that emission controls did little to reduce soil acidity or metal contamination
[15,19]. Hence, a regreening program was implemented in late 1970s to improve Sudbury’s
ecosystem [15,37]. The program involved application of lime (10 tons/ha of dolomitic
limestone), fertilizer (400 kg/ha), and tree planting [15,19,24]. Details on specific effects of
liming are discussed in the reclamation section (1.4.2).
In addition, to date over 12 million trees have been planted including jack pine (Pinus
banksiana), red pine (Pinus resinosa), white pine (Pinus strobus), white spruce (Picea glauca),
larch (Larix laricina), northern red oak (Quercus rubra), and black locust (Robinia
pseudoacacia) [15,19,37]. Monitoring studies revealed that survival and growth rate of planted
trees have been very good and in addition, pH values in soils had increased to 4.6 - 6.5. After
land treatment, metal uptake by plants had declined, insects/bird/small mammal populations

12
increased at reclaimed sites, natural colonization of herbaceous and woody species has been
improved at treated sites, and water quality in some Sudbury lakes has been restored [15,19,37].
Dudka et al. [29] revealed a decline in soil Ni and Cu concentrations in the GSR when
compared to previous studies. This could be explained by reduction of atmospheric emission,
leaching, washing, and erosion processes that have contributed to the decline in metal
concentration in the studied soil. Narendrula et al. [38], Bakina et al. [39], and Narendrula and
Nkongolo [40] reported that liming lowered soil acidity, reduced metal toxicity, soil erosion and
resulted in an increase in SOM. Nkongolo et al. [41] determined metal content in soil and various
tissues from Picea mariana (black spruce) populations in the Sudbury region. Their results
revealed concentrations of Cd, Co, Cu, Fe, Ni, and Zn to be within the limits set by Ontario
Ministry of Environment and Energy (OMEE) guidelines in sites within the vicinity of the
smelters. The level of these metals in P. mariana tissues were far below the toxic levels for
vegetation. Other studies showed no correlation between level of genetic diversity and metal
contamination in soil for Deschampsia cespitosa (tuffed hair grass) populations in Northern
Ontario [42]. Deschampsia was one of the metal tolerant strains of native grasses that recolonized
damaged lands ten years after the initiation of atmospheric improvement [19]. Studies by
Vandelight et al. [43], and Nkongolo et al. [44] revealed that long term exposure of pine (jack
pine and red pine) and spruce (red, black, and white spruce) populations to metal is not associated
with the level of genetic diversity. Similar results have been observed in other hardwood plant
species [45–47].
Ecological studies revealed that plant species diversity and abundance as well as tree
species richness were lower in sites close to smelters compared to reference sites in the GSR [40].

13
Similarly, Nkongolo et al. [26] reported a lower tree species diversity and abundance in unlimed
sites compared to limed sites. More importantly, genetic analysis of a number of plant
populations suggests that the regreening program in the GSR is increasing genetic population
variability which is contributing to sustainability of the terrestrial ecosystem in the region.
1.3 Effects of Metal Contamination on Terrestrial Ecosystem
Soils act as a sink for all chemicals generated from various natural and anthropogenic
activities. The retention time of many substances in soil ecosystem is longer as contaminants
accumulate quickly in soils but deplete at a slow rate [9,48]. Soils can naturally have high
concentrations of metals as a result of weathering of parental material with high amounts of metal
minerals. In many countries, anthropogenic activties such as mining, smelting, atmospheric
deposition, fossil fuel combustion, wastewater irrigation, corrosion, sewage sludge, and
agriculture practices have resulted in metal contamination of soils [9,48,49]. Globally, over 10
million sites have been reported to be polluted, with over 50% of them with metals and/or
metalloids [49]. Metal pollution of soil and water is one of the most important environmental
problems of the industrialized countries, affecting human health, agriculture, and forest
ecosystem [6,9]. Worldwide economic impact due to metal pollution is estimated to be over US
$10 billion per year [49].
Concentrations of metals in soils should be regularly monitored since they are persistent,
cause toxicity, have long half-life, and because of their bioaccumulation potential [9,48,50,51].
Many metals are essential for normal metabolic functions in microorganisms, plants, animals,
and humans but they become toxic at high concentrations [9,50]. The toxicity depends on the
metal itself, and its total/bioavailable concentrations for different organisms [9,52,50]. Depending

14
on the metal and organisms, different modes of actions have been identified including, binding to
macromolecules (DNA, RNA and proteins), disruption of enzymatic activity, and radical
formation [9,15,24,50].
The threshold level of metal toxicity in plants is highly variable [53,54]. Plants prevent
phytotoxicity by various processes which include formation of insoluble crystals, vesicles and
retention of elements by cell walls [55]. Further, metal tolerance is significantly influenced by
accumulation of metals in root cells [6,30]. Presence of excess amounts of metals is also shown
to cause acute toxic effects resulting in DNA damage [30,50,56]. Metals can bind to proteins,
leading to inhibition of activity or disrupting protein structure and/or metals can displace
essential elements resulting in deficiency effects [30]. Elevated levels of metals can stimulate
formation of free radicals and reactive oxygen species (ROS) such as singlet oxygen (O2),
hydrogen peroxide (H2O2), and hydroxyl radicals (-OH) that cause oxidative stress resulting in
cellular damage in organisms [30,57].
Plants have mechanisms to prevent oxidative stress, as well as, enzymes and other
compounds to avoid cell damage by inhibiting or quenching free radicals and ROS. Studies have
shown that plants have a range of mechanisms at cellular levels that are involved in metal uptake
[30,57]. Metal ions enter cells by competing with essential ions of similar ionic radii and with the
help of proteins (phytochelatins: PC and metallothioneins: MT) and transporters [30,57]. Both PC
and MT are cysteine rich metal chelating peptides capable of binding to various metals including
Cd, Cu, Zn, and As [30,58]. In animals and humans the excessive uptake of metals is the result of
the successive accumulation of these elements in food chain, with the starting point being soil
contamination. Knasmuller et al. [59] indicated that plant bioassays (mutagenic assay,

15
micronucleus assay and cytogenetics study) can effectively detect the genotoxic effects of metals.
These systems can be useful for bio-monitoring metals in soils.
Soil microbial community and their activities can be affected for decades from metal
contamination. The toxic effects of metals on soil microorganisms highly depend on their
bioavailability [9,15,24,33,50]. Significant reduction in a number of microbes, microbial growth
rates, biomass, activity, community composition, and diversity have been observed in soils
contaminated with metals [9,15,31,33,50]. Metal contamination at low levels has adverse effects
on bacteria but not on fungi [31,50,60,61].
Soil microorganisms vary widely in their tolerance to metal contamination. For example, in
bacteria, gram-negative cell walls have a lower charge capacity than gram-positive walls. But
they have a complex three layered structure that binds and immobilizes many metal ions
[mercury (Hg+) and Pb
2+] [50,56,62]. Studies have shown that gram-negative bacteria exhibit
greater metal tolerance than gram positive [50,56,62]. Various studies have reported a decrease in
bacterial activity but an increase in fungal activity in metal contaminated soils [9,50,60,61]. Other
studies also reported a delay, reduced, and complete elimination of arbuscular mycorrhizal fungi
(AM) and ectomycorrhizal fungi (ECM) colonization and spore germination in metal
contaminated soils [50,58,63,64]. In other studies, metal contamination had no significant effect
on fungal development, which could be due to presence of different ecotypes exhibiting different
degrees of tolerance to metals [50,63,64]. In polluted sites, fungi with higher tolerance to Cu, Zn,
Cd, and Pb compared to those from unpolluted soils have been identified. Therefore, relatively
high fungal colonization can be observed in plants growing in highly polluted soils [50,63,64].
However, at highest level of soil pollutions, fungal ecotypes and diversity diminish sharply due to

16
toxic effect of metals causing an inability of certain fungal species to colonize root system and/or
multiply in rhizosphere [50,63,64].
Metal resistance in microorganisms is usually due to metal chelation with organic ligands,
sequestrations, transportation out of cells, and biotransformation of ions to less bioavailable or
less toxic form [50,56,62]. The resistance mechanism varies with microbial species involved.
Uranium (Ur) has been shown to rapidly accumulate in cells of Saccharomyces cerevisiae and
Pseudomonas aeruginosa [56,62]. Bacillus subtilis cell walls bind to numerous metals (Hg2+
,
Pb2+
, Mg2+
, Fe3+
, Cu2+
, Na+ and K
+). This binding is a result of the presence of many anionic sites
on the cell wall, particularly: 1) phosphodiester groups of teichoic acids, 2) carboxyl group of
peptidoglycan, 3) sugar hydroxyl group of wall polymer and 4) amide group of peptide chain
(Mitchell; Hughes and Poole 1989). Similaly growing Saccharomyces cerevisiae in mercuric
chloride (HgCl2) resulted in extensive metal binding to high affinity sites on the cell wall [56].
Hyphal walls in Neurospora crassa bind to Cu, Fe, and Zn [56].
Some microorganisms (Thiobacillus, Serratia, Pseudomonas, Bacillus, Penicillium,
Aspergillus) produce various organic and inorganic acids that can extract metals from solid
substrates [56,62]. In addition to metal solubilization and transport, interaction between bacterial
exopolysaccharides and metals has also been identified. Charged functional groups such as
phosphate, carboxyl, hydroxyl, sulfate, and amide on the exopolymer are involved in adsorption
of metals onto cell wall [56,62]. A number of bacterial and fungal species have the capability to
transform metals to non-toxic form through methylation [56,62]. For example, studies have
shown that several bacteria (Clostridium, Pseudomonas, Bacillus, Mycobacterium, Escherichia
coli, Aerobacter aerogenes, and Bacillus megaterium) can methylate mercury (Hg) [56,62].
17
Fungi species such as Neurospora crassa are involved in methylation of Hg by complexing
mercuric ions with homocysteine or cysteine residue [56]. This requires enzymatic transfer of
methyl groups from alternative methyl donors which occur intracellularly [56,62].
Genes for metal resistance in the microorganisms are often present in plasmids and are
easily disseminated through a population or community in response to selection pressure
associated with metal exposure [9,50,65]. In bacteria, efflux pumping is the basis of toxic ion
resistance, involving transporters such as P-type ATPases or cation/H+ antiporter [30]. These
pumping systems are involved in Cu, Cd, Zn, Co, and Ni resistance. Specific czc genes that
encode for a cation-proton antiporter (CzcABC) which is responsible for resistance to Cd, Zn,
and Co have been indentified in gram-negative bacteria (e.g., Ralstonia eutropha and
Cupriavidus metallidurans) [50,65]. Similarly, ncc genes were found in gram-negative bacteria
(e.g., Alcaligenes xylosoxidans and Achromobacter xylosoxidans) resistant to Ni, Cd, and Co. Cd
resistance is linked to Cd-efflux ATPase, and cad operon which have been identified in gram-
positive bacteria (e.g., Staphylococcus, Bacillus or Listeria) [50,65]. Cu resistance has been
associated with cop system (Pseudomonas syringae) and pco system (Escherichia coli) where,
cop genes encode for different Cu-binding proteins that allow sequestration of Cu whereas, pco
system is an ion-dependent Cu antiporter [50].
Complexation of Cd by MT and glutathione (GSH) is a key mechanism for Cd tolerance in
ectomycorrhizal fungus (Paxillus involutus) [58,66]. Two MTs have been indentified in S.
cerevisiae: one is induced by Cu (encoded by CUP1) and the second is regulated by Cu, Zn, and
oxidative stress (encoded by Crs5) [66]. MTs have been identified in a number of fungal species
such as Agaricus bisporus, Gigaspora margarita, N. crassa, Pyrenopeziza brassicae, Podospora

18
anserine, and P. involutus [58,63,66]. Two fungal species (Candida glabrata, and
Schizosaccharomyces pombe) produce both MT and PC [58] while, Candida glabrata produce
metal chelating MT when exposed to toxic concentrations of Cu. But under Cd stress, it strictly
produces PCs [58]. In addition to avoidance and compartmentalization, fungi also have other
defense mechanisms that reduce oxidative stress generated by metal induced ROS by synthesis of
antioxidant enzymes such as superoxide dismutase (SOD), catalases (CATs), ascorbate
peroxidases (APX), GSH, glutathione S-transferase (GST), and glutathione reductase (GR)
[58,63]. When grown on media with varying concentrations of Zn, Glomus intraradices was
found to code for GST, SOD, cytochrome P450, and thioredoxin enzymes which are involved in
detoxification of ROS [58].
1.4 Remediation Technologies of Soils Contaminated by Metals
Increasing soil metal contamination has important health and economic implications.
Metals can be taken up by plants or leached into groundwater leading to food chain
contamination. Several cleanup methods have been investigated. They are divided into two
groups: 1) those that remove contaminants and 2) those that transform metals into harmless forms
[48,51,67]. These cleanup technologies can be applied on or- off-site (in situ or ex situ), using
three types of remediation treatments: 1) physical, 2) chemical, and 3) biological techniques
[48,51,67]. Some contaminated sites may require a combination of procedures for an efficient
remediation. Therefore, physical, chemical, and biological technologies may be used in
conjunction with one another to reduce the contamination to a safe and acceptable level.

19
1.4.1 Physical Remediation
Physical remediation includes soil replacement, thermal desorption, and electrokinetic
migration [48,67,68]. Soil replacement consists in using clean soil to replace contaminated soil to
dilute the concentration of pollutant [67]. Soil replacement effectively decreases the effect of
metals on environment but it is expensive and suitable for severely polluted small areas [67].
Thermal desorption consists in heating soil in a chamber where organic contaminants and certain
metals can be vaporized [67,68]. Hence, thermal desorption depends on metals volatility and
temperatures (e.g. Hg and As) [67,68]. It is divided into low temperature (90 - 320°C) and high
temperature desorption (320 - 560°C) based on temperature in the operating chamber [67,68].
This technique has several advantages. It is simple and less expensive to process, remediated soil
is reused, and it is environmentally friendly [67,68]. Its disadvantages include, high cost of
device and long desorption time. It is not equally effective for all soil types, and it cannot be used
for all metals [67,68].
Electrokinetic process consists in passing a low intensity electric current between a cathode
and an anode imbedded in the contaminated soil [48,69]. Anions move towards anode (positive
electrode) and cations towards cathode (negative electrode) [69]. Buffer solutions are used to
maintain the pH at the electrodes as it is essential in the optimization of the process efficiency
[48,69]. Metals are removed by electroplating or precipitation/co-precipitation at the electrodes,
using ion exchange resins or they can be recovered by pumping the waste to the surface [48,69].
Metals can be removed from soil since they are bound to it as oxides, hydroxides, and carbonates,
[48,69]. In Europe, this technology is used for Cu, Zn, Pb, As, Cd, Cr, and Ni [69]. This method
has several advantages: 1) can be used in situ or with excavated soil, 2) effective with clay soils
of low permeability, 3) accelerated rate of contaminant transport and extraction can be obtained

20
[48,69]. However, heterogeneities, large metal objects, rocks, amounts of oxides, foundations,
rubble, other obstacles, moisture content, temperature, and other contaminants can interfere with
the process [48,69]. Electrode duration and spacing is site-specific and may need to be optimized
[69].
1.4.2 Chemical Remediation
Chemical remediation technique includes all the methods involving reagents or external
compounds [48,68]. This includes chemical leaching and fixation, vitrify technique, and chemical
immobilization [48,67,68]. Chemical leaching is a volume reduction and waste minimization
treatment done on excavated (ex situ) soil or on-site (in situ) [68,70]. It involves washing
contaminated soil with fresh water and solvents which have the ability to solubilize metals
[67,68,70]. Leaching solution and chelators are added to extract metals from soil [48,67,68].
Chemical fixation technique involves addition of reagents to metal contaminated soils. These
agents are then used with metals to form insoluble and nontoxic forms. This process decreases
the migration of metals into the environment [67].
Vitrify technique involves heating soils to extremely high temperatures between 1,400 °C
and 2,000 °C [67]. The mobility of metals is reduced by high temperature treatment which results
in the formation of vitreous materials, usually an solid oxide [67,70]. Increased temperature melts
contaminated soil, buried wastes or sludges rendering the material nonhazardous [67,70]. This
technique can be applied to water, debris, and various soil types. In situ vitrifications are
preferred due to low energy requirement and cost. Ex situ process includes excavation,
pretreatment, mixing, feeding, melting and vitrification, gas collection and treatment, and
forming or casting of the melted products [67,70].

21
Chemical immobilization is an in-situ technique where inexpensive materials (e.g. lime,
fertilizers, fly ash, Fe/Mn oxides, and cement) are added to contaminated soil. They can remove
and/or stabilize metals in soils, resulting in a substantial reduction of costs [15,24,48,70,71]. This
relies on a fundamental understanding of natural geochemical processes governing the speciation,
migration, and bioavailability of a given metal in the environment [48,72]. In-situ chemical
immobilization technique provides long term remediation solution by decreasing the
concentration of contaminants by sorption or precipitation [48,70–72]. Mobility and
bioavailability play a huge role in solubility of metals. Increased sorption and decreased
solubility reduce pollutant transport and redistribution into the environment [9,71,72]. Chemical
immobilization treatments serve also as reactive barrier which prevents metal seepage from
recovery pits and other processing areas on active and inactive sites [72]. The redistribution of
metals by means of solute transport mechanism can adversely affect ecosystem, water resources,
and human populations [70,72].
Chemical immobilization of metals uses phosphate and alkaline based materials to adsorb,
chelate or complex metals in soils [70,72]. Metal contaminated soils treated with phosphates
(apatite) reduce metal solubility by forming metal phosphate precipitates and minerals [70,72].
Addition of phosphate material and presence of sufficient level of soil P have proven to be
extremely effective as chemical immobilization of Pb and Zn [70,72]. In addition to reducing
metal solubility, it decrease bioavailability of metals to plants and animals [70,72].
Chemical immobilization using alkaline amendments (lime) reduces metal solubility in
soils by increasing pH and metal sorption to soil particles [15,24,39,71]. Increased soil pH and
carbonate buffering lead to the formation of metal-carbonate precipitates, complexes, and

22
secondary minerals [15,24,39,72]. Soils become acidic because basic cations are replaced by H+
on the soil colloidal complexes [15,24,39,72]. As pH decreases, the availability of P, K, Ca, and
Mg is reduced, while the availability of Zn, Mn, Cu, and Fe increases [15,24,39,72]. Various
studies have used lime (calcium containing inorganic material) as chemical amendment for
remediation of soils contaminated with metals [9,15,48,71].
In addition to increasing pH, lime is used to increase mineralization of soils with Ca and in
some cases, Mg [15,24,39,45]. It further, reduces metal solubility, improves soil structure, and
stabilizes soil nutrients, which helps reduce soil erosion resulting in an increase in SOM
[15,24,39]. Lime can be applied as calcium hydroxide (Ca(OH)2), calcium oxide (CaO) or
calcium carbonate (CaCO3) to effectively neutralize soil acidity [72,73]. Addition of lime
neutralizes acidity, and increases microbial activity in soils. In GSR, dolomite lime
(CaMg(CO3)2) was applied as it primarily neutralizes acidity but also provides Ca and Mg for
plant uptake [15,24]. The role of both Ca and Mg together is crucial to metal toxicity as they
create a competitive exclusion of metal ions [15,24,39,45].
The increase in pH when lime is added to soil depends on the CEC [73,74]. Soils with low
CEC will show a more marked pH decrease compared to soils with high CEC [73,74]. Also, low
CEC is associated with rapid leaching of added basic cations and a quick return of original
acidity unless additional liming is applied [73,74]. Ions in liming materials combine with
hydrogen ions in the soil to produce water (H2O) and CO2 reducing soil acidity as described in
following equation:
Soil-4H+ + CaMg(CO3)2 → Soil-Ca
2+ + Soil-Mg
2+ + 2CO2 + 2H2O.

23
The reaction neutralizes H+ and releases Ca
2+ and Mg
2+, resulting in an increase in soil pH
and CEC [73,74]. Ca2+
and Mg2+
ions replace H+ on the existing pH-dependent CEC whose
magnitude changes under the influence of increased alkalinity [73,74]. After lime application,
higher exchangeable Ca than Mg is observed due to higher selectivity of the colloidal negative
sites for Ca2+
than for Mg2+
[73,74]. As long as the soil supplies acidity in the form of H+, the
above reaction will continue.
In the GSR, the primary factor limiting plant growth was low pH combined with elevated
Cu, Ni, and Al concentrations [15,24]. Experiments on germination and early growth of grasses
in GSR revealed the inhibitory effects of Cu and Ni on root growth [15]. Synergistic effect was
observed where these elements enhanced each other’s phytotoxic effect, resulting in total toxicity
that is more than the sum of the individual toxicity [15]. On the contrary, interaction between Ni
and Al was antagonistic, as Al was protecting the plants from increased Ni concentrations [15]. In
Sudbury, liming application to metal contaminated soils created positive feedback loops
throughout the system and had an immediate detoxifying effect [15,24,25,45]. Application of
limestone to toxic and barren soils triggered immediate colonization of native plant species
through germination of existing seed and incoming wind disseminated seeds [15,24]. It also
depressed the adverse effects on the early root and mycorrhizal development on planted seedlings
[15,24]. Therefore, liming application on metal contaminated soils in GSR became a trigger
factor.
Chemical immobilization has its advantages and disadvantages. Advantages include: 1) low
cost, 2) simplicity and rapidity, 3) broad spectrum of pollutants can be targeted, and 4) high
public acceptability [67,68,70]. The main disadvantages are: 1) difficulty in removing

24
permanently the contaminants (temporary solutions), 2) change in soil physiochemical properties
can activate pollutants, 3) only the surface layer is reclaimed and, 4) permanent monitoring is
required [67,68,70]. Therefore, chemical immobilization is often performed along with biological
remediation.
1.4.3 Biological Remediation
Biological technique is a sustainable remediation technology to rectify and re-establish
natural conditions of the soil [48,75]. This technology consists of in-situ remediation using plants
(phytoremediation) and microorganisms (bioremediation) to clean up contaminated soil and
water [48,67,76]. In many developed and developing nations, phytoremediation has been
accepted widely for its potential to clean up polluted sites [48,67,75]. Phytostabilization,
phytovolatilization, and phytoextraction are the three main types of phytoremediation [67,75,76].
Phytostabilization consists in immobilization of metals in soil through absorption and
accumulation by roots, or adsorption onto roots or precipitation within the root zone. This
reduces metal bioavailability and migration into ground water or the food chain [67,75,76].
However, metals that are absorbed by plants get converted into volatile forms. Subsequently, they
are released into the atmosphere by the process called phytovolatilization. This has been used for
removal of volatile metals like Hg and selenium (Se) from polluted soils [67,76]. This technology
is only suitable for volatile contaminants and is limited because it does not remove the metal but
rather transfers them from one medium (soil or water) to another (air) from which they can re-
enter soil and water [67,75,76].
Phytoextraction refers to the uptake of metals from soil or water by plant roots and their
translocation and accumulation into any harvestable plant parts [67,75,76]. Some accumulator

25
species possess exceptionally high metal accumulating capacity and are known as
hyperaccumulators. They can survive and even thrive in heavily contaminated soils [67,76,77].
Recently, removal of metal through phytoremediation, especially by hyperaccumulators has
received wide attention due to its efficacy and cost efficiency [67,76]. The main criteria used for
hyperaccumulation classification varies according to metals, ranging from 100 mg of metal /kg
dry mass of plant for Cd to 1000 mg/kg for Cu, Co, Cr, and Pb [76,77]. According to the US
department of energy, to be considered as hyperaccumulators plants should have the following
characteristics: 1) have high accumulating efficiency under low contaminants concentration; 2)
accumulate high concentrations of contaminants, 3) accumulate different types of metals, 4) grow
fast and with large biomass, and 5) have pest and disease resistance ability [67,76,77]. Most of
the commonly known metal hyperaccumulators belong to the Brassicaceae or Fabaceae families
[75,77]. However, more than 400 plants species have been reported to be hyperaccumulator
plants, and a considerable number of species show the capacity to accumulate two or more
elements [75,77].
Phytoremediation technology has certain advantages and disadvantages as well.
Advantages include: 1) low-cost, 2) low-energy, 3) being environmentally friendly, 4) far less
disruptive to the soil environment, 5) avoids excavation and is socially acceptable, and 6) plants
are easy to implement and maintain [76,77]. The disadvantages include: 1) time consuming due
to slow growth, 2) affected by changes in climatic conditions, 3) proper disposal of plant biomass
after remediation, 4) contaminants may enter soil again due to litter formation, and 5) root
exudates may enhance the solubility of pollutants and consequently increase the distribution of
metals into soil environment [76,77].

26
The main drawback of phytoremediation is the storage and accumulation of pollutants in
plant materials. The remediation process slows down and often becomes inadequate when the
contaminated site has multiple pollutants. The appropriate solution to these problems is to
combine microbe-plant symbiosis within the plant rhizosphere or to introduce microbes as
endophytes to allow degradation of pollutants within the plant tissues [76,78]. Studies have
shown that microbial populations in rhizosphere is much higher than in vegetation-less soil, as
plant provide essential nutrients for microorganisms [76,78]. Microorganisms in turn are
involved in various processes which benefit plant health, growth, and development [9,76,78].
Therefore, this approach accelerates removal of pollutants and supports high plant biomass
production for bioenergy.
In the last decade, attention has been drawn to biological remediation which involves the
use of microorganisms to clean up contaminated soil and water. Microorganisms cannot degrade
and destroy metals, but affect the migration and transformation by changing their physical and
chemical characterization [67,76,78]. Bioremediation is divided into two categories: 1)
biosorption and 2) bioaccumulation. Biosorption is a passive adsorption mechanism that is fast
and reversible where, metals are retained by means of physicochemical interaction (ion exchange,
adsorption, complexation, precipitation, and crystallization) between metals and the functional
groups (carboxyl, phosphate, sulfate, phenyl, amide, and hydroxyl groups involved in metal
binding) present on the cell surface [76,78,79]. Both living and dead biomass can occur for
biosorption because it is independent of cell metabolism. On the other hand, bioaccumulation is
an active process of metal removal by living biomass which uses both intra- and extra-cellular
processes [76,78,79].

27
Microbes mobilize metals by leaching, chelating, methylation, and redox transformation
[67,76,78]. Leaching is a simple and effective technology for extracting valuable metals and has
potential for remediation of mining sites, treatment of mineral industrial water products,
detoxification of sewage sludge, and for remediation of soils and sediments contaminated with
metals [67,76]. Microorganisms use metals as terminal electron acceptors or reduce them through
detoxification mechanism. They then remove them from contaminated environment [76,78]. In
addition, they also remove metals through mechanisms that they employ to derive energy from
metals redox reaction, to deal with toxic metals through enzymatic and non-enzymatic processes
[76,78]. The redox reaction takes place in soil between metal and microorganism where,
microorganisms act as oxidizing agents for metal and cause them to lose electrons. In anaerobic
conditions, microbes oxidize organic contaminants by reducing electron acceptor, while in
aerobic condition, oxygen acts as electron acceptor [76]. For example, microorganisms reduce the
state of metals and change their solubility. Dixit et al., [76] reported that Geobacter species
reduce uranium (U) from a soluble state (U6+
) to insoluble state (U4+
).
Several studies have shown that many microorganisms have a natural capacity to biosorb
metals, and use different defense systems (exclusion, compartmentalization, complex formation
and synthesis of binding proteins and peptides) to reduce stress developed by toxic metals
[76,78,79]. In the presence of metals, some microorganisms produce cysteine-rich metal binding
proteins and peptides, such as glutathione GSH, PCs, and MTs, which can bind and sequester
metal ions into biologically inactive forms [76,78,79]. In E.coli, expression of different metal
binding proteins and peptides regulates the accumulation of Cd [76,79]. Dixit et al. [76] reported
that co-expression of GSH along with PC resulted in two fold increase in Cd accumulation.
Coelho [79] on the other hand, demonstrated the ability of certain fungi (e.g., Aspergillus and

28
Penicillium) and some yeasts (e.g., Saccharomyces cerevisiae) to remove metals from
contaminated sites.
Studies have shown that metal toxicity to plants can be reduced by the use of plant growth
promoting microorganisms which exert some beneficial effects on plant development [76,78].
The use of endophytes and rhizospheric microorganisms associated with degradation of
pollutants in soil is promising for remediation of metal contaminated sites. Kluyvera ascorbate,
metal resistant bacterium, has been reported to promote canola (Brassica campestris) growth in
the presence of high concentrations of Ni [78]. Mycorrhizal fungi reduce metal toxicity to their
plant host by binding metals to their cell wall or surrounding polysaccharides [67,78].
Mycorrhizae reduce the concentrations of metals therefore, reducing their hazardous effect to
plants [67,78]. Yao et al. [67] reported that Cd uptake from hyphal compartment was higher in
mycorrhizal than non-mycorrhizal plants and a large proportion of the increased Cd content was
sequesterd in roots. It was concluded that AM fungi can transport Cd from soil to plants through
extraradical hyphae, but that transfer is restricted due to immobilization of metals.
The application of bioremediation on a large scale can be challenging. Bioremediation can
be affected by different factors such as temperature, oxygen, moisture, and pH [67,76,78,79].
There are some limitations to the application of this technology. Some microorganisms can only
degrade special contaminants, and native bacterial populations might be affected if new microbes
are added to the ecosystem to cleanup contamination. This might incur secondary pollutions
[67,76,78,79]. Also, industrial scale application would not be of interest if the microorganism is
difficult to cultivate [76,79].

29
1.5 Soil Microbial Community and its Biodiversity
Microorganisms constitute a small proportion of soil but are vital to the overall functioning,
stability and sustainability of ecosystems [50,80]. Soil microbes have body widths of < 100 µm
and are the most abundant and diverse groups of organisms, where a single gram can contain tens
of thousands of species [3,81]. They have unique ability to adapt to extreme conditions imposed
by low nutrients, temperature, pH, and contamination, among others [80]. Soil microbes are
considered as the biological engine of the earth, as they perform numerous fundamental processes
including nutrient cycling, degrading pollutants, and regulating plant communities [50,80].
Hence, increasing attention is being directed towards microorganisms as the fertility and health of
soil depends on their chemical composition and also on the qualitative and quantitative nature of
microorganisms inhabiting it [2,3,50].
Microorganisms are divided into two main groups: 1) prokaryotes (simple organisms
without a defined nucleus, which include bacteria and archaea) and 2) eukaryotes (complex
organism with a true nucleus that include algae, fungi, and protozoa) [50,80]. In soil, all
microorganisms are closely associated with soil particles, especially clay-organic matter
complexes [50,80]. These microorganisms in soil can be found as single cells or as biofilms
embedded in a matrix of polysaccharides and their activities and interactions with other microbes
and organisms depend on microhabitat conditions [50,80]. The most primitive microorganisms
are bacteria and archaea, which have been observed in diverse environments [50,80]. Fungi
appeared comparatively recently and it is thought that terrestrial fungi may have coevolved with
plants as they are closely associated with them [50,80]. Although fungi are often thought to be
exclusively terrestrial, several species have been found in aquatic ecosystems.

30
Bacteria are prokaryotic organisms which usually have a rigid cell wall, divide by binary
fission, and some are capable of photosynthesis [50,80]. Bacteria are the least structurally
complex of the microorganisms and yet have the greatest diversity [80]. They are dominant group
of microorganisms in various kinds of soil and play an important role in the ecosystem such as
recycle biomass, control atmospheric composition as well as components of phytoplankton and
soil microbial populations [50,80]. Bacteria are further divided into: 1) gram-positive bacteria
and 2) gram-negative bacteria based on the cell wall [50,80]. Bacterial populations are influenced
by temperature and moisture but they can withstand extreme environments [50,80]. For example,
bacteria can thrive in arid desert soils, where temperatures are very high and also in arctic regions
where temperatures are below freezing [50]. In addition, some bacteria form spores that possess a
tough outer covering which facilitates their survival in all adverse environments [50,80]. Bacteria
are grouped into three groups based on their temperature tolerance: thermophiles (45-65°C),
psychrophiles (below 10°C) and mesophiles (15-45°C) [80]. However, the bulk of bacteria in
soils are mesophiles. Bacterial concentrations in soils range from 108 to 10
9 per gram of soil and
their biomass range between 40 and 500 g/m2 [82]. It is estimated that there are more than 50
bacterial phyla based on the analysis of the conserved 16S rRNA sequence [80].
Fungi on the other hand, are eukaryotic organisms that have rigid cell wall, single cell
forms (yeast), multicellular forms (hyphae, mycelium), reproduce by budding, and have no
photosynthetic members [2,50,80]. Although bacteria are the most abundant in terms of number
of individuals, fungi are a physically larger group of eukaryotic microorganism with greatest
biomass [2,80]. It is reported that fungi concentrations in different soils range from 105 to 10
6 per
gram of soil and their biomass ranges between 100 and 1500 g/m2 [2,80,82]. As many as 2500
species have been reported to occur in single location [2]. Fungi have a primary role as

31
decomposers, and are involved in recycling biomass and stimulate plant growth [50,80]. The
quality and quantity of organic matter impact fungal flora and populations as fungi are
heterotrophic organisms [80]. In addition, fungi can grow in acidic, neutral, or alkaline soils
which give them an advantage over bacterial populations [50]. To date, tens and thousands of
species have been identified in soils, representing approximately 170 genera [2].
1.5.1 Biodiversity
Biodiversity is defined as the variability among living organisms on earth from all sources
(terrestrial, marine, other aquatic ecosystems) and the ecological complexes of which they are
part [83]. Biological diversity is divided into several components: 1) species diversity – number
and abundance of different species that occupy a location, 2) species richness – number of
different species, 3) relative abundance (evenness) – number of individuals within each species
and 4) genetic diversity – variation in genetic material within a species or within a population
[40,83]. In addition to biodiversity, there is also functional diversity which describes the
biological function of species or group of species in an ecosystem [2,83,84].
1.5.2 Soil Biodiversity
From a biological and physiochemical perspective, soil is the most diverse ecosystem on
earth [2,3,85]. Soil harbors a huge variety of organisms, many of which are still unknown. Soil
biodiversity denotes all organisms inhabiting soil, and depending on the size, these organisms are
divided into micro, meso, and macro-fauna and flora [3,50]. The sizes of soil organisms range
from < 100 µm body width for microbes (archaea, bacteria, fungi) and microfauna (protozoa,
nematodes) to mesofauna (collembola, mites) with body width between 100 µm and 2mm,

32
macrofauna (earthworms, insects) with body width > 2 mm and up to megafauna (moles, voles)
with body width > 2 cm [3].
Microbial population diversity is significantly affected by various physical (moisture,
temperature), biotic factors (predation, competition), and chemical factors (pH, CEC, dissolved
nutrients, salinity, organic matter) as well as natural and anthropogenic activites [2,3]. Because of
the vast diversity of microorganisms in the soil and as all species cannot be isolated and studied
in pure culture, the assessment of microbial community diversity in soil represent one of the most
challenging and enthralling aspects of microbial studies.
1.6 Microbial Community Assessment Methods
A wide range of techniques are available that allow various aspects of community structure
to be assessed. Traditional approaches are based on culturing microorganisms (bacteria and
fungi) on selective media. Although the ecology of individual species can be studied in detail,
only 1% of the total microbial community is culturable.
1.6.1 Phospholipid Fatty Acid Analysis (PLFA)
One of the microbial community assessment methods that do not rely on culturing
microorganisms is phospholipid fatty acids (PLFA) analysis [3,86,87]. It is widely used for
estimation of total microbial biomass and to assess broad changes in the soil microbial
community composition [86,87]. PLFA analysis involves using phospholipids which are the
primary lipids composing cellular membranes to identify microorganisms [3,88]. Over 200
different fatty acids have been characterized from various prokaryotic and eukaryotic organisms,
they vary significantly among different organisms, making them powerful tools in taxonomic

33
studies [89]. The main advantages of PLFA technique is that, it is quantitative and particular
PLFAs are nominally assigned to broad-scale bacterial and fungal groups [3,88]. Also,
phospholipids are present only in viable microorganisms as they are associated with the
membranes of living cells which break down rapidly when the cells die [88,89].
The technique consists in the extraction of lipids from the soil using organic solvents
followed by separation of phospholipids from other lipids according to their polarities using solid
phase extraction [86–88]. PLFAs are then converted to fatty acid methyl esters (FAMEs), which
are analyzed by gas chromatography (GC) to determine the types and quantities of each
microorganism [86–88]. Fatty acids extracts are used to determine bacteria (gram positive, gram
negative, actinomycetes, anaerobes), fungi (AM fungi and other fungi), and other eukaryotes
biomasses in soil [87]. The 15:0, i15:0, a15:0, c17:0, i17:0, a17:0, c19:0 fatty acids are
commonly used as signature fatty acids for bacteria, 16:1ω5, 18:1ω7, 18:1ω9c, 18:2ω6c for
fungi, and 10Me16:0, 10Me17:0, 10Me18:0 for actinomycetes
Fatty acids used as specific markers for one group of organisms may occur in other groups
in variable concentrations [90,40,91]. For example, gram positive bacteria have relatively more
iso-, anteiso- or otherwise-branched fatty acids, gram negative bacteria have more
monounsaturated or cyclic fatty acids, actinomycetes often have a methyl group in the tenth
carbon atom from the carboxyl end of the chain, and fungi have more long-chain polyunsaturated
fatty acids than bacteria [90,88,91]. A number of studies have reported an increase in gram-
negative bacteria and a decrease in gram-positive species in different stress conditions (e.g. acidic
soils, metal contamination) [90–93]. The presence of cyclo fatty acids in the membranes and
outer lipopolysaccharides layer in gram-negative bacteria enhances their survival under stress

34
conditions [88]. In addition, gram-negative bacteria are fast growing microorganisms that utilize
a variety of C sources and adapt quickly to a variety of environmental conditions [88]. Bacterial
biomass is estimated by combining several fatty acid markers from both gram-positive and gram-
negative bacteria [88,91].
Polyunsaturated fatty acids are associated with fungi. Studies have shown that fungi appear
to be more tolerant to metals and acidic soils than bacteria [13,31,90,40,61,93]. However, a
decrease in fungal markers in field studies contaminated with metals has been documented
[36,88]. Contact of hyphae with metal pollutant affects fungal biomass. PLFA 18:2ω6 and
18:2ω9, indicators of ECM fungi have been linked to damage of fine roots due to pollutions
[88,91]. These fatty acids are not exclusive to fungi as they are also present in many eukaryotic
organisms, including plants [40,91]. Fatty acids such as 16:1ω5 and 18:1ω7 are good indictors of
AM fungi [94,95], and are valuable biomarkers. However, they can be also produced by bacteria.
They have been reported to decrease in response to metal pollutions and to increase in soil after
restoration [88]. Although studies have reported that fungi prefer acidic soil since their growth is
generally optimal in soils with a pH between 2 and 7 (with an optimum growth of 5) [13], a
decrease in fungal biomass has been associated with a decrease in soil pH [31,93,96].
In addition to biomass and community structure determinations, PLFA analysis has been
used to get an insight into physiological status of microbes. For example, fungal/bacterial ratio is
used as an index of relative abundances of these two main groups of microbial decomposers in
polluted soils [88,91]. Fungi:bacteria ratios are reduced in systems impacted by disturbances
[13,31,90,40,61,93]. In addition, an increase in the trans/cis and the saturated/unsaturation ratio
in soil indicate stressed environment [92]. An increase in trans/cis ratio in the presence of metals

35
has been observed. This is due to the interaction of metals with microbial membrane fatty acids,
disturbing their conformation [88,97]. The increase in cy17:0/16:1ω7c ratio is also associated
with stressed conditions. A relative increase in cyclopropyl fatty acids compared to their
monoenoic precursors has been observed during prolonged stationary growth phase, growth
under low C and O2 concentrations, low pH and high temperatures [88]. An increase in cy17:0
and cy19:0 relative to 16:1ω7c and 18:1ω7c (metabolic precursors) has been linked to
physiological stress due to metal pollution [88,97]. In addition, transformation of cis double
bonds into a cyclopropane ring restricts overall mobility, reducing the impact of environmental
stress in membrane fluidity. An increase in the abundance of 16:1ω5, monounsaturated fatty
acids, and cy19:0 with a decrease in pH are general indicators of direct pH effect [40,92].
Phospholipids make up a relatively constant fraction of cell biomass, thus, a change in fatty
acid profile signifies an alteration in the microbial community [88,89]. Although, soil analysis
using PLFA does not result in detection at species level, it gives an overall picture of the
community structure and provides an estimate of overall change [88,89]. In fact, since the early
90’s, this technique has been employed to study soil microbial community composition and
population density, changes to environmental conditions, soil type, contamination, and alterations
in plant community and agricultural practices [35,36,40,97]. PLFA analysis has shown that
microbial community can be altered by changes in management practices, substrate availability
and composition, soil type, seasonal variation in soil nutrient, and plant characteristics. When
compared to molecular analysis, PLFA has an advantage as it has the ability to determine fungi to
bacteria ratios for a given soil system [98].

36
1.6.2 454 Pyrosequencing
Quantifying community structure at a higher resolution requires the use of molecular
techniques. Among various methods used to estimate microbial community compositions and
diversity in habitats, the most useful involves sequencing of ribosomal genes [99–101]. This
technique is well suited for different types of community analysis studies as: 1) they are found
universally in archaea, bacteria, and eukarya, 2) these genes are composed of highly conserved
regions and regions with considerable sequence variation and 3) they are easily amplified using
polymerase chain reaction (PCR), and 4) can be sequenced rapidly [99–101].
Next generation sequencing such as 454 pyrosequencing facilitates identification of
microorganisms at the species level and their relative abundance in soils [100,102]. The 454
pyrosequencing platform is a new type of second generation sequencing technology that is rapid,
flexible, cost effective, produces 25 million base reads in a single run with an accuracy of 99%
and does not require a cloning step [102]. The capabilities of 454 pyrosequencing have led to its
use for microbial whole-genome sequencing and improvements in sequence quality and read
length have enabled applications to high-resolution analysis of microbial populations [99–102].
Pyrosequencing analysis of soil microbiome consists in determining the sequences of 16S
ribosomal RNA (rRNA) genes (i.e. encoded by rDNA) in prokaryotes, 5S or 18S rRNA genes or
internal transcribed spacer (ITS) region sequence variation in eukaryotes [100,103]. The 16S
rRNA is found in the smaller subunit of the ribosome and is highly conserved between organisms
[104]. Related organisms have fewer differences in the gene sequence than less related ones and
those with a 98% match are considered to be isolated from the genome of the same bacterial
species [101,104]. As sequencing of the 16S rDNA genes has been carried out frequently in

37
microbial ecology, there is a considerable database of known sequences [101]. The ITS regions
includes ITS1 and ITS2 regions, separated by the 5.8S gene, and situated between the 18S and
28S genes in the rDNA repeat unit [105]. Because of its higher degree of variation than other
regions of rDNA, variability among individual rDNA repeats can sometimes be observed within
the ITS regions [106]. This region is the most frequent and widely sequenced DNA region in
fungi and it is routinely used to address research questions related to systematic, phylogeny and
identification of strains and specimens at and below the species level [103]. Currently ~172,000
full length fungal ITS sequences are deposited in GenBank [103].
In general, 454 pyrosequencing generates a large number of reads through a massively
parallel sequencing by synthesis approach [100,107]. It is capable of generating up to one
millions reads of ~ 500 bp in a single run on the genome sequencer FLX [107]. Metagenomics
refers to the analysis of genetic material sampled directy from the environment. In environmental
genomics application of pyrosequencing, DNA is extracted from an entire microbial community
and a particular target region is flanked by conserved primers which are amplified by PCR before
sequencing [3,88]. In 454 pyrosequencing, a unique sample-specific identifier (barcode) sequence
is added to the DNA that is to be sequenced [81,107,108]. Barcoding of pyrosequencing
templates allows for multiple samples to be sequenced in parallel [3,81,107,108]. After
sequencing, reads are sorted into sample libraries via detection of the appropriate barcode. DNA
barcodes have been used to detect undescribed and cryptic species, allowing complex and
ecological interactions to be investigated and to determine accuracy of species content of
commercial products [107].

38
In spite of the large sequence output and dropping costs, substantial sampling efforts may
still be required to ensure sequence representativeness [3,81,108]. While relatively low
sequencing effort (as few as 100 sequences) is needed to compare very different environments
according to their microbial diversity, thousands of reads might be necessary for comparing
closely related communities [3,107]. Pyrosequencing delivers a fast and substantial sequencing
output which provides between 4500 and 52,000 unique operational taxanomic units (OTUs)
[81,109].
Acosta-Martinez et al. [109] reported differences in bacterial diversity in soil under
different vegetation and management. They observed difference not only in the richness
(presence or absence) but also in evenness (distribution) of bacteria. Golebiewski et al. [110]
looked at the bacterial community in metal polluted soils and reported that Zn decreased both
diversity and species richness at species and family levels and that plant species richness did not
correlate with bacterial diversity. They also found that in spite of differences between samples,
they shared many OTUs. Li et al. [99] characterized bacterial diversity in a reclamation site
undergoing fertilization practices and an adjacent coal-excavated site using 454 high-throughput
16S rDNA sequencing. They identified dominant taxonomic groups that include Proteobacteria,
Acidobacteria, Bacteroidetes, Betaproteobacteria, Actinobacteria, Gammaproteobacteria,
Alphaproteobacteria, Deltaproteobacteria, Chloroflexi, and Firmicutes in both sites [99].
However, the bacterial communities' abundance, diversity, and composition differed significantly
between the two sites [99]. Lauber et al. [111] and Rousk et al. [93] analyzed bacterial
community in soils with different pH. Bacterial community composition, as measured by
pairwise UniFrac distances, was significantly correlated with differences in soil pH which was
largely driven by changes in relative abundance of Acidobacteria, Actinobacteria, and

39
Bacteroidetes across the range of soil pHs [111]. Similarly, Rousk et al. [93] reported that both
relative abundance and diversity of bacteria were positively related to pH. The composition of
bacterial communities in both studies was closely defined by soil pH indicating the dominance of
pH in structuring bacterial communities.
Although pyrosequencing has revolutionized our understanding of bacterial communities,
very few studies have investigated fungal diversity and community structure. Lim et al. [112]
looked at fungal communities in soils from Korea and China. A total of 372 tentative taxa were
identified and the majority of fungal sequences recovered in the study belonged to the
Ascomycota (182 taxa in 2,708 reads) and Basidiomycota (172 taxa in 6,837 reads). The
predominant species of Ascomycota detected have been described as lichen-forming fungi,
litter/wood decomposers, plant parasites, endophytes, and saprotrophs. Most sequences derived
from Basidiomycota matched ECM and wood rotting fungi. In addition, a high number of
sequences in the Thelephorales, Boletales, Stereales, Hymenochaetales, and
Ceratobasidiomycetes were also found. Rousk et al. [93] looked at the fungal community across
a pH gradient in soils and reported that relative abundance and diversity of fungi were unaffected
by soil pH. This was consistent with results from pure culture studies that showed that fungi
exhibit wider pH ranges for optimal growth [13,35].
The effectiveness of 454 pyrosequencing in analyzing soil microbial diversity has been
validated and an association between land ecological system restoration, mostly mediated by
microbial communities, and an improvement in soil properties in reclaimed areas has been
established. In addition, studies suggest that structure of soil microbial communities is

40
predictable, to some degree, across large spatial scales, and the effect of soil pH and metal
pollution on microbial community composition is evident.
1.7 Microbial Activity and Functionality Measurement
Species diversity is correlated with a high degree of functional diversity, which is the
capacity to utilize a wide variety of substrates and carry out a wide array of processes [2,3,9].
Soil microorganisms perform a large number of functions including soil nutrient biochemical
cycling, decomposition of both above and below-ground litter, and formation of organic matter
[2,3,9,80]. Functional diversity is an important mechanism which allows for soil microbial
communities to successfully respond to anthropogenically induced changes to the soil
environment [9,80].
A number of methods have been developed to investigate soil functional diversity which
involves understanding communities and ecosystem [113]. Soil biological activities are the most
common approaches used to assess microbial function and is determined by measuring the
overall rate of entire metabolic processes (soil respiration), and soil enzyme activity
[9,34,114,115]. These properties are most useful in detecting the deterioration of soil quality and
are closely related to nutrient cycles. Soil respiration has great potential as an indicator of
ecosystem metabolism and fine scale processes [116]. Enzyme activities are especially significant
because of their major contribution to the ability of the soil to degrade organic matter [117].
1.7.1 Soil Respiration
Soils are the largest carbon pool in the terrestrial ecosystems. The carbon cycle in an
ecosystem is usually initiated when plants fix CO2 from air and converts it to organic carbon

41
compounds through photosynthesis [118]. Some of the CO2 is released back into the atmosphere
through plant respiration (aboveground respiration). During this process some organic carbon
compounds are broken down to provide plants with nutrients. Similarly, belowground dead plant
materials (litter) are decomposed by microorganisms to provide energy for microbial growth and
other activities [119]. Microbial biomass is mixed with organic residuals of dead plants and
microbes to form soil organic matter (SOM) [120]. SOM can store carbon in soil for many years
before it is broken down to CO2 through respiration.
Soil respiration is defined as the process of gas exchange between organisms and
environment. It is the major pathway of carbon transfer from soil to atmosphere [116]. It is
assessed by measuring total soil CO2 efflux at the soil surface and it depends on many biotic and
abiotic factors [121]. Biotic process comprises of rhizosphere, microbial, and faunal respiration
[118,121]. Abiotic factors are divided into chemical and physical processes. The chemical
process consist of oxidation of soil minerals [118,121]. Physical process involves soil CO2
degassing and its transport through soil to the surface [118,121]. Fluctuations in soil respiration
rate have profound impact on SOM, soil microbial community, nutrient availability, plant health,
and the atmosphere [119]. Research on soil and its metabolism has been conducted since the
1800’s and major factors that influence soil fertility and respiration have been identified. Some of
the factors include: substrate quantity and quality, soil temperature, soil moisture, O2 and N
concentrations, soil texture, and pH [118]. Soil respiration decreases under saturated or dry
conditions and the biological activity doubles for every 7 °C rise in temperature until the
optimum temperature is reached (varies between organisms) [122]. The most efficient soil
organic matter decomposers are aerobic; thus, soil respiration rates decline as soil oxygen
concentrations decrease [118,122].

42
Stres et al. [123] looked at the relationship between soil water content and microbial
activity and reported that microbial communities are stable and do not respond significantly to
seasonal changes in soil conditions. Stres et al. [123] and Yiqi and Zhou [118] reported that air
drying increased soil fertility (nutrients), and decreased the number of microorganisms. They
found that that CO2 efflux is curvilinear to soil moisture. Soil microbial communities can adapt to
stringent environment conditions of the terrestrial life, where stress from repeated cycles of
precipitation and drought have created highly unpredictable environments [124]. Microbial
activity is reduced under critical levels of moisture, resulting in desiccation-resistant dormant
stages such as spores or cysts in some species [118].
Anderson [125] stated that soil fungi, with extensive multicellular networks of hyphae,
produce hyphal strands that bridge across air-filled pores and can tolerate greater water stress
compared to bacteria. The study also demonstrated that amoebae, and common protists in soils,
encyst at low levels of soil moisture, but rapidly excyst under favorable conditions when
sufficient moisture is present. Raich and Schlesinger [126] showed that soil CO2 efflux is usually
low under dry conditions due to low root and microbial activities, it increases with soil moisture.
In very high soil moisture condition, CO2 efflux is reduced due to limitation of diffusion of
oxygen and suppression of CO2 emissions [118,125,126]. Overall, a linear relation between
global soil respiration and mean annual precipitation was observed. Review of different studies
suggests that patterns of precipitation and soil moisture are likely to have a significant effect on
soil microbial community and their respiratory rate.
Yiqi and Zhou [118] showed that roots contribute 7 to 17% of total respiration, litter 6 to
16%, and soil microbes 67 to 80% in grasslands. Likewise, other studies on forest ecosystems

43
revealed that 35% of soil respiration was from roots, 48% from litter, and 17% from soil
[118,127]. Yiqi and Zhou [118] estimated annual soil CO2 efflux to be 452 gC/m2yr
1 (grams of
carbon per unit of area per unit of time) in tall grass prairies by applying a temperature-
respiration regression to continuous temperature records [118]. This was consistent with other
analyses of samples from grassland that estimated annual CO2 efflux to be between 357 and 421
gC/m2yr
1 based on monthly averages of soil respiration [118,127]. In tropical forests, the
estimated annual release of CO2 was about 1000 gC/m2yr
1 [128,129]. CO2 released at the soil
surface depends on CO2 gradient and is strongly affected by wind gusts, turbulences, and
fluctuations in atmospheric pressure [118,127–129].
Knowledge of sampling sites and characteristics of nearby soils also become very
important when evaluating respiration [130]. Soil color provides some help when interpreting the
amount of organic matter and respiration rates [2,118]. For example, a very black soil generally
contains more organic matter (dead plants and animal matter) than a brown soil [2,6]. Lighter
color soil with high respiration rate is indicative of soil being depleted of organic matter [131]. A
relatively darker soil with the same respiration rate is considered healthy. Water and air move
through reddish soils easily and this red color is from the oxidation of Fe [2,131]. In grey or blue-
grey soils, water and air movement is slow [131]. This color also reflects that soil is old and tired
out, and has very little organic matter [2,131].
Addition of organic materials generally increases soil respiration [118]. Organic matter
provides food or substrate on which heterotrophic soil microbes feed [2,6]. Organic materials
with low C/N ratio (high nitrogen content) decompose quickly, thus the addition of these
materials to soil will increase soil respiration [132]. Materials with a high C/N ratio decompose

44
more slowly but provide a more stable, long term supply of organic material than legumes,
biosolids, and manures [122]. Further, soil microbes compete with plants for N when soil is
amended with compounds having C/N ratios higher than 25/1 [122]. Stable soil aggregates
increase active organic matters and protect from rapid microbial decomposition [2,6].
Agroecological practices that increase soil moisture, soil temperature, and optimal aeration
accelerate soil organic matter decomposition [118,122,132].
Overall, soil respiration is generally positively correlated with soil organic matter content,
microbial biomass and activity. However, this correlation is not always significant when soils are
polluted with metals [133]. The reasoning is that metals can reduce soil respiration by killing
microorganism or forming complexes with the substrates [134]. Shermati and Varma [9] found a
significant decrease in CO2 release in metal contaminated soil. Other studies reported an increase
of CO2 production in metal polluted soils [135,136]. These differences among studies may be due
to variations in the levels of metal contamination, source of contamination, period over which the
responses were monitored, and soil characteristics.
There are several methods used to measure soil respiration. Solvita soil test is the most cost
efficient method for estimating soil respiration [137,138]. Soil is analyzed using a CO2-burst
(Haney-Brinton) test [138]. This procedure is a standard soil protocol which is listed by the ALP
(Agricultural Lab Proficiency) program and the NAPT (North American Proficiency Testing)
program. The test is easy to perform and accurately measures CO2 respiration. The test further
helps to 1) determine how well a soil is provided with active SOM, 2) estimate potential N and P
mineralization potential, 3) measure or evaluate the C flux from surface soils, and 4) estimate soil
microbial biomass [138].

45
1.7.2 Soil Enzymatic Activity
Enzymes are vital activators that play a substantial role in maintaining soil health and its
environment [117]. Soil enzymes are synthesized by microorganisms, and act as biological
catalysts that facilitate different reactions and metabolic processes [139,140]. They play a key
biochemical function in the overall process of organic matter decomposition in the soil system
[117,141]. Soil enzymatic activities vary because of the quality and quantity of SOM content,
composition, and activity of its microbial community as well as intensity of biological processes
[117,141]. They are often used as indices for microbial growth and activity [117]. Major soil
enzymes include arylsulfatases, chitinase, cellulose, dehydrogenase, glucosidase, phosphatase,
protease, and urease released from plants, animals, and microorganisms [117].
Research has demonstrated that terrestrial ecosystems, plants and microorganisms compete
for resources but are mutually dependent on each other [142]. Soil microbes need labile organic
compounds from plants to mineralize nutrients from organic to inorganic forms [143]. Plants lack
biochemical pathways and enzymes necessary to breakdown/convert organic compounds to
obtain nutrients [143]. Therefore, they rely on nutrient supply mediated by soil microorganisms.
For example, for N cycling, plants are only capable of using inorganic N (ammonia: NH+4
and
nitrate: NO-3
) [142]. They need ammonia to build amino acids, but most N in the atmosphere is in
the form of N2. Plants lack nitrogenase enzyme to convert gaseous N to ammonia. Some
microorganisms (N2 fixing bacteria) are capable of converting organic N into inorganic N [142–
144].
Sulfur is found in two forms in soil: 1) sulfate-esters and 2) sulfonates [145,146]. These
forms of oragno-S are not directly available to plants and many bacteria and fungi are capable of

46
mineralizing S from sulfate-esters [146]. Sulfonates are mobilized exclusively by bacterial
multicomponent mono-oxygenase enzyme [145,146]. Soil S cycling involves complex
interactions between several free living and symbiotic root associated microbial populations
[146]. Like S and N, soils contain a large amount of total P but only a small portion is readily
available for plant uptake. Plants obtain P from soils in the form of orthophosphate anions
(HPO4-2
and H2PO4-1
) [144]. Phosphatases are required for the mineralization of organic P [144].
Therefore, microorganisms are essential to plant growth as they enhance their ability to acquire
nutrients from soils.
Enzymatic activities are frequently used to determine the influence of various pollutants on
soil microbial quality [139,141]. Reports have shown that soil enzymes are inhibited by metals to
different extent depending on soil structure and chemistry [117,141]. In addition, soil enzyme
inhibition also depends on the nature and concentration of metals and its extent varies from one
enzyme to another. Some metals stimulate enzymatic activities [139,141,147]. Reduction in soil
microbes and the inhibition of soil enzyme activities caused by metals contamination negatively
affect soil fertility [139,141].
Metals inhibit enzyme activities by interacting with substrate complexes, denaturing
enzyme protein and interacting with its active site [139,141]. Cu inhibits β-glucosidase activity
more than it does with cellulase activity [141]. Belyaeva et al. [148] showed that activities of
urease, catalase, and acid phosphatase were significantly decreased in soil due to Pb
contamination. Lorenz et al. [149] reported that As contamination significantly affected
arylsulfatases activity whereas Cd contamination had a negative effect on the activities of
protease, urease, alkaline phosphatase, and arylsulfatases. Overall, studies have reported a drastic
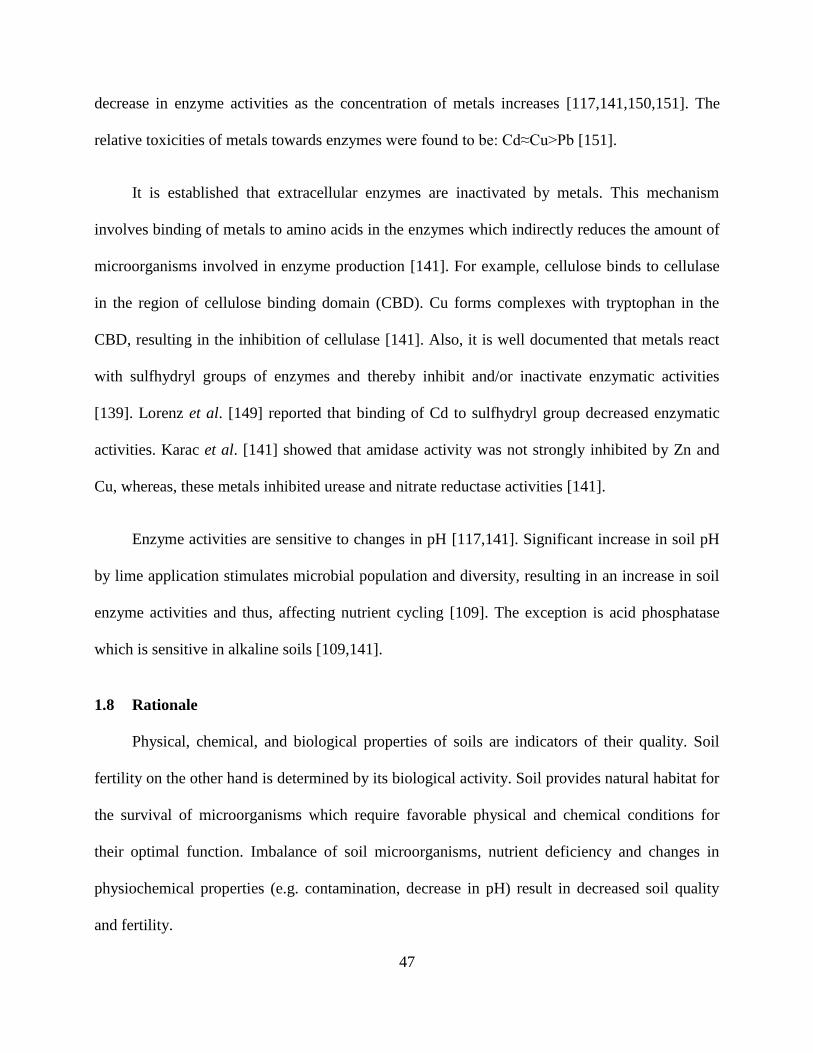
47
decrease in enzyme activities as the concentration of metals increases [117,141,150,151]. The
relative toxicities of metals towards enzymes were found to be: Cd≈Cu>Pb [151].
It is established that extracellular enzymes are inactivated by metals. This mechanism
involves binding of metals to amino acids in the enzymes which indirectly reduces the amount of
microorganisms involved in enzyme production [141]. For example, cellulose binds to cellulase
in the region of cellulose binding domain (CBD). Cu forms complexes with tryptophan in the
CBD, resulting in the inhibition of cellulase [141]. Also, it is well documented that metals react
with sulfhydryl groups of enzymes and thereby inhibit and/or inactivate enzymatic activities
[139]. Lorenz et al. [149] reported that binding of Cd to sulfhydryl group decreased enzymatic
activities. Karac et al. [141] showed that amidase activity was not strongly inhibited by Zn and
Cu, whereas, these metals inhibited urease and nitrate reductase activities [141].
Enzyme activities are sensitive to changes in pH [117,141]. Significant increase in soil pH
by lime application stimulates microbial population and diversity, resulting in an increase in soil
enzyme activities and thus, affecting nutrient cycling [109]. The exception is acid phosphatase
which is sensitive in alkaline soils [109,141].
1.8 Rationale
Physical, chemical, and biological properties of soils are indicators of their quality. Soil
fertility on the other hand is determined by its biological activity. Soil provides natural habitat for
the survival of microorganisms which require favorable physical and chemical conditions for
their optimal function. Imbalance of soil microorganisms, nutrient deficiency and changes in
physiochemical properties (e.g. contamination, decrease in pH) result in decreased soil quality
and fertility.

48
To date, studies have provided information on landscape degradation, soil toxicity,
acidification, plant metal accumulation, plant genetic diversity, and forest composition in
Northern Ontario but knowledge on soil health and microbial community is lacking. In addition,
the effect of metal contamination and liming on microbial (bacterial and fungal) biomass, relative
abundance and diversity in the GSR needs to be investigated. Continued monitoring of soils are
essential in understanding ecosystem recovery following the reduction of emissions from
smelters and the establishment of a reforestation program.
1.9 Objectives
The main objective of this study was to assess the long term effect of liming and metal
contamination on the belowground components of the ecosystem. The specific objectives were:
1) To determine the effects of long-term soil metal contamination on bacterial and fungal
diversity and abundance using PFLA and pyrosequencing analyses
2) To assess the long term effects of liming on: a) soil microbial biomass and composition
(bacteria, fungi, and actinomycetes), and b) bacterial and fungal population dynamic and
diversity in reclaimed ecosystems.
3) To assess the effect of liming and metal contamination on soil enzymatic activities and
respiration.
We hypothesize that metal contamination will decrease microbial biomass, abudance,
diversity and their enzymatic activity. For liming, an increase in these parameters will be
observed.

49
CHAPTER 2: BACTERIAL AND FUNGAL COMMUNITY STRUCTURE AND
DIVERSITY IN THE GREATER SUDBURY REGION UNDER LONG-TERM METAL
EXPOSURE REVEALED BY PHOSPHOLIPID FATTY ACID AND
PYROSEQUENCING ANALYSIS

50
2.1 Abstract
Metals are known to alter soil ecosystem diversity, structure and function. The main
objective of the present study is to determine the effects of soil metal contamination on bacterial
and fungal biomass, relative abundance, and diversity based on phospholipid fatty acid (PLFA)
and pyrosequencing analyses. Soil samples from six sites from Northern Ontario (Canada) were
analyzed. Chemical analysis showed significant difference between metal contaminated and
reference sites for pH, cations exchange capacity (CEC), soil organic carbon (C) and nitrogen
(N). Significant differences between metal contaminated and uncontaminated reference sites were
observed for total bacteria, arbuscular fungi (AM fungi), other fungi and eukaryotes.
Acidobacteria and Proteobacteria were the most dominant bacterial taxonomic groups in all the
sites. For fungi, Ascomycota were more prevalent in metal contaminated soils (35.07%) while
Basidiomycota represented 59.26% of all fungi in reference areas. Site-specific bacterial and
fungal families and genera were identified and characterized. Analysis of bacterial communities
revealed Chao1 index values of 232 and 273 for metal contaminated and reference soils,
respectively. For fungi, the Chao index values were 23 for metal contaminated and 45 for
reference sites. OTUs followed the same trend for both bacteria and fungi. No significant
differences were observed for Simpson index, Shannon index and species evenness between two
soil groups for bacteria and fungi. Overall, PLFA and pyrosequencing analyses revealed
significant reductions of microbial biomass and relative abundance in contaminated sites
compared to reference soil type. No significant variations in microbial diversity were observed
when all the sites were compared.
Keywords: Microbial biomass and diversity, Phospholipid fatty acid (PLFA), Pyrosequencing,
Metal contamination, Northern Ontario

51
2.2 Introduction
While the effects of many factors such as invasive species, habitat diversification, climate
change, pollution and temperature on the biodiversity of plants and animals are well established
and studied, little attention has been paid to soil microbial communities. Soil contains enormous
microbial diversity, with an estimated 107–10
9 distinct bacterial species [152] and 1.5 million
fungi taxa [153] worldwide. Nowadays, an ever increasing rate of species extinction is resulting
in destructive consequences for ecosystem functions and will also limit the potential economic
benefits of biodiversity [35,40,154,155].
Mining related activities have resulted in severe land disturbances throughout the world.
For nearly a century, logging, smelting and mining activities have caused severe negative effects
to the environment in the Greater Sudbury Region (GSR) in Northern Ontario, Canada
[15,27,29,38,40,156]. This region was reported to be the greatest single source for sulfur dioxide
(SO2) emissions in Canada [15,27,29,156]. In addition, Sudbury smelters released into the
atmosphere large quantities of metals including iron (Fe), nickel (Ni), and copper (Cu). In fact,
Falkowski [18] reported that, over 14,000 tonnes of Fe, 2000 tonnes of Ni, and 1800 tonnes of Cu
were released annually into the atmosphere.
These metals and SO2 emissions have caused damage to plants, animals, and soil
microorganisms. Severe contamination and acidification of soils and water at sites around
smelters have been documented [15,27,38,40]. In the last 40 years, SO2 and metal emissions have
been reduced drastically through a combination of developments in industrial technologies (safer
extraction methods and better filtration) and legislated controls in the GSR [15,38,40]. This has
resulted in an improvement in atmospheric quality and natural recovery of damaged ecosystems.

52
In addition, land reclamation is being implemented by a regional regreening program. It consists
of limestone application to soils, seed distribution and tree planting (with over 12 million trees
planted so far in many areas of the GSR) [15,40]. This has led to an increase of plant species
diversity, soil organic matter, and microbial biomass [15,33,40].
Although some metals are required for life's physiological processes, excessive
accumulation in living organisms is always detrimental. A sustainable ecosystem depends on
functional microbial communities, which play a significant role in organic matter decomposition,
degradation of toxic substances, nitrogen fixation, nutrient cycling, production of phytohormones
as well as plant health and growth [35,40,99,155]. Knowledge of the interaction between metals
and soil microorganisms is very limited.
There is no consensus on the effects of metals on microbial diversity and abundance. Guo
et al. [157] reported no impact on bacterial diversity in soils from two abandoned copper mines
contaminated with metals using polymerase chain reaction-denaturing gradient gel
electrophoresis (PCR-DGGE) analysis. Other studies have shown that both short-term and long-
term exposure to metals results in the reductions of soil microbial biomass, diversity (based on
PCR-DGGE) and its activity [158–160]. It is also established that metals at high concentrations
cause enzyme inactivation and damage cells by acting as antimetabolites or by forming
precipitates or chelates with essential metabolites in microorganisms [161]. Analyses of
microbial diversity in metal contaminated samples based on a sensitive and detailed high
throughout sequencing analysis are sketchy. Chodak et al. [162] analyzed bacterial diversity in
forest soil with different degrees of heavy metal pollutions and found no effects of heavy metals
on the soil bacteria structure measured by pyrosequencing. Golebiewski et al. [110] found that

53
zinc (Zn) decreased bacterial diversity and species richness based on 16S rDNA pyrosequencing.
Data on damages caused by nickel (Ni) and copper (Cu) to soil microbial communities are
sketchy. Likewise, studies on the effects of metals on fungi diversity and structure are lacking.
We hypothesized that metal contamination (as due to mining activities such in the GSR)
imposes distinct impacts on the microenvironment in which microorganisms (specifically
bacteria and fungi) exist and that variation in the microbial community structures would be
associated with the changes in the physiochemical properties of the soils. The main objective of
the present study is to determine the effects of long-term soil metal contamination on bacterial
and fungal diversity and relative abundance using PFLA and pyrosequencing analyses.

54
2.3 Materials and Methods
2.3.1 Study Site and Soil Sample Collection
The study was carried out at six locations close to mining sites in Sudbury, Northern
Ontario, Canada. This region has been exposed to abundant deposition of metals, notably Ni and
Cu, emitted through active smelting for over a century. The soils of the Sudbury area are mostly
tills, podzols and brunisols and formed in sandy fluvial and glaciofluvial deposits [163]. Six sites
were selected from Northern Ontario (Fig. 1). Sites were classified as metal contaminated and
reference based on data from previous soil physico-chemical analyses [25,38,40]. Metal
contaminated sites include Laurentian, Kelly Lake, and Kingsway. Reference sites include
Onaping Falls, Capreol, and Killarney. The GPS coordinates of these sites are given in table S1.
No specific permissions were required for soil sampling at these locations since the sites are part
of Laurentian University research areas and crown (public) lands that are not within a park or a
conservation reserve.
Major environmental conditions such as temperature, and rainfall were presumed similar
among the sites based on literature [163–165] while metal, organic matter contents, and cation
exchange capacity (CEC) may vary [25,38,40]. Metal contaminated sites were characterized as
sandy/clay soil rich in total Ni and Cu. Each site was approximately 5 km2 in size. At each site,
20 samples were collected randomly from the organic layer (0–5 cm in depth). Plant material,
stones and residues were removed; and soil samples from each site were bulked and mixed. They
were sieved using a 2 mm mesh and stored for a short period prior to analyses (in an incubator
for soil chemical analyses and in a freezer for PLFA analysis). DNA from the soil samples were
extracted the same day (within hours) after sampling.

55
Figure 1: Geographical locations of the sampling area from the Greater Sudbury Region
(GSR) in Northern Ontario.
Metal contaminated sites: Laurentian, Kelly Lake and Kingsway and, Reference sites: Onaping
Falls, Capreol and Killarney

56
2.3.2 Soil Chemical Analysis
Soil pH was determined on air dried subsamples in deionized water and in neutral salt
solution (0.01 M CaCl2) [166]. CEC was measured using an ammonium acetate extraction
method at pH 7 developed by Lavkulich [167]. CEC is a measure of the quantity of readily
exchangeable cations neutralizing negative charge in the soil. The exchangeable cations
aluminum, Al3+
; calcium, Ca2+
; iron, Fe3+
, potassium, K+; magnesium, Mg
2+, manganese, Mn
2+
and sodium, Na+ were quantified by inductively coupled plasma mass spectrometry (ICP-MS).
The total exchange capacity was estimated as the sum of the exchangeable cations [168]. Total
concentration of metals were measured after digestion of 0.5 g of soil samples with 10 ml of 10:1
ratio of HF/HCl at 150 °C [25]. Bioavailable metals were assessed after shaking 5 g of soil
samples with 20 ml of 0.01 M LiNO3 for 24 h at 20 °C followed by filtration of extracts [25].
Total and bioavailable metals were detected using ICP-MS.
2.3.3 Phospholipid Fatty Acid Analysis
PLFA analysis was performed at FAME Lab, Microbial ID. Inc, Newark, Delaware (USA)
as described by Buyer and Sasser [86]. Mole percentage of each PLFA was used to indicate the
relative abundance of bacteria (gram positive and gram negative bacteria), arbuscular
mycorrhizal (AM) fungi and other fungi in soil. Total PLFA extracted from soil was used as an
index of living microbial biomass [40,86].
2.3.4 Microbial DNA Extraction and Purification
Microbial DNA was extracted from 10 g of fresh soil per site by using the PowerMax®
Soil DNA Isolation Kit for soil (MO BIO Laboratories, Inc., Carlsbad, CA, USA, cat # 12,988–
10), according to the manufacturer's instructions. The concentration and purity of the extracted

57
DNA were determined with a fluorescent DNA quantification kit (Bio-Rad Laboratories,
Hercules, CA, USA, cat # 170-2480) following the procedure described by the manufacturer.
Finally, extracted DNAs were diluted to concentration of 2 ng/μl for all samples prior to
pyrosequencing analysis that was performed at Molecular Research DNA laboratory (MR DNA,
Shallowater, Texas, USA).
2.3.5 PCR Amplification and Pyrosequencing
Bacterial and fungal microbiotas were assessed using high throughout sequencing of 16S
and internal transcribed spacer (ITS) genes. Tag-encoded FLX-titanium 16S rDNA gene
amplicon pyrosequencing (bTEFAP) was performed using 16S universal eubacterial primers
530F (5′ GTG CCA GCM GCN GCG G) and 1100R (5′ GGG TTN CGN TCG TTR) for
amplifying the 600 bp region of 16S rDNA genes [108]. Fungal tag-encoded FLX amplicon
pyrosequence (fTEFAP) was performed using ITS specific primers ITSF (5′ TCC GTA GGT
GAA CCT GCG G) and ITSR (5′ TCC TCC GCT TAT TGA TAT GC) to amplify 600 bp
fragments of the ITS region [103]. Generation of the sequencing library utilized a one-step PCR
with a total of 30 cycles, a mixture of hot start and Hotstar high fidelity Taq polymerases as
described by Dowd et al. [108]. Tag-encoded FLX amplicon pyrosequencing analyses utilized a
Roche 454 FLX instrument with titanium reagents. This bTEFAP and fTEFAP process was
performed at the MR DNA Laboratory based on established and validated protocols.
2.3.6 Data Processing
Sequences were processed using a proprietary analysis pipeline (MR DNA) for analyzing
16S rDNA data. Barcodes and primers were removed from the sequences. Additionally,
sequences less than 200 bp, sequences with ambiguous base calls and homopolymer runs

58
exceeding 6 bp were removed. Also, sequences were denoised, and chimeras and singleton
sequences were deleted. Filtered sequences were clustered into OTUs (Operational Taxonomic
Units) at 97% sequence similarity cut-off. These OTUs were taxonomically classified using
BLASTN (Basic Local Alignment Search Tool for Nucleotides) against a curated GreenGenes
database and compiled into each taxonomic level.
2.3.7 Statistical Analysis
Data was tested for normality using Shapiro-Wilk test. All statistical analyses were
performed with SPSS version 20 statistical software (SPSS, Chicago, IL, USA) for windows.
Metal content, CEC and pH data were subjected to a t-test. A Pearson r correlation coefficient
was used to determine association between soil pH and CEC as well as between pH and
exchangeable cations (p≤0.05). Microbial biomass (total PLFA), abundance and composition
(bacterial and fungal PLFAs) were also analyzed by t-test.
t-test was also used to determine differences between bacterial and fungal species relative
abundance. Alpha diversity (within each site) and beta diversity (between sites) were analyzed.
Alpha diversity includes community diversity (Shannon and Simpson diversity indices), evenness
(Shannon equitability index), and richness (abundance based coverage estimator, Chao1).
Differences in the frequency distribution for bacterial and fungal taxonomies were determined
between metal contaminated and reference soils based on a non-parametric (Kolmogorov-
Smirnov test).
Beta diversity (pair wise comparisons) among sites was analyzed using Jaccard index
(similarity index, based on the presence/absence data). In addition, Whittaker index that is a
dissimilarity index determined based on abundance or relative abundance. Beta diversity was also

59
estimated by computing weighted UniFrac distances among sites. Weighted UniFrac is a
qualitative variant that is widely used in various microbial studies as it accounts for relative
abundance of observed organisms.

60
2.4 Results
2.4.1 Characteristics of the Soil Samples
Results of metal analysis are described in Figs. 2 and 3. As expected, there were significant
differences (p≤0.05) between metal contaminated and reference sites for arsenic (As), Cu, Ni, and
zinc (Zn). The amounts of total metals in reference sites were small and consistent with the levels
found in other uncontaminated soils in Canada (Fig. 2). The highest level of metal content was
observed in metal contaminated sites. Soil pH ranged from 4.50 to 5.30 in the top organic layer.
In addition, differences in pH were observed between all the metal contaminated sites and the
reference sites (Table 2). The highest level of CEC was observed in the reference soil and lowest
in metal contaminated soils (Table 2). This was a reflection of the amount of exchangeable Ca2+
,
Mg2+
, and K+ in the two soil types. The values of exchangeable Na
+ were low in both the metal
contaminated and reference sites (Table 2).
The sum of exchangeable cations was high in reference sites and low in metal contaminated
sites (Table 2). Overall, positive correlations between soil pH and CEC (r = 0.78; p≤0.05) and
between soil pH and exchangeable cations (r = 0.67; p≤0.05) were observed. Organic matter
content was significantly lower (p≤0.05) in metal contaminated compared to reference sites
(Table 2).
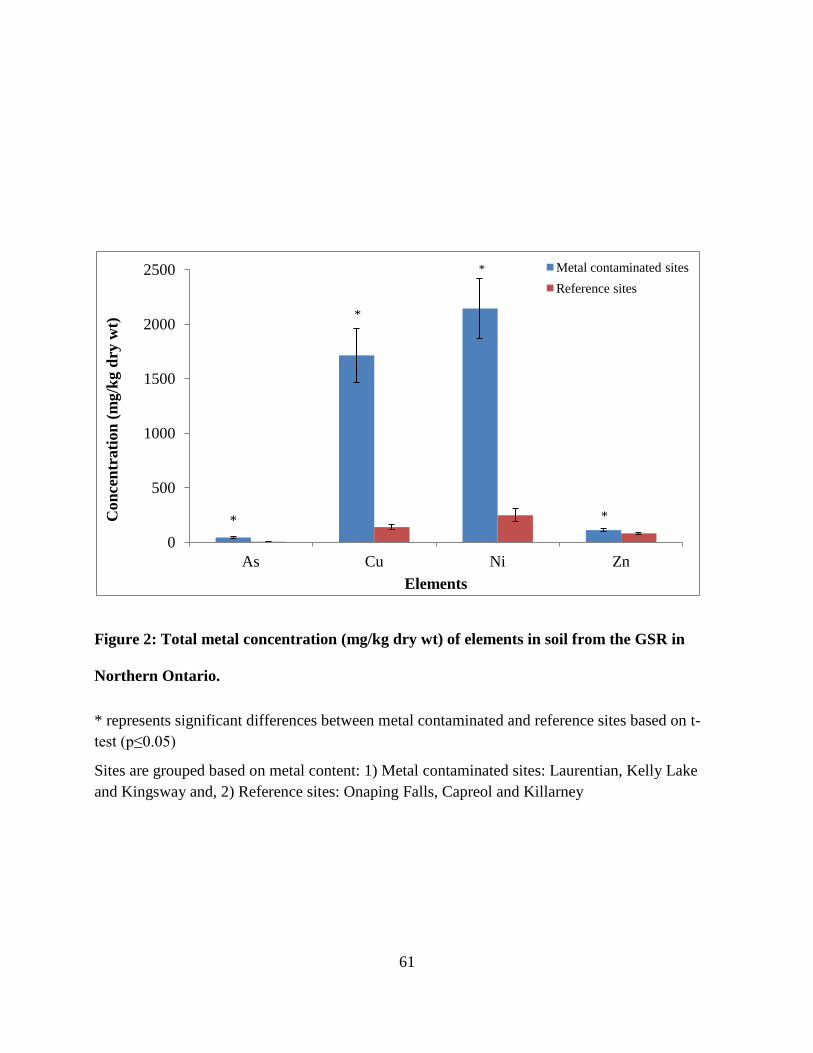
61
Figure 2: Total metal concentration (mg/kg dry wt) of elements in soil from the GSR in
Northern Ontario.
* represents significant differences between metal contaminated and reference sites based on t-
test (p≤0.05)
Sites are grouped based on metal content: 1) Metal contaminated sites: Laurentian, Kelly Lake
and Kingsway and, 2) Reference sites: Onaping Falls, Capreol and Killarney
0
500
1000
1500
2000
2500
As Cu Ni Zn
Con
cen
trati
on
(m
g/k
g d
ry w
t)
Elements
Metal contaminated sites
Reference sites
* *

62
Figure 3: Bioavailable metal concentration (mg/kg dry wt) of elements in soil from the GSR
in Northern Ontario.
* represents significant differences between metal contaminated and reference sites based on t-
test (p≤0.05)
Sites are grouped based on metal content: 1) Metal contaminated sites: Laurentian, Kelly Lake
and Kingsway and, 2) Reference sites: Onaping Falls, Capreol and Killarney
Bioavailable Arsenic (As) concentration was below detection limit for all the sites
0
2
4
6
8
10
12
14
16
Cu Ni Zn
Con
cen
trati
on
(m
g/k
g d
ry w
t)
Elements
Metal contaminated sites
Reference sites *
*
*

63
Table 2: Mean values of basic cations (Ca2+
, Mg2+
, K+ and Na
+), sum of cations, CEC, pH
and total C and N in the Greater Sudbury Region.
Characteristics Metal contaminated sites Reference sites
Ca2+
(cmol/kg)* 0.94 ± 0.36 4.38 ± 0.30
Mg2+
(cmol/kg) 0.29 ± 0.15 0.71 ± 0.22
K+ (cmol/kg) 0.15 ± 0.05 0.25 ± 0.04
Na+ (cmol/kg) 0.02 ± 0.01 0.01 ± 0.00
Sum of cations (cmol/kg) 1.39 5.35
CEC (cmol/kg)* 2.20 ± 1.06 6.20 ± 2.01
pH (H20)* 4.50 ± 0.16 5.30 ± 0.12
pH (0.01M CaCl2)* 3.90 ± 0.08 4.80 ± 0.08
Total organic C (mg/kg)* 129750.00 ± 7932 257333.33 ± 3975
Total organic N (mg/kg)* 5688.33 ± 1277 9490.00 ± 1344
Total organic C/N 22.17 27.12
Results are expressed as mean values ± standard error
* represents significant differences between metal contaminated and reference sites based on t-
test (p≤0.05)
CEC: cation exchange capacity; C: carbon and N: nitrogen
Metal contaminated sites: Laurentian, Kelly Lake and Kingsway and, Reference sites: Onaping
Falls, Capreol and Killarney

64
2.4.2 Phospholipid Fatty Acid Analysis
Results of the PLFA analysis are described in Table 3. The analysis revealed significantly
high (p≤0.05) total microbial biomass in reference soil samples compared to metal contaminated
soil (Table 3). The same trend was observed for the abundance of bacteria, AM fungi, other fungi
and other eukaryotes (Table 3).
There were twice more gram negative than gram positive bacteria in reference sites. Similar
trend was observed in metal contaminated sites. Overall, there were more bacteria than fungi in
the soil samples analyzed (Table 3). In fact, bacteria represent 64.62% and 69.68% in metal
contaminated and reference sites, respectively. These values were only 13.16% (metal
contaminated) and 16.15% (reference sites) for fungi biomass.
Palmitic acid (16:0) was the most prevalent (13.96%) of all the fatty acids identified in all
the soil samples. In addition to palmitic acid, other common and abundant fatty acids were 15:0
(2.42%), i15:0 (7.18%), i16:0 (2.10%), 16:1ω5c (2.63%), 16:1ω7c (6.65%), 10Me16:0 (3.97%),
cy17:0ω7c (2.87%), 18:0 (2.42%), 18:1ω7c (8.66%), 18:1ω9c (10.83%), 18:2ω6c (8.07%) and
cy19:ω7c (9.82%). These fatty acids were present in all the samples and made up 79.93% and
81.93% of total fatty acid content in the metal contaminated and reference soil samples,
respectively. Also, several fatty acids representing bacteria (15:0, i15:0, a15:0, c17:0, i17:0,
a17:0, c19:0), fungi (16:1ω5, 18:1ω7, 18:1ω9c, 18:2ω6c) and actinomycetes (10Me16:0,
10Me17:0, 10Me18:0) were present in all soil samples. Gram positive bacteria include many
branched PLFAs such as 17:0 and 18:0, or iso- and anteiso-branched PLFAs, like i15:0, i16:0,
i16:1 and i17:0. Fatty acids 16:1w5, 16:1w9, 17:1w9, cy17:0, 18:1w7and cy19:0 are used as
indictors of gram negative bacteria.

65
Table 3: Microbial organisms identified using phospholipid fatty acid (PLFA) analysis in soil samples from the GSR. Data in
ng/g.
Sites Total
Microbial
Biomass*
AM
Fungi*
Other
Fungi*
Gram
Negative*
Gram
Positive*
Other
Eukaryote*
Anaerobe Actinomycetes
Metal contaminated
sites
160.28
±51.19
6.10
±1.67
18.34
±9.92
64.09
±7.42
42.45
±6.30
5.09
±1.82
2.13
±1.05
31.62
±5.29
Reference sites
422.89
±50.71
16.37
±1.81
52.24
±10.04
200.08
±12.66
93.98
±11.03
17.44
±4.35
4.99
±0.84
37.79
±4.16
Results are expressed as mean values ± standard error
* represents significant differences between metal contaminated and reference sites based on t-test (p≤0.05)
Metal contaminated sites: Laurentian, Kelly Lake and Kingsway and, Reference sites: Onaping Falls, Capreol and Killarney

66
Monounsaturated 18 carbon fatty acids (18:1ω7c and 18:1ω9c) were mostly enriched in
reference soil samples compared to metal contaminated soil. Reference soils had higher
abundances for the majority of monounsaturated fatty acids (16:1ω5c, 17:1ω9c, 18:1ω7c and
18:1ω9c), cy19, branched fatty acids (i14:0, i15:0, a15:0, i17:0 and a17:0), straight chain fatty
acids (14:0, 15:0, 16:0, 17:0 and 20:0), cy17, and other 10Me fatty acids compared to metal
contaminated sites.
2.4.3 Pyrosequencing Analysis
Gene based analysis identified various bacterial and fungal taxa illustrated in Tables S3 and
S6. Statistical analysis revealed significant differences in relative abundance of bacterial and
fungal species between the two soil types (Tables S3 and S6). The reads generated in this project
have been deposited in the NCBI Short Read Archive database (Accession number: SRP071853).
2.4.3.1 Bacterial Community Composition and Diversity Analysis
A total of 131 bacterial species were identified from all the soil samples analyzed (Table
S3). Further analysis revealed some species that were found only in certain soil group. Overall,
18 species were identified only in metal contaminated soils and 35 in reference soils (Table S2).
All the bacteria identified belong to 15 phyla and four Proteobacterial classes. The most
dominant phyla across all samples were Acidobacteria (39.10%), Proteobacteria (44.06%),
Actinobacteria (5.43%), Chloroflexi (4.94%) and Firmicutes (3.55%). Alphaproteobacteria,
Betaproteobacteria and Gammaproteobacteria were the most abundant Proteobacteria in both
soil types. Chloroflexi and Firmicutes were the least abundant of the five phyla in the soil
samples analyzed (Table 4). Armatimonadetes, Bacteroidetes, Candidate division,

67
Cyanobacteria, Gemmatimonadetes, Lentisphaerae, Planctomycetes, TM6, TM7 and
Verrucomicrobia were rare phyla identified representing globally <1% of all identified phyla.
At the genus level, comparison of the relative abundance revealed significant differences
(p≤0.05) between metal contaminated and reference soils. Acidobacterium was the most abundant
genus across all soil samples, representing 18.96% in metal contaminated and 15.08% in
reference soil. The distribution of other dominant genera Afipia, Aquicella, Candidatus
koribacter, Candidatus solibacter, Geobacillus, Granulicella, Nitrosococcus, Rhodoplanes,
Skermanella, Thermosporothrix and Thioalkalispira varied significantly between the metal
contaminated and reference soils (p≤0.05). Afipia, Candidatus solibacter, Granulicella,
Nitrosococcus and Rhodoplanes showed a higher relative abundance (p≤0.05) in reference soils
compared to metal contaminated soil samples. The opposite trend was observed for the relative
abundance of Aquicella, Candidatus koribacter, Geobacillus, Skermanella, Thermosporothrix
and Thioalkalispira that was higher (p≤0.05) in metal contaminated soil than in reference sites.
Several bacterial genera known for their roles as human and animal pathogens were also
identified, including Escherichia, Mycobacterium, Roseomonas and Sphingomonas. Figs. 4–6
describe specific classes, families and genera identified in the two site groups. No differences in
the frequency distribution for bacterial taxonomies (class: p = 0.83; family: p = 0.31 and genera:
p = 0.10) were observed when metal contaminated and reference soil samples were compared
using Kolmogorov-Smirnov test (non-parametric test).
At the species level, 96 bacterial species were identified in metal contaminated soil samples
and 113 bacterial groups in reference soil samples (Table S3). Differences in relative abundance
among the two soil types were observed for some bacterial groups (Table S3). Achromobacter

68
spp., Acidicaldus spp., Acidisphaera spp., Acidobacterium spp., Acidocella spp., Acidothermus
spp., Azospira spp., Caldanaerobacter thermoanaerobacter tengcongensis, Caulobacter spp.,
Conexibacter spp., Ferruginibacter spp., Filomicrobium spp., Labrys spp., Methylosinus
trichosporium, Mycobacterium riyadhense, Planctomyces spp., Sorangiineae spp.,
Thermosporothrix spp., Thioalkalispira spp. and TM7 were more abundant in the metal
contaminated sites (p≤0.05) (Table S3) compared to reference sites. Likewise, there were more
Acidimicrobiales spp., Afipia felis, Arenimonas spp., Blastochloris spp., Bradyrhizobium spp.,
Candidatus chloracidobacterium spp., Candidatus entotheonella spp., Candidatus koribacter
spp., Edaphobacter modestum, Inquilinus spp., Methylocystis spp., Metyhlovirgula spp.,
Phenylobacterium spp., Pilimelia spp., and Rhodoplanes spp., in reference soil samples
compared to metal contaminated sites (p≤0.05) (Table S3).
Results of the diversity indices used to compare sites are summarized in Table 5. Chao 1
index values for reference sites were statistically higher than metal contaminated sites (Table 5).
Data yielded a total of 543 OTUs of which 399 were identified in metal contaminated sites and
413 in reference sites (Table 5). No differences between the soil types were observed for
Simpson index, Shannon index and species evenness (Table 5). Whittaker dissimilarity and
Jaccard's similarity pair wise comparisons between soil types were calculated. The average
Whittaker dissimilarity between microbial communities was 56.00% and the mean Jaccard's
similarity index was 28.00%. In addition, sites were compared with one another using clustering
based on weighted UniFrac distances. Low values were observed between individual sites based
on distance matrix (Table S4).

69
Table 4: Main bacterial and fungal phyla and their relative abundance identified in soil
samples from the GSR. Data in percentage.
Phylum Metal contaminated sites Reference sites
Bacteria
Actinobacteria 5.26 ± 1.43 5.60 ± 1.58
Acidobacteria* 35.08 ± 2.60 43.11 ± 3.08
Chloroflexi* 9.78 ± 3.20 0.09 ± 0.01
Firmicutes 4.91 ± 2.30 2.18 ± 1.33
Proteobacteria 41.63 ± 3.41 46.49 ± 2.49
Fungi
Ascomycota* 35.07 ± 4.69 27.70 ± 4.01
Basidiomycota* 59.26 ± 4.16 63.88 ± 2.48
Glomeromycota 0.00 ± 0.00 6.06 ± 6.06
Zygomycota* 6.44 ± 3.81 2.35 ± 1.04
Results are expressed as mean values ± standard error
* represents significant differences between metal contaminated and reference sites based on t-
test (p≤0.05)
Metal contaminated sites: Laurentian, Kelly Lake and Kingsway and, Reference sites: Onaping
Falls, Capreol and Killarney

70
1. Acidimicrobiia 11. Bryopsida 21. Opitutae
2. Acidobacteria (unclassified) 12. Caldilineae 22. Oscillatoriophycideae
3. Acidobacteria (class) 13. Class unspecified 23. Planctomycetacia
4. Actinobacteria (subclass) 14. Clostridia 24. Spam (Candidate division)
5. Actinobacteria (class) 15. Cytophagia 25. Spartobacteria
6. Alphaproteobacteria 16. Deltaproteobacteria 26. Sphingobacteria
7. Anaerolineae 17. Gammaproteobacteria 27. Thermoleophilia
8. Armatimonadia 18. Gemmatimonadetes 28. TM6 classes
9. Bacilli 19. Jungermanniopsida 29. TM7 classes
10. Betaproteobacteria 20. Ktedonobacteria
Figure 4: Venn diagram showing distribution of bacterial classes identified in metal
contaminated and reference soil samples from the GSR.
Metal contaminated sites: Laurentian, Kelly Lake and Kingsway and Reference sites: Onaping
Falls, Capreol and Killarney.

71
1. Acetobacteraceae 27. Coxiellaceae 53. Opitutaceae
2. Acidimicrobiaceae 28. Cryomorphaceae 54. Oxalobacteraceae
3. Acidimicrobiales families 29. Cytophagaceae 55. Phormidiaceae
4. Acidobacteriaceae 30. Dermatophilaceae 56. Planctomycetaceae
5. Acidothermaceae 31. Ectothiorhodospiraceae 57. Pseudonocardiaceae
6. Alcaligenaceae 32. Enterobacteriaceae 58. Rhizobiaceae
7. Anaerolineaceae 33. Frankiaceae 59. Rhodobiaceae
8. Armatimonadaceae 34. Gallionellaceae 60. Rhodocyclaceae
9. Bacillaceae 35. Gemmatimonadaceae 61. Rhodospirillaceae
10. Beijerinckiaceae 36. Hyphomicrobiaceae 62. Solirubrobacteriaceae
11. Bradyrhizobiaceae 37. Hyphomonadaceae 63. Sorangiineae families
12. Brucellaceae 38. Iamiaceae 64. Spam (Candidate division)
13. Burkholderiaceae 39. Kineosporiaceae 65. Sphingobacteriaceae
14. Caldilineaceae 40. Koribacteraceae 66. Sphingomonadaceae
15. Candidatus alysiosphaera 41. Ktedonobacteraceae 67. Sporichthyaceae
16. Candidatus
chloracidobacterium 42. Lepidoziaceae 68. Thermoanaerobacteraceae
17. Candidatus chlorothrix 43. Methylobacteriaceae 69. Thermodesulfobiaceae
18. Candidatus solibacter 44. Methylocystaceae 70. Thermogemmatisporaceae
19. Caulobacteraceae 45. Microbacteriaceae 71. Thermosporotrichaceae
20. Chitinophagaceae 46. Micromonosporaceae 72. TM6 families
21. Chromatiaceae 47. Mitochondria 73. TM7 families
22. Climaciaceae 48. Mycobacteriaceae 74. Victivallaceae
23. Colwelliaceae 49. Nannocystineae families 75. Xanthobacteraceae
24. Comamonadaceae 50. Nitrosomonadaceae 76. Xanthomonadaceae
25. Conexibacteraceae 51. Nitrospinaceae 77. Xiphinematobacteraceae
26. Corynebacteriales families 52. Nocardioidaceae

72
Figure 5: Venn diagram showing distribution of bacterial families identified in metal
contaminated and reference soil samples from the GSR.
Metal contaminated sites: Laurentian, Kelly Lake and Kingsway and Reference sites: Onaping
Falls, Capreol and Killarney.

73
1. Achromobacter 45. Crossiella 89. Novosphingobium
2. Acidicaldus 46. Cupriavidus 90. Opitutus
3. Acidimicrobiales generas 47. Defluviicoccus 91. Pedomicrobium
4. Acidimicrobium 48. Dermatophilus 92. Phenylobacterium
5. Acidiphilium 49. Dongia 93. Pilimelia
6. Acidisoma 50. Dyella 94. Planctomyces
7. Acidisphaera 51. Edaphobacter 95. Pleomorphomonas
8. Acidobacterium 52. Escherichia shigella 96. Polaromonas
9. Acidocella 53. Ferruginibacter 97. Pseudochrobactrum
10. Acidomonas 54. Filomicrobium 98. Pseudolabrys
11. Acidothermus 55. Fluviicola 99. Pseudonocardia
12. Acidovorax 56. Frankia 100. Rhizobium
13. Afipia 57. Geitlerinema 101. Rhodobium
14. Anaerolinea 58. Gemmata 102. Rhodomicrobium
15. Anderseniella 59. Gemmatimonas 103. Rhodopirellula
16. Aquicella 60. Geobacillus 104. Rhodoplanes
17. Arenimonas 61. Granulicella 105. Rhodovastum
18. Armatimonas 62. Haliangium 106. Rhodovibrio
19. Azospira 63. Herbiconiux 107. Roseomonas
20. Azovibrio 64. Hgci clade 108. Sandarakinorhabdus
21. Bazzania 65. Hirschia 109. Schlesneria
22. Blastochloris 66. Hymenobacter 110. Sciscionella
23. Blastomonas 67. Hyphomicrobium 111. Sideroxydans
24. Bosea 68. Iamia 112. Simplicispira
25. Bradyrhizobium 69. Inquilinus 113. Singulisphaera
26. Burkholderia 70. Kineosporia 114. Skermanella

74
27. Caldanaerobacter 71. Ktedonobacter 115. Solirubrobacter
28. Caldilinea 72. Labrys 116. Sorangiineae
29. Candidatus alysiosphaera 73. Leptothrix 117. Sorangium
30. Candidatus
chloracidobacterium 74. Limnobacter
118. Spam (Candidate
division) generas
31. Candidatus chlorothrix 75. Limnohabitans 119. Sphingomonas
32. Candidatus entotheonella 76. Magnetospirillum 120. Telmatospirillum
33. Candidatus koribacter 77. Marmoricola 121. Tepidamorphus
34. Candidatus solibacter 78. Massilia 122. Thalassospira
35. Candidates
xiphinematobacter 79. Meganema 123. Thermogemmatispora
36. Caulobacter 80. Methylocystis 124. Thermomonas
37. Chelatococcus 81. Methylosinus 125. Thermosporothrix
38. Climaciaceae 82. Metyhlovirgula 126. Thioalkalispira
39. Collimonas 83. Microvirga 127. Tistlia
40. Colwellia 84. Mitochondria 128. TM6 generas
41. Comamonas 85. Mucilaginibacter 129. TM7 generas
42. Conexibacter 86. Mycobacterium 130. Victivallis
43. Coprothermobacter 87. Mitrosococcus 131. Zavarzinella
44. Corynebacteriales 88. Mitrosovibrio
Figure 6: Venn diagram showing distribution of bacterial genera/species identified in metal
contaminated and reference soil samples from the GSR.
Metal contaminated sites: Laurentian, Kelly Lake and Kingsway and Reference sites: Onaping
Falls, Capreol and Killarney.

75
Table 5: Bacterial and fungal diversity parameters and indices in different soil types in the
GSR.
Chao 1* # of OTUs Simpson
Index
Shannon
Index (H’)
Species
Evenness
Bacteria
Metal contaminated
sites
232
± 10.99
399 0.82
± 0.05
5.88
± 0.25
0.54
± 0.02
Reference sites 273
± 10.91
413 0.88
± 0.09
6.10
± 0.19
0.56
± 0.02
Fungi
Metal contaminated
sites
23
± 3.09
60 0.85
± 0.13
2.96
± 0.13
0.59
± 0.01
Reference sites 45
± 3.36
100 0.87
± 0.03
3.76
± 0.12
0.62
± 0.05
Results are expressed as mean values ± standard error
* represents significant differences between metal contaminated and reference sites for both
bacteria and fungi based on t-test (p≤0.05)
Metal contaminated sites: Laurentian, Kelly Lake and Kingsway and, Reference sites: Onaping
Falls, Capreol and Killarney
76
2.4.3.2 Fungal Community Composition and Diversity Analysis
A total of 68 fungi species belonging to 59 genera were identified from all the soil samples
analyzed (Table S6). The mean abundance of the fungi species identified in metal contaminated
and references soil samples are illustrated in table S6. Detailed analysis revealed site-specific
fungi. In fact, nine fungal groups were identified only in metal contaminated soil and 22 in
reference soil (Table S5).
All the fungi identified in this study belong to four distinct phyla which include
Ascomycota, Basidiomycota, Glomeromycota and Zygomycota (Table 4). The majority of them
are members of the Ascomycota and Basidiomycota phyla. Ascomycota was more abundant in
metal contaminated soil compared to reference sites (Table 4). For Basidiomycota, a high relative
abundance was observed in reference soil samples compared to metal contaminated soil. The
overall relative abundance of Zygomycota was low compared to Ascomycota and Basidiomycota
(Table 4). Glomeromycota phylum was only identified in reference soil samples (Table 4).
At the genus level, there were significant differences (p≤0.05) between metal contaminated
and reference soil for relative abundance. Russula was the most abundant genus across all soil
samples, representing 18.26% in metal contaminated and 11.02% in reference soil. The
distribution of other dominant genera that include Agaricomycotina, Ascomycota, Basidiomycota,
Cenococcum, Helotiaceae, Laccaria, Piloderma, Sebacinaceae and Thelephoraceae varied
significantly between metal contaminated and reference soils. A higher relative abundance of
Ascomycota, Helotiaceae, Herpotrichiellaceae, Laccaria and Sebacinaceae was observed in
metal contaminated compared to reference soil (p≤0.05). Agaricomycotina, Basidiomycota,
Cenococcum, Piloderma, Russula and Thelephoraceae relative abundance were higher in

77
reference soil samples. In addition, several fungi genera classified as human, plant and animal
pathogens were identified. They include Dermateaceae, Dothideomycetes, Herpotrichiellaceae,
Leotiomycetes, Magnaporthales, Mortierella, Pezizales, Scleroderma and Sordariomycetes.
Overall, a total of 18 fungal classes, 44 families and 59 genera were identified. Figs. 7–9
illustrate the classes, families and genera of fungi that were identified in each soil type. No
differences in the frequency distribution for fungal taxonomies (class: p = 0.77; family: p = 0.99
and genera: p = 0.67) were observed between metal contaminated and reference soil samples
based on Kolmogorov-Smirnov test. At the species level, 46 fungal species were identified in
metal contaminated soil samples and 58 fungal groups in reference soil samples (Table S6).
Several fungal groups were identified with a high relative abundance in metal contaminated
soils. They include Basidiomycota sp., Cryptococcus podzolicus, Dermateaceae sp., Helotiaceae
sp., Laccaria proxima, Laccaria sp., Mortierellales sp., Scleroderma citrinum and Sebacinaceae
sp. (Table S6). In reference soils, Agaricomycotina sp., Lactarius camphorates, Pyronemataceae
sp. and Tylospora asterophora were more abundant compared to metal contaminated soil
samples (p≤0.05) (Table S6). Overall, these results indicate that the two types of sites (metal
contaminated disturbed and reference sites) share the majority of fungal groups while showing
difference in fungal community composition. In fact, 5–10% of fungal families and genera
identified were site-specific.
On the other hand, we found that fungal microbial diversity was not affected by metal
contamination. Overall, Chao 1 index values for fungi were significantly lower compared to
bacteria (p≤0.05) (Table 5). For fungi, Chao 1 index values for reference sites were statistically
higher compared to metal contaminated disturbed soils (p≤0.05) (Table 5). A total of 120 OTUs

78
were identified of which 60 were found in metal contaminated and 100 in reference sites (Table
5). No differences between the soil types were observed for Simpson index, Shannon index and
species evenness (Table 5). In addition, pair wise comparisons between soil samples revealed low
values for Jaccard's similarity index (average 26%) and high values for Whittaker dissimilarity
index (average 59%). Distance matrix values were high among soil samples (Table S7).

79
1. Agaricomycetes 10. Leotiomycetes
2. Archaeosporomycetes 11. Mortierellomycotina classes
3. Ascomycota classes 12. Mucoromycotina classes
4. Basidiomycota classes 13. Pezizomycetes
5. Dothideomycetes 14. Pezizomycotina classes
6. Eurotiomycetes 15. Saccharomycetes
7. Fungi classes 16. Sordariomycetes
8. Geoglossomycetes 17. Taphrinomycotina classes
9. Lecanoromycetes 18. Tremellomycetes
Figure 7: Venn diagram showing distribution of fungal classes identified in metal
contaminated and reference soil samples from the GSR.
Metal contaminated sites: Laurentian, Kelly Lake and Kingsway and Reference sites: Onaping
Falls, Capreol and Killarney.

80
1. Agaricales families 16. Fungi families 31. Pyronemataceae
2. Agaricomycotina families 17. Geoglossaceae 32. Russulaceae
3. Amanitaceae 18. Helotiaceae 33. Saccharomycetes families
4. Archaeorhizomycetaceae 19. Helotiales families 34. Sclerodermataceae
5. Archaeosporales families 20. Herpotrichiellaceae 35. Sebacinaceae
6. Ascomycota families 21. Hygrophoraceae 36. Sordariales families
7. Atheliaceae 22. Icmadophilaceae 37. Sordariomycetes families
8. Basidiomycota families 23. Leotiomycetes families 38. Suillaceae
9. Caliciaceae
24. Magnaporthales
families 39. Thelephoraceae
10. Cladoniaceae 25. Mortierellaceae 40. Tremellaceae
11. Clavulinaceae 26. Mortierellales families 41. Tremellales families
12. Cortinariaceae
27. Mucoromycotina
families 42. Trichocomaceae
13. Dermateaceae 28. Myxotrichaceae 43. Tricholomataceae
14. Dothideomycetes families 29. Pezizales families 44. Venturiales families
15. Elaphomycetaceae 30. Pezizomycotina families
Figure 8: Venn diagram showing distribution of fungal families identified in metal
contaminated and reference soil samples from the GSR.
Metal contaminated sites: Laurentian, Kelly Lake and Kingsway and Reference sites: Onaping
Falls, Capreol and Killarney.

81
1. Agaricomycotina 21. Elaphomyces 41. Pezizales
2. Amanita 22. Ericoid 42. Pezizomycotina
3. Archaeorhizomyces 23. Fungi 43. Phialocephala
4. Archaeosporales 24. Geoglossum 44. Piloderma
5. Ascomycete 25. Gyoerffyella 45. Pyronemataceae
6. Ascomycota 26. Helotiaceae 46. Russula
7. Atheliaceae 27. Helotiales 47. Russulaceae
8. Basidiomycota 28. Herpotrichiellaceae 48. Saccharomycetes
9. Calicium 29. Hygrocybe 49. Scleroderma
10. Cenococcum 30. Inocybe 50. Sebacinaceae
11. Chaetomella 31. Laccaria 51. Sordariales
12. Cladonia 32. Lactarius 52. Sordariomycetes
13. Clavulina 33. Leotiomycetes 53. Suillus
14. Clavulinaceae 34. Magnaporthales 54. Thelephoraceae
15. Cortinariaceae 35. Mortierella 55. Tomentella
16. Cortinarius 36. Mortierellales 56. Tremella
17. Cryptococcus 37. Mucoromycotina 57. Tricholoma
18. Dermateaceae 38. Myxotrichaceae 58. Tylospora
19. Dibaeis 39. Oidiodendron 59. Venturiales
20. Dothideomycetes 40. Penicillium
Figure 9: Venn diagram showing distribution of fungal genera identified in metal
contaminated and reference soil samples from the GSR.
Metal contaminated sites: Laurentian, Kelly Lake and Kingsway and Reference sites: Onaping
Falls, Capreol and Killarney.

82
2.5 Discussion
2.5.1 Soil Chemistry
Metal analysis showed higher levels of As, Cu, Ni and Zn in samples from contaminated
sites compared to reference soil samples [25,40,47]. However, results indicate only a fraction
(approximately 1%) of the total metal concentration is in the bioavailable form [25,40,47]. This is
consistent with other recent reports [25,45,46]. The pH values were low for metal contaminated
soils compared to reference soil. This low pH found in various sites in the GSR is consistent with
the acidity levels documented for soils from the Canadian Shield [25,40,47]. Winterhalder [15]
reported that Sudbury soils near smelters were acidified to pH levels ranging from 3.2 to 3.9. At
low pH (<4.5) many metals remain in soluble form thereby providing a good potential for
transport in the leachate soil system. In acidic soils, various metals such as Ca, Mg and P
(phosphorous) become deficient whereas Al and Mn are abundant and sometimes reach toxic
levels [40]. In addition, low pH and metal deficiency/abundance can be detrimental to plants and
affect soil microbial composition and diversity [13,35,40]. Our current study and other recent
reports [25,33,38,40] show a significant increase in soil pH due in part to various legislated
controls and soil rehabilitation programs which improved soil chemistry in the GSR from acidic
to slightly acidic.
Cation exchange capacity (CEC) of the soil was low in metal contaminated compared to
reference soil. Positive correlations between CEC and other factors including pH, soil organic C,
organic matter and soil clay have been reported [169–171]. In this study, a low level of organic C
and organic matter in metal contaminated soil resulted in low CEC values. Among all the
parameters, soil pH is considered an important factor affecting CEC [172].

83
2.5.2 Phospholipid Fatty Acid Analysis
PLFA profiles revealed significant differences between metal contaminated and reference
sites for total microbial biomass, AM fungi, other fungi, gram negative bacteria, gram positive
bacteria and other eukaryotes. A significant decrease of these microbial elements observed in
metal contaminated soil appears to be related to low organic matter and CEC rather than to soil
metal content. This is consistent with other studies at different locations around the world
[36,40,97].
Studies have reported that fungi appear to be more tolerant to metals than bacteria and
actinomycetes [36,173,174]. In agreement to this, a study showed increased proportions of the
fungal 18:2w6 in metal polluted soils [36]. However, in the present study, PLFAs 16:0, 18:1ω9,
and 18:2ω6 considered as reliable indicators of fungi biomass were lower in metal contaminated
soils compared to reference samples. This decrease in the amount of fungal PLFAs could also be
due to a decrease in ectomycorrhizal fungi (EM fungi), which in turn could be attributed to poor
vegetation in these sites [40]. PLFAs 16:1ω5 and 18:1ω7 considered as good indicators of AM
fungi, are also found in bacteria in less amount. These fatty acids were in lower concentrations in
metal contaminated soil compared to reference soil. This is another indication that changes in
PLFA profile are not caused by metal levels in the disturbed sites.
PLFAs such as methyl branched 10Me16:0, 10Me17:0 and 10Me18:0 are found almost
exclusively in actinomycetes [97]. Previous studies have reported that actinomycetes either
decreased or were unaffected in response to metals [97]. Hiroki [175] reported that actinomycetes
were generally less tolerant to metals compared to bacteria and fungi. Various studies reported
that the abundance of actinomycetes in soils is affected by cadmium (Cd), Cu and Zn

84
contamination [97,174]. Our results show no significant difference in actinomycetes biomass
between metal contaminated and references soil samples.
It is usually thought that gram negative bacteria dominate in metal contaminated and
stressed soils compared to gram positive bacteria. Studies have shown that survival of gram
negative bacteria under stress conditions could be attributed to the presence of cyclo fatty acids in
their membrane and the outer lipopolysaccharide layer [40]. Decrease in relative abundance of
both gram positive and gram negative bacteria in the metal contaminated disturbed soils could
also be due to reduction in vegetation and plant root biomass. Overall, a predominance of gram
negative bacteria over gram positive bacteria was observed in both types of soil analyzed. It is
unclear which factors drive the relative dominance of bacteria over fungi in the soil types. It has
been speculated that soil texture and changes in soil moisture affects PLFA profiles. It is very
likely that soil conditions in the GSR favor bacteria growth over fungi.
2.5.3 Pyrosequencing Derived Data
High throughput next generation sequencing has dramatically increased the resolution and
detectable spectrum of diverse microbial phylotypes from environmental samples and it plays a
significant role in microbial ecology studies [99–101]. Next generation sequencing such as 454
pyrosequencing method employed in this study facilitates identification of uncultureable
microorganisms and their relative abundance in soils [99–101]. This platform is a new type of
second generation sequencing technology as it is rapid, flexible, inexpensive and produces reads
with an accuracy of 99% [102]. Long term metal contamination has been shown to have a marked
decrease in numbers of different microbial groups and their composition. Sequence analyses in

85
this study revealed that the levels of bacterial and fungal diversities are comparable to findings of
similar studies related to metal contamination [81,176].
2.5.3.1 Bacterial Communities' Analysis
Actinobacteria relative abundance was similar in metal contaminated and reference soils. It
is an important phylum for metal remediation due to its metabolic power and ability for fast
colonization of selective substrates. Despite these properties, data on Actinobacterial resistance to
metals are still scarce compared to gram negative bacteria. Acidobacteria (acidophilic
heterotrophs) was one of the most prevalent phyla in all the soil samples analyzed. This phylum
has been consistently detected in many habitats around the world. More than 30% of the
sequences from 16S rDNA analyses of soil belong to this phylum based on survey of many
studies [177,178]. This phylum has been detected in freshwater habitats, hot spring microbial
mats, sewage sludges, wastewater treatment bioreactors, rhizospheres and other habitats [177].
Acidobacteria phylum members have been shown to possess ability to withstand metal
contamination, acidic and other extreme environments [178]. Proteobacteria was another phylum
with high relative abundance in both soil types characterized compared to other phyla. It was
largely composed of subphyla Alphaproteobacteria, Betaproteobacteria, Gammaproteobacteria
and Deltaproteobacteria. This phylum has been found to be predominant in many mine
environments and is known to exhibit complex lifestyle with degrading ability of various
complex organic molecules, enabling it to adapt to many different environments [179]. Studies
have also reported that most Proteobacteria belong to members of nitrogen fixing and
photosynthetic bacteria [180]. Bacterial organisms belonging to this phylum play an important
role in carbon, and nitrogen cycles and in maintaining integrity of the ecosystem [99,161,180].

86
Therefore, low plant diversity, respiration rates and organic matter content in the metal
contaminated sites may also explain the lower abundance of bacterial phyla such as
Acidobacteria and Proteobacteria. The analysis at the phylum level shows that Proteobacteria,
Acidobacteria and Actinobacteria phyla were prevalent in all the soil samples whereas
Bacteriodetes, Verrucomicrobia and Planctomycetes phyla were less abundant. These trends have
been observed in other studies [179]. Other phyla present at lower proportion include Chloroflexi
and Firmicutes that have been previously reported to be abundant in soils with higher
concentrations of C, Fe and Mn [181]. Studies have shown that although these groups are
dominant across soil types, the relative proportion of the bacterial community belonging to these
phyla are influenced by factors such as pH, depth within the soil profiles, degree of saturations
and anaerobiosis [181].
Overall, Acidobacterium, Afipia, Aquicella, Geobacillus, Granulicella, Koribacter,
Nitrosococcus, Rhodoplanes, Skermanella, Solibacter, Thermosporothrix and Thioalkalispira
were the predominant genera in the soils. The composition and distribution of these 12 common
bacterial genera varied between metal contaminated and reference soil samples. Geobacillus was
found at high relative abundance in metal contaminated soils. It denitrifies nitrate to nitrogen and
species belonging to this genus are known for their metal binding capacity and are reported to
biosorb and remove toxic metals [182]. Rhodoplanes known as complete denitrifiers are present
in areas with high plant diversity [183]. They were more abundant in reference soils which had
high plant species diversity compared to metal contaminated soils. Thioalkalispira were present
in all the sites, but they were more abundant in metal contaminated soils compared to reference
soil. These bacteria are known as sulfur oxidizing microorganisms and they play an important
role in element cycling in nature that is rich in reduced sulfur compounds [184,185].

87
Many of the bacterial isolates known to catalyze dissimilatory redox transformations of
iron and/or sulfur in acidic environments were identified. They include ferric iron reducers
(Acidobacteriaceae isolates; Geobacillus sp., and Acidocella sp.) and sulfur oxidizers
(Thioalkalispira sp. and Candidate isolates). Bacteria involved in nitrogen fixation such as
Azovibrio spp., Azospira spp., Rhizobium spp. and Fluviicola spp. were also present in the
targeted sites. Nitrifying bacteria (Nitrosococcus spp.) were more abundant in reference soils
samples compared to metal contaminated soils. Ammonia oxidizing bacterium (Nitrosovibrio
tenuis) was found only in reference soils. In addition, various bacterial species that are classified
as decomposers (Acidiphilium spp., Comamonas spp.), mutualists (Blastochloris spp., Frankia
spp., Rhizobium spp.), pathogens (Acidovorax spp., Corynebacteriales spp., Escherichia shigella
spp., Mycobacterium insubricum), autotrophs (Thioalkalispira spp.) and chemotrophs (Hirschia
spp., Inquilinus spp., Microvirga bosea thiooxidans) were found in all the samples. Bacterial
groups with anti-fungal (Collimonas fungivorans, Haliangium spp., Pseudonocardia spp.) and
anti-bacterial (Acidovorax spp., Haliangium spp., Pseudonocardia spp.) activity were also
identified. In addition, bacteria involved in nitrate reduction (Afipia felis and Hymenobacter
spp.), carbon cycles (Acidobacterium spp.), tolerance to metals (Acidocella spp., Caulobacter
spp., Sphingomonas spp. and Rhizobium spp.), and xenobiotics degradation (Comamonas spp.,
Limnobacter spp., Polaromonas spp.) were present in the targeted sites. Likewise bacteria that
are common in acidic soil (Collimonas fungivorans and Acidisphaera spp.), stress conditions and
environment (Arthrobacter spp.), sludge and waste of water treatments (Candidates microthrix
spp.) were also found. Overall, a higher percentage of gram negative bacterial species were
identified in all the sites compared to gram positive. These data are consistent with PLFA results.

88
2.5.3.2 Fungi Communities' Analysis
Most of the current knowledge on microbial diversity in soil is related to bacteria and
information on fungal communities in different ecosystems is sketchy. Studying and
understanding fungal communities is of paramount importance since fungi comprise a major
portion of the biodiversity and biomass in soils and they play crucial roles in maintaining soil
processes which affect the functioning of the ecosystem. Few studies have reported the negative
effects of metals on fungal growth and reproduction [35,186]. A decrease in fungal radial growth
after exposure to Cd, Cu, Zn and Ni has been observed [186]. In addition, metals such as Cd and
Zn have been shown to inhibit the conidial production in some fungal species [187,188]. Reports
from previous studies have pointed out that higher toxicity of metals affect conidial production
than mycelia growth [188]. Overall, studies have shown that metal toxicity varies with fungal
species, metal type, metal concentration, environmental factors such as soil pH, nutrient
availability and plant species diversity, which are all expected to affect fungal activity
[35,153,186–188].
Among the four fungal phyla identified in this study Basidiomycota and Ascomycota
showed the highest relative abundance in both soil types. Basidiomycota was the most prevalent
in reference soils and Ascomycota in metal contaminated soils. Ascomycota (sac fungi) is
monophyletic and accounts for approximately 75% of all described fungi. Several Ascomycota
classified as lichen forming fungi, litter/wood decomposers, plant parasites, human pathogens,
animal pathogens, endophytes, saprotrophs and edible mushrooms were identified.
Basidiomycota includes some of the most familiar fungi known for the production of large fruit
bodies such as mushrooms, puffballs and shelf fungi as well as rust and smut fungi that are plant

89
and yeast parasites [189,190]. Basidiomycota which includes EM fungi are important agents of
wood decay/decomposers of plant litter and animal dung [189,190]. EM fungi are economically
important as they form a symbiotic relationship with plant roots and help plants take up water,
mineral salts and metabolites and in turn gain carbon and essential organic substances from plants
[189,190]. Various decomposers identified in this study are involved in the decomposition of
organic matter and decaying matter, and these actions release elements such as nitrogen and
phosphorous making them available to other living organisms. Zygomycota was another phylum
identified in both soil samples but their relative abundance was significantly lower compared to
Ascomycota and Basidiomycota. Zygomycota represents approximately 1% of all the fungal
groups and the most familiar representatives include fast growing molds often found on fruits
with high sugar content [191]. Fungi from the Zygomycota phylum are commonly found in
terrestrial ecosystems and they live close to plants, usually in soil, decaying plant matter as they
decompose soil and play a major role in carbon cycle [191]. Zygomycota are also pathogens for
animals, plants, other fungi and are known to cause serious infections in humans [191].
Mortierella sp., Mortierellales sp., and Mucoromycotina sp. belonging to the Zygomycota
phylum have been reported as common fungi in soils. Many species from these genera that were
abundant in metal contaminated sites are known as plant pathogens causing abortions and
pulmonary infections in cattle [191]. Archaeosporales sp. belonging to Glomeromycota phylum
was present only in reference soil. Glomeromycota are symbionts found only in terrestrial
habitats and form AM with plants (herbaceous and tropical) [189]. The fungi benefit their host by
functioning as an extension of the root system and the fungi benefit as they have access to
constant source of organic nutrients supplied by their host. Archaeosporales sp. is a mycorrhizal

90
fungus forming arbuscules and vesicles in roots. They can enhance phosphorous and nitrogen
supply to host and they are known to have a widespread distribution [192].
Agaricomycotina, Ascomycota, Basidiomycota, Cenococcum, Helotiaceae, Laccaria,
Lactarius, Leotiomycetes, Pezizomycotina, Russula and Sebacinaceae were the most abundant
microbial groups. In this study, the composition and distribution of these fungi varied from one
soil type to another. Agaricomycotina a diverse clade of the Basidiomycota phylum includes
mushrooms, jelly fungi and basidiomycetous yeasts. Large concentrations of wood decayers,
litter decomposers, and EM fungi, along with small numbers of pathogens of timber, vegetable
crops and humans [193] are also part of this group. Cenococcum is a genus of ectomycorrhizal
Ascomycota and has been documented to be associated with a broad diversity of host plants
(angiosperms and gymnosperms) in various habitats, environments and geographic regions [194].
Leotiomycetes are ecologically diverse and include plant pathogens, saprobes of leaves and wood,
endophytes, mycorrhizas and aquatic hyphomycetes [195]. Similarly, other fungi groups
identified in this study have been shown to be involved in different functions in the terrestrial
environment such as decomposers of organic matter, natural enemies of pests and symbionts.
Some are involved in elemental cycles and maintaining soil structure. Other groups are plant and
animal (including human) pathogens.
Among the 68 fungal groups identified, only one species Oidiodendron maius has been
recognized to have metal tolerance. Hence, all the fungal species growing in sites contaminated
with metals for century show resilience to Cu and Ni, the main contaminants in the region.
Oidiodendron maius belongs to phylum Ascomycota and has been identified as an
endomycorrhizal fungus that prefers acidic conditions [187,196]. Other studies have described

91
Aspergillus niger, Penicillium simplicissimum, Aspergillus foetidus and Aspergillus carbonarius
as species tolerant to metals such as Ni, cobalt (Co), molybdenum (Mo), vanadium (V), Fe, Mg
and Mn at high concentrations [197].
2.5.4 Microbial Diversity
Advances in sequencing technologies have enabled researchers to characterize more
accurately microbial diversity compared to traditional methods. In the present study, the number
of operational taxonomic units (OTUs), Chao1, Shannon and Simpson index were used to
determine bacterial and fungal diversities. OTU is defined as a cluster of reads which correspond
to microbial species and are widely used to estimate bacterial and fungal species. OTUs are
observations of organisms and the numbers of observations correlate well with the total number
of individuals present in the community [198]. Roesch et al. [81] reported that these approaches
provide estimates of diversity greater than 10,000 species (OTUs) per gram of soil. Another study
looked at the bacterial diversity across reclaimed and natural boreal forest in British Columbia
and reported 577 OTUs for bacteria. Results from this study indicated similar microbial diversity
in both soil types. Chao1 index is commonly used species richness estimator which estimates
total number of species present in a community based on the number of OTUs found in a sample
[199]. Chao1 index revealed higher bacterial species richness compared to fungi species richness
in soils. Shannon and Simpson index are most widely used indices to determine community
diversity and it takes into account both species richness and abundance [200]. For Shannon index,
fungal diversity was low compared to bacterial diversity. In both bacteria and fungi, metal
contaminated and reference soils show similar levels of diversity based on all the diversity
parameters tested. This is an indication of adaptation of these microorganisms to metal exposure.

92
The low level of Chao 1 values observed in metal contaminated sites appears to be associated
with other conditions than the metal content. No difference between soil types was observed for
species evenness. Gotelli [200] reported that communities dominated by one or two species
exhibit low evenness whereas communities where abundance is distributed equally amongst
species exhibit high evenness.
Beta diversity indices were calculated to compare community composition between the
sites. Low values for Jaccard's similarity index between soil types for both bacterial and fungal
communities indicate low level of similarity (high beta diversity). High values for Whittaker
dissimilarity index indicates that there are several species that are different among sites (high beta
diversity). Overall, both similarity and dissimilarity indices reveal that community compositions
between sites are different from each other. This confirms the Venn diagram characterization.
Daniel [201] and Grundmann [202] reported that the vast microbial diversity is closely associated
to variety of characteristics of soil environment including soil physical structures and the
complex chemical and biological properties. Overall, our microbial diversity data are consistent
with these previous observations.
In addition, weighted UniFrac distances which take into account differences in abundance
of taxa between metal contaminated and reference sites indicated that for bacterial communities,
metal contaminated sites are closely related to each other. Whereas for fungal communities, high
distance values indicated that the sites are different from each other.
The relative abundance of bacterial and fungal communities was different in the soil types
analyzed. But metal contamination did not have any effect on the number of OTUs and the level
of microbial diversity. Studies have shown that increased metal content had a negative effect on

93
soil microbial population [52]. The negative impact on soil microbial population have a direct
negative effect on soil fertility [52]. Rathnayake et al. [203] reported that soil microorganisms
may adapt to the increased, even toxic metal and other xenobiotics concentrations in soil by
developing various mechanisms to resist contamination. There are several factors that can
contribute to microbial resilience to metals such as Cu, Ni, Zn, and As. They include transfer of
metal tolerance genes in microbial communities through substitution of metal-sensitive strains by
tolerant or resistant ones or transposons/retrotransposon elements; and low proportion of
bioavailable metals [204,205]. Generally, development of resistant bacteria or fungi is indicative
of deterioration of ecosystems. Indeed, in the present study, the ratios of fungi over bacteria were
very low and the proportion of gram-neagtive bacteria was very high suggesting that the targeted
region is under severe environmental stress. Moreover, the level of bioavailable As, Cu, Ni, and
Zn in soil was low and the microbial communities have been exposed to metals for >100 years.
This long term exposure to small amounts of metals might explain the development of metal
resilience within the context of microbial diversity in the targeted sites based on the theory
described by Azarbad et al. [176] and Berg et al. [206].
2.5.5 PLFA vs Pyrosequencing Analysis
In general, PLFA based methods are rapid, inexpensive, sensitive and reproducible. There
are a number of scientific publications based on PFLA analysis that have increased our
understanding of the soil ecosystem [98,207–210]. Unlike pyrosequencing, PLFA has limitations
such as overlap in the composition of microorganisms and the specificity of signature PLFAs. In
the present study, PFLA data revealed significant differences in microbial biomass between the
metal contaminated and reference sites. But these differences were not always detected by

94
pyrosequencing. For example, PFLA analysis shows that both soil types contain substantial
amounts of AM fungi, but pyrosequencing shows that AM fungi (Glomeromycota) are only
detected in the reference sites. This could be attributed to the fact that pyrosequencing
identification is based on comparative analysis with existing sequences in databases. In fact,
many difficulties existed in pyrosequencing analysis due to variety of genes, complexity in
computations and more specifically absence of appropriate reference gene sets [211]. The use of
both, PFLA and pyrosequencing analyses is the most appropriate approach in assessing microbial
abundance, structure and diversity.
2.6 Conclusions
The results of the present study demonstrate that long-term exposure to metals for almost
100 years reduce microbial biomass and abundance but had no effect on microbial diversity.
Metal contaminated areas with low CEC and organic matter (OM) showed significantly lower
levels of microbial biomass and abundance compared to metal uncontaminated sites with high
CEC and OM. The effects of metal were also assessed at the community composition and phyla
levels. Overall, 62.00% of bacterial families identified were common to metal contaminated sites
and the reference sites. But 11.50% were specific to the contaminated sites and 10.00% to the
reference sites. This trend was also observed at class and genera levels. For fungi, the metal
contaminated and reference sites shared 58.00% of the families identified; 6.00% of the fungal
families were specific to the contaminated sites, and 10.00% to the reference sites. The same
proportions were observed at class and genera levels. These suggest that some bacteria and fungi
groups need some metals to grow while other cannot survive in the presence of metals. The study

95
also suggests that organic matter and CEC are key factors involved in changes in microbial
communities.
2.7 Acknowledgments
We would like to thank the Natural Sciences and Engineering Research Council of Canada
(NSERC), Vale and Sudbury Nickel Operations (Glencore Limited) for their financial support.
Thanks to FAME Lab Microbial ID, Inc. Newark and MR DNA, Shallowater, Texas, USA for
assistance with PLFA and pyrosequencing analysis, respectively.

96
CHAPTER 3: MICROBIAL RESPONSE TO SOIL LIMING OF DAMAGED
ECOSYSTEMS IN THE GREATER SUDBURY REGION REVEALED BY
PYROSEQUENCING AND PHOSPHOLIPID FATTY ACID ANALYSES

97
3.1 Abstract
The main objective of the present study was to assess the effects of dolomitic limestone
applications on soil microbial communities’ dynamics and bacterial and fungal biomass, relative
abundance, and diversity in metal reclaimed regions. The study was conducted in reclaimed
mining sites and metal uncontaminated areas. The limestone applications were performed over 35
years ago. Total microbial biomass was determined by phospholipid fatty acids. Bacterial and
fungal relative abundance and diversity were assessed using 454 pyrosequencing. There was a
significant increase of total microbial biomass in limed sites (342.15 ng/g) compared to unlimed
areas (149.89 ng/g). Chao1 estimates followed the same trend. But the total number of OTUs
(Operational Taxonomic Units) in limed (463 OTUs) and unlimed (473 OTUs) soil samples for
bacteria were similar. For fungi, OTUs were 96 and 81 for limed and unlimed soil samples,
respectively. Likewise, Simpson and Shannon diversity indices revealed no significant
differences between limed and unlimed sites. Bacterial and fungal group’s specific to either limed
or unlimed sites were identified. Five major bacterial phyla including Actinobacteria,
Acidobacteria, Chloroflexi, Firmicutes, and Proteobacteria were found. The latter was the most
prevalent phylum in all the samples with a relative abundance of 50.00%. Bradyrhizobiaceae
family with 12 genera including the nitrogen fixing Bradirhizobium genus was more abundant in
limed sites compared to unlimed areas. For fungi, Ascomycota was the most predominant phylum
in unlimed soils (46.00%) while Basidiomycota phylum represented 85.74% of all fungi in the
limed areas. Detailed analysis of the data revealed that although soil liming increases
significantly the amount of microbial biomass, the level of species diversity remains statistically
unchanged even though the microbial compositions of the damaged and restored sites are

98
different. Soil liming still has significant beneficial effects on soil microbial abundance and
composition > 35 years after dolomitic limestone applications.
Keywords: Microbial biomass; Bacterial and fungal relative abundance and diversity;
Phospholipid fatty acid analysis; Pyrosequencing; Soil liming; Metal stress.

99
3.2 Introduction
Mining activities in the Greater Sudbury Region (GSR) in Northern Ontario (Canada) that
started over a century ago have resulted in serious damages to surrounding ecosystems. Logging
and ore smelting led to a large scale of SO2 (sulphur dioxide) emissions and metal contamination
(copper, Cu; iron, Fe; nickel, Ni, and zinc, Zn) [15,34,38,40,212]. These have resulted in
damaged ecosystems with reduced plant growth and population diversities within the region
[15,38,40]. Remediation projects were initiated to restore the affected lands and to decrease
industrial emissions. Building of a super chimney in 1972 reduced metal particulates and SO2
emissions by 50% and 85%, respectively [15]. To decrease acidity, 10 tons of limestone per
hectare was applied in 1978. This liming was followed by land fertilization, grass and legume
seeding [15,212]. In addition, since 1979, 12 million trees have been planted to complete the
reclamation process [15,38,40].
Several studies investigating the effects of metal contamination on soil biology reported
mixed results. Some found no changes in microbial biomass while others reported a decrease in
microbial relative abundance associated with high levels of soil metal accumulation [33–35,213].
Extensive research has been conducted on the effects of liming on agricultural soils within the
context of integrated soil management [15,39,171,214–216]. Overall, these studies showed that
liming resulted in the mineralization of the soil solution due to its saturation with calcium (Ca)
and in some cases with magnesium (Mg).
The addition of liming lowered soil acidity, reduced soil erosion and metal mobility, and
resulted in an increase in organic matter [38–40]. Recent analysis revealed that soil liming in the
GSR increased plant species richness and abundance and the overall plant ecosystem health

100
[25,26,47]. This has led to improvement of soil fertility in limed sites compared to unlimed areas
[25,26,47]. The relationship between soil pH and its effect on the activity and composition of
microbial populations has been discussed in various reports [34,35,39,61,93,213,214,217]. Low
pH inhibits the growth of soil bacteria in favor of more resistant fungi [31,93]. Liming of acidic
soils creates improved environmental conditions for the development of acid-intolerant microbes,
resulting in increased microbial biomass and soil respiration [15,216,218]. Also, soil type and
management affect microbial and chemical responses once lime is applied [31]. Enhanced soil
respiration as well as nitrogen mineralization have also been documented when lime is added to
weakly acidic soils [214,219]. Pawlett et al. [215] reported that liming significantly altered PLFA
profile (reduced bacterial fatty acids and did not affect fungal PLFA signature) and increased
respiration rates. Other studies reported that application of fertilizers and lime resulted in the
activation of biochemical processes; an increase in the relative abundance of prokaryotes, Bacilli
and Actinomycetes; and a decrease in micromycetes [39,50]. In contrast, there are reports on the
inhibitory effect of lime on some groups of prokaryotes such as actinomycetes that facilitate the
mineralization of soil organic matter (SOM) [39,213].
Most of these studies focused on bacterial relative abundance in agricultural soil. We have
a poor understanding of how liming affects microbial relative abundance, diversity and dynamic
within a context of land reclamation of severely damaged ecosystems. Moreover, studies on the
variation of fungi communities in response to soil liming are lacking. We hypothesize that liming
increases bacterial and fungal biomass, relative abundance, diversity, and community
composition.

101
The present report discusses for the first time the effect of soil liming on belowground
diversity using PLFA and pyrosequencing analyses in the GSR. The main objectives of this study
were to assess the long term effects of liming on 1) soil microbial biomass and composition
(bacteria, fungi, and actinomycetes) and 2) bacterial and fungal population dynamic and diversity
in reclaimed ecosystems.

102
3.3 Materials and Methods
3.3.1 Site Characterization and Sampling
The study was conducted in reclaimed mining sites in Sudbury, Northern Ontario, Canada
(46°30′ N, 80°00′ W). The topography of the region is characterized by mosaic of rock outcrops,
glacial till deposits, numerous lakes, and narrow valleys resulting from the Wisconsin glaciations
[15]. The dominant soil type in the GSR area are podzols, which are well drained soils on sandy
till with an organic top layer, a grey middle, and a reddish-brown lower layer [163]. Liming of
this region was completed >35 years ago through the Sudbury Regional Land Reclamation
Program (Regreening Program) using dolomitic limestone [15,37].
Soil sampling was performed at four selected locations each with a reclaimed site (limed
site) and its adjacent un-reclaimed or unlimed area. These targeted sites include Daisy Lake 2,
Wahnapitae Hydro-Dam, Kelly Lake, and Kingsway (Fig. 10). The GPS coordinates of these
sites are given in table S1. At each of the four limed and four unlimed sites, 20 soil samples were
collected in 2014 from the organic layer (0-5 cm in depth). Plant materials, stones, and residues
were removed. Soil samples from each site were pooled and stored for a short period (in
incubator at 30°C for soil chemical analyses; freezer for PLFA analysis for no more than 10 days
before analysis). Microbial DNA was extracted from fresh samples within hours after soil
sampling.
All the samplings took place on Laurentian University research fields and Crown lands. No
specific permission was required to access the lands and collect samples.

103
Figure 10: Geographical locations of the sampling area from the Greater Sudbury Region
(GSR) in Northern Ontario.
Limed and Unlimed sites: Daisy Lake 2, Wahnapitae Hydro-Dam, Kelly Lake, and Kingsway.

104
3.3.2 Soil Chemistry Analysis
Soil subsamples were sieved using a 2 mm mesh and air dried. Cation exchange capacity
(CEC) was measured by using ammonium acetate extraction method at pH 7 [167]. CEC is an
intrinsic property of soil defining the concentration of negatively charged sites on soil colloids
that can adsorb exchangeable cations. The exchangeable cations that included aluminum, Al3+
;
calcium, Ca2+
; iron, Fe3+
; potassium, K+; magnesium, Mg
2+; manganese, Mn
2+; and sodium, Na
+
were quantified by inductively coupled plasma mass spectrometry (ICP-MS) [25]. Soil pH was
measured in de-ionized water and in neutral salt solution (0.01 M CaCl2) as described previously
by Nkongolo et al. [25].
3.3.3 Phospholipid Fatty Acid (PLFA) Analysis
Soil samples (from four limed and four unlimed sites) were analyzed following the protocol
described by Buyer and Sasser [86]. Mole percentage of each PLFA was used to determine
bacterial and fungal biomass in soil. Total PLFA extracted from soil was used as an index of
living microbial biomass [86]. The selected PLFAs for bacterial biomass include i15:0, a15:0,
i16:0, 16:1ω9, 16:1ω7c, cy17:0, i17:0, a17:0, 18:1ω7 and cy19:0, while PLFA 18:2ω6 and
18:1ω9 were used for fungi. PLFAs such as 10Me, 20:3ω6/20:4ω6 and
12:0/16:1ω7/18:2ω9/18:2ω12/18:3ω9/18:3ω12/18:3ω15/polyunsaturated fatty acids were used
for the identification of actinomycetes, protozoa, and eukaryotes, respectively.
3.3.4 Microbial DNA Extraction and Purification
Microbial DNA was extracted from approximately 10 g of fresh soil (four limed and four
unlimed) using the PowerMax® soil DNA isolation kit for soil from MO BIO (cat # 12988-10)
with the bead-beating protocol supplied by the manufacturer. The concentration of the DNA was

105
determined using the fluorochrome Hoechst 33258 (busdensimide) fluorescent DNA
quantification kit from Bio-Rad (cat # 170-2480). Fluorescence intensity was measured using a
BMG Labtech FLUOstar Optima microplate multi-detection reader in fluorescence detection
mode. The quality was determined by running the samples on a 1% agarose gel. DNA samples
were stored at -20°C until further analysis.
3.3.5 PCR Amplification and 454 Pyrosequencing
Amplicon sequencing was performed at the MR DNA Molecular Research DNA laboratory
(Shallowater, Texas, USA). Amplicon based analysis of the soil bacterial and fungal microbiota
was assessed by high throughput sequencing of 16S rRNA gene and internal transcribed spacer
(ITS) region. Tag-encoded FLX-titanium 16S rRNA gene amplicon pyrosequencing (bTEFAP)
was performed using 16S universal Eubacterial primers 530F (5’ GTG CCA GCM GCN GCG G)
and 1100R (5’ GGG TTN CGN TCG TTR) for amplifying the 600 bp region of 16S rRNA genes
[108]. Fungal tag-encoded FLX amplicon pyrosequence (fTEFAP) was determined using ITS
specific primers ITS1F (5’ TCC GTA GGT GAA CCT GCG G) and ITS4R (5’ TCC TCC GCT
TAT TGA TAT GC) to amplify 600 bp fragment of the fungal ITS region [103]. The sequencing
library was generated using a one-step PCR of 30 cycles using HotStarTaq Plus Master Mix Kit
(Qiagen) under the following conditions: 94°C for 3 min followed by 28 cycles of 94°C for 30
sec, 53°C for 40 sec and 72°C for 1 minute, and a final elongation step at 72°C for 5 min [108].
Following PCR, all amplicon products from different samples were mixed in equal
concentrations and purified using Agencourt Ampure beads. Tag-encoded FLX amplicon
pyrosequencing analysis was performed using a Roche 454 FLX instrument with titanium
reagents following the manufacturer’s guidelines with 3,000 sequence depth.

106
3.3.6 Data Processing
The sequencing data were processed using a proprietary analysis pipeline (MR DNA).
Sequences were depleted of barcodes and primers. Short sequences (< 200 bp), sequences with
ambiguous base calls, and sequences with homopolymer runs exceeding 6 bp were removed.
Sequences were then denoised and chimeras were removed. OTUs (Operational Taxonomic
Units) were defined following removal of singleton sequences, clustering at 3% divergence (97%
similarity). OTUs were taxonomically classified using BLASTN (Basic Local Alignment Search
Tool for Nucleotides) against a curated GreenGenes database (http://greengenes.lbl.gov; version
2011) and compiled into each taxonomic level.
3.3.7 Statistical Analyses
Data was tested for normality using Shapiro-Wilk test and analyzed using SPSS statistics
version 20 for windows. Association between soil pH and exchangeable cations were determined
based on Pearson r correlation coefficients (p≤0.05). t-test was used to determine significant
differences between limed and unlimed sites for CEC, microbial biomass (total PLFA), and
composition (bacterial, actinomycetes and fungal PLFAs).
Chao1, Shannon index, Simpson index, and species richness and evenness for bacterial and
fungal species diversity were analyzed using QIIME (version 1.8.0) [99,108,112,220].
Differences in frequency distribution for bacterial and fungal groups between limed and unlimed
soils samples based on Kolmogorov-Smirnov test (non-parametric test) were determined using
SPSS.
Pair wise comparisons (beta diversity) among the sites were performed using similarity
indices (based on the presence/absence data), including Jaccard and Sorensen indices.

107
Dissimilarity indices (based on abundance or relative abundance) including Bray-Curtis and
Whittaker indices were calculated. Beta diversity was also estimated by computing weighed
UniFrac (Qualitative) distances among sites. Weighed UniFrac variants are widely used in
microbial ecology and they account for abundance of observed organisms. QIIME (version 1.8.0)
was used to compute the within community diversity (alpha diversity), between community
diversity (beta diversity), and UniFrac distances [111,199,220].

108
3.4 Results
3.4.1 Soil Chemistry
The pH in limed soils was significantly higher (pH 6.3) even >35 years after dolomitic
limestone applications (Table 6). A similar trend was observed for cation exchange capacity
(CEC). Correlations between soil pH and CEC were positive (p≤0.05) for limed soil samples and
negative (-0.64; p≤0.05) for samples from unlimed areas (Fig. 11). As expected, the highest
values of exchangeable Ca2+
and Mg2+
were recorded in limed soils (Table 6). Whereas, low
values were obtained for exchangeable K+ and Na
+ in both types of soils (Table 6). Total sum of
exchangeable cation (Ca2+
, Mg2+
, K+ and Na
+) values were 13.89 cmol/kg and 1.55 cmol/kg for
limed and unlimed soils, respectively (Table 6).
3.4.2 Phospholipid Fatty Acid Analysis
PFLA revealed a significant high level (p≤0.05) of total microbial biomass in limed sites
compared to samples from unlimed areas (Table 7). The relative abundance levels of gram
negative and gram positive bacteria, arbuscular mycorrhizal (AM), and other fungi followed the
same trend (Table 7). There were positive correlations (p≤0.05) between gram negative bacterial
biomass and pH (r = 0.71) as well as between AM fungi and pH (r = 0.59). But negative
correlations (p≤0.05) were observed between gram positive bacterial biomass and pH (r = -0.49)
and between fungal biomass and pH (r = -0.22).
The ratio of gram positive to gram negative bacterial biomass was lower in the limed soil
samples compared to unlimed (Table 8). The opposite trend was observed for 18w to 19cyclo
ratio (Table 8). The ratio between fungal and bacterial biomass was very low for the two soil
types (Table 8).

109
Table 6: Mean values of basic cations (Ca2+
, Mg2+
, K+ and Na
+), sum of cations, CEC and
pH.
Characteristics Limed sites Unlimed sites
Ca2+
(cmol/kg) 10.52a ± 3.82 0.99b ± 0.48
Mg2+
(cmol/kg) 3.13a ± 1.36 0.26b ± 0.14
K+ (cmol/kg) 0.20a ± 0.04 0.25a ± 0.13
Na+ (cmol/kg) 0.04a ±0.01 0.05a ± 0.03
Sum of Cations (cmol/kg) 13.89 1.55
CEC (cmol/kg) 16.30a ± 5.50 1.80b ± 0.90
pH (H20) 6.30a ± 0.40 4.70b ± 0.20
pH (0.01M CaCl2) 5.80a ± 0.40 4.30b ± 0.30
Results are expressed as mean values ± standard error.
Means in rows with a common letter are not significantly different based on t-test (p≥0.05).
CEC: cation exchange capacity.
Limed and Unlimed sites: Daisy Lake 2, Wahnapitae Hydro-Dam, Kelly Lake, and Kingsway.

110
Figure 11: Patterns of pH and Cations Exchange Capacity (CEC) in samples from limed
and unlimed sites in the Greater Sudbury Region (GSR) in Northern Ontario.
Limed and Unlimed sites: Daisy Lake 2, Wahnapitae Hydro-Dam, Kelly Lake, and Kingsway.
0.0
2.0
4.0
6.0
8.0
10.0
12.0
14.0
16.0
18.0
20.0
0.00 2.00 4.00 6.00 8.00
CE
C (
cmol/
kg
)
pH
Limed
Unlimed
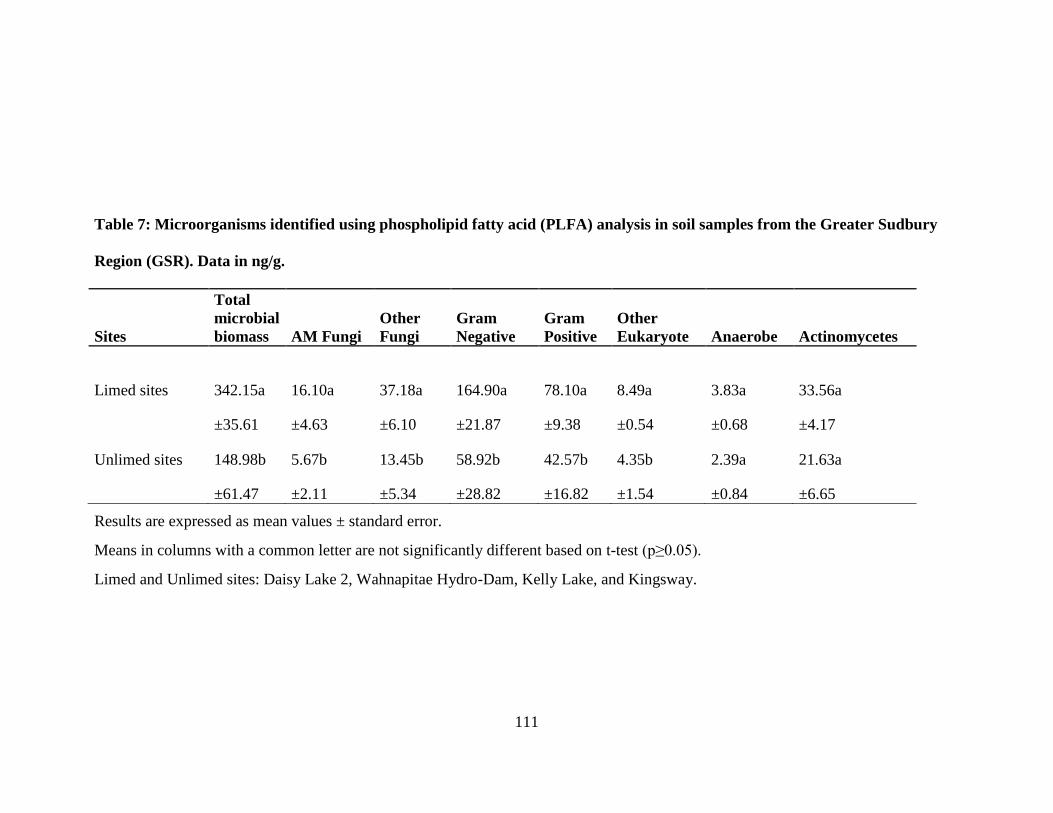
111
Table 7: Microorganisms identified using phospholipid fatty acid (PLFA) analysis in soil samples from the Greater Sudbury
Region (GSR). Data in ng/g.
Sites
Total
microbial
biomass AM Fungi
Other
Fungi
Gram
Negative
Gram
Positive
Other
Eukaryote Anaerobe Actinomycetes
Limed sites 342.15a
±35.61
16.10a
±4.63
37.18a
±6.10
164.90a
±21.87
78.10a
±9.38
8.49a
±0.54
3.83a
±0.68
33.56a
±4.17
Unlimed sites 148.98b
±61.47
5.67b
±2.11
13.45b
±5.34
58.92b
±28.82
42.57b
±16.82
4.35b
±1.54
2.39a
±0.84
21.63a
±6.65
Results are expressed as mean values ± standard error.
Means in columns with a common letter are not significantly different based on t-test (p≥0.05).
Limed and Unlimed sites: Daisy Lake 2, Wahnapitae Hydro-Dam, Kelly Lake, and Kingsway.
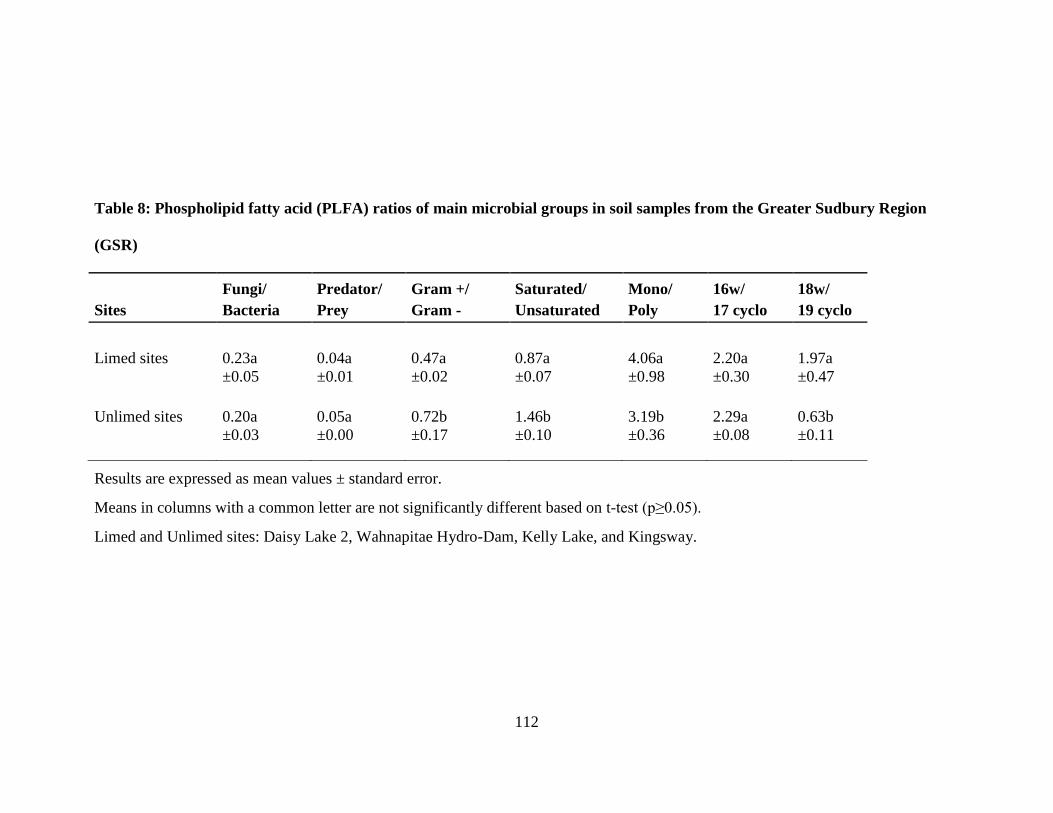
112
Table 8: Phospholipid fatty acid (PLFA) ratios of main microbial groups in soil samples from the Greater Sudbury Region
(GSR)
Sites
Fungi/
Bacteria
Predator/
Prey
Gram +/
Gram -
Saturated/
Unsaturated
Mono/
Poly
16w/
17 cyclo
18w/
19 cyclo
Limed sites 0.23a
±0.05
0.04a
±0.01
0.47a
±0.02
0.87a
±0.07
4.06a
±0.98
2.20a
±0.30
1.97a
±0.47
Unlimed sites 0.20a
±0.03
0.05a
±0.00
0.72b
±0.17
1.46b
±0.10
3.19b
±0.36
2.29a
±0.08
0.63b
±0.11
Results are expressed as mean values ± standard error.
Means in columns with a common letter are not significantly different based on t-test (p≥0.05).
Limed and Unlimed sites: Daisy Lake 2, Wahnapitae Hydro-Dam, Kelly Lake, and Kingsway.

113
Palmitic acid (16:0) was the most common fatty acid averaging 12.98% for all soil
samples. Other detected fatty acids included a15:0 (3.00%), i15:0 (6.73%), 16:1ω7c (7.21%),
16:1ω3c (3.30%), 10Me16:0 (4.53%), c17:0ω7c (3.25%), 18:0ω7c (11.26%), 18:1ω9c (8.40%),
18:2ω6c (7.49%), and c19:0ω7c (7.88%). These fatty acids were present in all the sites and made
up about 78% and 73% of total fatty acid content in the limed and unlimed soil samples,
respectively. Overall, monounsaturated fatty acids were more prevalent in the targeted sites
followed by saturated, branched, and cyclo chain fatty acids.
3.4.3 Pyrosequencing Analyses
Overall, 63,814 and 42,979 sequences were generated for bacteria and fungi, respectively.
The number was reduced to 61,630 and 41,588 for bacterial 16S rRNA and fungal ITS after
trimming, removing chimeras, and omitting sequences shorter than 200 bp. Relative abundances
of bacterial and fungal groups were estimated at the phylum, family, class and genus levels. All
the bacterial sequences were classified while fungal sequences were unclassified. In fact, for the
Ascomycota phylum, 48% of the sequences were not classified and for the Basidiomycota, this
portion was 0.02%. Relative abundances of bacterial and fungal species are illustrated in Tables
S3 and S4. The reads generated in this project have been deposited in the NCBI Short Read
Archive database (Accession number: SRP071853).
3.4.3.1 Bacterial Community Composition and Diversity Analysis
Five major bacterial phyla were identified in the soil samples analyzed. They include
Actinobacteria, Acidobacteria, Chloroflexi, Firmicutes, and Proteobacteria. They accounted for
96.01% of the phyla present in the soil samples. Firmicutes and Chloroflexi were the least

114
abundant in all soil samples with a relative average abundance of 3.23% and 4.62%, respectively.
They were mostly found in unlimed soils (Table 9). The most abundant phylum was
Proteobacteria with a prevalence of 52.48%, followed by Acidobacteria (28.30%), and
Actinobacteria (7.34%). Acidobacteria were more prevalent in unlimed soils compared to limed
soils (p≤0.05) (Table 9). The most preponderant families in this phylum included
Bradyrhizobiaceae, Rhizobiaceae, Rhodobacteraceae, Rhodobiaceae, Rhodocyclaceae, and
Rhodospirillaceae. Bradyrhizobiaceae family with 12 genera including the nitrogen fixing
Bradirhizobium genus was more abundant in limed sites compared to unlimed areas. In total, 31
bacterial classes, 80 families, and 133 genera were identified. Venn diagrams show different
bacterial groups and their distribution (Figs. 12-14).
No differences in the frequency distribution for bacterial taxonomies (family: p=0.74;
class: p=0.29 and genera: p=0.80) were observed between limed and unlimed soil samples based
on Kolmogorov-Smirnov test (non-parametric test). At the genus level, Solirubrobacter and
Nocardioides belonging to the Actinobacterial phylum were more abundant in limed sites
compared to unlimed soil samples. Interestingly, Nitrospira class was found only in limed site
whereas Anaerolineaea, Chloroflexi, Jungermanniopsida, lentisphaeria, Oscillatoriophycideae
classes were found only in unlimed areas. Likewise, there were 25% of genera specific to limed
sites and 16% to unlimed (Fig. 14).
In total, 149 bacterial groups were identified in all the targeted sites (Table S10) of which
121 were found in limed sites and 108 were present in unlimed soil samples (Table S10). Further
analysis revealed that 20 bacterial groups were present only in limed sites and 21 in unlimed
soils (Table S8). Afipia broomeae, Afipia felis, Arenimonas spp., Bradyrhizobium spp.,

115
Candidates alysiosphaera spp., Defluviicoccus spp., Ktedonobacter spp., Labrys spp.,
Pedomicrobium spp., Pilimelia spp. and Pseudolabrys spp. were more abundant (p≤0.05) in
limed sites compared to unlimed areas (Table S10). On the other hand, Acidobacterium spp.,
Aquicell spp., Caldanaerobacter thermoanaerobacter tengcongensis, Candidates koribacter
spp., Conexibacter spp., Filomicrobium spp., Gemmatimonas spp., Geobacillus spp.,
Mycobacterium riyadhense, Planctomyces spp., Sciscionella spp., Skermanella spp., Sorangium
spp., Thermosporothrix spp., Thioalkalispira spp. and TM7 were prevalent in unlimed areas
compared to soils from limed sites (Table S10).
The average estimated minimum number of species (OTUs), Chao1 index, Shannon’s
index, Simpson index, and species richness and evenness for the two soil types (limed and
unlimed) are described in Table 10. Final dataset yielded 619 OTUs of which 463 were observed
in limed and 473 in unlimed sites (Table 10). Chao1 values were higher in limed compared to
unlimed soil samples (Table 10). However, there was no significant difference for Simpson
index, Shannon index, and species richness and evenness between microbial populations from
limed and unlimed sites (p≥0.05) (Table 10). In the present study, Jaccard and Sorenson’s
similarity indices were low (Table 11). Whereas, high values were recorded for Bray-Curtis and
Whittaker dissimilarity indices (Table 11). The results from similarity and dissimilatiry indices
suggest that microbial communities are closely related to each other in the two sites (limed and
unlimed) (Table 11). Further, we compared the sites with one another using clustering based on
the weighed UniFrac (incorporates relative abundance) distances (Table S11).

116
Table 9: The main phylogenetic groups of bacteria and fungi, and their relative abundance
in soil samples from the Greater Sudbury Region (GSR).
Phylum Limed sites Unlimed sites
Bacteria
Actinobacteria 10.90a ± 3.81 3.77b ± 1.11
Acidobacteria 18.53a ± 6.17 38.15b ± 3.34
Chloroflexi 1.17a ± 0.67 8.06a ± 5.12
Firmicutes 1.88a ± 1.39 4.59a ± 2.24
Proteobacteria 64.74a ± 3.88 40.22b ± 5.45
Fungi
Ascomycota 13.79a ± 3.92 46.00b ± 14.52
Basidiomycota 85.74a ± 4.07 49.20b ± 12.03
Zygomycota 0.46a ± 0.20 4.80b ± 1.92
Results are expressed as mean percentages ± standard error
Means in rows with a common letter are not significantly different based on t-test (p≥0.05).
Limed and Unlimed sites: Daisy Lake 2, Wahnapitae Hydro-Dam, Kelly Lake, and Kingsway.

117
Figure 12: Venn diagram showing distribution of bacterial classes identified in limed and
unlimed soil samples from the GSR.
Limed and Unlimed sites: Daisy Lake 2, Wahnapitae Hydro-Dam, Kelly Lake, and Kingsway.
1. Acidimicrobiia 12. Caldilineae 23. Lentisphaeria
2. Acidobacteria (unclassified) 13. Chloroflexi 24. Nitrospira
3. Acidobacteria (class) 14. Class unspecified 25. Opitutae
4. Actinobacteria (subclass) 15. Clostridia 26. Oscillatoriophycideae
5. Actinobacteria (class) 16. Cytophagia 27. Planctomycetacia
6. Alphaproteobacteria 17. Deltaproteobacteria 28. Spartobacteria
7. Anaerolineae 18. Flavobacteria 29. Sphingobacteria
8. Armatimonadia 19. Gammaproteobacteria 30. Thermoleophilia
9. Bacilli 20. Gemmatimonadetes 31. TM7classes
10. Betaproteobacteria 21. Jungermanniopsida
11. Bryopsida 22. Ktedonobacteria
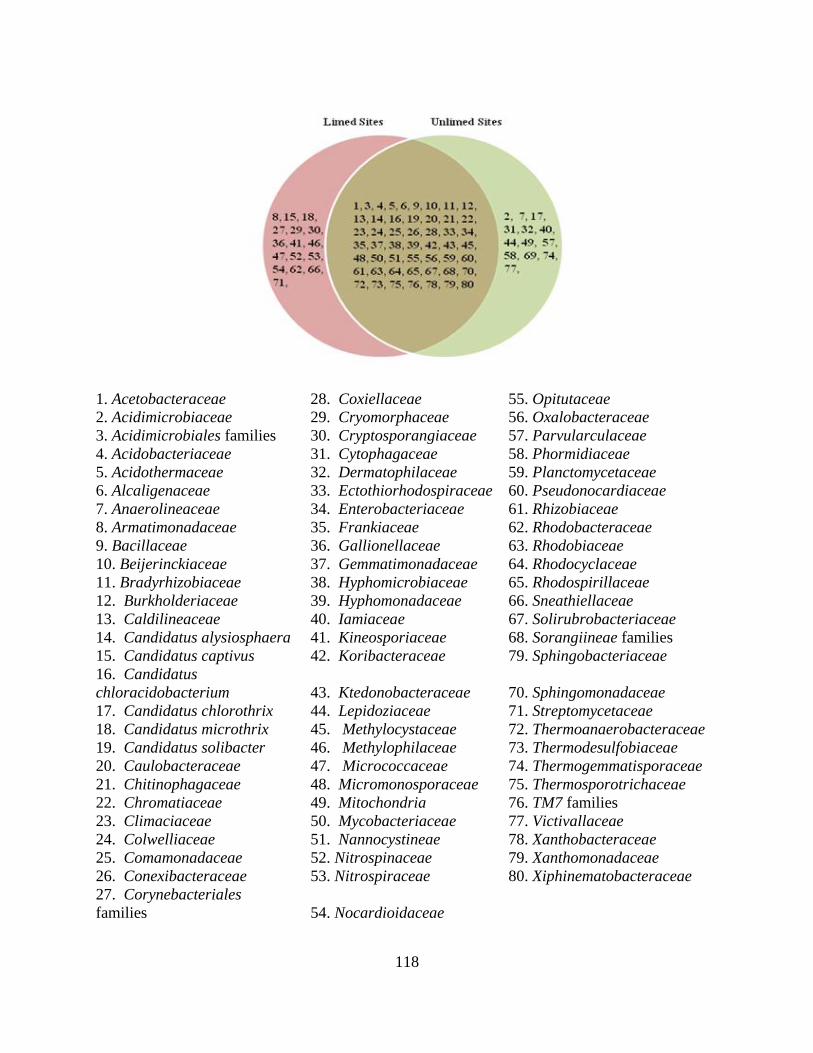
118
1. Acetobacteraceae 28. Coxiellaceae 55. Opitutaceae
2. Acidimicrobiaceae 29. Cryomorphaceae 56. Oxalobacteraceae
3. Acidimicrobiales families 30. Cryptosporangiaceae 57. Parvularculaceae
4. Acidobacteriaceae 31. Cytophagaceae 58. Phormidiaceae
5. Acidothermaceae 32. Dermatophilaceae 59. Planctomycetaceae
6. Alcaligenaceae 33. Ectothiorhodospiraceae 60. Pseudonocardiaceae
7. Anaerolineaceae 34. Enterobacteriaceae 61. Rhizobiaceae
8. Armatimonadaceae 35. Frankiaceae 62. Rhodobacteraceae
9. Bacillaceae 36. Gallionellaceae 63. Rhodobiaceae
10. Beijerinckiaceae 37. Gemmatimonadaceae 64. Rhodocyclaceae
11. Bradyrhizobiaceae 38. Hyphomicrobiaceae 65. Rhodospirillaceae
12. Burkholderiaceae 39. Hyphomonadaceae 66. Sneathiellaceae
13. Caldilineaceae 40. Iamiaceae 67. Solirubrobacteriaceae
14. Candidatus alysiosphaera 41. Kineosporiaceae 68. Sorangiineae families
15. Candidatus captivus 42. Koribacteraceae 79. Sphingobacteriaceae
16. Candidatus
chloracidobacterium 43. Ktedonobacteraceae 70. Sphingomonadaceae
17. Candidatus chlorothrix 44. Lepidoziaceae 71. Streptomycetaceae
18. Candidatus microthrix 45. Methylocystaceae 72. Thermoanaerobacteraceae
19. Candidatus solibacter 46. Methylophilaceae 73. Thermodesulfobiaceae
20. Caulobacteraceae 47. Micrococcaceae 74. Thermogemmatisporaceae
21. Chitinophagaceae 48. Micromonosporaceae 75. Thermosporotrichaceae
22. Chromatiaceae 49. Mitochondria 76. TM7 families
23. Climaciaceae 50. Mycobacteriaceae 77. Victivallaceae
24. Colwelliaceae 51. Nannocystineae 78. Xanthobacteraceae
25. Comamonadaceae 52. Nitrospinaceae 79. Xanthomonadaceae
26. Conexibacteraceae 53. Nitrospiraceae 80. Xiphinematobacteraceae
27. Corynebacteriales
families 54. Nocardioidaceae

119
Figure 13: Venn diagram showing distribution of bacterial families identified in limed and
unlimed soil samples from the GSR.
Limed and Unlimed sites: Daisy Lake 2, Wahnapitae Hydro-Dam, Kelly Lake, and Kingsway.

120
1. Achromobacter 46. Conexibacter 90. Nitrosococcus
2. Acidicaldus 47. Coprothermobacter 91. Nitrospira
3. Acidimicrobiales 48. Corynebacteriales 92. Nocardioides
4. Acidimicrobium 49. Crossiella 93. Novosphingobium
5. Acidiphilium 50. Cryptosporangium 94. Opitutus
6. Acidisphaera 51. Cupriavidus 95. Parasegetibacter
7. Acidobacterium 52. Defluviicoccus 96. Parvularcula
8. Acidocella 53. Dermatophilus 97. Pedomicrobium
9. Acidomonas 54. Dongia 98. Phenylobacterium
10. Acidothermus 55. Dyella 99. Pilimelia
11. Acidovorax 56. Edaphobacter 100. Pirellula
12. Actinoplanes 57. Escherichia shigella 101. Planctomyces
13. Afipia 58. Ferruginibacter 102. Pleomorphomonas
14. Anaerolinea 59. Filomicrobium 103. Polaromonas
15. Anderseniella 60. Fluviicola 104. Pseudolabrys
16. Aquicella 61. Frankia 105. Rhizobium
17. Arenimonas 62. Geitlerinema 106. Rhodobacter
18. Armatimonas 63. Gemmata 107. Rhodobium
19. Arthrobacter 64. Gemmatimonas 108. Rhodopirellula
20. Azospira 65. Geobacillus 109. Rhodoplanes
21. Azovibrio 66. Granulicella 110. Rhodovastum
22. Bazzania 67. Haliangium 111. Rhodovibrio
23. Blastochloris 68. Hirschia 112. Roseomonas
24. Blastomonas 69. Hymenobacter 113. Sciscionella
25. Bosea 70. Hyphomicrobium 114. Sideroxydans
26. Bradyrhizobium 71. Iamia 115. Simplicispira
27. Burkholderia 72. Inquilinus 116. Singulisphaera
28. Byssovorax 73. Kineosporia 117. Skermanella
29. Caldanaerobacter 74. Kribbella 118. Sneathiella
30. Caldilinea 75. Ktedonobacter 119. Solirubrobacter

121
Figure 14: Venn diagram showing distribution of bacterial genera/species identified in
limed and unlimed soil samples from the GSR.
Limed and Unlimed sites: Daisy Lake 2, Wahnapitae Hydro-Dam, Kelly Lake, and Kingsway.
31. Candidatus koribacter 76. Labrys 120. Sorangiineae
32. Candidatus alysiosphaera 77. Leptothrix 121. Sorangium
33. Candidatus captivus 78. Luteibacter 122. Sphingomonas
34. Candidatus
chloracidobacterium 79. Magnetospirillum 123. Streptomyces
35. Candidatus chlorothrix 80. Marmoricola 124. Telmatospirillum
36. Candidatus entotheonella 81. Massilia 125. Tepidamorphus
37. Candidatus koribacter 82. Methylocystis 126. Thermogemmatispora
38. Candidatus microthrix 83. Methylosinus 127. Thermomonas
39. Candidatus solibacter 84. Methylotenera 128. Thermosporothrix
40. Candidatus
xiphinematobacter 85. Methyloversatilis 129. Thioalkalispira
41. Caulobacter 86. Metyhlovirgula 130. Tistlia
42. Climaciaceae 87. Mitochondria 131. TM7
43. Collimonas 88. Mucilaginibacter 132. Victivallis
44. Colwellia 89. Mycobacterium 133. Zavarzinella
45. Comamonas

122
Table 10: Microbial diversity index values for bacterial and fungal communities from the
Greater Sudbury Region (GSR).
Chao 1 # of
OTUs
Simpson
Index
Shannon
Index (H’)
Species
Evenness
Species
Richness
Bacteria species
Limed sites 257a
± 24.93
463 0.86a
± 0.08
5.68a
± 0.22
0.52a
± 0.02
121
Unlimed sites 153b
± 39.38
473 0.78a
± 0.04
4.29a
± 0.87
0.51a
± 0.01
108
Fungi species
Limed sites 37a
± 6.54
96 0.81a
± 0.12
2.59a
± 0.30
0.51a
± 0.01
59
Unlimed sites 27b
± 9.07
81 0.78a
± 0.03
2.32a
± 0.51
0.54a
± 0.03
51
Results are expressed as mean values ± standard error
Means in column with a common letter are not significantly different within bacteria and fungi
species based on t-test (p≥0.05).
Limed and Unlimed sites: Daisy Lake 2, Wahnapitae Hydro-Dam, Kelly Lake, and Kingsway.

123
Table 11: Pair wise microbial diversity analysis for bacteria and fungi communities in the
Greater Sudbury Region (GSR).
Sites Jaccard’s
Index (βj)
Sorenson’s
Index (βsor)
Bray-Curtis
Index (βb)
Whittaker
Index (βw)
Bacteria species
Limed and Unlimed
sites
0.26 0.41 0.53 0.59
Fungi species
Limed and Unlimed
sites
0.27 0.42 0.81 0.58
Limed and Unlimed sites: Daisy Lake 2, Wahnapitae Hydro-Dam, Kelly Lake, and Kingsway.

124
3.4.3.2 Fungal Community Composition and Diversity Analysis
Pyrosequencing analysis identified three phyla of fungi that included Ascomycota,
Basidiomycota, and Zygomycota (Table 9). Dibaeis (lichen-forming fungi), baeomyces
(lichenized fungi), Dermateaceae sp., (plant pathogens and decay plant materials), Fusarium
oxysporum (plant parasites), Phialocephala fortini (mycorrhizal fungi), and Pezizales sp.
(saprophytes) were the most dominant groups of Ascomycota. The majority of sequences in the
Basidiomycota phylum matched ectomycorrhizal (EM fungi) and wood rotting fungi.
Overall, 15 fungal classes, 42 families, and 59 genera were identified. Venn diagrams show
different fungal groups and their distribution (Figs. 15-17). No differences in the frequency
distribution for fungal groups were observed between limed and unlimed soil samples based on
Kolmogorov-Smirnov test (non-parametric test) (family, p=0.84; class, p=0.77; and genera,
p=0.71). In total, 70 fungal species belonging to 59 genera were identified in limed and unlimed
sites. They are described in Table S11. In addition, 15 site-specific species were observed of
which 10 were present only in limed and 5 in unlimed soil samples (Table S9).
Several fungal species were more abundant in limed soils compared to unlimed sites. They
include Amanita muscaria, Cryptococcus podzolicus, Penicillium montanense, Pezizomycotina
sp., Russula gracilis and Thelephoraceae sp. (Table S12). On the other hand, Ascomycota sp.,
Calicium salicinum, Dermateaceae sp., Dothideomycetes sp., Helotiaceae sp., Helotiales sp.,
Herpotrichiellaceae sp., Laccaria proxima, Leotia viscose, Mortierellales sp., Oidiodendron
maius, Russula sp., Russula sphagnophila and Sebacinaceae sp. were prevalent in unlimed areas
compared to limed sites (p≤0.05) (Table S12). In addition, several fungal genera known for their
roles as human, plant or animal pathogens were found. They include Dothideomycetes,

125
Figure 15: Venn diagram showing distribution of fungal classes identified in limed and
unlimed soil samples from the GSR.
Limed and Unlimed sites: Daisy Lake 2, Wahnapitae Hydro-Dam, Kelly Lake, and Kingsway.
1. Agaricomycetes 9. Mortierellomycotina classes
2. Ascomycota classes 10. Mucoromycotina classes
3. Basidiomycota classes 11. Pezizomycetes
4. Dothideomycetes 12. Pezizomycotina classes
5. Eurotiomycetes 13. Sordariomycetes
6. Fungi classes 14. Taphrinomycotina classes
7. Lecanoromycetes 15. Tremellomycetes
8. Leotiomycetes

126
1. Agaricales families 15. Elaphomycetaceae 29. Pezizomycotina families
2. Agaricomycotina families 16. Fungi families 30. Pyronemataceae
3. Amanitaceae 17. Helotiaceae 31. Russulaceae
4. Archaeorhizomycetaceae 18. Helotiales families 32. Sclerodermataceae
5. Ascomycota families 19. Herpotrichiellaceae 33. Sebacinaceae
6. Atheliaceae 20. Hypocreales families 34. Sordariales families
7. Basidiomycota families 21. Icmadophilaceae 35. Sordariomycetes
families
8. Boletaceae 22. Leotiaceae 36. Suillaceae
9. Caliciaceae 23. Leotiomycetes families 37. Thelephoraceae
10. Cladoniaceae 24. Magnaporthales
families
38. Tremellaceae
11. Clavulinaceae 25. Mortierellaceae 39. Tremellales families
12. Cortinariaceae 26. Mortierellales families 40. Trichocomaceae
13. Dermateaceae 27. Mucoromycotina
families
41. Tricholomataceae
14. Dothideomycetes families 28. Myxotrichaceae 42. Venturiales families
Figure 16: Venn diagram showing distribution of fungal families identified in limed and
unlimed soil samples from the GSR.
Limed and Unlimed sites: Daisy Lake 2, Wahnapitae Hydro-Dam, Kelly Lake, and Kingsway.
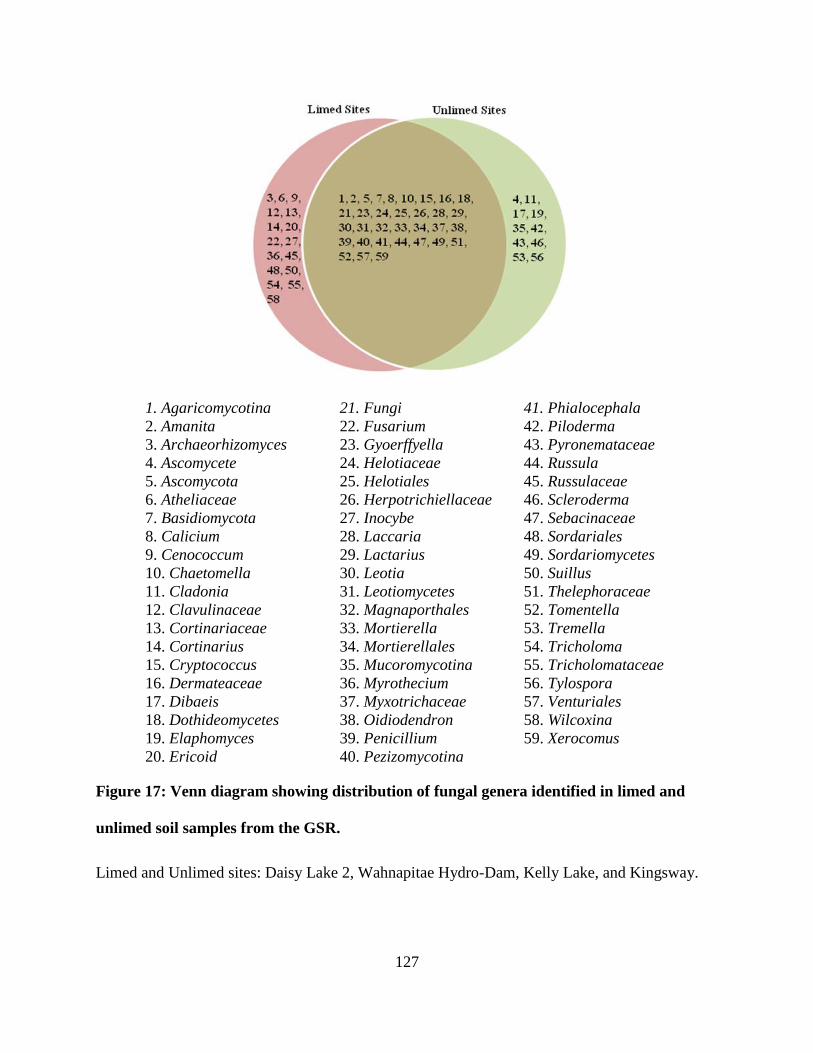
127
1. Agaricomycotina 21. Fungi 41. Phialocephala
2. Amanita 22. Fusarium 42. Piloderma
3. Archaeorhizomyces 23. Gyoerffyella 43. Pyronemataceae
4. Ascomycete 24. Helotiaceae 44. Russula
5. Ascomycota 25. Helotiales 45. Russulaceae
6. Atheliaceae 26. Herpotrichiellaceae 46. Scleroderma
7. Basidiomycota 27. Inocybe 47. Sebacinaceae
8. Calicium 28. Laccaria 48. Sordariales
9. Cenococcum 29. Lactarius 49. Sordariomycetes
10. Chaetomella 30. Leotia 50. Suillus
11. Cladonia 31. Leotiomycetes 51. Thelephoraceae
12. Clavulinaceae 32. Magnaporthales 52. Tomentella
13. Cortinariaceae 33. Mortierella 53. Tremella
14. Cortinarius 34. Mortierellales 54. Tricholoma
15. Cryptococcus 35. Mucoromycotina 55. Tricholomataceae
16. Dermateaceae 36. Myrothecium 56. Tylospora
17. Dibaeis 37. Myxotrichaceae 57. Venturiales
18. Dothideomycetes 38. Oidiodendron 58. Wilcoxina
19. Elaphomyces 39. Penicillium 59. Xerocomus
20. Ericoid 40. Pezizomycotina
Figure 17: Venn diagram showing distribution of fungal genera identified in limed and
unlimed soil samples from the GSR.
Limed and Unlimed sites: Daisy Lake 2, Wahnapitae Hydro-Dam, Kelly Lake, and Kingsway.

128
Fusarium, Herpotrichiellaceae, Leotiomycetes, Magnaporthales, Mortierella, Pezizales,
Scleroderma and Sordariomycetes. Overall, 27% of genera were specific to limed sites and 17%
to unlimed (Fig. 17).
A total of 119 OTUs were identified of which 96 were found in limed and 81 in unlimed
sites (Table 10). Estimated Chao1 values revealed significant differences between limed and
unlimed sites (p≤0.05) (Table 10). But no significant differences between limed and unlimed
sites were observed based on Simpson index, Shannon index, and species evenness data (p≥0.05)
(Table 10). The study showed no change in species richness among limed and unlimed soil
samples (Table 10). Further analysis indicated a weak negative correlation between all the fungal
diversity parameters and pH. Pair wise comparisons among soil samples revealed low similarity
indices or high dissimilarity indices (Table 11). Distance matrix values were high among
samples (Table S13).
129
3.5 Discussion
The pH in limed soils was significantly higher than in unlimed areas reflecting the addition
of dolomitic limestone to soils >35 years ago. These results are consistent with data reported in
other studies [25,34,35,47]. Likewise, strong positive correlations between soil pH and CEC
reflect the data documented in other soil analysis under different conditions [12,26,172]. PLFA
and pyrosequencing data demonstrate that microbial biomass and relative abundance were
significantly higher in limed sites compared to the adjacent unlimed areas. Although several
bacterial and fungal groups were present in all the sites, 25% of bacterial genera were specific to
limed sites and 16% to unlimed areas. Similarly, the proportions of fungal genera specific to
limed and unlimed sites were 27% and 17%, respectively. Chao1 values were higher for limed
sites compared to unlimed areas for both bacteria and fungi. But the number of OTUs, and the
levels of Simpson and Shannon diversity indices, and species evenness were not affected by
liming.
3.5.1 Phospholipid Fatty Acid Analysis
PLFA analysis was used to determine soil microbial responses to liming. The results
revealed an increase in total microbial biomass, AM fungi, other fungi, other eukaryotes,
actinomycetes, gram positive, and gram negative bacteria in limed sites compared to unlimed
soil samples. The differences in microbial biomass between limed and unlimed soils can be
attributed to soil pH [31,38,40,91]. Soils treated with different types of limes have also been
found to change PLFA composition [39,91].
The relative proportion of branched PLFAs (17:0 and 18:0) and iso- and anteiso branched
PLFAs (i15:0, i16:0, i16:1, and i17:0) were higher in limed soils compared to samples from
130
unlimed areas suggesting that liming stimulated gram positive bacterial populations. A similar
trend was observed for gram negative bacteria which were more abundant in limed soils
compared to unlimed soil samples. PLFAs that are used as indicators of gram negative bacteria
include 16:1ω5, 16:1ω9, 17:1ω9, cy17:0, 18:1ω7 and cy19:0 [91,92]. Overall, a predominance of
gram negative over gram positive bacteria was observed in the two types of soils. This is usually
common under stress conditions [40,91,92].
It has been demonstrated that acidic soil conditions enhance the development and activity
of fungi relative to those of bacteria [13,31,40,91,93]. In the present study, 16:0 and 18:1ω9
PLFA considered as reliable indicators of fungal biomass were present in higher concentrations
in unlimed soils compared to limed sites. But the concentration of PLFA 18:2ω6 another
indicator of fungal biomass was lower in unlimed areas compared to limed sites. PLFA 18:1ω9
and 18:2ω6 are not exclusive to fungi since they are present in many eukaryotic organisms,
including plants [40,90]. Therefore, some of these PLFAs identified in fungi especially in limed
sites, might be from plant materials. In general, 16:1ω5 and 18:1ω7 are good indictors of AM
fungi [94,95]. Both PLFAs were slightly more abundant in limed sites compared to unlimed
samples. Overall, fungal biomass was significantly higher in limed compared to unlimed soil
samples. In addition to the biomass and community structure determinations, PLFA analysis has
been used to get an insight into the physiological status of the microbes. The increase in trans/cis,
saturated/unsaturated, and cy17:0/16:1ω7c ratios in the unlimed sites are consistent with
stressed environmental conditions [92]. Low ratio of trans to cis-monoenoic unsaturated fatty
acids, fungi to bacteria, and a high proportion of cyclopropyl fatty and gram negative PLFAs in
all soil samples confirm that the region is still under environmental stress.

131
3.5.3 Pyrosequencing Analysis
Pyrosequencing has been used to analyze bacteria population dynamics [99,111,112]. In
the present study, analysis of two types of soil samples showed a higher relative abundance of
bacterial species and genera compared to fungi. In total, 149 bacterial groups were identified
belonging to 133 genera. For fungi, 70 fungal groups corresponding to 59 genera were identified
in the targeted sites.
Bacterial communities are directly influenced by soil pH as most bacterial taxa exhibit
narrow growth tolerances [26,33,93,221]. Rousk et al. [93] and Ferandez-Calvino and Baath
[221] reported that deviations of 1.5 pH units can reduce bacterial community’s activity by 50%.
The shifts in the relative abundances of specific taxonomic groups across pH gradient are similar
to the pH responses observed in other studies [93,221]. For instance, the relative abundance of
Acidobacteria has been shown to increase when soil pH decreases [93,216,222]. Rousk et al.
[93] and Lauber et al. [111] reported a strong positive correlation between relative abundance of
Bacteriodetes and pH. But the results of the present study showed an opposite trend. The
increase of Bacteriodetes in unlimed sites could be related to site characteristics such as carbon
availability or soil moisture. The high relative abundance of Proteobacteria in limed sites is in
agreement with Rousk et al. [93] and Lauber et al. [111] who reported an increase of these
bacteria associated with a higher availability of carbon and high pH. Proteobacteria are members
of photosynthetic and nitrogen fixing bacteria. The bacterial communities of those functional
species play an important role in carbon, nitrogen cycles and in maintaining integrity of the
ecosystem [111]. In fact, the targeted limed sites showed a high level of forest complexity and
diversity compared to unlimed areas [47].

132
Bacterial community composition was also examined at the genus level. Acidobacterium,
Afipia, Aquicella, Bradyrhizobium, Geobacillus, Granulicella, Nitrosococcus, Rhodoplanes,
Skermanella, Solirubrobacter, Thermosporothrix, and Thioalkalispira were the most
predominant genera in all the sites. The composition and distribution of these 12 common
bacterial genera varied between limed and unlimed soil samples. Photosynthetic bacteria, such as
Rhodobacter were found only in limed soils. These bacteria are known to play an irreplaceable
role in carbon cycling and material transformation, and their diversities affect the process of
nitrogen cycle [99]. Rhizobium present in all soil samples is a major contributor to the global
nitrogen cycle as it forms a symbiotic nitrogen fixation with many plants. It also improves soils
fertility, promotes circulation of soil materials and increases soil microbial activity [99]. The
relative abundance of Burkholderia observed in the unlimed soil is consistent with the recent
classification of this genus as an acid tolerant group [223]. Bradyrhizobia are often found in acid
soils and they were identified in both limed and unlimed soil samples. In addition, several acid
tolerant bacterial species were identified in both soil types.
Bacterial groups that grow in stressed environment and are involved in nitrogen fixation,
carbon cycling and iron oxidation, were found in targeted sites at various levels of relative
abundance. They are usually present in sludge and waste water treatments. Nitrospira bacteria
that were observed only in limed sites in the present study are part of a nitrification process
which is important in the biogeochemical nitrogen cycle. Overall, a higher percentage of gram
negative bacterial species compared to gram positive were identified in all the sites. This is in
agreement with PLFA analysis data.

133
3.5.3.1 Fungal Populations
While many reports have limited their pyrosequencing analysis only on bacterial
communities this study assessed fungal populations in all the sites as well. Recent studies using
pyrosequencing technique have revealed that relative abundance of fungi is not affected by pH
and that fungal diversity is only weakly associated to pH [93,218,224]. We confirmed that the
composition of fungal community is weakly related to soil pH. This demonstrates that fungi
exhibit wider pH ranges for optimal growth. The optimum level of pH varies from 5 to 9
[13,34,35,218]. Overall, pyrosequencing data are consistent with PLFA results revealing a much
lower fungal biomass compared to bacteria in limed and unlimed sites.
The relative abundance of Basidiomycota was higher in limed soils compared to samples
from unlimed sites. An opposite trend was observed for Ascomycota. The main Ascomycota
detected in this study were classified as lichen forming fungi (Calicium salicinum, Cladonia
coniocraea, Dibaeis baeomyces), little/wood decomposers (Dermateaceae sp., Sordariomycetes
sp., Tremella diploschistina), plant parasites (Dothideomycetes sp., Fusarium oxysporum),
human pathogens (Herpotrichiellaceae sp.), endophytes (Gyoerffyella sp., Phialocephala
fortinii) and saprotrophs (Venturiales sp.). Basidiomycetes included EM fungi and decay
organisms of plant residues. EM fungi colonize plant roots and help plants to access nutrients
such as phosphorous from soil [112,225]. Several decomposers involved in the decomposition of
hard woody organic matters and in the conversion of organic matters into fungal biomass, carbon
dioxide (CO2) and organic acids were also present in the targeted sites. Compared to Ascomycota
and Basidiomycota, a low relative abundance of Zygomycota was observed in all the soil samples
analyzed. Mortierella sp. and Mortierellales sp. from the phylum Zygomycota were more

134
abundant in unlimed compared to limed samples. These species mineralize readily dissolved
organic substrates rather than breaking down soil litter polymers [226]. Members of
the Taphrinomycotina were found only in limed sites. In general they range from simple and
yeast-like to filamentous. Their role in the environment is not well documented.
3.5.3.2 Bacterial and Fungal Diversity
Estimates of diversity based on DNA sequencing are more accurate than culture
techniques. In this study, relative abundance and diversity were estimated by the number of
OTUs, Chao1, Shannon index and Simpson index. OTU is a widely used construct of clustered
sequence data where each OTU represents a different microbial (bacterial or fungal) population
in the community. These approaches are providing estimates of diversity at > 10,000 species
(OTUs) of bacteria per gram of soil [81]. Dimitriu and Grayston [216] looked at bacterial
diversity across reclaimed and natural boreal forest in British Columbia and reported 577 OTUs
for bacteria. This is consistent with the results of the present study on the damaged and reclaimed
sites in the GSR. Chao1 estimates species richness from the rarefaction of observed sequences
present in a community. This index is based on the number of rare classes (i.e. OTUs or species)
in a sample [199]. Chao1 estimates for bacterial species richness in soils were higher compared
to fungi. Importantly, Chao1 estimates were higher in limed sites compared to unlimed areas for
both bacteria and fungi. But this study revealed that liming has no effects on overall bacterial and
fungal diversity based on Shannon and Simpson indices. The level of diversity in fungal
communities was lower than bacterial diversity based on Shannon diversity index.
For beta measures, Jaccard and Sorenson indices are based on the presence/absence data
[220,227]. Low values for Jaccard and Sorenson indices, for both bacteria and fungi indicate

135
high dissimilarity (high beta diversity) between limed and unlimed areas. High values for Bray-
Curtis and Whittaker dissimilarity indices indicate that there is a high number of species that are
different between the two types of sites (high beta diversity). Overall, both similarity and
dissimilarity indices reveal significant difference between limed and unlimed sites.
In addition, weighed UniFrac distances which take into account differences in relative
abundance of taxa between limed and unlimed sites showed that for bacterial communities, limed
sites are closely related to each other. Whereas for fungal communities, high distance values
indicated that the sites are different from each other.
In the present study, both alpha and beta diversity indices were used. Our data show low
levels of diversity within each group of sites (limed and unlimed) and low similarity among the
two types of sites. This indicates that although liming increases significantly the amount of
microbial biomass, the level of species diversity in limed compared to unlimed areas remain
unchanged (and low) even though the microbial compositions are not similar. Ecological and soil
properties such as vegetation type, soil texture, soil type, moisture and nutrient concentrations
could play a significant role in microbial community composition and relative abundance.
3.5.4 Pyrosequencing and PFLA Comparison
In general, PLFA-based methods are rapid, inexpensive, sensitive and reproducible. There
are a number of scientific publications based on PFLA analysis that have increased our
understanding of the soil ecosystem. Unlike pyrosequencing, PLFA has limitations such as
overlap in the composition of microorganisms and the specificity of PLFAs signature. For the
present study, PFLA data revealed significant difference in microbial biomass among the limed
and unlimed sites. But these differences were not always detected by pyrosequencing. In this

136
study, the combination of PLFA and pyrosequencing analyses provided a more complete
assessment of microbial relative abundance, structure, and diversity.
3.6 Conclusions
In the present study, soil microorganisms were studied to assess the effect of liming on
bacterial and fungal communities. This study is novel as it describes the effect of liming on
microbial relative abundance and diversity >35 years after dolomitic limestone applications. The
combination of both PFLA and pyrosequencing validate our findings. Soil analysis revealed an
increase in soil pH (6.3) and CEC (16.30 cmol/kg) in limed sites compared to unlimed areas.
Total microbial biomass, bacterial and fungal relative abundance were higher in limed sites
compared to unlimed samples. Chao 1 estimates followed the same trend. But the total number
of OTUs in limed and unlimed soil samples for bacteria and fungi were similar. Likewise,
Simpson and Shannon diversity indices revealed no significant differences between limed and
unlimed sites. Bacterial and fungal group’s specific to limed and unlimed sites were identified.
Overall, the results of the present study show that soil liming increases the amount of microbial
biomass but has limited effects on bacterial and fungal diversities > 35 years after dolomitic
applications. Further studies will target in detail the effects of organic matter content and metal
contamination on microbial relative abundance and diversity.
3.7 Acknowledgements
We would like to thank the Natural Sciences and Engineering Research Council of Canada
(NSERC), Vale and Sudbury Integrated Nickel Operations (Glencore Limited) for their financial
support. We are grateful to MR DNA Laboratory in Shallowater, Texas (USA) for assistance

137
with pyrosequencing. Special thanks to Dr. Paul Michael for technical advice and to Drs. Peter
Beckett and Graeme Spiers for initial site characterization.

138
CHAPTER 4: CHANGES IN ENZYMATIC ACTIVITIES IN METAL
CONTAMINATED AND RECLAIMED LANDS IN THE GREATER SUDBURY
REGION

139
4.1 Abstract
Metal and sulphur dioxide (SO2) contaminations in Northern Ontario (Canada), especially
in the Greater Sudbury Region (GSR) caused by mining activities have resulted in severe
environmental degradation. A long term restoration program has led to significant landscape
changes and healthy ecosystems. The objective of this study was to assess variation in enzymatic
activities and soil respiration in metal contaminated and reclaimed ecosystems. Soil respiration
analysis revealed that respiration rates were higher in limed soils (65 ppm) compared to unlimed
soils (35 ppm). The respiration rate in metal contaminated sites (55 ppm) was significantly lower
compared to reference sites (90 ppm). β-glucosidase (BG), cellobiohydrolase (CBH), β-N-
acetylglucosaminidase (NAGase), aryl sulfatase (AS), acid phosphatase (AP), alkaline
phosphatase (AlP), glycine aminopeptidase (GAP), and leucine aminopeptidase (LAP) activites
were significantly higher in limed compared to unlimed sites. Metal contamination significantly
reduced the activities of these enzymes with the exception of LAP. An opposite trend was
observed for peroxidase (PER) enzyme activity that was higher in unlimed and metal
contaminated sites compared to limed and reference sites. Further analysis revealed that soil
respiration and enzyme activities are linked to soil organic matter (SOM) and pH.
Keywords: Soil respiration; Soil enzyme activity; pH; Soil organic matter; Soil quality; Liming;
Metal contamination.

140
4.2 Introduction
Mining activities for over a century have led to a decrease in soil organic matter (SOM)
content and hence to a decline in soil quality in Greater Sudbury Region (GSR) [15,25,26,38,40].
This was a direct effect of metalliferous ores (since 1800) that released enormous amounts of
sulphur dioxide (SO2) and various metals into the atmosphere resulting in severe contamination
and acidification of soils and water in the GSR [15,25,26,38,40]. In the last 40 years legislated
controls and industrial technology development reduced SO2 emissions by 90% which resulted in
improved air quality and natural recovery of damaged ecosystems [25,38,40]. In addition, a
regreening program that consisted in soil liming and planting of over 12 million trees in the GSR
led to the increase of SOM and microbial biomass [15,35,38,40,47]
Chemical analysis of soils from the GSR indicates that soil pH and cation exchange
capacity (CEC) are still lower (acidic) in unlimed soils compared to limed areas [25,26,34,35].
Also, low pH values were documented in metal contaminated soils compared to reference sites
[25,40]. In addition, plant population diversity showed a similar trend as unlimed and metal
contaminated sites had lower tree species richness compared to limed and reference sites,
respectively [25,26,40]. Moreover, phospholipid fatty acid analysis (PLFA) revealed that total
microbial biomass, fungal and bacterial abundance were significantly lower in unlimed and
metal contaminated sites compared to limed and reference sites, respectively [26,35,40]. These
studies did contribute to our understanding of the dynamics of soil chemistry and ecosystems in
the GSR. But biochemical indicators are more informative as they provide information on
microbial activities and functions [213,228–231]. Soil respiration and enzyme activities involved
141
in organic matter turnover, nutrient cycling and plant nutrition have been used to study soil
fertility and health [213,228–231].
Enzyme activities in soils have been useful tools to understanding the biochemistry of
decomposition and nutrient cycling (carbon: C, nitrogen: N, phosphorous: P and sulfur: S)
[114,213,230,231]. In addition, enzyme activities have been associated with microbial ecology,
biogeochemical process, and soil processes and health [114,150,213,228,231]. The most widely
assayed enzymes are those involved in the degradation of cellulose and lignin (abundant
components of plant litter), as well as enzymes that hydrolyze proteins, chitin, and peptidoglycan
(reservoirs of organic N) [50,228,230]. In addition, phosphatases which play a role in
mineralizing P from nucleic acids, phospholipids, and other ester phosphates have been analyzed
under different agricultural conditions [150,213,230,232].
The main objective of this study was to assess the effect of liming and metal contamination
on soil enzymatic activities and respiration.

142
4.3 Experimental Procedures
4.3.1 Study Sites
Study sites were located at Laurentian University research areas and Crown (public) lands
that are not within a park or conservation reserve in the GSR and sites away from GSR (Table
S1). Reclaimed mining sites in the GSR where dolomitic limestone were applied >40 years ago
were selected for this study. Soil sampling was performed at four distant locations in reclaimed
sites (limed) and their respective adjacent un-reclaimed areas (unlimed). These sites included
Daisy Lake 2, Wahnapitae Hydro-Dam, Kelly Lake, and Kingsway (Table S1) (Fig. 10).
To determine the effects of metals on enzymatic activities, three sites close to smelters with
high levels of metal contaminations were selected. They include Laurentian, Kelly Lake and
Kingsway (Table S1) (Fig. 1). Three metal uncontaminated sites located >50 km from smelters
(Onaping Falls, Capreol and Killarney) were used as controls (Table S1) (Fig. 1). The GPS
coordinates for all the sites are given in table S1.
For all the sites, weather conditions such as temperature and rain falls, were presumed
similar based on literature (Brown, 2006; Historical Weather, 2015; Time and Date, 1995). Data
on metal concentration, pH, organic matter contents, cation exchange capacity (CEC), and
microbial abundance for these sites have been previously reported [25,38,40].
4.3.2 Soil Sampling
At each site of approximately 5 km2 in size, three soil samples (each consisting of 15 sub-
samples) were collected from organic layer (0-5 cm in depth). Plant materials, stones and
residues were removed and sieved using a 2 mm mesh. Soil samples were divided into two equal
parts for further analysis.
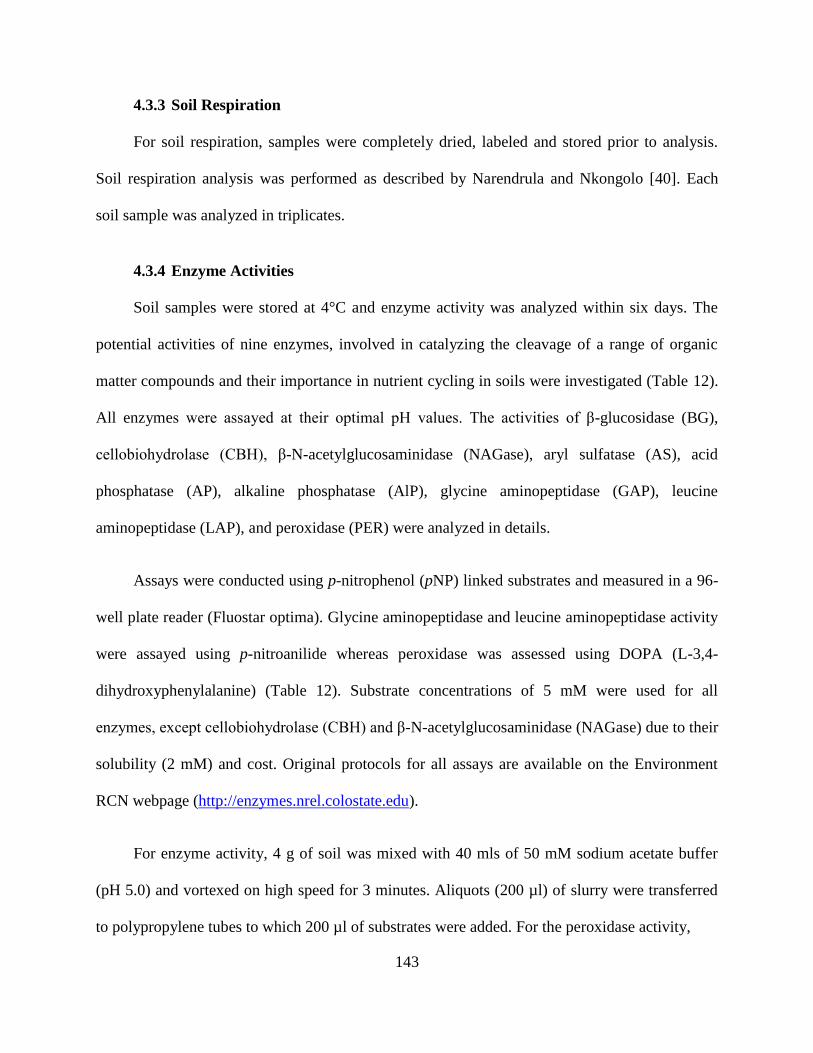
143
4.3.3 Soil Respiration
For soil respiration, samples were completely dried, labeled and stored prior to analysis.
Soil respiration analysis was performed as described by Narendrula and Nkongolo [40]. Each
soil sample was analyzed in triplicates.
4.3.4 Enzyme Activities
Soil samples were stored at 4°C and enzyme activity was analyzed within six days. The
potential activities of nine enzymes, involved in catalyzing the cleavage of a range of organic
matter compounds and their importance in nutrient cycling in soils were investigated (Table 12).
All enzymes were assayed at their optimal pH values. The activities of β-glucosidase (BG),
cellobiohydrolase (CBH), β-N-acetylglucosaminidase (NAGase), aryl sulfatase (AS), acid
phosphatase (AP), alkaline phosphatase (AlP), glycine aminopeptidase (GAP), leucine
aminopeptidase (LAP), and peroxidase (PER) were analyzed in details.
Assays were conducted using p-nitrophenol (pNP) linked substrates and measured in a 96-
well plate reader (Fluostar optima). Glycine aminopeptidase and leucine aminopeptidase activity
were assayed using p-nitroanilide whereas peroxidase was assessed using DOPA (L-3,4-
dihydroxyphenylalanine) (Table 12). Substrate concentrations of 5 mM were used for all
enzymes, except cellobiohydrolase (CBH) and β-N-acetylglucosaminidase (NAGase) due to their
solubility (2 mM) and cost. Original protocols for all assays are available on the Environment
RCN webpage (http://enzymes.nrel.colostate.edu).
For enzyme activity, 4 g of soil was mixed with 40 mls of 50 mM sodium acetate buffer
(pH 5.0) and vortexed on high speed for 3 minutes. Aliquots (200 µl) of slurry were transferred
to polypropylene tubes to which 200 µl of substrates were added. For the peroxidase activity,

144
Table 12: Enzyme assays measured, their function and the substrate used.
Enzymes assayed Function Substrate
β-glucosidase (BG)
Cellulose degradation,
carbon cycling
pNP β-D-glucopyranoside
Cellobiohydrolase (CBH)
Cellulose degradation and other
beta-1,4 glucans,
carbon cycling
pNP-β-D-cellobioside
β-N-acetylglucosaminidase
aka chitinase (NAGase)
Chitin degradation,
carbon/nitrogen cycling
pNP-N-acetyl-β-D-
glucosaminide
Arylsulfatase (AS)
Produces plant available
sulfates,
sulfur cycling
pNP sulfate
Acid phosphatase (AP)
Produces plant available
phosphates,
phosphorus cycling
pNP phosphate (buffer pH
5.0)
Alakaline phosphatase (AlP)
Releases ester bound phosphates,
phosphorous cycling
pNP phosphate (buffer pH
9.0)
Glycine aminopeptidase
(GAP)
Degrades protein into amino
acids,
nitrogen cycling
Glycine-p-nitroanilide
Leucine aminopeptidase
(LAP)
Degrades leucine and other
hydrophobic amino acids from
protein,
nitrogen cycling
L-Leucine-p-nitroanilide
Peroxidase (PER)
Lignin and tannin (polyphenols)
degradation, carbon cycling
L-3,4-
dihydroxyphenylalanine
(DOPA)
pNP: 4-nitrophenyl

145
10 µl of 0.3% H2O2 (hydrogen peroxide) was added. The tubes were then capped and placed on a
rotary shaker for 2 hrs at 25 °C. Following incubation, tubes were centrifuged at 3200 × g for 4
min and aliquots (100 µl) of supernatant were taken from each tube and transferred into
microplate. For pNP substrates, 5 µl of 1.0 M NaOH (sodium hydroxide) was added to the wells
to stop the reaction. Microplates were read at 405 nm for pNP and p-nitroanilide and at 450 nm
for peroxidase. Substrate and sample controls were used and all assays were done in triplicates,
and repeated twice. The absorbance of the assay was corrected by subtracting the combined
absorption results for the sample and substrate controls. Enzyme activity was expressed as nmol
h-1
g soil-1
.
4.3.5 Statistical Analysis
Respiration and enzyme activity data were tested for normality using the Shapiro–Wilk test
(p≤0.05). Both data showed normal distribution, hence statistical analyses were conducted using
SPSS version 20 for windows (IBM, NY, USA). Independent sample t-tests were used to
determine significant difference for soil respiration and enzyme activity between limed and
unlimed sites and between metal contaminated and reference sites.

146
4.4 Results
4.4.1 Soil Respiration
Results of soil respiration are illustrated in figures 18 and 19. Soil respiration rates (CO2-C)
were significantly higher (p≤0.05) in limed sites compared to unlimed sites. In fact, respiration
rates were 67.36 ppm (parts per million) in limed sites and 37.07 ppm in unlimed areas (Fig. 18).
Similarly, higher (p≤0.05) respiration rates were observed in reference sites (93.54 ppm)
compared to metal contaminated sites (55.55 ppm) (Fig. 19).
4.4.2 Soil Enzyme Activities
Enzyme activity data are illustrated in figures 18 to 23. Overall, soil samples from limed
areas exhibited significantly higher (p≤0.05) enzymatic activity for β-glucosidase (BG),
cellobiohydrolase (CBH), β-N-acetylglucosaminidase (NAGase), aryl sulfatase (AS), acid
phosphatase (AP), alakaline phosphatase (AlP), glycine aminopeptidase (GAP), and leucine
aminopeptidase (LAP) compared to unlimed samples (Figs. 20, 21). In contrast, there was a
decrease of peroxidase (PER) activity in limed sites (19.14 nmol h-1
g soil-1
) compared to in
unlimed areas (47.69 nmol h-1
g soil-1
) (Fig. 22).
Likewise, enzyme activity was significantly higher (p≤0.05) for BG, CBH, NAGase, AS,
AP, AlP and GAP in reference sites compared to metal contaminated sites (Figs. 23, 24 and 25).
LAP activities in metal contaminated (3.57 nmol h-1
g soil-1
) and reference sites (4.92 nmol h-1
g
soil-1
) were not significantly different (Fig. 25). But, PER activity was higher (p≤0.05) in metal
contaminated sites (49.03 nmol h-1
g soil-1
) compared to reference sites (17.28 nmol h-1
g soil-1
)
(Fig. 25).

147
Figure 18: Mean soil respiration rates in the organic layer (0-5cm) from various limed and
unlimed sites from GSR.
Means (±SE) are given (n=16).
* represents significant differences between limed and unlimed sites based on t-test (p≤0.05)
Limed and Unlimed sites: Daisy Lake 2, Wahnapitae Hydro-Dam, Kelly Lake and Kingsway
0
10
20
30
40
50
60
70
80
Limed sites Unlimed sites
Soil
CO
2 R
esp
irati
on
(p
pm
) *

148
Figure 19: Mean soil respiration rates in the organic layer (0-5cm) from various metal
contaminated and reference sites from GSR.
Means (±SE) are given (n=12).
* represents significant differences between metal contaminated and reference sites based on t-
test (p≤0.05)
Metal contaminated sites: Laurentian, Kelly Lake and Kingsway and Reference sites: Onaping
Falls, Capreol and Killarney
0
10
20
30
40
50
60
70
80
90
100
Metal contaminated sites Reference sites
Soil
CO
2 R
esp
irati
on
(p
pm
)

149
Figure 20: The activities of selected hydrolytic enzymes from limed and unlimed soil
samples from the GSR (n = 72) using p-nitrophenol (pNP) linked substrates. BG = β-
glucosidase; CBH = Cellobiohydrolase; NAG = β-N-acetylglucosaminidase; AS = Aryl
sulfatase.
* represents significant differences between limed and unlimed sites based on t-test (p≤0.05)
Limed and Unlimed sites: Daisy Lake 2, Wahnapitae Hydro-Dam, Kelly Lake and Kingsway
0
10
20
30
40
50
60
70
80
90
100
BG CBH NAGase AS
En
zym
e act
ivit
y (
nm
ol
pN
P g
-1 h
-1)
Limed sites
Unlimed sites *
*
*
*
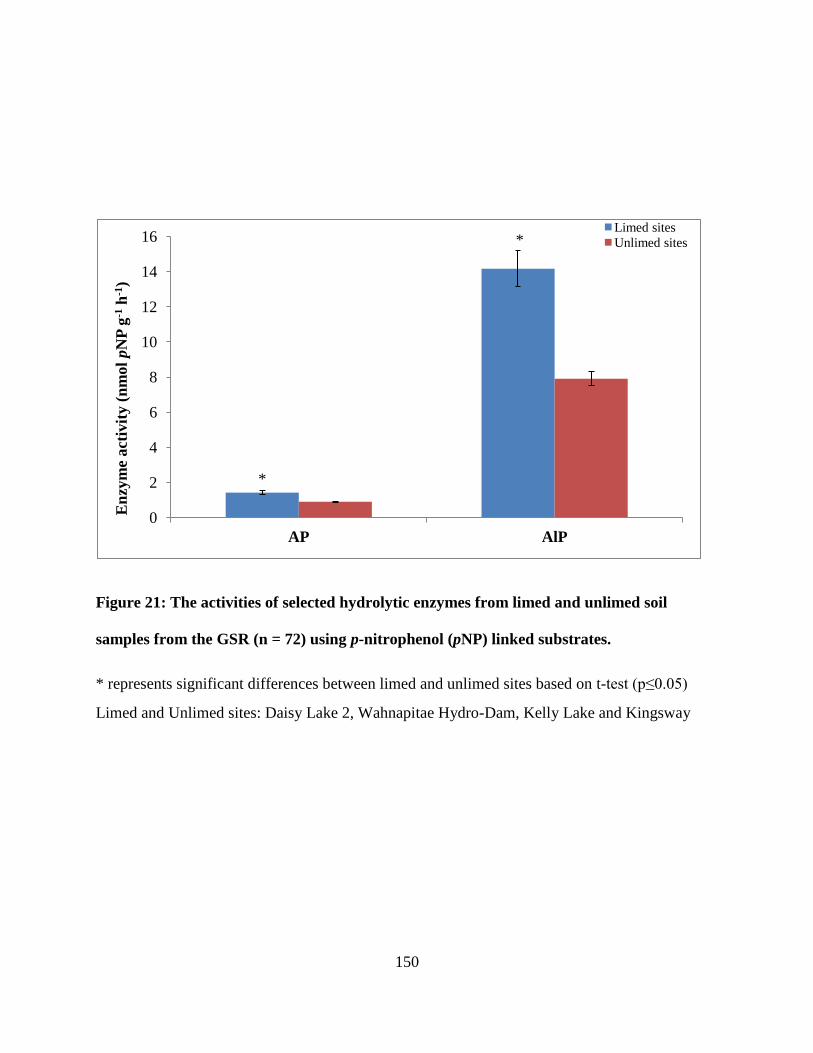
150
Figure 21: The activities of selected hydrolytic enzymes from limed and unlimed soil
samples from the GSR (n = 72) using p-nitrophenol (pNP) linked substrates.
* represents significant differences between limed and unlimed sites based on t-test (p≤0.05)
Limed and Unlimed sites: Daisy Lake 2, Wahnapitae Hydro-Dam, Kelly Lake and Kingsway
0
2
4
6
8
10
12
14
16
AP AlP
En
zym
e act
ivit
y (
nm
ol
pN
P g
-1 h
-1)
Limed sites
Unlimed sites
*
*

151
Figure 22: The activities of selected hydrolytic and oxidoreductase enzymes from limed and
unlimed soil samples from the GSR (n = 72) using p-nitroanilide linked substrate for
glycine and leucine aminopeptidase (GAP and LAP), and L-3, 4-dihydroxyphenylalanine
(DOPA) linked substrates for peroxidase (PER) activity.
* represents significant differences between limed and unlimed sites based on t-test (p≤0.05)
Limed and Unlimed sites: Daisy Lake 2, Wahnapitae Hydro-Dam, Kelly Lake and Kingsway
0
10
20
30
40
50
60
GAP LAP PER
En
zym
e act
ivit
y (
nm
ol
g-1
h-1
)
Limed sites
Unlimed sites
*
*
*

152
Figure 23: The activities of selected hydrolytic enzymes in metal contaminated and
reference soil samples from the GSR (n = 54) using p-nitrophenol (pNP) linked substrates.
BG = β-glucosidase; CBH = Cellobiohydrolase; NAGase = β-N-acetylglucosaminidase; AS
= Aryl sulfatase.
* represents significant differences between metal contaminated and referece sites based on t-test
(p≤0.05)
Metal contaminated sites: Laurentian, Kelly Lake and Kingsway and Reference sites: Onaping
Falls, Capreol and Killarney
0
20
40
60
80
100
120
BG CBH NAGase AS
En
zym
e act
ivit
y (
nm
ol
pN
P g
-1 h
-1)
Reference sites
Metal contaminated sites *
*
*
*
153
Figure 24: The activities of selected hydrolytic enzymes in metal contaminated and
reference soil samples from the GSR (n = 54) using p-nitrophenol (pNP) linked substrates.
* represents significant differences between metal contaminated and referece sites based on t-test
(p≤0.05)
Metal contaminated sites: Laurentian, Kelly Lake and Kingsway and Reference sites: Onaping
Falls, Capreol and Killarney
0
2
4
6
8
10
12
14
16
18
20
AP AlP
En
zym
e act
ivit
y (
nm
ol
pN
P g
-1 h
-1)
Reference sites
Metal contaminated sites * *

154
Figure 25: The activities of selected hydrolytic and oxidoreductase enzymes in metal
contaminated and reference soil samples from the GSR (n = 54) using p-nitroanilide linked
substrate for glycine and leucine aminopeptidase (GAP and LAP), and L-3, 4-
dihydroxyphenylalanine (DOPA) linked substrates for peroxidase (PER) activity.
* represents significant differences between metal contaminated and referece sites based on t-test
(p≤0.05)
Metal contaminated sites: Laurentian, Kelly Lake and Kingsway and Reference sites: Onaping
Falls, Capreol and Killarney
0
10
20
30
40
50
60
GAP LAP PER
En
zym
e act
ivit
y (
nm
ol
g-1
h-1
)
Reference sites
Metal contaminated sites

155
4.5 Discussion
4.5.1 Soil Respiration
Soil respiration regulates atmospheric CO2 concentration and climate dynamics, mainly
produced by soil microorganisms and plant roots. It is strongly affected by various biological
(microorganisms, vegetation), environmental (pH, temperature, moisture) and man-made factors
[34,40,126,234]. It is an important phenomenon in soil ecosystems as it is the only pathway of
soil carbon pool and is an important source of atmospheric CO2. Many studies have highlighted
that soil respiration is an indicator of soil health, fertility, and microbial activity [115,234].
4.5.1.1 Effects of Liming
Results show that soil liming increases soil respiration even >40 years after dolomitic
limestone application. This is consistent with other studies [60]. CO2 released from the soil after
liming is a result of a chemical (dolomite lime hydrolysis) and biological processes (increased
microbial activity) [214,235]. Liming improved chemical conditions in soil profile (pH, CEC and
exchangeable cations) which in turn favored microbial activities (abundance) [26,34]. Changes
in soil chemical conditions, such as reduction in acidity, increase of pH, Ca2+
and Mg2+
content
have been observed in limed sites [236]. These factors led to an increase in respiration rate, soil
CO2 emission, and the development of acid-intolerant microorganisms. Recent evaluation of the
same sites showed that microbial populations, bacterial, and fungal biomasses were higher in
limed sites compared to the unlimed [236]. These results were consistent with previous reports in
other soil conditions [26,34,35,214,235,237].
4.5.1.2 Effects of Metal Contamination

156
Respiration rates were significantly lower in metal contaminated sites compared to
reference sites. Our previous studies showed high concentrations of As, Cu, Ni, and Zn in metal
contaminated sites compared to reference sites [25,40,45–47]. In addition, pH values were
consistent with the acidity levels documented for soils on the Canadian Shield. The data also
confirm that the pH is low in metal contaminated soils compared to reference soil [25,40,47]. At
low pH levels (< 4.5) many metals remain in soluble form and can be lost in the leachate soil
system. Although some heavy metals are required for life’s physiological processes, their
excessive accumulation can be detrimental to plants and affect soil microbial composition and
diversity [13,35,40]. Studies have shown that long term metal contamination of soils even at low
dose might have harmful effects on soil microbial activities, especially microbial respiration
[60,161].
Soil microbial compositions are often used as indicators of soil quality and contamination.
Reduced microbial activity and abundance in microbial community structure have been reported
in metal contaminated soils [60,90,238]. In our recent study, phospholipid fatty acids analysis
(PLFA) and 16S profile of metal contaminated sites revealed a decline in microbial biomass
without a significant decrease of microbial diversity and composition [40,239]. Other studies
have reported lower community diversity in soils with high metal concentrations [60,161,238].
4.5.2 Soil Enzyme Activity
Enzymes in soil play an important role in maintaining soil health and its environment.
Enzyme activities in addition to various chemical and physical components contribute to
maintaining soil health. Soil pH and metal concentrations play a role in soil weathering and plant
community composition which affects the distribution of enzyme activity through changes in soil

157
organic matter, nutrient availability, and microbial community composition [114]. Ellert et al.
[240] reported that healthy soils are essential for the integrity of the ecosystem to remain intact
and to recover from disturbances. As soil supports all terrestrial life forms, a thorough
understanding of soil enzyme activities is an important factor in monitoring soil health.
4.5.2.1 Activity of β-glucosidase
β-glucosidase (BG) is a well-studied enzyme due to its universal distribution and well
defined wide variety of substrates [230]. It catalyzes the hydrolysis of glycosidic linkages,
thereby degrading oligosaccharides and glycoconjugates [114,130,230,241]. This enzyme plays
an important role in the degradation of organic C compounds in soil and their products (sugars)
are important energy sources for soil microorganisms [114,230,242]. In the present study, the
activity of BG was higher in limed sites compared to unlimed sites. Similar studies in other
conditions have reported higher activity of BG in limed soils as the activity is positively
correlated with pH [117,230]. In metal contaminated soils, BG activity was lower compared to
reference sites. Lee et al. [243] reported lower activity of this enzyme in metal contaminated
soils where the pH and organic matter were lower. Shukla and Verma [117] showed that
increased CO2 led to a high microbial biomass and BG.
Studies have shown that the most important sources of BG are microscopic fungi [117,
244]. In fact, β-glucosidase are produced from filamentous fungi (Aspergillus niger, A. oryzae,
Penicillium brasilianum, P. decumbens, Phanerochaete chrysosporium, Paecilomyces sp., etc),
yeasts (majority from Candida sp.), and few bacteria [244]. In coniferous forests, BG activities
are reduced with a decrease of microbial biomass suggesting a strong correlation between BG
activities and microbial biomass [117].

158
4.5.2.2 Activity of Cellobiohydrolase
Cellobiohydrolase (CBH) is a cellulase that degrades cellulose by hydrolysis of 1,4-β-D-
glycosidic bonds [114,230,241]. Many studies have reported a variety of specialized
microorganisms that have evolved to produce enzymes that carry out the hydrolysis of cellulose.
Trichoderma reesei is a widely studied fungus that is known to produce CBH [244]. Likewise,
Basidiomycetes produce rich arrays of cellulose degrading enzymes [117]. This is consistent with
our previous analysis that revealed that Basidiomycetes are higher in limed and reference sites
compared to unlimed and metal contaminated sites, respectively [236,239].
Saiya-cork et al. [245] reported an increase of CBH activity in soils with high organic N
content. Previous analysis of these sites showed a higher organic N in limed and reference soils
compared to unlimed and metal contaminated sites [236,239]. Similarly, Guo et al. [246]
observed a higher CBH activity in fertilized soils. Other studies reported that a lower CBH
activity was positively related to lower microbial biomass [117].
4.5.2.3 Activity of β-N-acetylglucosaminidase
β-N-acetylglucosaminidase (NAGase) degrades chitin by hydrolyzing β-1,4-glycosidic
bonds of chitooligosaccharides into N-acetylglucosamine [114,241]. Chitin is found primarily in
fungal walls and also in exoskeletons of some arthropods. It contains approximately 6% nitrogen
and is relatively abundant in soils, making it an important source of organic nitrogen in terrestrial
ecosystem [247]. NAGase activity was higher in limed and reference sites compared to unlimed
and metal contaminated sites.

159
In N-limited systems, microbes degrade labile forms of N-containing organic matter. They
produce enzymes responsible for degrading more forms of N, such as β-1,4-N-acetyl-
glucosamine [248]. Guo et al. [246] reported an increase in polyphenol activity after inorganic N
fertilization. Chemical analysis of soils in the GSR indicate that organic N is higher in limed and
reference sites compared to controls which is in agreement with an increase in NAGase activity
observed.
4.5.2.4 Activity of Arylsulfatase
Arylsulfatse (AS) enzyme catalyzes the hydrolysis of organic sulfate esters (organic S
form) [230,249]. Sulfur occurs in organic and inorganic forms in soils, with >95% of total S
being organic in nature. In soil, 40-70% of total S in surface soils is in the form of ester sulfates,
which act as substrates for arylsulfatase [249]. AS enzyme has been identified in plants, animals,
microorganisms, and soils. Ekenler and Tabatabai [250] reported that AS activity is positively
correlated with soil pH following liming treatment.
AS activity is highly correlated with levels of organic C, total S and microbial biomass
[249,250]. Like with many other enzymes studied, the high level of AS activity observed is
associated with a higher organic C, organic S, microbial abundance and biomass in limed and
reference soils [26,35,40,236,239].
4.5.2.5 Activity of Acid and Alkaline Phosphatase
Phosphatases are enzymes that catalyze the hydrolysis of phosphate ester bonds leading to
the release of phosphate (P), which is taken up by plants or microorganisms [114,232,250,251].
Like many hydrolases, activity of phosphatases depends on several factors such as plant cover,

160
soil properties (pH, organic matter, metal concentration), soil organisms and microbial
community [114,150,230,251].
Activities of soil phosphomonoesterases that include acid and alkaline
phosphomonoesterases (known as acid and alkaline phosphatase) have been among the most
studied [114,230,241,251]. These enzymes hydrolyze monoester bonds including
mononucleotides and sugar phosphates. When soil microorganisms are P limited, they produce
acid or alkaline phosphatase that release inorganic phosphate from organic matter [114,230,251].
Nannipieri et al. [251] reported that acid phosphatase activity prevails in acidic soils, whereas
alkaline phosphatase activity is high in alkaline soils. Other studies have reported increased
phosphatase activity with high microbial activity [117,251]. Our results revealed higher AP and
AlP activity in limed and reference soils where pH [25,26,34,40] and microbial biomass
[25,26,34,40] were higher compared to unlimed and metal contaminated soils. Arbuscular
mycorrhizal (AM) fungi stimulate the release of acid phosphatases [252]. Recent reports on
Sudbury ecosystems revealed a higher level of AM in limed and reference soils compared to
unlimed and metal contaminated soils [236,239]. It is established that the main source of alkaline
phosphatase activity are bacteria whereas acid phosphatase activity is from bacteria, fungi and
plants [251, 252].
4.5.2.6 Activity of Aminopeptidase
Aminopeptidases are widely distributed in bacteria, fungi, plants and animals [253,254].
These enzymes are involved in degradation of intracellular or extracellular peptides to amino
acids for new protein syntheses and play a role in nitrogen cycling [114,253,254]. Leucine
aminopeptidase (LAP) hydrolyzes leucine and other hydrophobic amino acids from N terminus

161
of polypeptides and the activity of LAP is broadly used as an indicator of peptidase potential
[114]. Similarly, glycine aminopeptidase (GAP) enzyme specifically hydrolyzes Gly-X (amino
acids, peptide or arylamide) bonds [254]. Both LAP and GAP have broad substrate specificity
[254]. Ito et al. [254] reported that GAP has been found in various fungal and bacterial species
such as Actinomucor elegans, Aspergillus oryzae, Aspergillus sojae, Escherichia coli and
Penicillium citrinum.
LAP and GAP activities were higher in limed soils compared to unlimed soils. In metal
contaminated sites, GAP activity was lower compared to reference sites whereas, LAP showed
no difference between the two sites. Aminopeptidase activities showed a stronger relationship
with soil pH compared to SOM [114]. Ramirez et al. [248] reported that N additions alter the
composition and diversity of soil microbial communities and impact microbial C dynamics
which in turn could affect enzyme activity. In relation to N distribution, studies have reported
lower aminopeptidase activity with N amendment but other studies found no response [114].
4.5.2.7 Activity of Peroxidase
The degradation of polyphenols (lignin, tannin and their degradation products) is an
oxidative process [114,255,256]. Two classes of enzymes, phenol oxidase (POX, eg: laccases)
and peroxidases (PER, eg: lignin peroxidase, Mn peroxidase) are well characterized, [114,257].
PER describes activity of an enzyme that uses H2O2 or secondary oxidants to degrade aromatic
compounds [114,257]. They are ubiquitous and abundant oxidative enzyme in all forms of life
[257].

162
White rot (Basidiomycetes) and soft rot (Ascomycota) fungi are best known for producing
extracellular PER [256,257]. Bacterial species belonging to actinomycetes, α- and γ-
proteobacteria are also producers of extracellular PER [256]. These bacterial and fungal species
produce oxidative enzymes and are considered as efficient degraders of lignin and humus
[114,256,257]. These organisms are most abundant in areas where plants have high lignin
concentrations [114,257]. The activities of PER within these ecosystems are shown to increase
with secondary successions [114]. Studies have also shown that at global scale, edaphic
conditions and near optimal pH (acidic range: 4.0 – 5.0) promote PER activities, even though
Basidiomycetes are relatively uncommon [114,257]. In addition, decline in PER activity has been
observed in N amended soils [114,248,257]. The present study showed similar results, where
higher PER activity were documented in unlimed and metal contaminated soils which had low
pH and lower organic N concentrations compared to limed and reference sites.
4.6 Conclusions
Liming increases soil respiration, β-glucosidase, cellobiohydrolase, β-N-
acetylglucosaminidase, aryl sulfatase, acid phosphatase, alkaline phosphatase, glycine
aminopeptidase, and leucine aminopeptidase activities. However it decreased peroxidase activity.
An opposite trend was observed with metal contamination that decreases soil respiration and
enzymatic activities with the exception of peroxidase.
4.7 Acknowledgements
We would like to thank the Natural Sciences and Engineering Research Council of Canada
(NSERC), Vale and Sudbury Nickel Operations (Glencore Limited) for their financial support.

163
CHAPTER 5: GENERAL CONLUSIONS

164
The present study aimed at analyzing soil biogeochemical properties within the GSR in
metal contaminated and reclaimed sites. Chemical analysis revealed that concentrations of total
metals were within the OMEE (Ontario Ministry of Environment and Energy) guidelines.
Results also confirmed that only a fraction of total metals were in the bioavailable form. The pH
was low in metal contaminated soils compared to reference sites. Liming increased significantly
soil pH even > 35 years after dolomitic limestone application. At low pH, many metals remain in
soluble form thereby providing a good potential for transport in the leachate soil system. In
acidic soils, several elements (Ca, Mg, and P) become deficient whereas Al and Mn are abundant
and sometimes reach toxic levels. Low pH and metal deficiency/abundance can be detrimental to
plants and affect soil microbial composition and diversity. A strong positive correlation was
observed between soil pH and CEC for all the sites.
Low CEC and SOM were observed in metal contaminated sites. PLFA and pyrosequencing
analysis revealed significantly lower levels of microbial biomass and relative abundance, in
metal contaminated sites compared to reference sites. Overall, 62% of bacterial families
identified were common to metal contaminated and the reference sites. But 11.50% were specific
to metal contaminated sites and 10.00% to the reference sites. This trend was also observed at
class and genus levels. For fungi, metal contaminated and reference sites shared 58% of the
families identified; while 6% of the families were specific to metal contaminated sites, and 10%
to reference sites. The same proportions were observed at class and genus levels.
Microbial biomass and relative abundance were significantly higher in limed sites
compared to the adjacent unlimed areas. Although several bacterial and fungal groups were
present in all the sites, 25% of bacterial genera were specific to limed sites and 16% to unlimed

165
areas. Similarly, the proportions of fungal genera specific to limed and unlimed sites were 27%
and 17%, respectively. For both bacteria and fungi, Chao1 values were higher for limed sites
compared to unlimed areas. But the number of OTUs, and the levels of Simpson and Shannon
diversity indices, and species evenness were not affected by liming.
Soil respiration and enzyme activities data for the targeted sites in the GSR provided a
frame of reference for comparing ecosystems and allowing scientistis to relate soil microbial
community function to global patterns of microbial biomass composition, pH, nutrients and
organic matter content. Detailed analyses showed that liming and metal contamination resulted
in changes in soil respiration and enzyme activities. Liming increased soil respiration and
activities of β-glucosidase, cellobiohydrolase, β-N-acetylglucosaminidase, aryl sulfatase, acid
phosphatase, alakaline phosphatase, glycine aminopeptidase, and leucine aminopeptidase. But it
decreased significantly peroxidase activities. An opposite trend was observed for soils from
metal contaminated sites where a decrease in soil respiration and enzymatic activities were
observed with the exception of peroxidase activties.
Overall, results of the present study demonstrate that long-term exposure to metals reduce
microbial biomass and relative abundance but had no effect on microbial diversity. Similarly,
soil liming increased the amount of microbial biomass but had limited effect on bacterial and
fungal diversities. Soil respiration and enzyme activities showed different ranges of variation and
distribution in relation to ecosystem variables. We found that organic matter, pH, and CEC are
key factors involved in changes in microbial communities.
Future studies will involve PLFA and pyrosequencing analyses of microbial communities
from reclaimed and unreclaimed tailings developed by Cu and Ni mining companies in the GSR.

166
Such studies will determine if treatments of tailings that are highly contaminated with metals can
result in sustainable ecosystems.

167
REFERENCES
1. Raymaker J, Durrani I. Empowering climate-change strategies with Bernard Lonergan’s
method. Lanham, Maryland, USA: University Press of America; 2015.
2. Weil R, Brady N. The Nature and Properties of Soils. 15th
ed. USA: Pearson Education;
2015.
3. Herrick JE, T. Hefin Jones. Soil Ecology and Ecosystem Services. Wall DH, Bardgett RD,
Behan-Pelletier V, Herrick JE, Six J, Jones TH, et al., editors. Oxford, UK: OUP Oxford;
2013.
4. Liebig M. Soil health: Perceptions of the past, directions for the future. United States
Department of Agriculture (USDA); 2001.
5. Slavich P. Soil health: the foundation of sustainable agriculture - 2001 workshop
proceedings.
6. Hohl H, Varma A. Soil: The Living Matrix. In: Irena Sherameti, Ajit Varma, editors. Soil
Heavy Metals. Germany: Springer Berlin Heidelberg; 2010. pp. 1–18.
7. Haynes R, editor. The Canadian System of Soil Classification. 3rd ed. Ottawa, Ontario,
Canada: NRC Research Press; 1998.
8. Weinert N, Meincke R, Schloter M, Berg G, Smalla K. Effects of Genetically Modified
Plants on Soil Microorganisms. In: Mitchell R, Gu J-D, editors. Environmental
Microbiology. 2nd ed. Hoboken, NJ, USA: John Wiley & Sons, Inc.; 2010. pp. 235–258.
9. Sherameti I, Varma A. Heavy metal contamination of soils: monitoring and remediation.
New York, USA: Springer; 2015.
10. Fontes MPF, Alleoni LRF. Electrochemical attributes and availability of nutrients, toxic
elements, and heavy metals in tropical soils. Sci Agric. Scientia Agricola; 2006;63: 589–
608.
11. Kibblewhite MG, Ritz K, Swift MJ. Soil health in agricultural systems. Philos Trans R
Soc Lond B Biol Sci. The Royal Society; 2008;363: 685–701.
12. Moreira A, Fageria NK. Soil chemical attributes of Amazonas State, Brazil. Commun Soil
Sci Plant Anal. 2009;40: 2912–2925.
13. Smith JL, Doran JW. Measurement and use of pH and electrical conductivity for soil
quality analysis. In: Doran JW, Jones AJ, editors. Methods for Assessing Soil Quality,
SSSA Spec Publ 49. Madison, Wisconsin, USA: Soil Science Society of America; 1996.
pp. 169–185.

168
14. Peng Y-L, Gao Z-W, Gao Y, Liu G-F, Sheng L-X, Wang D-L. Eco-physiological
Characteristics of Alfalfa Seedlings in Response to Various Mixed Salt-alkaline Stresses. J
Integr Plant Biol. Blackwell Publishing Asia; 2008;50: 29–39.
15. Winterhalder K. Environmental degradation and rehabilitation of the landscape around
Sudbury, a major mining and smelting area. Environ Rev. NRC Research Press Ottawa,
Canada; 1996;4: 185–224.
16. Bush EJ, Barrett SC. Genetics of mine invasions by Deschampsia cespitosa (Poaceae).
Can J Bot. 1993;71: 1336–1348.
17. Watmough SA, Hutchinson TC. Metal resistance in red maple (Acer rubrum) callus
cultures from mine and smelter sites in Canada. Can J For Res. 1997;27: 693–700.
18. Falkowski P. The inco stack-engineering triumph or biological disaster. Steel Labor.
1973;38: 1–58.
19. Deck A. RAPD variation within and among natural populations of Deschampsia cespitosa
in Northern Ontario. M.Sc Thesis, Department of Biology. Laurentian University. 2000.
20. Cox RM, Hutchinson TC. Multiple metal tolerances in the grass Deschampsia cespitosa
(L.) Beauv. from the sudbury smelting area. New Phytol. 1980;84: 631–647.
21. Gunn J, Keller W, Negusanti J, Potvin R, Beckett P, Winterhalder K. Ecosystem recovery
after emission reductions: Sudbury, Canada. Water Air Soil Pollut. 1995;85: 1783–1788.
22. Nieboer E, Ahmed HM, Puckett KJ, Richardson DHS. Heavy Metal Content of Lichens in
Relation to Distance from a Nickel Smelter in Sudbury, Ontario. Lichenol. 1972;5: 292.
23. Gorham E, Gordon AG. The influence of smelter fumes upon the chemical composition of
lake waters near Sudbury, Ontario, and upon the surrounding vegetation. Can J Bot.
1960;38: 477–487.
24. Gunn JM, Beckett PJ, Lautenback WE, Monet S. Sudbury, Canada: From pollution record
holder to award winning restoration site. In: Robert L. France, editor. Handbook of
Regenerative Landscape Design. CRC Press; 2007. pp. 381–405.
25. Nkongolo KK, Spiers G, Beckett P, Narendrula R, Theriault G, Tran A, et al. Long-term
effects of liming on soil chemistry in stable and eroded upland areas in a mining region.
Water Air Soil Pollut. 2013;224: 1–14.
26. Nkongolo KK, Michael P, Theriault G, Narendrula R, Castilloux P, Kalubi KN, et al.
Assessing biological impacts of land reclamation in a mining region in Canada: Effects of
dolomitic lime applications on forest ecosystems and microbial phospholipid fatty acid
signatures. Water, Air, Soil Pollut. 2016;227: 1–13.
27. Freedman B, Hutchinson TC. Pollutant inputs from the atmosphere and accumulations in

169
soils and vegetation near a nickel–copper smelter at Sudbury, Ontario, Canada. Can J Bot.
NRC Research Press Ottawa, Canada; 1980;58: 108–132.
28. Narendrula R, Nkongolo KK, Beckett P, Spiers G. Total and bioavailable metals in two
contrasting mining regions (Sudbury in Canada and Lubumbashi in DR-Congo): relation
to genetic variation in plant populations. Chem Ecol. 2013;29: 111–127.
29. Dudka S, Poncehernandez R, Hutchinson T. Current level of total element concentrations
in the surface layer of Sudbury’s soils. Sci Total Environ. Elsevier; 1995;162: 161–171.
30. Hall JL. Cellular mechanisms for heavy metal detoxification and tolerance. J Exp Bot.
Oxford University Press; 2002;53: 1–11.
31. Pennanen T, Fritze H, Vanhala P, Kiikkilä O. Structure of a microbial community in soil
after prolonged addition of low levels of simulated acid rain. 1998;64: 2173–2180.
32. Ontario Ministry of the Environment. Metals in soil and vegetation in the Sudbury area
(survey 2000 and additional historic data). Report No. SDB-045-3511-2001. Ministry of
the Environment. 2001.
33. Anand M, Ma K-M, Okonski A, Levin S, McCreath D. Characterising biocomplexity and
soil microbial dynamics along a smelter-damaged landscape gradient. Sci Total Environ.
2003;311: 247–259.
34. Goupil K, Nkongolo K. Assessing soil respiration as an indicator of soil microbial activity
in reclaimed metal contaminted lands. Am J Environ Sci. Science Publications; 2014;10:
403–411.
35. Goupil K, Nkongolo KK, Nasserulla S. Characterization of fungal communities in limed
and unlimed lands contaminated with metals: phospholipid fatty acid (PLFA) analysis and
soil respiration. Am J Biochem Biotechnol. Science Publications; 2015;11: 45–56.
36. Pennanen T, Frostegard A, Fritze H, Baath E. Phospholipid fatty acid composition and
heavy metal tolerance of soil microbial communities along two heavy metal-polluted
gradients in coniferous forests. Appl Environ Microbiol. 1996;62: 420–428.
37. Lautenbach WE, Miller J, Beckett PJ, Negusanti JJ, Winterhalder K. Municipal land
restoration program: The regreening process. In: Gunn J, editor. Restoration and recovery
of an industiral region. New York, USA: Springer-Verlag; 1995. pp. 109–122.
38. Narendrula R, Nkongolo KK, Beckett P. Comparative soil metal analyses in Sudbury
(Ontario, Canada) and Lubumbashi (Katanga, DR-Congo). Bull Environ Contam Toxicol.
2012;88: 187–192.
39. Bakina LG, Chugunova M V, Zaitseva TB, Nebol’sina ZP. The effect of liming on the
complex of soil microorganisms and the humus status of a soddy-podzolic soil in a long-
term experiment. Eurasian Soil Sci. 2014;47: 110–118.

170
40. Narendrula R, Nkongolo KK. Fatty Acids Profile of Microbial Populations in a Mining
Reclaimed Region Contaminated with Metals: Relation with Ecological Characteristics
and Soil Respiration. J Bioremediation Biodegrad. 2015;6: 1–9.
41. Nkongolo K, Mehes M, Deck A, Michael P. Metal content in soil and genetic variation in
Deschampsia cespitosa populations from Northern Ontario (Canada): application of ISSR
markers. Eur J Genet Toxicol. 2007; 1–38.
42. Nkongolo KK, Gervais S, Michael P, Zhou Y. Comprative analysis of inter simple
sequence repeats and simple sequence repeats markers: Genetic analysis of Deschapsia
cespitosa populations growing in metal contaminated regions in Canada. Am J Biochem
Biotechnol. 2014;10: 69–80.
43. Vandeligt KK, Nkongolo KK, Mehes M, Beckett P. Genetic analysis of Pinus banksiana
and Pinus resinosa populations from stressed sites contaminated with metals in Northern
Ontario (Canada). Chem Ecol. Taylor & Francis; 2011;27: 369–380.
44. Nkongolo KK, Narendrula R, Mehes-Smith M, Dobrzeniecka S, Vandeligt K, Ranger M,
et al. Genetic sustainability of fragmented conifer populations from stressed areas in
Northern Ontario (Canada): Application of molecular markers. In: Juan AB, editor. Forest
Ecosystems - More than Just Trees. InTech; 2012. pp. 315–356.
45. Tran A, Nkongolo KK, Mehes-Smith M, Narendrula R, Spiers G, Beckett P. Heavy metal
analysis in Red Oak (Quercus rubra) populations from a mining region in Northern
Ontario (Canada): Effect of soil liming and analysis of genetic variation. Am J Environ
Sci. 2014;10: 363–373.
46. Kalubi KN, Mehes-Smith M, Narendrula R, Michael P, Omri A. Molecular analysis of red
maple (Acer rubrum) populations from a reclaimed mining region in Northern Ontario
(Canada): soil metal accumulation and translocation in plants. Ecotoxicology. 2015;24:
636–47.
47. Theriault G, Nkongolo KK, Narendrula R, Beckett P. Molecular and ecological
characterisation of plant populations from limed and metal-contaminated sites in Northern
Ontario (Canada): ISSR analysis of white birch (Betula papyrifera) populations. Chem
Ecol. 2013;29: 573–585.
48. Iskandar IK. Environmental restoration of metals-contaminated soils. Boca Raton, Florida,
USA: Lewis Publishers; 2001.
49. He Z, Shentu, Yang X, Baligar, Zhang T, Stoffella &. Heavy metal contamination of soils:
Sources, indicators, and assessment. J Environ Indic. 2015;9: 17–18.
50. Kamal S, Prasad R, Varma A. Soil microbial diversity in relation to heavy metals. In:
Sherameti I, Varma A, editors. Soil heavy metals. New York, USA: Springer Berlin
Heidelberg; 2010. pp. 31–63.

171
51. Ahmad I, Hayat S, Pichtel J. Heavy metal contamination of soil: problems and remedies.
Enfield, New Hampshire, USA: Science Publisher; 2005.
52. Ahmad I, Hayat S, Ahmad A, Inam A, Samiullah I. Effect of heavy metal on survival of
certain groups of indigenous soil microbial population. J Appl Sci Environ Manag.
2005;9: 115–121.
53. Dixon RK, Buschena CA. Response of ectomycorrhizal Pinus banksiana and Picea glauca
to heavy metals in soil. Plant Soil. 1988;105: 265–271.
54. Burton KW, Morgan E, Roig A. The influence of heavy metals upon the growth of sitka-
spruce in South Wales forests. Plant Soil. 1983;73: 327–336.
55. Mehrotra VS. Mycorrhiza: Role and applications. New Delhi, India: Allied Publishers;
2005.
56. Hughes MN, Poole RK. Metals and Microorganisms. London, UK: Chapman and Hall;
1989.
57. Emamverdian A, Ding Y, Mokhberdoran F, Xie Y. Heavy metal stress and some
mechanisms of plant defense response. Sci World J. 2015; 1–18.
58. Saraswat S, Rai JPN. Mechanism of metal tolerance and detoxification in mycorrhizal
fungi. In: Khan MS, Zaidi A, Goel R, Musarrat J, editors. Biomanagement of Metal-
contaminated Soils. Springer Netherlands; 2011. pp. 225–240.
59. Knasmüller S, Gottmann E, Steinkellner H, Fomin A, Pickl C, Paschke A, et al. Detection
of genotoxic effects of heavy metal contaminated soils with plant bioassays. Mutat Res
Toxicol Environ Mutagen. 1998;420: 37–48.
60. Rajapaksha RMCP, Bååth E, Ba E. Metal toxicity affects fungal and bacterial activities in
soil differently metal toxicity affects fungal and bacterial activities in soil differently.
Appl Environ Microbiol. 2004;70: 2966–2973.
61. Mühlbachová G, Tlustoš P. Effects of liming on the microbial biomass and its activities in
soils long-term contaminated by toxic elements. Plant, Soil Environ. 2006;52: 345–352.
62. Mitchell R, Gu J-D. Environmental microbiology. Hoboken, NJ, USA: John Wiley &
Sons, Inc.; 2009.
63. Bellion M, Courbot M, Jacob C, Blaudez D, Chalot M. Extracellular and cellular
mechanisms sustaining metal tolerance in ectomycorrhizal fungi. FEMS Microbiol Lett.
2006;254.
64. Jentschke G, Godbold DL. Metal toxicity and ectomycorrhizas. Physiol Plant. 2000;109:
107–116.
172
65. Karelová E, Harichová J, Stojnev T, Pangallo D, Ferianc P. The isolation of heavy-metal
resistant culturable bacteria and resistance determinants from a heavy-metal-contaminated
site. Biologia (Bratisl). 2011;66: 18–26.
66. Ramesh G, Podila GK, Gay G, Marmeisse R, Reddy MS. Different patterns of regulation
for the copper and cadmium metallothioneins of the ectomycorrhizal fungus Hebeloma
cylindrosporum. Appl Environ Microbiol. American Society for Microbiology; 2009;75:
2266–2274.
67. Yao Z, Li J, Xie H, Yu C. Review on remediation technologies of soil contaminated by
heavy metals. Procedia Environ Sci. 2012;16: 722–729.
68. Khan FI, Husain T, Hejazi R. An overview and analysis of site remediation technologies. J
Environ Manage. 2004;71: 95–122.
69. Mulligan CN, Yong RN, Gibbs BF. An evaluation of technologies for the heavy metal
remediation of dredged sediments. J Hazard Mater. 2001;85: 145–163.
70. Wuana RA, Okieimen FE, Wuana RA, Okieimen FE. Heavy metals in contaminated soils:
A review of sources, chemistry, risks and best available strategies for remediation. ISRN
Ecol. 2011; 1–20.
71. Trakal L, Neuberg M, Tlustoš P, Száková J, Tejnecký V, Drábek O. Dolomite limestone
application as a chemical immobilization of metal-contaminated soil. Plant, Soil Environ.
2011;57: 173–179.
72. Basta NT, McGowen SL. Evaluation of chemical immobilization treatments for reducing
heavy metal transport in a smelter-contaminated soil. Environ Pollut. 2004;127: 73–82.
73. Meda AR, Pavan MA, Cassiolato ME, Miyazawa M. Dolomite lime’s reaction applied on
the surface of a sandy soil of the Northwest Paraná, Brazil. Brazilian Arch Biol Technol.
2002;45: 219–222.
74. Huber C, Weis W, Göttlein A. Tree nutrition of Norway spruce as modified by liming and
experimental acidification at the Höglwald site, Germany, from 1982 to 2004. Ann For
Sci. 2006;63: 861–869.
75. Prasad MN V. Heavy metal stress in plants: From biomolecules to ecosystems. 2nd ed.
New York, USA: Springer Berlin Heidelberg; 2004.
76. Dixit R, Wasiullah, Malaviya D, Pandiyan K, Singh UB, Sahu A, et al. Bioremediation of
heavy metals from soil and aquatic environment: An overview of principles and criteria of
fundamental processes. Sustain. 2015;7: 2189–2212.
77. Khan MS, Zaidi A, Wani PA, Oves M. Role of Plant Growth Promoting Rhizobacteria in
the Remediation of Metal Contaminated Soils: A Review. In: Lichtfouse E, editor.
Organic Farming, Pest Control and Remdiation of Soil Pollutants. New York, USA:

173
Springer Netherlands; 2009. pp. 319–350.
78. Rajendran P, Muthukrishnan J, Gunasekaran P. Microbes in heavy metal remediation
Contamination of heavy metals in the environment is a major global concern because of
their toxicity and threat to human life and environment. Indian J Exp Biol. 2003;41: 935–
944.
79. Coelho LM, Rezende HC, Coelho LM, de Sousa PAR, Melo DFO, Coelho NMM.
Bioremediation of polluted waters using microorganisms. In: Nasofumi S, editor.
Advances in bioremediation of wastewater and polluted soil. Rijeka, Croatia: InTech;
2015. pp. 1–23.
80. Maier MR, Pepper LI, Gerba PC. Environmental microbiology. 2nd ed. London, England:
Elsevier, Academic Press; 2009.
81. Roesch LFW, Fulthorpe RR, Riva A, Casella G, Hadwin AKM, Kent AD, et al.
Pyrosequencing enumerates and contrasts soil microbial diversity. ISME J. 2007;1: 283–
90.
82. Hoorman J, Islam R. Understanding soil microbes and nutrient recycling. In: Agriculture
and Natural Resources. 2007.
83. Breure AM. Soil biodiversity: Measurements, indicators, threats and soil functions.
International Conference - Soil and Compost Eco-Biology. Leon, Spain; 2004. pp. 1–14.
84. Laureto LMO, Cianciaruso MV, Samia DSM. Functional diversity: an overview of its
history and applicability. Nat Conserv. 2015;13: 112–116.
85. Kowalchuk GA, Buma DS, de Boer W, Klinkhamer PGL, van Veen JA. Effects of above-
ground plant species composition and diversity on the diversity of soil-borne
microorganisms. Antonie Van Leeuwenhoek. 2002;81: 509–520.
86. Buyer JS, Sasser M. High throughput phospholipid fatty acid analysis of soils. Appl Soil
Ecol. 2012;61: 127–130. doi:10.1016/j.apsoil.2012.06.005
87. Buyer JS, Teasdale JR, Roberts DP, Zasada IA, Maul JE. Factors affecting soil microbial
community structure in tomato cropping systems. Soil Biol Biochem. 2010;42: 831–841.
88. Hinojosa MB, García-Ruiz R, Carreira JA. Utilizing microbial community structure and
function to evaluate the health of heavy metal polluted soils. In: Irena Sherameti, Ajit
Varma, editors. Soil heavy metals. Germany: Springer Berlin Heidelberg; 2010. pp. 185–
224.
89. Bloem J, Schouten AJ, Sørensen SJ, Rutgers M, Werf A van der, Breure AM. Monitoring
and evaluating soil quality. In: Bloem J, Hopkins DW, Benedetti A, editors.
Microbiological methods for assessing soil quality. Wallingford: CABI; 2006. pp. 23–49.

174
90. Frostegard A, Baath E. The use of phospholipid fatty acid analysis to estimate bacterial
and fungal biomass in soil. Biol Fertil Soils. 1996;22: 59–65.
91. Pennanen T. Microbial communities in boreal coniferous forest humus exposed to heavy
metals and changes in soil pH—a summary of the use of phospholipid fatty acids,
Biolog® and 3H-thymidine incorporation methods in field studies. Geoderma. 2001;100:
91–126.
92. Kaur A, Chaudhary A, Kaur A, Choudhary R, Kaushik R. Phospholipid fatty acid - A
bioindicator of environment monitoring and assessment in soil ecosystem. Curr Sci.
2005;89: 1103–1112.
93. Rousk J, Bååth E, Brookes PC, Lauber CL, Lozupone C, Caporaso JG, et al. Soil bacterial
and fungal communities across a pH gradient in an arable soil. ISME J. 2010;4: 1340–51.
94. Wang FY, Hu JL, Lin XG, Qin SW, Wang JH. Arbuscular mycorrhizal fungal community
structure and diversity in response to long-term fertilization: a field case from China.
World J Microbiol Biotechnol. 2011;27: 67–74.
95. Koranda M, Kaiser C, Fuchslueger L, Kitzler B, Sessitsch A, Zechmeister-Boltenstern S,
et al. Fungal and bacterial utilization of organic substrates depends on substrate
complexity and N availability. FEMS Microbiol Ecol. 2014;87: 142–52.
96. Yu H, Gao Q, Shao Z, Ying A, Sun Y, Liu J, et al. Decreasing nitrogen fertilizer input had
little effect on microbial communities in three types of soils. PLoS One. 2016;11: 1–12.
97. Frostegard A, Tunlid A, Baath E. Phospholipid fatty acid composition, biomass, and
activity of microbial communities from two soil types experimentally exposed to different
heavy metals. Appl Environ Microbiol. 1993;59: 3605–3617.
98. Frostegård Å, Tunlid A, Bååth E. Use and misuse of PLFA measurements in soils. Soil
Biol Biochem. 2011;43: 1621–1625.
99. Li Y, Chen L, Wen H, Zhou T, Zhang T, Gao X. 454 pyrosequencing analysis of bacterial
diversity revealed by a comparative study of soils from mining subsidence and
reclamation areas. J Microbiol Biotechnol. 2014;24: 313–23.
100. Quince C, Lanzén A, Curtis TP, Davenport RJ, Hall N, Head IM, et al. Accurate
determination of microbial diversity from 454 pyrosequencing data. Nat Methods. 2009;6:
639–641.
101. Rajendhran J, Gunasekaran P. Microbial phylogeny and diversity: Small subunit
ribosomal RNA sequence analysis and beyond. Microbiol Res. 2011;166: 99–110.
102. Liu L, Li Y, Li S, Hu N, He Y, Pong R, et al. Comparison of next-generation sequencing
systems. J Biomed Biotechnol. 2012; 1–11.
175
103. Schoch CL, Seifert K a., Huhndorf S, Robert V, Spouge JL, Levesque C a., et al. Nuclear
ribosomal internal transcribed spacer (ITS) region as a universal DNA barcode marker for
Fungi. Proc Natl Acad Sci U S A. 2012;109: 6241–6246.
104. Clarridge JE. Impact of 16S rRNA gene sequence analysis for identification of bacteria on
clinical microbiology and infectious diseases. Clin Microbiol Rev. 2004;17: 840–62.
105. Teruel M, Ruíz-Ruano FJ, Marchal JA, Sánchez A, Cabrero J, Camacho JP, et al.
Disparate molecular evolution of two types of repetitive DNAs in the genome of the
grasshopper Eyprepocnemis plorans. Heredity (Edinb). 2014;112: 531–452.
106. Biswas K, Biswas R. Identification of medicinal plants using PCR- RFLP in Dasamula -
an ayurvedic drug. J Pharm Biosci. 2013;3: 94–99.
107. Shokralla S, Gibson JF, Nikbakht H, Janzen DH, Hallwachs W, Hajibabaei M. Next-
generation DNA barcoding: using next-generation sequencing to enhance and accelerate
DNA barcode capture from single specimens. Mol Ecol Resour. 2014;14: 1–10.
108. Dowd SE, Sun Y, Wolcott RD, Domingo A, Carroll JA. Bacterial tag-encoded FLX
amplicon pyrosequencing (bTEFAP) for microbiome studies: bacterial diversity in the
ileum of newly weaned Salmonella-infected pigs. Foodborne Pathog Dis. 2008;5: 459–72.
109. Acosta-Martínez V, Dowd S, Sun Y, Allen V. Tag-encoded pyrosequencing analysis of
bacterial diversity in a single soil type as affected by management and land use. Soil Biol
Biochem. 2008;40: 2762–2770.
110. Gołębiewski M, Deja-Sikora E, Cichosz M, Tretyn A, Wróbel B. 16S rDNA
pyrosequencing analysis of bacterial community in heavy metals polluted soils. Microb
Ecol. 2014;67: 635–47.
111. Lauber CL, Hamady M, Knight R, Fierer N. Pyrosequencing-based assessment of soil pH
as a predictor of soil bacterial community structure at the continental scale. Appl Environ
Microbiol. 2009;75: 5111–5120.
112. Lim YW, Kim BK, Kim C, Jung HS, Kim B-S, Lee J-H, et al. Assessment of soil fungal
communities using pyrosequencing. J Microbiol. 2010;48: 284–289.
113. Petchey OL, Gaston KJ. Functional diversity: back to basics and looking forward. Ecol
Lett. 2006;9: 741–758.
114. Sinsabaugh RL, Lauber CL, Weintraub MN, Ahmed B, Allison SD, Crenshaw C, et al.
Stoichiometry of soil enzyme activity at global scale. Ecol Lett. 2008;11: 1252–1264.
115. Ryan MG, Law BE. Interpreting, measuring, and modeling soil respiration.
Biogeochemistry. 2005;73: 3–27.
116. Davidson E., Savage K, Bolstad P, Clark D., Curtis P., Ellsworth D., et al. Belowground
176
carbon allocation in forests estimated from litterfall and IRGA-based soil respiration
measurements. Agric For Meteorol. 2002;113: 39–51.
117. Shukla G, Varma A. Soil Enzymology. Berlin, Heidelberg: Springer; 2011.
118. Yiqi L, Zhou X. Soil respiration and the environment. San Diego, California, USA:
Elsevier Science; 2010.
119. Sulzman EW, Brant JB, Bowden RD, Lajtha K. Contribution of aboveground litter,
belowground litter, and rhizosphere respiration to total soil CO2 efflux in an old growth
coniferous forest. Biogeochemistry. 2005;73: 231–256.
120. González-Pérez JA, González-Vila FJ, Almendros G, Knicker H. The effect of fire on soil
organic matter - A review. Environ Int. 2004;30: 855–870.
121. Ma M. Species richness vs evenness: independent relationship and different responses to
edaphic factors. Oikos. 2005;111: 192–198.
122. Evanylo G. Agricultural management practices and soil quality: Measuring, assessing, and
comparing laboratory and field test kit indicators of soil quality attributes. In: Virginia
State University. 2009.
123. Stres B, Danevcic T, Pal L, Fuka MM, Resman L, Leskovec S, et al. Influence of
temperature and soil water content on bacterial, archaeal and denitrifying microbial
communities in drained fen grassland soil microcosms. FEMS Microbiol Ecol. 2008;66:
110–122.
124. Cook FJ, Orchard VA. Relationships between soil respiration and soil moisture. Soil Biol
Biochem. 2008;40: 1013–1018.
125. Anderson OR. Soil respiration, climate change and the role of microbial communities.
Protist. 2011;162: 679–690.
126. Raich JW, Schlesinger WH. The global carbon dioxide flux in soil respiration and its
relationship to vegetation and climate. Tellus B. Munksgaard International Publishers;
1992;44: 81–99. Available: http://www.tellusb.net/index.php/tellusb/article/view/15428
127. Coleman DC. Compartmental analysis of total soil respiration: An exploratory study.
Oikos. 1973;24: 361.
128. Edwards NT, Sollins P. Continuous measurement of carbon dioxide evolution from
partitioned forest floor components. Ecology. 1973;54: 406–412.
129. Garrett HE, Cox GS. Carbon dioxide evolution from the floor of an Oak-Hickory forests.
Soil Sci Soc Am J. 1973;37: 641.
130. Nielsen MN, Winding A, Binnerup S, Munk B, Niels H, Hendriksen B, et al.

177
Microorganisms as indicators of soil health. NERI technical report no. 388. Denmark;
2002.
131. Seyboldc. Soil Quality Test Kit Guide. United States Dep Agric. 1999; 1–88.
132. Riggs CE, Hobbie SE, Bach EM, Hofmockel KS, Kazanski CE. Nitrogen addition
changes grassland soil organic matter decomposition. Biogeochemistry. 2015;125: 203–
219.
133. Yang Y, Campbell CD, Clark L, Cameron CM, Paterson E. Microbial indicators of heavy
metal contamination in urban and rural soils. Chemosphere. 2006;63: 1942–1952.
134. Landi L, Renella G, Moreno JL, Falchini L, Nannipieri P. Influence of cadmium on the
metabolic quotient, l-:D -glutamic acid respiration ratio and enzyme activity:microbial
biomass ratio under laboratory conditions. Biol Fertil Soils. 2000;32: 8–16.
doi:10.1007/s003740000205
135. Bardgett RD, Saggar S. Effects of heavy metal contamination on the short-term
decomposition of labelled [14C] glucose in a pasture soil. Soil Biol Biochem. 1994;26:
727–733.
136. Fliebach A, Martens R, Reber HH. Soil microbial biomass and microbial activity in soils
treated with heavy metal contaminated sewage sludge. Soil Biol Biochem. 1994;26: 1201–
1205.
137. Doran J, Kettler T, Tsivou M. Field and Laboratory Solvita Soil Test Evaluation. Lincoln,
USA; 1997.
138. Solvita. Official solvita guideline soil CO2 respiration test. Mt Vernon, USA: Woods End
Laboratories Inc.; 2013.
139. Khan S, Cao Q, Hesham AE-L, Xia Y, He J-Z. Soil enzymatic activities and microbial
community structure with different application rates of Cd and Pb. J Environ Sci. 2007;19:
834–840.
140. Karaca A, Cetin SC, Turgay OC, Kizilkaya R. Effects of Heavy Metals on Soil Enzyme
Activities. In: Sherameti I, Varma A, editors. Soil Heavy Metals. Berlin, Heidelberg:
Springer Berlin Heidelberg; 2010. pp. 237–262. doi:10.1007/978-3-642-02436-8_11
141. Karaca A, Cetin SC, Turgay OC, Kizilkaya R. Effects of heavy metals on soil enzyme
activities. In: Sherameti I, Varma A, editors. Soil heavy metals. Berlin, Heidelberg:
Springer Berlin Heidelberg; 2010. pp. 237–262.
142. Liu Q, Qiao N, Xu X, Xin X, Han JY, Tian Y, et al. Nitrogen acquisition by plants and
microorganisms in a temperate grassland. Sci Rep. Nature Publishing Group; 2016;6:
22642. doi:10.1038/srep22642

178
143. Bardgett RD, Bowman WD, Kaufmann R, Schmidt SK. A temporal approach to linking
aboveground and belowground ecology. Trends Ecol Evol. 2005;20: 634–641.
144. Richardson AE, Barea J-M, McNeill AM, Prigent-Combaret C. Acquisition of phosphorus
and nitrogen in the rhizosphere and plant growth promotion by microorganisms. Plant
Soil. Springer Netherlands; 2009;321: 305–339.
145. Kertesz MA, Mirleau P. The role of soil microbes in plant sulphur nutrition. J Exp Bot.
2004;55: 1939–45.
146. Gahan J, Schmalenberger A. The role of bacteria and mycorrhiza in plant sulfur supply.
Front Plant Sci. Frontiers Media SA; 2014;5: 723.
147. Burns RG. Soil enzymology. Sci Prog. 1977;64: 275–285.
148. Belyaeva ON, Haynes RJ, Birukova OA. Barley yield and soil microbial and enzyme
activities as affected by contamination of two soils with lead, zinc or copper. Biol Fertil
Soils. 2005;41: 85–94.
149. Lorenz N, Hintemann T, Kramarewa T, Katayama A, Yasuta T, Marschner P, et al.
Response of microbial activity and microbial community composition in soils to long-
term arsenic and cadmium exposure. Soil Biol Biochem. 2006;38: 1430–1437.
150. Hagmann DF, Goodey NM, Mathieu C, Evans J, Aronson MFJ, Gallagher F, et al. Effect
of metal contamination on microbial enzymatic activity in soil. Soil Biol Biochem.
Elsevier Ltd; 2015;91: 291–297. Available:
http://dx.doi.org/10.1016/j.soilbio.2015.09.012
151. Effron D, de la Horra AM, Defrieri RL, Fontanive V, Palma RM. Effect of Cadmium,
Copper, and Lead on Different Enzyme Activities in a Native Forest Soil. Commun Soil
Sci Plant Anal. Taylor & Francis Group ; 2004;35: 1309–1321. doi:10.1081/CSS-
120037548
152. Schloss PD, Handelsman J. Status of the microbial census. Microbiol Mol Biol Rev.
American Society for Microbiology; 2004;68: 686–691. doi:10.1128/MMBR.68.4.686-
691.2004
153. O’Brien HE, Parrent JL, Jackson JA, Moncalvo J-M, Vilgalys R. Fungal community
analysis by large-scale sequencing of environmental samples. Appl Environ Microbiol.
2005;71: 5544–50. doi:10.1128/AEM.71.9.5544-5550.2005
154. Oliveira A, Pampulha ME. Effects of long-term heavy metal contamination on soil
microbial characteristics. J Biosci Bioeng. 2006;102: 157–161. doi:10.1263/jbb.102.157
155. Lewin A, Wentzel A, Valla S. Metagenomics of microbial life in extreme temperature
environments. Curr Opin Biotechnol. 2013;24: 516–525.

179
156. Amiro BD, Courtin GM. Patterns of vegetation in the vicinity of an industrially disturbed
ecosystem, Sudbury, Ontario. Can J Bot. NRC Research Press Ottawa, Canada ; 1981;59:
1623–1639. doi:10.1139/b81-221
157. Guo Z, Megharaj M, Beer M, Ming H, Mahmudur Rahman M, Wu W, et al. Heavy metal
impact on bacterial biomass based on DNA analyses and uptake by wild plants in the
abandoned copper mine soils. Bioresour Technol. Elsevier Ltd; 2009;100: 3831–3836.
doi:10.1016/j.biortech.2009.02.043
158. Liao M, Chen C, Huang C. Effect of heavy metals on soil microbial activity and diversity
in a reclaimed mining wasteland of red soil area. J Environ Sci (China). 2005;17: 832–7.
Available: http://www.ncbi.nlm.nih.gov/pubmed/16313013
159. Hu Q, Qi H, Zeng J, Zhang H. Bacterial diversity in soils around a lead and zinc mine. J
Environ Sci (China). 2007;19: 74–9. Available:
http://www.ncbi.nlm.nih.gov/pubmed/17913157
160. Khan S, El-Latif Hesham A, Qiao M, Rehman S, He J-Z. Effects of Cd and Pb on soil
microbial community structure and activities. Environ Sci Pollut Res. Springer-Verlag;
2010;17: 288–296. doi:10.1007/s11356-009-0134-4
161. Sobolev D, Begonia MFT. Effects of heavy metal contamination upon soil microbes: lead-
induced changes in general and denitrifying microbial communities as evidenced by
molecular markers. Int J Environ Res Public Health. 2008;5: 450–6. Available:
http://www.ncbi.nlm.nih.gov/pubmed/19151442
162. Chodak M, Gołębiewski M, Morawska-Płoskonka J, Kuduk K, Niklińska M. Diversity of
microorganisms from forest soils differently polluted with heavy metals. Appl Soil Ecol.
2013;64: 7–14. doi:10.1016/j.apsoil.2012.11.004
163. Brown K. Hydrological response of Junction Creek, Sudbury Ontario, to rainfall events,
fall 2005. Laurentian University. 2006.
164. Time, Date. Time and Date: Weather in Greater Sudbury, Ontario, Canada. [Internet].
1995 [cited 10 Jul 2015]. Available:
http://www.timeanddate.com/worldclock/canada/greater-sudbury
165. Weather Spark beta: Historical weather for the last twelve months in Greater Sudbury,
Ontario, Canada [Internet]. 2015 [cited 10 Jul 2015]. Available:
https://weatherspark.com/averages/28361/Greater-Sudbury-Ontario-Canada
166. Carter M. Soil Sampling and Methods of Analysis. Canadian Society of Soil Science.
Boca Raton, Florida, USA: Lewis Publishers; 1993.
167. Lavkulich L. Methods manual Pedology Laboratory, Department of Soil Science.
Vancouver, British Colombia; 1981.

180
168. Hendershot W, Lalande H, Daquette H. Ion exchange and exchangeable cations. In: Carter
M, Gregorich E, editors. Soil Sampling and Methods of Analysis. 2nd ed. Boca Raton,
Florida, USA: CRC Press; 2007. pp. 197–206.
169. Moore G, Dolling P, Porter B, Leonard L. Soil Acidity. In: Moore G, editor. Soil guide: A
handbook for understanding and managing agricultural soils Agriculture Western
Australia Bulletin No4343. Lamb Print; 1998. pp. 127–140.
170. Wang Q, Li Y, Klassen W. Determination of cation exchange capacity on low to highly
calcareous soils. Commun Soil Sci Plant Anal. 2005;36: 1479–1498. doi:10.1081/CSS-
200058493
171. Adeniyan ON, Ojo AO, Akinbode OA, Adediran JA. Comparative study of different
organic manures and NPK fertilizer for improvement of soil chemical properties and dry
matter yield of maize in two different soils. J Soil Sci Environ Manag. 2011;2: 9–13.
172. Tomasic M, Zgorelec Z, Jurisic A, Kisic I. Cation exchange capacity of dominant soil
types in the republic of croatia. J Cent Eur Agric. 2013;14: 937–951.
doi:10.5513/JCEA01/14.3.1286
173. Baath E, Diaz-Ravina M, Bakken LR. Microbial biomass, community structure and metal
tolerance of a naturally Pb-enriched forest soil. Microb Ecol. 2005;50: 496–505.
doi:10.1007/s00248-005-0008-3
174. Shentu J, He Z, Yang X, Li T. Microbial activity and community diversity in a variable
charge soil as affected by cadmium exposure levels and time. J Zhejiang Univ Sci B.
2008;9: 250–260. doi:10.1631/jzus.B0710630
175. Hiroki M. Effects of heavy metal contamination on soil microbial population. Soil Sci
Plant Nutr. 1992;38: 141–147. doi:10.1080/00380768.1992.10416961
176. Azarbad H, Niklińska M, Laskowski R, van Straalen NM, van Gestel CAM, Zhou J, et al.
Microbial community composition and functions are resilient to metal pollution along two
forest soil gradients. FEMS Microbiol Ecol. 2015;91: 1–11. doi:10.1093/femsec/fiu003
177. Quaiser A, Ochsenreiter T, Lanz C, Schuster SC, Treusch AH, Eck J, et al. Acidobacteria
form a coherent but highly diverse group within the bacterial domain: evidence from
environmental genomics. Mol Microbiol. 2003;50: 563–75. Available:
http://www.ncbi.nlm.nih.gov/pubmed/14617179
178. Barns SM, Cain EC, Sommerville L, Kuske CR. Acidobacteria phylum sequences in
uranium-contaminated subsurface sediments greatly expand the known diversity within
the phylum. Appl Environ Microbiol. 2007;73: 3113–3116. doi:10.1128/AEM.02012-06
179. Pereira LB, Vicentini R, Ottoboni LMM. Changes in the bacterial community of soil from
a neutral mine drainage channel. PLoS One. Public Library of Science; 2014;9: 1–10.
Available: http://dx.doi.org/10.1371%2Fjournal.pone.0096605
181
180. Nordlund S, Ludden PW. Post-translational regulation of nitrogenase in photosynthetic
bacteria. In: Klipp W, Masepohl B, Gallon JR, Newton WE, editors. Genetics and
regulation of nitrogen fixation in free-living bacteria. Netherlands: Kluwer Academic
Publishers; 2004. pp. 175–196.
181. Legg TM, Zheng Y, Simone B, Radloff KA, Mladenov N, González A, et al. Carbon,
metals, and grain size correlate with bacterial community structure in sediments of a high
arsenic aquifer. Front Microbiol. 2012;3: 82. doi:10.3389/fmicb.2012.00082
182. Chatterjee SK, Bhattacharjee I, Chandra G. Biosorption of heavy metals from industrial
waste water by Geobacillus thermodenitrificans. J Hazard Mater. 2010;175: 117–125.
doi:10.1016/j.jhazmat.2009.09.136
183. Rosenzweig N, Bradeen JM, Tu ZJ, McKay SJ, Kinkel LL. Rhizosphere bacterial
communities associated with long-lived perennial prairie plants vary in diversity,
composition, and structure. Can J Microbiol. NRC Research Press; 2013;59: 494–502.
doi:10.1139/cjm-2012-0661
184. Sorokin DY, Tourova TP, Kolganova T V, Sjollema KA, Kuenen JG. Thioalkalispira
microaerophila gen. nov., sp. nov., a novel lithoautotrophic, sulfur-oxidizing bacterium
from a soda lake. Int J Syst Evol Microbiol. 2002;52: 2175–82. doi:10.1099/00207713-52-
6-2175
185. Sorokin DY, Kuenen JG, Muyzer G. The microbial sulfur cycle at extremely haloalkaline
conditions of soda lakes. Front Microbiol. 2011;2: 44. doi:10.3389/fmicb.2011.00044
186. Azevedo MM, Cássio F. Effects of metals on growth and sporulation of aquatic fungi.
Drug Chem Toxicol. 2010;33: 269–78. doi:10.3109/01480540903431440
187. Chiapello M, Martino E, Perotto S. Common and metal-specific proteomic responses to
cadmium and zinc in the metal tolerant ericoid mycorrhizal fungus Oidiodendron maius
Zn. Metallomics. 2015;7: 805–15. doi:10.1039/c5mt00024f
188. Tkaczuk C. The effect of selected heavy metal ions on the growth and conidial
germination of the aphid pathogenic fungus Pandora neoaphidis (Remaudiere et
Hennebert) humber. Polish J Environ Stud. 2005;14: 897–902.
189. Carris L, Little C, Stiles C. Introduction to Fungi. The Plant Health Instructor. In: The
American Phytopathological Society. 2012. doi:10.1094/PHI-I-2012-0426-01
190. Alemu F. Assessment of wild mushrooms and wood decaying fungi in Dilla University,
main campus, Ethiopia. Int J Adv Res. 2013;1: 458–467.
191. James T, O’Donnell K. Zygomycota. Microscopic “Pin” or “Sugar” Molds. In: The Tree
of Life Web Project [Internet]. 2004 [cited 25 Feb 2016]. Available:
http://tolweb.org/Zygomycota/20518/2007.07.13

182
192. Walker C, Vestberg M, Demircik F, Stockinger H, Saito M, Sawaki H, et al. Molecular
phylogeny and new taxa in the Archaeosporales (Glomeromycota): Ambispora fennica
gen. sp. nov., Ambisporaceae fam. nov., and emendation of Archaeospora and
Archaeosporaceae. Mycol Res. 2007;111: 137–153. doi:10.1016/j.mycres.2006.11.008
193. Hibbett DS. A phylogenetic overview of the Agaricomycotina. Mycol . 2006;98: 917–925.
doi:10.3852/mycologia.98.6.917
194. Spatafora JW, Owensby CA, Douhan GW, Boehm EWA, Schoch CL. Phylogenetic
placement of the ectomycorrhizal genus Cenococcum in Gloniaceae (Dothideomycetes).
Mycologia. 2012;104: 758–65. doi:10.3852/11-233
195. Johnston PR, Seifert KA, Stone JK, Rossman AY, Marvanová L. Recommendations on
generic names competing for use in Leotiomycetes (Ascomycota). IMA Fungus. 2014;5:
91–120. doi:10.5598/imafungus.2014.05.01.11
196. Rice A V, Currah RS. New perspectives on the niche and holomorph of the myxotrichoid
hyphomycete, Oidiodendron maius. Mycol Res. 2002;106: 1463–1467.
197. Valix M, Loon L. Adaptive tolerance behaviour of fungi in heavy metals. Miner Eng.
2003;16: 193–198. doi:10.1016/S0892-6875(03)00004-9
198. Edgar RC. UPARSE: highly accurate OTU sequences from microbial amplicon reads. Nat
Methods. 2013;10: 996–8. doi:10.1038/nmeth.2604
199. Chao A. Nonparametric estimation of the number of classes in a population. Scand J Stat.
1984;11: 265–270.
200. Gotelli NJ. A Primer of Ecology [Internet]. 3rd ed. Palgrave; 2001. Available:
https://books.google.ca/books?id=s0rwAAAAMAAJ
201. Daniel R. The metagenomics of soil. Nat Rev Micro. 2005;3: 470–478. Available:
http://dx.doi.org/10.1038/nrmicro1160
202. Grundmann GL. Spatial scales of soil bacterial diversity--the size of a clone. FEMS
Microbiol Ecol. 2004;48: 119–27. doi:10.1016/j.femsec.2004.01.010
203. Rathnayake IVN, Megharaj M, Bolan N, Naidu R. Tolerance of heavy metals by Gram
positive soil bacteria. Int J Environ Eng. 2010;2: 191–195.
204. Sobecky PA, Coombs JM. Horizontal gene transfer in metal and radionuclide
contaminated soils. Methods Mol Biol. Georgia Institute of Technology, School of
Biology, Atlanta, GA, USA.; 2009;532: 455–472. doi:10.1007/978-1-60327-853-9_26
205. Griffiths BS, Philippot L. Insights into the resistance and resilience of the soil microbial
community. FEMS Microbiol Rev. 2013;37: 112–29. doi:10.1111/j.1574-
6976.2012.00343.x

183
206. Berg J, Brandt KK, Al-Soud WA, Holm PE, Hansen LH, Sørensen SJ, et al. Selection for
Cu-tolerant bacterial communities with altered composition, but unaltered richness, via
long-term Cu exposure. Appl Environ Microbiol. 2012;78: 7438–7446.
doi:10.1128/AEM.01071-12
207. Boschker HTS, Middelburg JJ. Stable isotopes and biomarkers in microbial ecology.
FEMS Microbiol Ecol. 2002;40: 85–95. doi:10.1111/j.1574-6941.2002.tb00940.x
208. Olsson PA. Signature fatty acids provide tools for determination of the distribution and
interactions of mycorrhizal fungi in soil. FEMS Microbiol Ecol. 1999;29: 303–310.
doi:10.1016/S0168-6496(99)00021-5
209. Ruess L, Chamberlain PM. The fat that matters: Soil food web analysis using fatty acids
and their carbon stable isotope signature. Soil Biol Biochem. Elsevier Ltd; 2010;42: 1898–
1910. doi:10.1016/j.soilbio.2010.07.020
210. Zelles L. Fatty acid patterns of phospholipids and lipopolysaccharides in the
characterisation of microbial communities in soil: a review. Biol Fertil Soils. 1999;29:
111–129. doi:10.1007/s003740050533
211. Sun Z, Li G, Wang C, Jing Y, Zhu Y, Zhang S, et al. Community dynamics of prokaryotic
and eukaryotic microbes in an estuary reservoir. Sci Rep. The Author(s); 2014;4: 6966.
Available: http://dx.doi.org/10.1038/srep06966
212. Winterhaider K. The use of manual surface seeding, liming & fertilization in the
reclamation of acid metal-contaminated land in the Sudbury, Ontario mining and smelting
region of Canada. Environ Technol Lett. 1983;4: 209–216.
doi:10.1080/09593338309384197
213. Wang Y, Shi J, Wang H, Lin Q, Chen X, Chen Y. The influence of soil heavy metals
pollution on soil microbial biomass, enzyme activity, and community composition near a
copper smelter. Ecotoxicol Environ Saf. 2007;67: 75–81.
214. Fuentes JP, Bezdicek DF, Flury M, Albrecht S, Smith JL. Microbial activity affected by
lime in a long-term no-till soil. Soil Tillage Res. 2006;88: 123–131.
215. Pawlett M, Hopkins DW, Moffett BF, Harris JA. The effect of earthworms and liming on
soil microbial communities. Biol Fertil Soils. 2009;45: 361–369. doi:10.1007/s00374-008-
0339-6
216. Dimitriu PA, Grayston SJ. Relationship between soil properties and patterns of bacterial
beta-diversity across reclaimed and natural boreal forest soils. Microb Ecol. 2010;59:
563–73. doi:10.1007/s00248-009-9590-0
217. Tate RL. Soil microbiology. New York, USA: John Wiley; 2000.
218. Beales N. Adaptation of microorganisms to cold temperatures, weak acid preservatives,

184
low pH, and osmotic stress: A review. Compr Rev Food Sci Food Saf. 2004;3: 1–20.
doi:10.1111/j.1541-4337.2004.tb00057.x
219. Curtin D, Campbell CA, Jalil A. Effects of acidity on mineralization: pH-dependence of
organic matter mineralization in weakly acidic soils. Soil Biol Biochem. 1998;30: 57–64.
doi:10.1016/S0038-0717(97)00094-1
220. Kuczynski J, Stombaugh J, Walters WA, González A, Caporaso JG, Knight R. Using
QIIME to analyze 16S rRNA gene sequences from microbial communities. Curr Protoc
Bioinformatics. NIH Public Access; 2011;Chapter 10: 1–28.
doi:10.1002/0471250953.bi1007s36
221. Fernández-Calviño D, Bååth E. Growth response of the bacterial community to pH in soils
differing in pH. FEMS Microbiol Ecol. 2010;73: 149–56. doi:10.1111/j.1574-
6941.2010.00873.x
222. Jones RT, Robeson MS, Lauber CL, Hamady M, Knight R, Fierer N. A comprehensive
survey of soil acidobacterial diversity using pyrosequencing and clone library analyses.
ISME J. 2009;3: 442–53. doi:10.1038/ismej.2008.127
223. Blasiak LC, Schmidt AW, Andriamiarinoro H, Mulaw T, Rasolomampianina R,
Applequist WL, et al. Bacterial communities in Malagasy soils with differing levels of
disturbance affecting botanical diversity. PLoS One. 2014;9: 1–11.
224. Lauber CL, Strickland MS, Bradford MA, Fierer N. The influence of soil properties on the
structure of bacterial and fungal communities across land-use types. Soil Biol Biochem.
2008;40: 2407–2415. doi:10.1016/j.soilbio.2008.05.021
225. Li H, Smith SE, Holloway RE, Zhu Y, Smith FA. Arbuscular mycorrhizal fungi contribute
to phosphorus uptake by wheat grown in a phosphorus-fixing soil even in the absence of
positive growth responses. New Phytol. 2006;172: 536–43. doi:10.1111/j.1469-
8137.2006.01846.x
226. Schmidt SK, Wilson KL, Meyer AF, Gebauer MM, King AJ. Phylogeny and
ecophysiology of opportunistic “snow molds” from a subalpine forest ecosystem. Microb
Ecol. 2008;56: 681–7. doi:10.1007/s00248-008-9387-6
227. Koleff P, Gaston KJ, Lennon JJ. Measuring beta diversity for presence-absence data. J
Anim Ecol. 2003;72: 367–382. doi:10.1046/j.1365-2656.2003.00710.x
228. Iovieno P, Morra L, Leone A, Pagano L, Alfani A. Effect of organic and mineral
fertilizers on soil respiration and enzyme activities of two Mediterranean horticultural
soils. Biol Fertil Soils. Springer-Verlag; 2009;45: 555–561. Available:
http://link.springer.com/10.1007/s00374-009-0365-z
229. Zhou Z, Jiang L, Du E, Hu H, Li Y, Chen D, et al. Temperature and substrate availability
regulate soil respiration in the tropical mountain rainforests, Hainan Island, China. J Plant

185
Ecol. Oxford University Press; 2013;6: 325–334. Available:
http://jpe.oxfordjournals.org/cgi/doi/10.1093/jpe/rtt034
230. Acosta-Martinez V, Tabatabai M. Enzyme activities in a limed agricultural soil. Biol
Fertil Soils. 2000;31: 85–91.
231. Creamer RE, Bellamy P, Black HIJ, Cameron CM, Campbell CD, Chamberlain P, et al.
An inter-laboratory comparison of multi-enzyme and multiple substrate-induced
respiration assays to assess method consistency in soil monitoring. Biol Fertil Soils.
2009;45: 623–633. Available: http://dx.doi.org/10.1007/s00374-009-0374-y
232. Dick WA, Cheng L, Wang P. Soil acid and alkaline phosphatase activity as pH adjustment
indicators. Soil Biol Biochem. 2000;32: 1915–1919.
233. HistoricalWeather. Historical Weather For 2015 in Greater Sudbury, Ontario, Canada -
WeatherSpark [Internet]. 2015 [cited 10 Jul 2015]. Available:
https://weatherspark.com/history/28361/2015/Greater-Sudbury-Ontario-Canada
234. Jingyun F, Shaohui L, Kun Z. Factors affecting soil respiration in reference with
temperatures role in global scale. Chinese Gerographical Sci. 1998;8: 246–255.
235. Marcelo A V, Cora JE, La Scala N. Influence of liming on residual soil respiration and
chemical properties in a tropical no-tillage system. Rev Bras Cienc Do Solo. 2012;36: 45–
50. Available: <Go to ISI>://WOS:000302198900005
236. Narendrula-Kotha R, Nkongolo KK. Microbial response to soil liming of damaged
ecosystems revealed by Metagenomics and Phospholipid Fatty Acid Analyses. PLoS One.
2016; In Press.
237. Caires EF, Corrêa JCL, Churka S, Barth G, Garbuio FJ. Surface application of lime
ameliorates subsoil acidity and improves root growth and yield of wheat in an acid soil
under no-till system. Sci Agric. Scientia Agricola; 2006;63: 502–509. Available:
http://www.scielo.br/scielo.php?script=sci_arttext&pid=S0103-
90162006000500013&lng=en&nrm=iso&tlng=en
238. Klimek B. Effect of long-term zinc pollution on soil microbial community resistance to
repeated contamination. Bull Environ Contam Toxicol. Springer; 2012;88: 617–22.
Available: http://www.ncbi.nlm.nih.gov/pubmed/22278405
239. Narendrula-Kotha R, Nkongolo KK. Bacterial and fungal resilience to long-term metal
exposure in a mining region revealed by metagenomics sequencing. Ecol Genet
Genomics. 2017;2: 12–24.
240. Ellert BH, Clapperton MJ, Anderson DW. An ecosystem perspective of soil quality. In:
Gregorich E, Carter M, editors. Soil quality for crop production and ecosystem health.
Amsterdam: Elsevier; 1997. pp. 115–141.

186
241. Verchot L V., Borelli T. Application of para-nitrophenol (pNP) enzyme assays in
degraded tropical soils. Soil Biol Biochem. 2005;37: 625–633.
242. Renella G, Mench M, Landi L, Nannipieri P. Microbial activity and hydrolase synthesis in
long-term Cd-contaminated soils. Soil Biol Biochem. 2005;37: 133–139.
243. Lee I-S, Kim OK, Chang Y-Y, Bae B, Kim HH, Baek KH. Heavy metal concentrations
and enzyme activities in soil from a contaminated Korean shooting range. J Biosci
Bioeng. 2002;94: 406–11. Available: http://www.ncbi.nlm.nih.gov/pubmed/16233326
244. Singhania RR, Patel AK, Sukumaran RK, Larroche C, Pandey A. Role and significance of
beta-glucosidases in the hydrolysis of cellulose for bioethanol production. Bioresour
Technol. Elsevier Ltd; 2013;127: 500–507. Available:
http://dx.doi.org/10.1016/j.biortech.2012.09.012
245. Saiya-Cork K., Sinsabaugh R., Zak D. The effects of long term nitrogen deposition on
extracellular enzyme activity in an Acer saccharum forest soil. Soil Biol Biochem.
2002;34: 1309–1315.
246. Guo P, Wang C, Jia Y, Wang Q, Han G, Tian X. Responses of soil microbial biomass and
enzymatic activities to fertilizations of mixed inorganic and organic nitrogen at a
subtropical forest in East China. Plant Soil. 2011;338: 355–366.
247. Ueno H, Miyashita K, Sawada Y, Oba Y. Assay of chitinase and N-acetylglucosaminidase
activity in forest soils with 4-methylumbelliferyl derivatives. Zeitschrift für
Pflanzenernährung und Bodenkd. WILEY‐VCH Verlag; 1991;154: 171–175. Available:
http://doi.wiley.com/10.1002/jpln.19911540304
248. Ramirez KS, Craine JM, Fierer N. Consistent effects of nitrogen amendments on soil
microbial communities and processes across biomes. Glob Chang Biol. 2012;18: 1918–
1927. Available: http://doi.wiley.com/10.1111/j.1365-2486.2012.02639.x
249. Klose S, Moore JM, Tabatabai MA. Arylsulfatase activity of microbial biomass in soils as
affected by cropping systems. Biol Fertil Soils. Springer-Verlag; 1999;29: 46–54.
Available: http://link.springer.com/10.1007/s003740050523
250. Ekenler M, Tabatabai MA. Responses of phosphatases and arylsulfatase in soils to liming
and tillage systems. J Plant Nutr Soil Sci. WILEY‐VCH Verlag; 2003;166: 281–290.
Available: http://doi.wiley.com/10.1002/jpln.200390045
251. Nannipieri P, Giagnoni L, Landi L, Renella G. Role of Phosphatase Enzymes in Soil. In:
Bünemann E, Oberson A, Frossard E, editors. Phosphorous in Action. Springer Berlin
Heidelberg; 2011. pp. 215–243. Available: http://link.springer.com/10.1007/978-3-642-
15271-9_9
252. Weintraub MN. Biological Phosphorus Cycling in Arctic and Alpine Soils. In: Bunemann
E, Oberson A, Forssard E, editors. Phosphorous in Action. Springer Berlin Heidelberg;

187
2011. pp. 295–316. Available: http://link.springer.com/10.1007/978-3-642-15271-9_12
253. Marui J, Matsushita-Morita M, Tada S, Hattori R, Suzuki S, Amano H, et al. Enzymatic
properties of the glycine D-alanine aminopeptidase of Aspergillus oryzae and its activity
profiles in liquid-cultured mycelia and solid-state rice culture (rice koji). Appl Microbiol
Biotechnol. 2012;93: 655–69. Available: http://www.ncbi.nlm.nih.gov/pubmed/22005737
254. Ito K, Ma X, Azmi N, Huang H-S, Fujii M, Yoshimoto T. Novel Aminopeptidase Specific
for Glycine from Actinomucor elegans. Biosci Biotechnol Biochem. Japan Society for
Bioscience, Biotechnology, and Agrochemistry; 2003;67: 83–88. Available:
http://www.tandfonline.com/doi/full/10.1271/bbb.67.83
255. Bünemann E, Oberson A, Frossard E, editors. Phosphorus in Action [Internet]. Berlin,
Heidelberg: Springer Berlin Heidelberg; 2011. Available:
http://link.springer.com/10.1007/978-3-642-15271-9
256. Tian L, Shi W. Soil peroxidase regulates organic matter decomposition through improving
the accessibility of reducing sugars and amino acids. Biol Fertil Soils. Springer Berlin
Heidelberg; 2014;50: 785–794. Available: http://link.springer.com/10.1007/s00374-014-
0903-1
257. Sinsabaugh RL. Phenol oxidase, peroxidase and organic matter dynamics of soil. Soil Biol
Biochem. Elsevier Ltd; 2010;42: 391–404. Available:
http://dx.doi.org/10.1016/j.soilbio.2009.10.014

188
APPENDICES

189
Table S1: Study locations and their coordinates.
Sites GPS Coordinates
Daisy Lake 2 46’27’50’N/80’53’1’W
Wahnapitae Hydro-Dam 46’28’31’N/80’49’14’W
Kelly Lake 46’26’42’N/81’3’18’W
Kingsway 46’29’54’N/80’58’14’W
Laurentian 46’28’5’N/80’58’35’W
Onaping Falls 46’35’32’N/81’23’3’W
Capreol 46’45’28’N/80’55’21’W
Killarney 46’13’12’N/80’47’43’W

190
Table S2: Site-specific bacterial groups and their relative abundance identified in metal
contaminated and reference soil samples from the GSR.
Metal contaminated sites Reference sites
1 Acidimicrobium spp. (3.67) Armatimonas spp. (13.00)
2 Acidovorax spp. (1.67) Azovibrio spp. (2.00)
3 Afipia spp. (2.67) Blastochloris viridis (3.67)
4 Anaerolinea spp. (3.00) Bosea spp. (1.00)
5 Anderseniella spp. (1.33) Caldilinea spp. (1.00)
6 Bazzania trilobata (0.33) Candidatus entotheonella spp. (21.00)
7 Blastomonas spp. (3.66) Candidates xiphinematobacter spp. (10.67)
8 Burkholderia caryophylli (0.67) Chelatococcus spp. (6.67)
9 Comamonas spp. (1.33) Corynebacteriales spp. (4.33)
10 Geitlerinema spp. (1.67) Cupriavidus pinatubonensis (0.33)
11 Ktedonobacter spp. (2.67) Herbiconiux spp. (1.00)
12 Mycobacterium insubricum (0.33) Hgci clade spp. (1.67)
13 Mycobacterium spp. (2.67) Hymenobacter spp. (3.67)
14 Parvularcula spp. (2.00) Kineosporia spp. (0.33)
15 Pleomorphomonas oryzae (0.33) Limnobacter spp. (1.33)
16 Polaromonas spp. (7.33) Massilia spp. (6.33)
17 Rhodopirellula spp. (6.67) Massilia timonae (0.33)
18 Thermomonas spp. (7.00) Meganema spp. (1.33)
19 Microvirga bosea thiooxidans (3.00)
20 Mycobacterium celatum (9.33)
21 Nitrosovibrio tenuis (8.00)
22 Novosphingobium spp. (0.33)
23 Pedomicrobium spp. (1.00)
24 Pseudonocardia spp. (1.33)
25 Rhodomicrobium spp. (2.00)
26 Rhodovastum spp. (2.67)
27 Roseomonas ruber (11.67)
28 Sandarakinorhabdus spp. (2.67)
29 Schlesneria spp. (4.00)
30 Singulisphaera spp. (2.67)
31 Spam (candidate division) (1.67)
32 Sphingomonas spp. (1.67)
33 Tepidamorphus spp. (0.33)
34 Thalassospira spp. (6.00)
35 TM6 (3.67)
Metal contaminated sites: Laurentian, Kelly Lake and Kingsway and Reference sites: Onaping
Falls, Capreol and Killarney.

191
Table S3: All the bacterial groups and their relative abundance identified in metal
contaminated and reference soil samples from the GSR.
Bacterial species Metal contaminated sites Reference sites
1 Achromobacter spp.* 34.00 ± 2.18 21.33 ± 4.70
2 Acidicaldus spp.* 77.33 ± 11.73 32.33 ± 10.04
3 Acidimicrobiales spp.* 1.33 ± 1.33 29.67 ± 3.03
4 Acidimicrobium spp. 3.67 ± 3.67 0.00 ± 0.00
5 Acidiphilium spp. 1.67 ± 1.00 2.67 ± 1.19
6 Acidisphaera spp.* 15.67 ± 2.96 4.33 ± 2.33
7 Acidobacterium mine drainage 0.33 ± 0.33 1.67 ± 1.67
8 Acidobacterium spp.* 701.33 ± 47.06 387.67 ± 29.73
9 Acidocella spp.* 27.00 ± 12.28 10.33 ± 1.20
10 Acidothermus spp. 30.67 ± 5.76 24.67 ± 8.54
11 Acidovorax spp. 1.67 ± 1.67 0.00 ± 0.00
12 Afipia broomeae 445.33 ± 16.94 430.00 ± 6.17
13 Afipia felis* 5.33 ± 2.40 14.00 ± 0.94
14 Afipia spp. 2.67 ± 1.76 0.00 ± 0.00
15 Anaerolinea spp. 3.00 ± 2.22 0.00 ± 0.00
16 Anderseniella spp. 1.33 ± 1.33 0.00 ± 0.00
17 Aquicella spp. 158.33 ± 7.70 146.33 ± 8.60
18 Arenimonas spp.* 0.33 ± 0.33 14.67 ± 0.31
19 Armatimonas spp.* 0.00 ± 0.00 13.00 ± 3.26
20 Azospira spp.* 35.00 ± 4.98 11.33 ± 0.88
21 Azovibrio spp. 0.00 ± 0.00 2.00 ± 2.00
22 Bazzania trilobata 0.33 ± 0.33 0.00 ± 0.00
23 Blastochloris spp.* 4.33 ± 0.96 9.67 ± 0.89
24 Blastochloris viridis* 0.00 ± 0.00 3.67 ± 0.73
25 Blastomonas spp. 3.67 ± 3.67 0.00 ± 0.00
26 Bosea spp. 0.00 ± 0.00 1.00 ± 1.00
27 Bradyrhizobium spp.* 49.33 ± 8.50 75.67 ± 8.41
28 Burkholderia caryophylli 0.67 ± 0.33 0.00 ± 0.00
29 Burkholderia spp. 11.33 ± 2.03 8.00 ± 2.65
30 Caldanaerobacter
thermoanaerobacter tengcongensis*
26.67 ± 11.86 5.67 ± 3.67
31 Caldilinea spp. 0.00 ± 0.00 1.00 ± 1.50
32 Candidatus alysiosphaera spp. 6.00 ± 3.46 5.67 ± 2.85
33 Candidatus chloracidobacterium spp.* 26.00 ± 3.65 43.33 ± 3.33
34 Candidatus entotheonella spp.* 0.00 ± 0.00 21.00 ± 3.75
35 Candidatus koribacter spp.* 117.00 ± 6.09 195.67 ± 3.38
36 Candidatus koribacter versatilis 2.67 ± 1.76 2.33 ± 1.20
37 Candidatus solibacter spp.* 294.00 ± 5.69 490.33 ± 4.00

192
38 Candidatus xiphinematobacter spp. 0.00 ± 0.00 10.67 ± 8.74
39 Caulobacter spp.* 30.00 ± 2.58 13.33 ± 3.10
40 Caulobacter vibrioides 13.67 ± 8.82 6.67 ± 1.45
41 Chelatococcus spp. 0.00 ± 0.00 6.67 ± 6.67
42 Climaciaceae climacium dendroides 9.33 ± 4.33 5.33 ± 2.67
43 Collimonas fungivorans 3.00 ± 3.00 0.33 ± 0.33
44 Colwellia spp. 49.67 ± 20.54 28.67 ± 7.84
45 Comamonas spp. 1.33 ± 1.33 0.00 ± 0.00
46 Conexibacter spp.* 63.67 ± 8.06 32.67 ± 3.02
47 Coprothermobacter spp.* 5.00 ± 1.52 9.67 ± 1.60
48 Corynebacteriales spp. 0.00 ± 0.00 4.33 ± 2.96
49 Crossiella spp. 6.00 ± 5.03 3.33 ± 0.67
50 Cupriavidus pinatubonensis 0.00 ± 0.00 0.33 ± 0.33
51 Defluviicoccus spp. 18.00 ± 17.50 4.33 ± 3.84
52 Dongia spp. 16.67 ± 1.45 13.00 ± 3.34
53 Dyella spp. 0.33 ± 0.33 1.00 ± 0.58
54 Edaphobacter modestum* 28.67 ± 3.94 32.00 ± 2.00
55 Edaphobacter spp. 12.00 ± 7.21 13.67 ± 5.24
56 Escherichia shigella spp. 0.67 ± 0.33 2.00 ± 1.15
57 Ferruginibacter spp.* 27.67 ± 3.18 13.67 ± 2.68
58 Filomicrobium spp.* 88.33 ± 8.35 3.33 ± 0.88
59 Frankia spp. 5.00 ± 1.00 3.00 ± 1.15
60 Geitlerinema spp. 1.67 ± 1.67 0.00 ± 0.00
61 Gemmata spp. 6.67 ± 4.18 5.67 ± 2.73
62 Gemmatimonas spp. 0.67 ± 0.33 8.67 ± 3.36
63 Geobacillus spp. 27.67 ± 24.69 45.67 ± 29.20
64 Granulicella spp. 212.33 ± 84.84 286.00 ± 42.34
65 Haliangium spp. 0.67 ± 0.67 7.00 ± 4.04
66 Herbiconiux spp. 0.00 ± 0.00 1.00 ± 1.00
67 Hgci clade spp. 0.00 ± 0.00 1.67 ± 1.67
68 Hirschia spp. 29.33 ± 3.53 22.00 ± 5.86
69 Hymenobacter spp. 0.00 ± 0.00 3.67 ± 3.67
70 Hyphomicrobium spp. 3.67 ± 3.67 2.33 ± 1.33
71 Iamia spp. 1.67 ± 1.20 1.67 ± 1.67
72 Inquilinus spp.* 1.67 ± 0.88 7.33 ± 3.48
73 Kineosporia spp. 0.00 ± 0.00 0.33 ± 0.33
74 Ktedonobacter spp. 2.67 ± 2.67 0.00 ± 0.00
75 Labrys spp.* 18.33 ± 9.39 0.67 ± 0.33
76 Leptothrix spp. 4.33 ± 1.20 4.67 ± 3.71
77 Limnobacter spp. 0.00 ± 0.00 1.33 ± 1.33
78 Marmoricola spp. 0.33 ± 0.33 3.00 ± 2.52
79 Massilia spp. 0.00 ± 0.00 6.33 ± 5.84

193
80 Massilia timonae 0.00 ± 0.00 0.33 ± 0.33
81 Meganema spp. 0.00 ± 0.00 1.33 ± 0.88
82 Methylocystis spp.* 19.00 ± 4.93 31.67 ± 5.33
83 Methylosinus sporium 3.33 ± 3.33 1.67 ± 1.67
84 Methylosinus trichosporium* 8.67 ± 1.67 0.33 ± 0.33
85 Metyhlovirgula spp.* 15.67 ± 11.79 27.33 ± 24.84
86 Microvirga bosea thiooxidans 0.00 ± 0.00 3.00 ± 3.00
87 Mycobacterium celatum* 0.00 ± 0.00 9.33 ± 3.36
88 Mycobacterium insubricum 0.33 ± 0.33 0.00 ± 0.00
89 Mycobacterium riyadhense* 39.00 ± 3.21 13.67 ± 10.68
90 Mycobacterium spp. 2.67 ± 1.76 0.00 ± 0.00
91 Nitrosococcus spp. 115.00 ± 40.99 93.00 ± 28.54
92 Nitrosovibrio tenuis 0.00 ± 0.00 8.00 ± 8.00
93 Novosphingobium spp. 0.00 ± 0.00 0.33 ± 0.33
94 Opitutus spp. 9.33 ± 8.84 7.33 ± 3.18
95 Parvularcula spp. 2.00 ± 1.53 0.00 ± 0.00
96 Pedomicrobium spp. 0.00 ± 0.00 1.00 ± 0.58
97 Phenylobacterium spp.* 3.67 ± 2.73 27.33 ± 11.46
98 Pilimelia spp.* 0.33 ± 0.33 23.67 ± 7.88
99 Planctomyces spp. 11.00 ± 3.00 1.00 ± 1.00
100 Pleomorphomonas oryzae 0.33 ± 0.33 0.00 ± 0.00
101 Polaromonas spp. 7.33 ± 7.33 0.00 ± 0.00
102 Pseudolabrys spp. 4.33 ± 0.33 8.00 ± 3.79
103 Pseudonocardia spp. 0.00 ± 0.00 1.33 ± 1.33
104 Rhizobium spp. 1.33 ± 0.88 3.00 ± 2.52
105 Rhodomicrobium spp. 0.00 ± 0.00 2.00 ± 2.00
106 Rhodopirellula spp. 6.67 ± 3.76 0.00 ± 0.00
107 Rhodoplanes spp.* 173.00 ± 7.51 239.00 ± 7.64
108 Rhodovastum atsumiense 2.00 ± 1.00 1.33 ± 0.88
109 Rhodovastum spp. 0.00 ± 0.00 2.67 ± 2.67
110 Rhodovibrio spp. 14.67 ± 7.86 2.67 ± 0.88
111 Roseomonas ruber 0.00 ± 0.00 11.67 ±11.67
112 Sandarakinorhabdus spp. 0.00 ± 0.00 2.67 ± 2.67
113 Schlesneria spp. 0.00 ± 0.00 4.00 ± 4.00
114 Sciscionella spp. 9.00 ± 6.66 0.33 ± 0.33
115 Sideroxydans spp. 1.00 ± 1.00 0.33 ± 0.33
116 Simplicispira spp. 4.67 ± 4.67 4.67 ± 4.67
117 Singulisphaera spp. 0.00 ± 0.00 2.67 ± 2.67
118 Skermanella spp. 86.00 ± 64.04 20.00 ± 5.13
119 Solirubrobacter spp. 18.33 ± 3.28 34.00 ± 15.13
120 Sorangiineae spp.* 14.67 ± 4.84 6.33 ± 2.60
121 Spam (candidate division) 0.00 ± 0.00 1.67 ± 1.67
122 Sphingomonas spp. 0.00 ± 0.00 1.67 ± 1.20
123 Telmatospirillum spp. 0.67 ± 0.33 2.67 ± 2.67

194
124 Tepidamorphus spp. 0.00 ± 0.00 0.33 ± 0.33
125 Thalassospira spp. 0.00 ± 0.00 6.00 ± 6.00
126 Thermomonas spp. 7.00 ± 1.00 0.00 ± 0.00
127 Thermosporothrix spp.* 120.00 ± 36.61 1.67 ± 0.88
128 Thioalkalispira spp.* 69.33 ± 14.20 22.00 ± 8.96
129 TM6 0.00 ± 0.00 3.67 ± 3.67
130 TM7 * 36.33 ± 8.65 9.67 ± 4.06
131 Zavarzinella spp. 0.67 ± 0.67 2.00 ± 2.00
Results are expressed as mean values ± standard error
* represents significant differences between metal contaminated and reference sites based on t-
test (p≤0.05)
Metal contaminated sites: Laurentian, Kelly Lake and Kingsway and, Reference sites: Onaping
Falls, Capreol and Killarney

195
Table S4: The weighed UniFrac distance matrix between sites for bacterial community.
Sites Laurentian Kelly Lake Kingsway Onaping Falls Capreol Killarney
Laurentian 0.00 0.22 0.20 0.15 0.14 0.13
Kelly Lake
0.00 0.21 0.22 0.19 0.24
Kingsway
0.00 0.15 0.12 0.13
Onaping Falls
0.00 0.17 0.14
Capreol
0.00 0.15
Killarney
0.00

196
Table S5: Site-specific fungal groups and their relative abundance identified in metal
contaminated and reference soil samples from the GSR.
Metal contaminated sites Reference sites
1 Amanita muscaria (5.33) Amanita sp.(4.33)
2 Ascomycete sp. (18.50) Archaeosporales sp. (158.67)
3 Dothideomycetes sp. (39.00) Atheliaceae sp. (0.33)
4 Leotia viscosaa (48.33) Clavulina cinerea (17.00)
5 Magnaporthales sp. (8.33) Clavulinaceae sp. (34.33)
6 Piloderma lanatum (12.33) Cortinariaceae sp. (0.33)
7 Russula vesca (306.00) Cortinarius camphorates (1.00)
8 Tremella diploschistina (5.00) Elaphomyces decipiens (64.00)
9 Xerocomus badius (12.33) Ericoid mycorrhizal sp. (0.33)
10 Geoglossum barlae (91.33)
11 Gyoerffyella sp. (3.33)
12 Hygrocybe miniata (55.00)
13 Inocybe lacera (45.00)
14 Inocybe lanatodisca (34.00)
15 Lactarius picinus (8.00)
16 Pezizales sp. (182.33)
17 Piloderma fallax (223.33)
18 Piloderma olivaceum (155.33
19 Russula gracilis (36.33)
20 Russulaceae sp. (0.33)
21 Saccharomycetes sp. (79.00)
22 Sordariales sp. (10.67)
Metal contaminated sites: Laurentian, Kelly Lake and Kingsway and Reference sites: Onaping
Falls, Capreol and Killarney.

197
Table S6: All the fungal species and their relative abundance identified in metal
contaminated and reference soil samples from the GSR.
Fungi species Metal contaminated sites Reference sites
1 Agaricomycotina sp.* 173.00 ± 62.00 787.67 ± 46.29
2 Amanita muscaria 5.33 ± 5.33 0.00 ± 0.00
3 Amanita sp. 0.00 ± 0.00 4.33 ± 4.33
4 Archaeosporales sp. 0.00 ± 0.00 158.67 ± 158.67
5 Ascomycete sp. 1.67 ± 1.67 0.00 ± 0.00
6 Ascomycota sp. 43.00 ± 19.92 31.00 ± 13.23
7 Atheliaceae sp. 0.00 ± 0.00 0.33 ± 0.33
8 Basidiomycota sp.* 176.00 ± 17.57 133.67 ± 13.67
9 Cenococcum geophilum 287.67 ± 287.67 85.00 ± 85.00
10 Chaetomella oblonga 6.33 ± 4.88 0.67 ± 0.67
11 Clavulina cinerea 0.00 ± 0.00 17.00 ± 10.12
12 Clavulinaceae sp. 0.00 ± 0.00 34.33 ± 34.33
13 Cortinariaceae sp. 0.00 ± 0.00 0.33 ± 0.33
14 Cortinarius camphoratus 0.00 ± 0.00 1.00 ± 1.00
15 Cryptococcus podzolicus* 49.00 ± 1.00 22.67 ± 4.26
16 Dermateaceae sp.* 75.67 ± 3.86 11.67 ± 9.74
17 Dothideomycetes sp. 39.00 ± 26.66 0.00 ± 0.00
18 Elaphomyces decipiens 0.00 ± 0.00 64.00 ± 64.00
19 Elaphomyces muricatus 2.67 ± 1.45 10.67 ± 10.67
20 Ericoid mycorrhizal sp. 0.00 ± 0.00 0.33 ± 0.33
21 Fungi fungal sp. 24.67 ± 8.67 38.00 ± 20.78
22 Fungi mycorrhizal fungal sp. 14.33 ± 13.84 17.00 ± 17.00
23 Geoglossum barlae 0.00 ± 0.00 91.33 ± 91.33
24 Gyoerffyella sp. 0.00 ± 0.00 3.33 ± 2.40
25 Helotiaceae sp.* 122.00 ± 10.64 0.33 ± 0.33
26 Helotiales sp. 48.33 ± 42.47 5.33 ± 3.18
27 Herpotrichiellaceae sp. 45.00 ± 17.62 5.00 ± 5.00
28 Hygrocybe miniata 0.00 ± 0.00 55.00 ± 55.00
29 Inocybe lacera 0.00 ± 0.00 45.00 ± 45.00
30 Inocybe lanatodisca* 0.00 ± 0.00 34.00 ± 9.63
31 Laccaria proxima* 259.67 ± 21.05 33.00 ± 6.56
32 Laccaria sp.* 23.67 ± 19.80 5.33 ± 3.53
33 Lactarius camphoratus 5.67 ± 5.67 92.00 ± 92.00
34 Lactarius fuscus 3.00 ± 3.00 21.00 ± 17.62
35 Lactarius picinus 0.00 ± 0.00 8.00 ± 8.00
36 Leotia viscosa 48.33 ± 48.33 0.00 ± 0.00

198
37 Leotiomycetes sp. 31.33 ± 29.36 7.00 ± 4.00
38 Magnaporthales sp. 8.33 ± 6.01 0.00 ± 0.00
39 Mortierella sp. 17.00 ± 17.00 3.67 ± 3.18
40 Mortierellales sp.* 80.00 ± 7.72 14.33 ± 7.17
41 Mucoromycotina sp. 38.33 ± 38.33 0.33 ± 0.33
42 Myxotrichaceae sp. 40.00 ± 24.25 25.67 ± 19.80
43 Oidiodendron maius 33.33 ± 19.88 17.00 ± 6.08
44 Penicillium montanense 56.00 ± 30.89 23.00 ± 18.68
45 Pezizales sp.* 0.00 ± 0.00 182.33 ± 78.84
46 Pezizomycotina sp. 31.67 ± 11.39 32.33 ± 19.70
47 Phialocephala fortinii 14.00 ± 14.00 2.00 ± 1.53
48 Piloderma fallax 0.00 ± 0.00 223.33 ±223.33
49 Piloderma lanatum 12.33 ± 12.33 0.00 ± 0.00
50 Piloderma olivaceum 0.00 ± 0.00 155.33 ± 155.33
51 Pyronemataceae sp. 33.67 ± 32.67 209.00 ± 199.58
52 Russula aeruginea* 2.00 ± 0.58 5.33 ± 1.96
53 Russula gracilis 0.00 ± 0.00 36.33 ± 36.33
54 Russula sp. 833.33 ± 529.88 28.67 ± 27.18
55 Russula sphagnophila 336.00 ± 328.03 0.33 ± 0.33
56 Russula vesca 306.00 ± 158.55 0.00 ± 0.00
57 Russulaceae sp. 0.00 ± 0.00 0.33 ± 0.33
58 Saccharomycetes sp. 0.00 ± 0.00 79.00 ± 79.00
59 Scleroderma citrinum 71.67 ± 69.68 4.67 ± 4.67
60 Sebacinaceae sp. 60.00 ± 60.00 26.33 ± 18.91
61 Sordariales sp. 0.00 ± 0.00 10.67 ± 10.67
62 Sordariomycetes sp.* 0.33 ± 0.33 147.33 ± 41.84
63 Thelephoraceae sp. 0.33 ± 0.33 0.00 ± 0.00
64 Tomentella sp.* 10.67 ± 10.67 36.67 ± 16.62
65 Tremella diploschistina 5.00 ± 5.00 0.00 ± 0.00
66 Tylospora asterophora 19.00 ± 18.01 321.00 ± 321.00
67 Venturiales sp. 12.33 ± 7.54 39.67 ± 22.00
68 Xerocomus badius 12.33 ± 12.33 0.00 ± 0.00
Results are expressed as mean values ± standard error
* represents significant differences between metal contaminated and reference sites based on t-
test (p≤0.05)
Metal contaminated sites: Laurentian, Kelly Lake and Kingsway and, Reference sites: Onaping
Falls, Capreol and Killarney

199
Table S7: The weighed UniFrac distance matrix between sites for fungal community.
Sites Laurentian Kelly Lake Kingsway Onaping Falls Capreol Killarney
Laurentian 0.00 0.96 0.92 0.97 0.86 0.97
Kelly Lake
0.00 0.93 0.95 0.95 0.98
Kingsway
0.00 0.96 0.88 0.96
Onaping Falls
0.00 0.94 0.97
Capreol
0.00 0.96
Killarney
0.00

200
Table S8: Bacterial species and its relative abundance identified unique to sites from the
GSR.
Limed sites Unlimed
1 Actinoplanes ferrugineus (3.25) Acidomonas baliensis (1.00)
2 Arthrobacter spp. (4.00) Acidomonas methanolica (1.50)
3 Bradyrhizobium elkanii (2.75) Afipia spp. (2.00)
4 Byssovorax spp. (1.00) Anaerolinea spp. (7.75)
5 Candidates captivus spp. (1.00) Blastomonas spp. (6.25)
6 Candidates microthrix spp. (1.75) Caldanaerobacter thermoanaerobacter
sp. (12.00)
7 Cryptosporangium japonicum (0.25) Candidates chlorothrix spp. (7.00)
8 Kribbella spp. (1.25) Comamonas spp. (1.00)
9 Luteibacter spp. (1.00) Dermatophilus spp. (2.75)
10 Methylosinus spp. (0.75) Geitlerinema spp. (1.25)
11 Methylotenera spp. (6.75) Mitochondria marchantia polymorpha
(2.75)
12 Methyloversatilis spp. (3.25) Mucilaginibacter spp. (3.25)
13 Nitrospira freshwater sediment (0.75) Mycobacterium insubricum (0.25)
14 Nocardioides spp. (4.25) Mycobacterium spp. (1.75)
15 Parasegetibacter spp. (1.00) Parvularcula spp.(1.25)
16 Pirellula spp. (3.00) Polaromonas spp. (5.50)
17 Rhodobacter spp. (8.00) Rhodobium orientis (1.25)
18 Rhodoplanes elegans (3.75) Tistlia spp. (1.25)
19 Sphingomonas caulobacter leidyia (1.5) Thermogemmatispora foliorum (4.75)
20 Streptomyces lincolnensis (0.25) Thermogemmatispora onikobensis (9.00)
21 Victivallis spp. (1.00)
Limed and Unlimed sites: Daisy Lake 2 (site 1), Wahnapitae Hydro-Dam (site 2), Kelly Lake
(site 3), and Kingsway (site 4).

201
Table S9: Fungi species and its relative abundance identified unique to sites from the GSR.
Limed sites Unlimed sites
1 Archaeorhizomyces finlayi (16.75) Ascomycete sp. (18.50)
2 Cortinarius flos paludis (636.00) Cladonia coniocraea (9.50)
3 Fusarium oxysporum (7.75) Dibaeis baeomyces (798.50)
4 Inocybe abject (78.00) Piloderma lanatum (9.25)
5 Inocybe fuscidula (351.75) Tremella diploschistina (3.75)
6 Myrothecium cinctum (18.50)
7 Suillus brevipes (206.50)
8 Tricholomataceae sp. (36.75)
9 Tricholoma ustale (30.50)
10 Wilcoxina mikolae (53.75)
Limed and Unlimed sites: Daisy Lake 2 (site 1), Wahnapitae Hydro-Dam (site 2), Kelly Lake
(site 3), and Kingsway (site 4).

202
Table S10: 149 bacterial species and their relative abundance identified from soil samples
from the GSR.
Bacterial species Limed sites Unlimed sites
1. Achromobacter spp. 18.75a (± 5.15) 12.75a (± 4.32)
2. Acidicaldus spp. 30.00a (± 4.69) 38.75a (± 4.87)
3. Acidimicrobiales spp. 13.75a (± 6.68) 0.50b (± 0.58)
4. Acidimicrobium spp. 0.00a (± 0.00) 2.75a (± 3.18)
5. Acidiphilium spp. 8.75a (± 8.99) 4.50a (± 3.42)
6. Acidisphaera spp. 6.50a (± 2.45) 11.50b (± 4.73)
7. Acidobacterium spp. 159.50a (± 10.74) 683.75b (± 11.78)
8. Acidocella spp. 15.25a (± 5.70) 5.00b (± 2.94)
9. Acidomonas baliensis 0.00a (± 0.00) 1.00a (± 1.15)
10. Acidomonas methanolica 0.00a (± 0.00) 1.50a (± 1.73)
11. Acidothermus spp. 4.75a (± 4.09) 8.50a (± 2.89)
12. Acidovorax spp. 0.25a (± 0.29) 3.25a (± 2.28)
13. Actinoplanes ferrugineus 3.25a (± 2.18) 0.00a (± 0.00)
14. Afipia broomeae 423.25a (± 9.00) 314.75b (± 13.03)
15. Afipia felis 12.75a (± 3.89) 4.75b (± 2.37)
16. Afipia spp. 0.00a (± 0.00) 2.00a (± 1.63)
17. Anaerolinea spp. 0.00a (± 0.00) 7.75a (± 6.26)
18. Anderseniella spp. 2.00a (± 1.63) 3.50a (± 2.73)
19. Aquicella spp. 49.75a (± 7.68) 300.75b (± 18.48)
20. Arenimonas spp. 23.25a (± 4.88) 1.25b (± 1.09)
21. Armatimonas spp. 0.25a (±0.29) 0.00a (± 0.00)
22. Arthrobacter spp. 4.00a (± 4.62) 0.00a (± 0.00)
23. Azospira spp. 20.75a (± 5.46) 38.00b (± 4.51)
24. Azovibrio spp. 0.25a (± 0.29) 0.00a (± 0.00)
25. Blastochloris spp. 1.00a (± 1.15) 1.00a (± 0.82)
26. Blastochloris viridis 3.00a (± 3.46) 0.00a (± 0.00)
27. Blastomonas spp. 0.00a (± 0.00) 6.25b (± 2.23)
28. Bosea spp. 2.25a (± 2.23) 0.00a (± 0.00)
29. Bradyrhizobium elkanii 2.75a (± 3.18) 0.00a (± 0.00)
30. Bradyrhizobium spp. 69.75a (± 6.52) 29.50b (± 5.81)
31. Burkholderia caryophylli 1.00a (± 0.47) 0.25a (± 0.29)
32. Burkholderia spp. 2.25a (± 1.91) 11.00b (± 2.23)
33. Byssovorax spp. 1.00a (± 1.15) 0.00a (± 0.00)
34. Caldanaerobacter thermoanaerobacter sp. 0.00a (± 0.00) 12.00a (± 13.86)
35. Caldanaerobacter thermoanaerobacter
tengcongensis
5.50a (± 1.93) 20.00b (± 4.36)

203
36. Caldilinea spp. 5.25 (± 6.06) 5.50 (± 6.35)
37. Candidatus koribacter versatilis 0.25a (± 0.29) 2.00a (± 1.63)
38. Candidates alysiosphaera spp. 20.50a (± 5.72) 5.50b (± 2.77)
39. Candidates captivus spp. 1.00a (± 1.15) 0.00a (± 0.00)
40. Candidates chloracidobacterium spp. 27.75a (± 7.93) 20.25a (± 4.44)
41. Candidates chlorothrix spp. 0.00a (± 0.00) 7.00a (± 8.08)
42. Candidates entotheonella spp. 70.75a (± 9.01) 0.00b (± 0.00)
43. Candidates koribacter spp. 23.25a (± 9.68) 262.75b (± 16.79)
44. Candidates microthrix spp. 1.75a (± 1.66) 0.00a (± 0.00)
45. Candidates solibacter spp. 137.75a (± 12.37) 286.5b (± 14.54)
46. Candidates xiphinematobacter spp. 5.00a (± 1.59) 0.75b (± 0.87)
47. Caulobacter spp. 8.00a (± 3.74) 24.75b (± 4.77)
48. Caulobacter vibrioides 4.25a (± 2.18) 10.25a (± 8.94)
49. Collimonas fungivorans 0.00a (± 0.00) 2.25a (± 2.60)
50. Colwellia spp. 7.50a (± 3.32) 40.00b (± 4.34)
51. Comamonas spp. 0.00a (± 0.00) 1.00a (± 1.15)
52. Conexibacter spp. 21.25a (± 7.61) 51.00b (± 8.39)
53. Coprothermobacter spp. 0.75a (± 0.55) 3.25a (± 1.60)
54. Corynebacteriales spp. 3.00a (± 3.46) 0.00a (± 0.00)
55. Crossiella spp. 5.50a (± 3.84) 7.00a (± 4.76)
56. Cryptosporangium japonicum 0.25a (± 0.29) 0.00a (± 0.00)
57. Cupriavidus pinatubonensis 3.25a (± 3.75) 0.00a (± 0.00)
58. Defluviicoccus spp. 25.50a (±10.34) 14.25a (± 3.95)
59. Dermatophilus spp. 0.00a (± 0.00) 2.75a (± 3.18)
60. Dongia spp. 5.00a (± 2.40) 12.75a (± 10.81)
61. Dyella spp. 6.00a (± 6.93) 0.00a (± 0.00)
62. Edaphobacter modestum 7.25a (± 2.80) 11.75a (± 3.95)
63. Edaphobacter spp. 1.00a (± 1.15) 10.50b (± 2.74)
64. Escherichia shigella spp. 1.75a (± 1.19) 5.50a (± 5.97)
65. Ferruginibacter spp. 8.00a (± 1.25) 18.00b (± 2.38)
66. Filomicrobium spp. 2.50a (± 2.89) 65.75b (± 7.39)
67. Fluviicola spp. 0.75a (± 0.87) 0.00a (± 0.00)
68. Frankia spp. 3.50a (± 1.45) 2.75a (± 1.44)
69. Geitlerinema spp. 0.00a (± 0.00) 1.25a (± 1.44)
70. Gemmata spp. 11.75a (± 3.24) 11.50a (± 2.37)
71. Gemmatimonas spp. 8.00a (± 1.74) 18.75b (± 2.40)
72. Geobacillus spp. 41.25a (± 3.81) 167.75b (± 13.03)
73. Granulicella spp. 74.50a (± 10.48) 186.75b (± 16.68)
74. Haliangium spp. 2.75a (± 2.47) 0.50a (± 0.58)
75. Hirschia spp. 19.75a (± 3.67) 21.50a (± 2.81)

204
76. Hymenobacter spp. 0.00a (± 0.00) 10.75a (± 12.41)
77. Hyphomicrobium spp. 1.50a (± 1.11) 2.75a (± 3.18)
78. Iamia spp. 0.00a (± 0.00) 5.75b (± 1.98)
79. Inquilinus spp. 2.00a (± 0.82) 3.50a (± 3.32)
80. Kineosporia spp. 6.00a (± 2.79) 0.00b (± 0.00)
81. Kribbella spp. 1.25a (± 1.44) 0.00a (± 0.00)
82. Ktedonobacter spp. 12.00a (± 3.47) 3.25b (± 2.28)
83. Labrys spp. 28.00a (± 4.65) 14.75b (± 3.91)
84. Leptothrix spp. 1.00a (± 1.15) 2.75a (± 1.85)
85. Luteibacter spp. 1.00a (± 1.15) 0.00a (± 0.00)
86. Magnetospirillum sp. 1.75a (± 2.02) 0.00a (± 0.00)
87. Marmoricola spp. 16.25a (± 15.16) 0.00a (± 0.00)
88. Massilia spp. 2.00a (± 1.25) 0.00a (± 0.00)
89. Massilia timonae 2.75a (± 3.18) 0.00a (± 0.00)
90. Methylocystis spp. 8.50a (± 2.11) 7.75a (± 1.38)
91. Methylosinus sporium 0.50a (± 0.58) 0.00a (± 0.00)
92. Methylosinus spp. 0.75a (± 0.87) 0.00a (± 0.00)
93. Methylosinus trichosporium 0.00a (± 0.00) 6.25b (± 2.84)
94. Methylotenera spp. 6.75a (± 7.79) 0.00a (± 0.00)
95. Methyloversatilis spp. 3.25a (± 1.44) 0.00b (± 0.00)
96. Metyhlovirgula spp. 2.00a (± 1.41) 2.00a (± 1.94)
97. Mitochondria marchantia polymorpha 0.00a (± 0.00) 2.75a (± 3.18)
98. Mucilaginibacter spp. 0.00a (± 0.00) 3.25a (± 3.75)
99. Mycobacterium celatum 1.00a (± 0.82) 0.00a (± 0.00)
100. Mycobacterium insubricum 0.00a (± 0.00) 0.25a (± 0.29)
101. Mycobacterium riyadhense 2.25a (± 2.60) 19.75b (± 6.88)
102. Mycobacterium spp. 0.00a (± 0.00) 1.75a (± 1.36)
103. Nitrosococcus spp. 56.00a (± 7.68) 81.50b (± 4.20)
104. Nitrospira freshwater sediment 0.75a (± 0.87) 0.00a (± 0.00)
105. Nocardioides spp. 4.25a (± 4.91) 0.00a (± 0.00)
106. Novosphingobium spp. 2.50a (± 2.19) 0.00a (± 0.00)
107. Opitutus spp. 2.25a (± 2.60) 0.25a (± 0.29)
108. Parasegetibacter spp. 1.00a (± 1.15) 0.00a (± 0.00)
109. Parvularcula spp. 0.00a (± 0.00) 1.25a (± 1.44)
110. Pedomicrobium spp. 16.00a (± 2.88) 4.50b (± 3.12)
111. Phenylobacterium spp. 17.50a (± 5.67) 3.00b (± 2.45)
112. Pilimelia spp. 58.00a (± 3.32) 1.50b (± 1.37)
113. Pirellula spp. 3.00a (± 0.05) 0.00b (± 0.00)
114. Planctomyces spp. 0.25a (± 0.29) 10.00b (± 2.60)
115. Pleomorphomonas oryzae 0.25a (± 0.29) 0.25a (± 0.29)

205
116. Polaromonas spp. 0.00a (± 0.00) 5.50a (± 6.35)
117. Pseudolabrys spp. 43.25a (± 7.49) 3.50b (± 0.75)
118. Rhizobium spp. 2.75a (± 3.18) 3.00a (± 1.25)
119. Rhodobacter spp. 8.00a (± 1.58) 0.00b (± 0.00)
120. Rhodobium orientis 0.00a (± 0.00) 1.25a (± 1.44)
121. Rhodopirellula spp. 1.00a (± 1.15) 6.00b (± 1.16)
122. Rhodoplanes elegans 3.75a (± 4.33) 0.00a (± 0.00)
123. Rhodoplanes spp. 115.75a (± 5.19) 120.5a (± 7.93)
124. Rhodovastum atsumiense 0.50a (± 0.58) 1.00a (± 0.82)
125. Rhodovibrio spp. 1.00a (± 0.82) 8.50a (± 8.35)
126. Roseomonas ruber 0.75a (± 0.55) 1.50a (± 1.76)
127. Sciscionella spp. 1.00a (± 1.15) 44.25b (± 4.25)
128. Sideroxydans spp. 0.25a (± 0.29) 0.00a (± 0.00)
129. Simplicispira spp. 0.50a (± 0.33) 3.50a (± 4.04)
130. Singulisphaera nostocoida limicola 0.00a (± 0.00) 4.50a (± 5.20)
131. Skermanella spp. 19.75a (± 10.84) 105.75b (± 25.88)
132. Sneathiella spp. 2.25a (± 0.66) 0.00b (± 0.00)
133. Solirubrobacter spp. 23.75a (± 3.02) 15.00b (± 5.94)
134. Sorangiineae spp. 2.75a (± 3.18) 1.00a (± 1.15)
135. Sorangium spp. 2.00a (± 1.05) 21.00b (± 6.82)
136. Sphingomonas caulobacter leidyia 1.50a (± 1.73) 0.00a (± 0.00)
137. Sphingomonas spp. 0.50a (± 0.58) 0.00a (± 0.00)
138. Streptomyces lincolnensis 0.25a (± 0.29) 0.00a (± 0.00)
139. Telmatospirillum spp. 0.25a (± 0.29) 2.50a (± 2.52)
140. Tepidamorphus spp. 1.25a (± 1.44) 0.00a (± 0.00)
141. Thermogemmatispora foliorum 0.00a (± 0.00) 4.75a (± 5.48)
142. Thermogemmatispora onikobensis 0.00a (± 0.00) 9.00a (± 10.39)
143. Thermomonas spp. 0.25a (± 0.29) 7.75b (± 2.84)
144. Thermosporothrix spp. 12.75a (± 4.84) 343.75b (± 21.30)
145. Thioalkalispira spp. 8.50a (± 5.11) 134.25b (± 10.00)
146. Tistlia spp. 0.00a (± 0.00) 1.25a (± 1.44)
147. TM7 7.75a (± 3.07) 24.50b (± 4.12)
148. Victivallis spp. 0.00a (± 0.00) 1.00b (± 0.00)
149. Zavarzinella spp. 0.00a (± 0.00) 2.50a (± 2.19)
Results are expressed as mean values ± standard error
Means in rows with a common letter are not significantly different based on t-test (p ≥ 0.05).
Limed and Unlimed sites: Daisy Lake 2 (site 1), Wahnapitae Hydro-Dam (site 2), Kelly Lake
(site 3), and Kingsway (site 4).

206
Table S11: The weighed UniFrac distance matrix between sites for bacterial community.
Daisy Lake 2
Limed
Daisy Lake 2
Unlimed
Wahnapitae
Hydro-Dam
Limed
Wahnapitae
Hydro-Dam
Unlimed
Kelly Lake
Limed
Kelly Lake
Unlimed
Kingsway
Limed
Kingsway
Unlimed
Daisy Lake 2
Limed 0.00 0.31 0.24 0.30 0.16 0.23 0.21 0.20
Daisy Lake 2
Unlimed 0.00 0.35 0.47 0.37 0.30 0.36 0.41
Wahnapitae
Hydro-Dam
Limed
0.00 0.40 0.24 0.25 0.18 0.32
Wahnapitae
Hydro-Dam
Unlimed
0.00 0.30 0.36 0.34 0.19
Kelly Lake
Limed 0.00 0.21 0.17 0.21
Kelly Lake
Unlimed 0.00 0.21 0.29
Kingsway
Limed 0.00 0.26
Kingsway
Unlimed 0.00

207
Table S12: A total of 70 fungal species and their relative abundance identified from soil
samples from the GSR.
Fungi species Limed sites Unlimed sites
1. Agaricomycotina sp. 109.25a (± 39.71) 306.50b (±18.61)
2. Amanita muscaria 70.75a (± 11.70) 4.00b (± 4.62)
3. Amanita sp. 1.00a (± 0.82) 0.00a (± 0.00)
4. Archaeorhizomyces finlayi 16.75a (± 19.34) 0.00a (± 0.00)
5. Ascomycete sp. 0.00a (± 0.00) 18.50b (± 7.57)
6. Ascomycota sp. 20.00a (± 19.74) 199.00b (± 19.28)
7. Atheliaceae sp. 0.50a (± 0.58) 0.00a (± 0.00)
8. Basidiomycota sp. 1.50a (± 1.37) 127.75b (± 14.51)
9. Calicium salicinum 2.25a (± 2.60) 21.00b (± 4.25)
10. Cenococcum geophilum 42.75a (± 4.84) 0.00b (± 0.00)
11. Chaetomella oblonga 2.75a (± 3.18) 1.00a (± 1.15)
12. Cladonia coniocraea 0.00a (± 0.00) 9.50a (± 10.97)
13. Clavulinaceae sp. 42.75a (± 49.36) 0.00a (± 0.00)
14. Cortinariaceae sp. 10.00a (± 11.55) 0.00a (± 0.00)
15. Cortinarius flos paludis 636.00a (± 34.39) 0.00b (± 0.00)
16. Cryptococcus podzolicus 87.50a (± 8.34) 25.75b (± 15.86)
17. Dermateaceae sp. 11.75a (± 7.52) 52.25b (± 4.18)
18. Dibaeis baeomyces 0.00a (± 0.00) 798.50b (± 22.03)
19. Dothideomycetes sp. 5.00a (± 2.54) 33.75a (± 24.68)
20. Elaphomyces muricatus 0.00a (± 0.00) 0.75a (± 0.55)
21. Ericoid mycorrhizal sp. 41.00a (± 4.49) 0.00b (± 0.00)
22. Fungi fungal sp. 5.75a (± 3.84) 16.25b (± 4.16)
23. Fungi mycorrhizal fungal sp. 2.25a (± 1.91) 10.50a (± 12.12)
24. Fusarium oxysporum 7.75a (± 8.20) 0.00a (± 0.00)
25. Gyoerffyella sp. 1.75a (± 1.66) 0.75a (± 0.55)
26. Helotiaceae sp. 65.00a (± 4.53) 96.75b (± 9.61)
27. Helotiales sp. 31.50a (± 5.36) 53.25b (± 7.63)
28. Herpotrichiellaceae sp. 3.50a (± 2.03) 23.75b (± 12.44)
29. Inocybe abjecta 78.00a (± 13.53) 0.00b (± 0.00)
30. Inocybe fuscidula 351.75a (± 40.17) 0.00b (± 0.00)
31. Inocybe lacera 0.25a (± 0.29) 0.00a (± 0.00)
32. Laccaria proxima 46.50a (± 16.01) 197.75b (± 17.12)
33. Laccaria sp. 12.50a (± 12.94) 15.75a (± 18.19)
34. Lactarius camphoratus 0.00a (± 0.00) 4.25a (± 4.91)
35. Lactarius fuscus 12.75a (± 12.52) 2.75a (± 2.47)
36. Leotia viscosa 1.00a (± 1.15) 36.25b (± 4.86)

208
37. Leotiomycetes sp. 1.00a (± 1.15) 23.50b (± 5.62)
38. Magnaporthales sp. 1.25a (± 1.44) 1.25a (± 1.44)
39. Mortierella sp. 2.50a (± 2.89) 14.00a (± 14.31)
40. Mortierellales sp. 8.00a (± 6.99) 59.25b (± 6.25)
41. Mucoromycotina sp. 0.00a (± 0.00) 28.75a (± 33.20)
42. Myrothecium cinctum 18.50a (± 21.36) 0.00a (± 0.00)
43. Myxotrichaceae sp. 22.00a (± 16.46) 21.00a (± 24.25)
44. Oidiodendron maius 9.00a (± 4.03) 26.50b (± 11.27)
45. Penicillium montanense 41.25a (± 4.63) 16.00b (± 5.08)
46. Pezizomycotina sp. 140.25a (± 10.70) 67.50b (± 15.66)
47. Phialocephala fortinii 9.25a (± 5.24) 15.50a (± 11.21)
48. Piloderma lanatum 0.00a (± 0.00) 9.25a (± 10.68)
49. Pyronemataceae sp. 0.00a (± 0.00) 24.75a (± 28.58)
50. Russula aeruginea 12.00a (± 9.80) 31.75a (± 35.13)
51. Russula gracilis 123.50a (± 20.70) 0.25b (± 0.29)
52. Russula sp. 170.75a (± 18.92 ) 454.25b (± 24.52)
53. Russula sphagnophila 44.50a (± 4.28) 86.75b (± 9.11)
54. Russula ventricosipes 0.25a (± 0.29) 5.00a (± 5.77)
55. Russula vesca 41.00a (± 47.34) 24.50a (± 28.29)
56. Russulaceae sp. 359.25a (± 414.83) 0.00a (± 0.00)
57. Scleroderma citrinum 0.00a (± 0.00) 80.50a (± 58.61)
58. Sebacinaceae sp. 14.25a (± 16.45) 159.50b (± 22.06)
59. Sordariales sp. 1.00a (± 0.82) 0.00a (± 0.00)
60. Sordariomycetes sp. 0.25a (± 0.29) 0.25a (± 0.29)
61. Suillus brevipes 206.50a (± 20.04) 0.00b (± 0.00)
62. Thelephoraceae sp. 1555.00a (± 277.48) 0.25b (± 0.29)
63. Tomentella sp. 1.50a (± 0.58) 8.00a (± 9.24)
64. Tremella diploschistina 0.00a (± 0.00) 3.75a (± 4.33)
65. Tricholoma ustale 30.50a (± 34.45) 0.00a (± 0.00)
66. Tricholomataceae sp. 36.75a (± 42.44) 0.00a (± 0.00)
67. Tylospora asterophora 0.00a (± 0.00) 0.50a (± 0.58)
68. Venturiales sp. 3.00a (± 2.05) 2.75a (± 3.18)
69. Wilcoxina mikolae 53.75a (± 37.51) 0.00a (± 0.00)
70. Xerocomus badius 0.25a (± 0.29) 9.25a (± 10.68)
Results are expressed as mean values ± standard error
Means in rows with a common letter are not significantly different based on t-test (p ≥ 0.05).
Limed and Unlimed sites: Daisy Lake 2 (site 1), Wahnapitae Hydro-Dam (site 2), Kelly Lake
(site 3), and Kingsway (site 4).

209
Table S13: The weighed UniFrac distance matrix between sites for fungal community.
Daisy Lake 2
Limed
Daisy Lake 2
Unlimed
Wahnapitae
Hydro-Dam
Limed
Wahnapitae
Hydro-Dam
Unlimed
Kelly Lake
Limed
Kelly Lake
Unlimed
Kingsway
Limed
Kingsway
Unlimed
Daisy Lake 2
Limed 0.00 0.95 0.99 0.97 0.89 0.94 0.97 0.95
Daisy Lake 2
Unlimed
0.00 1.00 0.98 0.97 0.91 0.99 0.96
Wahnapitae
Hydro-Dam
Limed
0.00 1.00 0.99 1.00 0.88 1.00
Wahnapitae
Hydro-Dam
Unlimed
0.00 0.94 0.98 0.98 0.97
Kelly Lake
Limed
0.00 0.90 0.95 0.91
Kelly Lake
Unlimed
0.00 0.97 0.93
Kingsway
Limed
0.00 0.75
Kingsway
Unlimed
0.00

210
PUBLICATIONS
Manuscripts Published (Refereed):
1. R. Narendrula-Kotha and K.K. Nkongolo. 2017. Changes in enzymatic activities in metal
contaminated and reclaimed lands in Northern Ontario (Canada). Ecotoxicology and
Environmental Safety. Vol 140, pg: 241-248.
2. R. Narendrula-Kotha and K.K. Nkongolo. 2017. Bacterial and fungal community structure
and diversity in a mining region under long-term metal exposure revealed by metagenomics
sequencing. Ecological Genetics and Genomics. Vol 2, pg: 13-24.
3. R. Narendrula-Kotha and K.K. Nkongolo. 2017. Microbial response to soil liming of
damaged ecosystems revealed by metagenomics and phospholipid fatty acid analyses. PLoS
One. Vol 12, pg: 1–22.
4. K.K. Nkongolo, P. Michael, G. Theriault, R. Narendrula, P. Castilloux, K.N. Kalubi, P.
Beckett and G. Spiers. 2016. Assessing biological impacts of land reclamation in a mining
region in Canada: Effects of dolomitic lime applications on forest ecosystems and microbial
phospholipid fatty acid signatures. Water, Air and Soil Pollution. Vol 227, Issue 4, pg: 1-13.
5. R. Narendrula and K.K. Nkongolo. 2015. Fatty acids profile of microbial populations in a
mining reclaimed region contaminated with metals: Relation with ecological characteristics
and soil respiration. Journal of Bioremediation and Biodegradation. Vol 6, Issue 2, pg: 1-9.
6. K.N. Kalubi, M. Mehes-Smith, R. Narendrula, P. Michael, A. Omri. 2015. Molecular
analysis of red maple (Acer rubrum) populations from a reclaimed mining region in Northern
Ontario (Canada): soil metal accumulation and translocation in plants. Exotoxicology. Vol
24, Issue 3, pg: 636-647.
7. A. Tran, K.K. Nkongolo, M. Mehes-Smith, R. Narendrula, G. Spiers and P. Beckett. 2014.
Heavy metal analysis in Red oak (Quercus rubra) populations from a mining region in
Northern Ontario (Canada): Effect of soil liming and analysis of genetic variation. American
Journal of Environmental Science. Vol 10, Issue 4, pg: 363-373.
8. G. Mamba-Mbayi, K.K. Nkongolo, R. Narendrula, P. Tshilenge Djim and A. Kalonji-
Mbuyi. 2014. Molecular relatedness and morpho-agronomic characteristics of congolese
accessions of cassava (Manihot esculenta Crantz) for breeding purpose. British
Biotechnology Journal. Vol 4, Issue, 5, pg: 551-565.
9. M. Mehes-Smith, K.K. Nkongolo, R. Narendrula and E. Cholewa. 2014. Mobility of heavy
metals in plants and soil: A case study from a mining region in Canada. American Journal of
Environmental Science. Vol 9, Issue 6, pg: 483-493.

211
10. G. Theriault, K.K. Nkongolo, R. Narendrula and P. Beckett. 2013. Molecular and
ecological characterization of plant populations from limed and metal-contaminated sites in
Northern Ontario (Canada): ISSR analysis of white birch (Betula papyrifera) populations.
Journal of Chemistry and Ecology. Vol 29, Issue 7, pg: 573-585.
11. R. Narendrula, K.K. Nkongolo, P. Beckett and G. Spiers. 2013. Total and bioavailable
metals in two contrasting mining cities (Sudbury in Canada and Lubumbashi in DR-Congo):
relation to genetic variation in plant populations. Chemistry and Ecology. Vol 29, Issue 2,
pg: 111-127.
12. K.K. Nkongolo, G. Spiers, P. Beckett, R. Narendrula, G. Theriault, A. Tran and K.N.
Kalubi. 2012. Long term effects of liming on soil chemistry in stable and eroded upland
areas in a mining region. Journal of Water, Air, and Soil Pollution. Vol 224, Issue 7, pg: 1-
14.
13. K. Mbuya, K.K. Nkongolo, R. Narendrula, A.Kalonji-Mbuyi and R.V. Kizungu. 2012.
Development of quality protein maize (QPM) inbred lines and genetic diversity assessed
with ISSR markers in a maize breeding program. American Journal of Experimental
Agriculture. Vol 2, Issue 4, pg: 626-640.
14. L. Tshilenge-Lukanda, K.K.C. Nkongolo, R. Narendrula, A. Kalonji-Mbuyi and R.V.
Kizungu. 2012. Molecular characterization of ground nut (Arachis hypogaea L.) accessions
from a gene pool: Application of gamma ray radiation. Journal of Plant Breeding and Crop
Science. Vol 4, Issue 11, pg: 175-183.
15. R. Narendrula and K.K. Nkongolo. 2012. Genetic variation in Picea mariana × P. rubens
hybrid populations assessed with ISSR and RAPD markers. American Journal of Plant
Sciences. Vol 3, Issue 6, pg: 731-737.
16. R. Narendrula, K.K. Nkongolo and P. Beckett. 2012. Comparative soil metal analysis in
Sudbury (Ontario, Canada) and Lubumbashi (Katanga, DR-Congo). Bulletin of
Environmental Contamination and Toxicology. Vol 88, Issue 2, pg: 187-192.
Book Chapter:
17. K.K. Nkongolo, R. Narendrula, M. Mehes-Smith, S. Dobrzeniecka, K. Vandeligt, M.
Ranger and P. Beckett. 2010. Genetic Sustainability of fragmented conifer populations from
stressed areas in Northern Ontario (Canada): application of molecular markers. Forest
Ecosystems, Chapter 14, pg: 315-336.

212
Conferences:
1. K.K. Nkongolo, P. Michael, G. Theriault, R. Narendrula, K. Kalubi and N.S. Kim.
Molecular genetic monitoring of reclaimed metal-contaminated lands in mining regions.
Paper presentation at International Conference of the Genetics Society of Korea held in
Seoul, South Korea, December 2015.
2. R. Narendrula. Pyrosequencing analysis of bacterial and fungal diversity in reclaimed lands
in a mining region. Paper presentation at ASA, CSSA and SSSA international annual
meetings held in Minneapolis, Minnesota, USA, November 2015.
3. R. Narendrula, K.K. Nkongolo, G. Theriault, P. Beckett and G. Spiers. Assessing above
and below ground diversity in a mining reclaimed region contaminated with metals. Paper
presentation at the 6th
Mining and Environmental international conference held in Sudbury,
Ontario, Canada, June 2015.
4. K.K. Nkongolo, P. Michael, R. Narendrula. Analysis of soil microbial diversity and
activities in mining reclaimed lands in Northern Ontario: Association with plant population
structure. Paper presentation at ASA, CSSA and SSSA international annual meetings held in
Long Beach, California, USA, November 2014.
5. M. Mehes-Smith, K.K. Nkongolo, P. Michael, R. Narendrula. Comparative analysis of
metal distribution in Poplar (Populus tremuloides) and red maple (Acer rubrum) populations
from reclaimed mining sites: analysis of gene expression. Paper presentation at ASA, CSSA
and SSSA international annual meetings held in Long Beach, California, USA, November
2014.
6. R. Narendrula and K.K. Nkongolo. Cytological stability and molecular variation in Picea
mariana x Picea rubens hybrid populations. Paper presentation at the 9th
Canadian Plant
Biotechnology conference held in Montreal, Quebec, Canada, May 2014.
7. K. Kalubi, M. Mehes-Smith, R. Narendrula, K.K. Nkongolo. Molecular analysis of red
maple (Acer rubrum) populations from areas contaminated with metals in Northern Ontario,
Canada. Paper presentation at ASA, CSSA and SSSA international annual meetings held in
Tampa, Florida, USA, November 2013.
8. R. Narendrula. Ecological and genetic assessment of reclaimed sites in a metal
contaminated region (Northern Ontario, Canada). Paper presentation at ASA, CSSA and
SSSA international annual meetings held in Tampa, Florida, USA, November 2013.
9. M. Mehes-Smith, K.K. Nkongolo, R. Narendrula. Genetic and physiological responses of
Deschampsia Cespitosa to soil metal contamination. Paper presentation at ASA, CSSA and
SSSA international annual meetings held in Tampa, Florida, USA, November 2013.
213
10. L. Tshilenge-Lukanda, K.K.C. Nkongolo, R. Narendrula, A. Kalonji-Mbuyi, R.V. Kizungu
Molecular characterization of Groundnut (Arachis hypogaea L.) accessions from a gene
pool: Application of gamma ray radiations. Paper presentation at ASA, CSSA and SSSA
international annual meetings held in Cincinnati, Ohio, USA, October 2012.
11. A. Tran, K.K. Nkongolo, R. Narendrula. Long term effects of liming on soil and plant
chemistry in stressed areas of a mining region. Paper presentation at ASA, CSSA and SSSA
international annual meetings held in Cincinnati, Ohio, USA, October 2012.
12. K.K. Nkongolo, M. Mehes-Smith, R. Narendrula, P.J. Beckett and G. Spiers. Monitoring
land reclamation and conservation of plant populations from metal-contaminated and
uncontaminated areas in the Greater Sudbury Region using multiple approaches. Paper
presentation at the 5th
Mining and Environmental international conference held in Sudbury,
Ontario, Canada, June 2011.
13. R. Narendrula, K.K. Nkongolo, P. Beckett. Comparative soil metal analyses in Sudbury
(Canada) and Lubumbashi (DR-Congo): two contrasting mining cities with a similar legacy.
Paper presentation at Science for a Changing North II, a Sudbury Restoration Workshop held
in Sudbury, Ontario, Canada, February 2011.
14. R. Narendrula, M. Mehes-Smith, K.K. Nkongolo, C. Roussell, P. Beckett. Genetic analysis
of natural and planted populations of Picea glauca and Pinus strobus growing from Northern
Ontario. Paper presentation at Science for a Changing North II, a Sudbury Restoration
Workshop held in Sudbury, Ontario, Canada, February 2011.
15. R. Narendrula. Effects of heavy metals on plants growing around the Greater Sudbury
region. Paper presentation at Laurentian University open house held in Sudbury, Ontario,
Canada, 2010.
16. S. Dobrzeniecka, R. Narendrula, K.K. Nkongolo, M. Mehes. High level of genetic variation
and cytological stability detected in Picea mariana populations from uplands and lowlands
contaminated with metals. Paper presentation at IUFRO Tree Biotechnology conference held
in Whistler, British Columbia, Canada, June 2009.
17. R. Narendrula. Molecular and cytogenetic characterization of Picea mariana,Picea rubens
and their hybrids. Oral and paper presentation at Laurentian University graduate seminar
held in Sudbury, Ontario, Canada, April 2009.
18. R. Narendrula. Effects of varying amount of light intensity on the growth, yield and
biomass of Mung bean (Vigna radiata L.). Paper presentation for the class Ecophysiology of
Plant stress, Laurentian University, Sudbury, Ontario, Canada, April 2009.
19. R. Narendrula and K.K. Nkongolo. Genetic and cytological analyses of wheat × triticale
lines: Effects of gamma radiation. Oral and paper presentation at Laurentian University
undergraduate seminar held in Sudbury, Ontario, Canada, April 2008.