bioanalytical method development and validation for ......latanoprost estimation as bioanalytical...
TRANSCRIPT
Open AccessResearch Article
Patel et al., J Anal Bioanal Tech 2015, 6:6 DOI: 10.4172/2155-9872.1000284
Volume 6 • Issue 6 • 1000284J Anal Bioanal TechISSN: 2155-9872 JABT, an open access journal
Keywords: Latanoprost; Microemulsion; Acetonitrile; HPLC
IntroductionLatanoprost is a prostaglandin F2α analogue. Its chemical
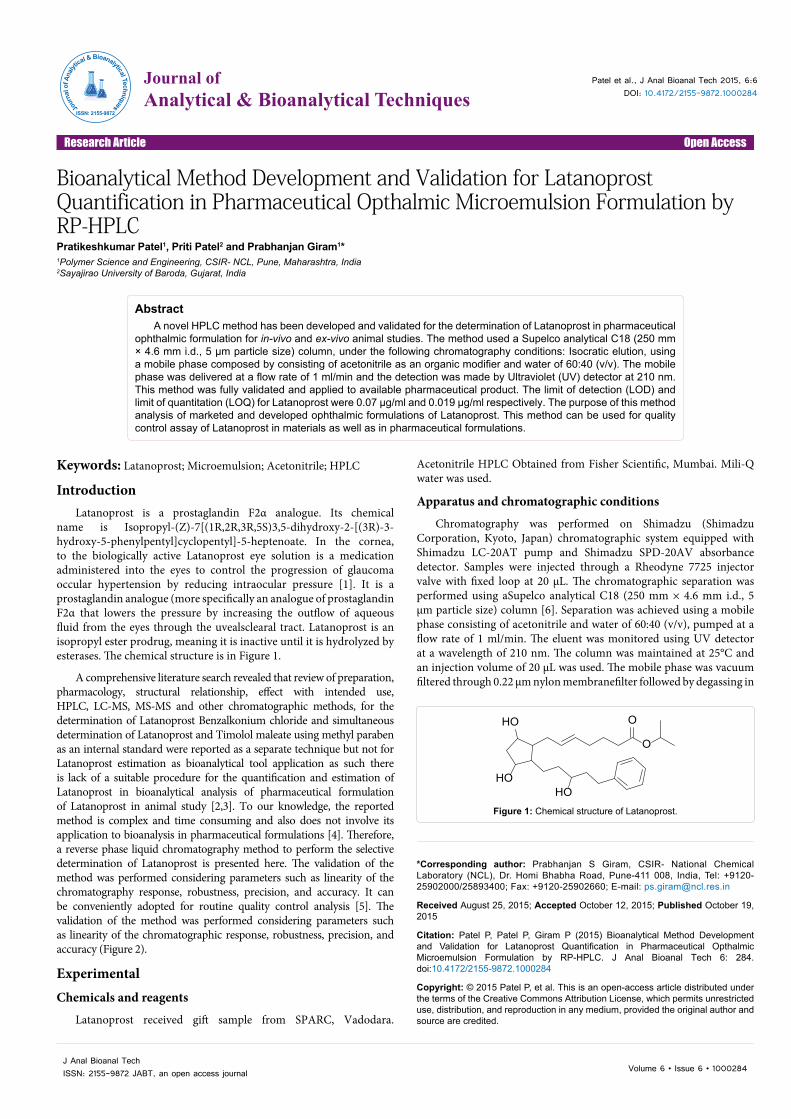
name is Isopropyl-(Z)-7[(1R,2R,3R,5S)3,5-dihydroxy-2-[(3R)-3-hydroxy-5-phenylpentyl]cyclopentyl]-5-heptenoate. In the cornea, to the biologically active Latanoprost eye solution is a medication administered into the eyes to control the progression of glaucoma occular hypertension by reducing intraocular pressure [1]. It is a prostaglandin analogue (more specifically an analogue of prostaglandin F2α that lowers the pressure by increasing the outflow of aqueous fluid from the eyes through the uvealsclearal tract. Latanoprost is an isopropyl ester prodrug, meaning it is inactive until it is hydrolyzed by esterases. The chemical structure is in Figure 1.
A comprehensive literature search revealed that review of preparation, pharmacology, structural relationship, effect with intended use, HPLC, LC-MS, MS-MS and other chromatographic methods, for the determination of Latanoprost Benzalkonium chloride and simultaneous determination of Latanoprost and Timolol maleate using methyl paraben as an internal standard were reported as a separate technique but not for Latanoprost estimation as bioanalytical tool application as such there is lack of a suitable procedure for the quantification and estimation of Latanoprost in bioanalytical analysis of pharmaceutical formulation of Latanoprost in animal study [2,3]. To our knowledge, the reported method is complex and time consuming and also does not involve its application to bioanalysis in pharmaceutical formulations [4]. Therefore, a reverse phase liquid chromatography method to perform the selective determination of Latanoprost is presented here. The validation of the method was performed considering parameters such as linearity of the chromatography response, robustness, precision, and accuracy. It can be conveniently adopted for routine quality control analysis [5]. The validation of the method was performed considering parameters such as linearity of the chromatographic response, robustness, precision, and accuracy (Figure 2).
ExperimentalChemicals and reagents
Latanoprost received gift sample from SPARC, Vadodara.
Acetonitrile HPLC Obtained from Fisher Scientific, Mumbai. Mili-Q water was used.
Apparatus and chromatographic conditions
Chromatography was performed on Shimadzu (Shimadzu Corporation, Kyoto, Japan) chromatographic system equipped with Shimadzu LC-20AT pump and Shimadzu SPD-20AV absorbance detector. Samples were injected through a Rheodyne 7725 injector valve with fixed loop at 20 μL. The chromatographic separation was performed using aSupelco analytical C18 (250 mm × 4.6 mm i.d., 5 μm particle size) column [6]. Separation was achieved using a mobile phase consisting of acetonitrile and water of 60:40 (v/v), pumped at a flow rate of 1 ml/min. The eluent was monitored using UV detector at a wavelength of 210 nm. The column was maintained at 25°C and an injection volume of 20 μL was used. The mobile phase was vacuum filtered through 0.22 μm nylon membranefilter followed by degassing in
*Corresponding author: Prabhanjan S Giram, CSIR- National ChemicalLaboratory (NCL), Dr. Homi Bhabha Road, Pune-411 008, India, Tel: +9120-25902000/25893400; Fax: +9120-25902660; E-mail: [email protected]
Received August 25, 2015; Accepted October 12, 2015; Published October 19, 2015
Citation: Patel P, Patel P, Giram P (2015) Bioanalytical Method Development and Validation for Latanoprost Quantification in Pharmaceutical Opthalmic Microemulsion Formulation by RP-HPLC. J Anal Bioanal Tech 6: 284. doi:10.4172/2155-9872.1000284
Copyright: © 2015 Patel P, et al. This is an open-access article distributed under the terms of the Creative Commons Attribution License, which permits unrestricted use, distribution, and reproduction in any medium, provided the original author and source are credited.
AbstractA novel HPLC method has been developed and validated for the determination of Latanoprost in pharmaceutical
ophthalmic formulation for in-vivo and ex-vivo animal studies. The method used a Supelco analytical C18 (250 mm × 4.6 mm i.d., 5 μm particle size) column, under the following chromatography conditions: Isocratic elution, using a mobile phase composed by consisting of acetonitrile as an organic modifier and water of 60:40 (v/v). The mobile phase was delivered at a flow rate of 1 ml/min and the detection was made by Ultraviolet (UV) detector at 210 nm. This method was fully validated and applied to available pharmaceutical product. The limit of detection (LOD) and limit of quantitation (LOQ) for Latanoprost were 0.07 μg/ml and 0.019 μg/ml respectively. The purpose of this method analysis of marketed and developed ophthalmic formulations of Latanoprost. This method can be used for quality control assay of Latanoprost in materials as well as in pharmaceutical formulations.
Bioanalytical Method Development and Validation for Latanoprost Quantification in Pharmaceutical Opthalmic Microemulsion Formulation by RP-HPLCPratikeshkumar Patel1, Priti Patel2 and Prabhanjan Giram1*1Polymer Science and Engineering, CSIR- NCL, Pune, Maharashtra, India2Sayajirao University of Baroda, Gujarat, India
HO
HO
O
O
HOFigure 1: Chemical structure of Latanoprost.
Journal ofAnalytical & Bioanalytical TechniquesJo
urna
l of A
nalyt
ical & Bioanalytical Techniques
ISSN: 2155-9872
Citation: Patel P, Patel P, Giram P (2015) Bioanalytical Method Development and Validation for Latanoprost Quantification in Pharmaceutical Opthalmic Microemulsion Formulation by RP-HPLC. J Anal Bioanal Tech 6: 284. doi:10.4172/2155-9872.1000284
Page 2 of 5
Volume 6 • Issue 6 • 1000284J Anal Bioanal TechISSN: 2155-9872 JABT, an open access journal
an ultrasonic bath prior to use [7]. Data acquisition and integration was performed using LC solution software (Spincho Biotech, Vadodara).
Preparation of mobile phase
Three mg Latanoprost was accurately weighed in 25 ml volumetric flask. Approximate 15 ml acetonitrile was added and vortex mixed to dissolve drug into acetonitrile. The final volume was adjusted upto 25 ml mark with acetonitrile to prepare stock solution of concentration 120 μg/ml.
Preparation of standard solution
2.5 ml of above stock solution was added to 10 ml volumetric flask and diluted to 10 ml with acetonitrile to produce 30 μg/ml. From this solution 1 ml of 30 μg/ml was taken in 10 ml volumetric flask and diluted with mobile phase to prepare 10 μg/ml of working standard solution.
Sample preparation for calibration curve of Latanoprost
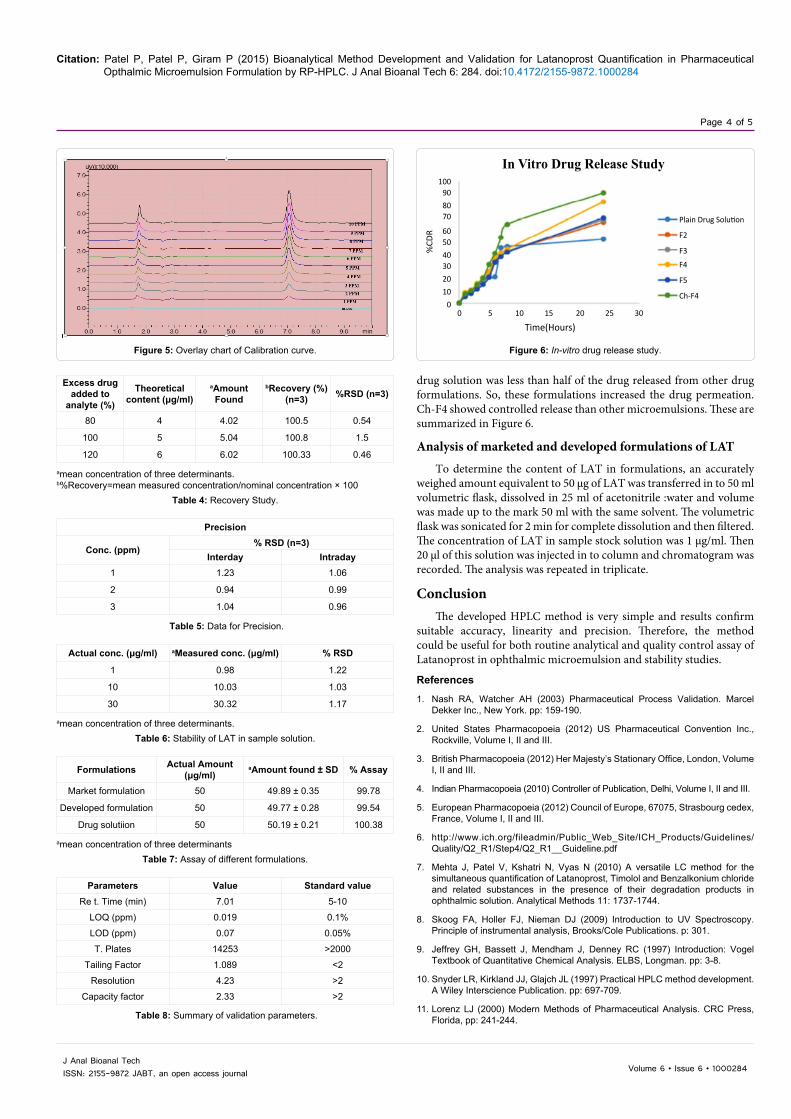
Aliquots ranging from 1 ml to 10 ml were taken from working standard solution, in 10 ml volumetric flask and diluted to 10 ml with mobile phase to give final concentration of 1, 2, 3, 4, 5, 6, 7, 8, 9, 10 μg/ml. Injections of 20 μl were made for each concentration and chromatographed under the condition described in Table 1 Calibration graph was constructed by plotting peak area versus concentration of Latanoprost and the regression equation was calculated [8-10].
Robustness
To evaluate LC method robustness, a few parameters were deliberately varied [11]. The parameters included variation of flow rate, percentage of acetonitrile in the mobile phase and acetonitrile of different lots. Robustness of the method was done at three different concentration levels 2.5, 5, 7.5 μg/ml, respectively. Each factor selected (except solvents of different lots) to examine were changed at three levels (-1, 0, 1). One factor at the time was changed to estimate the effect. Thus replicate injections (n=3) of standard solution at three concentration levels were performed under small changes of three chromatographic parameters (factors).
Linearity
The calibration curves (n=3) constructed for LAT were checked for linearity over the concentration range of 1-10 μg/ml. Peak areas of LAT were plotted versus LAT concentration and linear regression analysis was performed on the resultant curves [12].
Accuracy
The known quantity of the drug substance corresponding to 80, 100, 120% of standard LAT and the mixture were analyzed by the proposed method. At each level of the amounts six determinations were performed. This was done to check the accuracy of the drug at different levels in the formulations [13].
Precision
Six injections of three different concentrations (1, 3, 5 μg/ml) were given on the same day and the values of the % RSD were calculated to determine intra-day precision. Three injections of three different concentrations (1, 3, 5 μg/ml) were given on three different days to determine inter-day precision.
Limit of quantitation (LOQ) and limit of detection (LOD)
The LOQ and LOD were determined based on a signal-to- noise ratios and were based on analytical responses of 10 and 3 times the background noise respectively. LOD and LOQ were experimentally verified by diluting known concentration of LAT until the average responses were approximately 3 or 10 times the standard deviation of the responses for six replicate determinations.
Stability in sample solutions
Three different concentrations of LAT (1, 3, 5 μg/ml) were prepared from sample solution and stored at room temperature for 2 days. They were then injected into HPLC system [14].
Analysis of marketed and developed formulations of LATTo determine the content of LAT in formulations, an accurately
weighed amount equivalent to 50 μg of LAT was transferred in to 50 ml volumetric flask, dissolved in 25 ml of acetonitrile :water and volume was made up to the mark with the same solvent. The volumetric flask was sonicated for 2 min for complete dissolution and then filtered. The concentration of LAT in sample stock solution was 1 μg/ml. Then 20 μl of this solution was injected in to column and chromatogram was recorded. The analysis was repeated in triplicate [15].
ResultsValidation of HPLC method
The method was validated with respect to parameters including Linearity, Limit of Quantitation (LOQ), Limit of Detection (LOD), Precision, Recovery and Selectivity.
Validation of developed HPLC method was carried out as per ICH guidelines Q2 (R1). Table 1 Optimized parameters of HPLC method.
Robustness
Results, presented in Table 2 indicate that the selected factors remained unaffected by small variation of these parameters. It was also found that acetonitrile of different lots from the same manufacture has no significant influence on the determination.
Insignificant difference in assay (%) and less variability in retention time were observed. Table 2 a Robustness Evaluation.
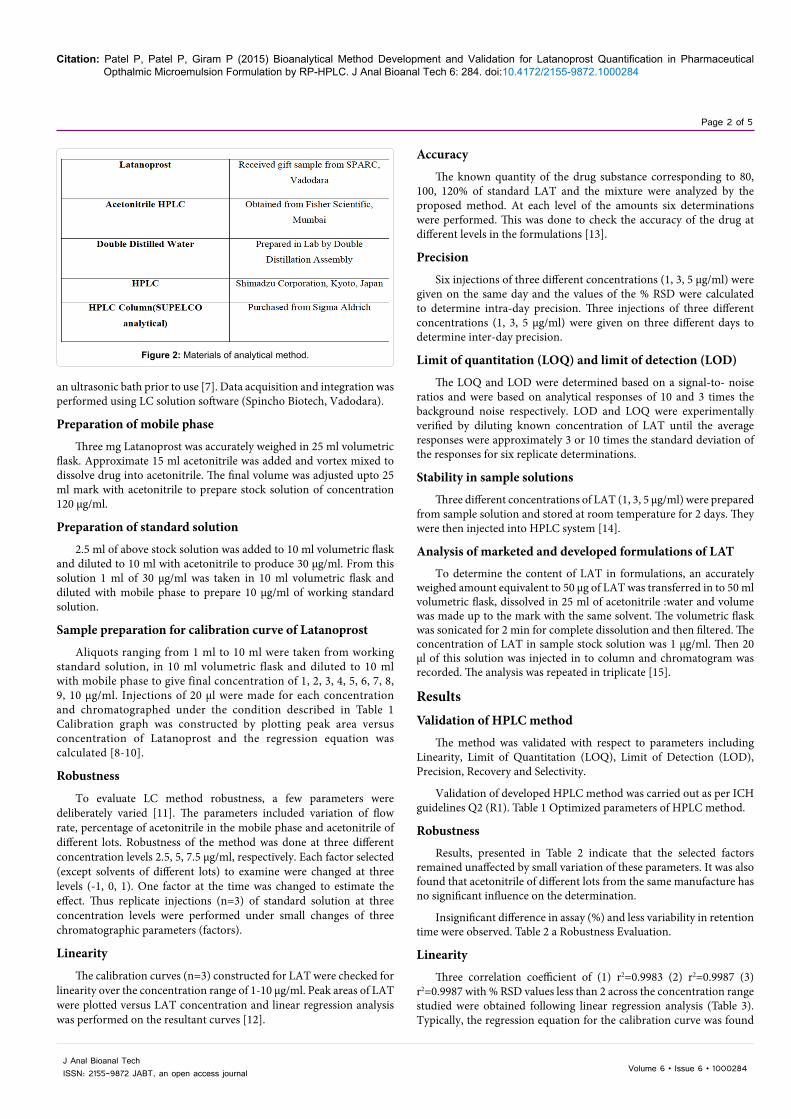
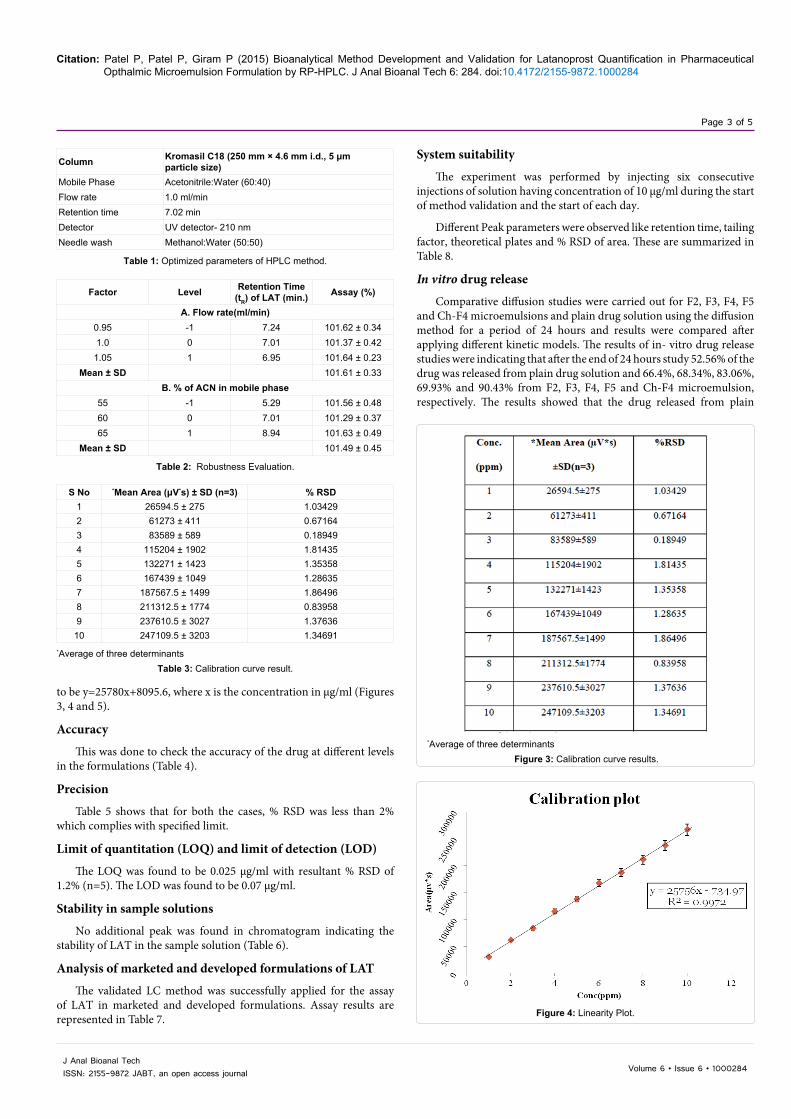
Linearity
Three correlation coefficient of (1) r2=0.9983 (2) r2=0.9987 (3) r2=0.9987 with % RSD values less than 2 across the concentration range studied were obtained following linear regression analysis (Table 3). Typically, the regression equation for the calibration curve was found
Figure 2: Materials of analytical method.
Citation: Patel P, Patel P, Giram P (2015) Bioanalytical Method Development and Validation for Latanoprost Quantification in Pharmaceutical Opthalmic Microemulsion Formulation by RP-HPLC. J Anal Bioanal Tech 6: 284. doi:10.4172/2155-9872.1000284
Page 3 of 5
Volume 6 • Issue 6 • 1000284J Anal Bioanal TechISSN: 2155-9872 JABT, an open access journal
to be y=25780x+8095.6, where x is the concentration in μg/ml (Figures 3, 4 and 5).
Accuracy
This was done to check the accuracy of the drug at different levels in the formulations (Table 4).
Precision
Table 5 shows that for both the cases, % RSD was less than 2% which complies with specified limit.
Limit of quantitation (LOQ) and limit of detection (LOD)
The LOQ was found to be 0.025 μg/ml with resultant % RSD of 1.2% (n=5). The LOD was found to be 0.07 μg/ml.
Stability in sample solutions
No additional peak was found in chromatogram indicating the stability of LAT in the sample solution (Table 6).
Analysis of marketed and developed formulations of LAT
The validated LC method was successfully applied for the assay of LAT in marketed and developed formulations. Assay results are represented in Table 7.
System suitability
The experiment was performed by injecting six consecutive injections of solution having concentration of 10 μg/ml during the start of method validation and the start of each day.
Different Peak parameters were observed like retention time, tailing factor, theoretical plates and % RSD of area. These are summarized in Table 8.
In vitro drug release
Comparative diffusion studies were carried out for F2, F3, F4, F5 and Ch-F4 microemulsions and plain drug solution using the diffusion method for a period of 24 hours and results were compared after applying different kinetic models. The results of in- vitro drug release studies were indicating that after the end of 24 hours study 52.56% of the drug was released from plain drug solution and 66.4%, 68.34%, 83.06%, 69.93% and 90.43% from F2, F3, F4, F5 and Ch-F4 microemulsion, respectively. The results showed that the drug released from plain
Column Kromasil C18 (250 mm × 4.6 mm i.d., 5 μmparticle size)
Mobile Phase Acetonitrile:Water (60:40)Flow rate 1.0 ml/minRetention time 7.02 minDetector UV detector- 210 nmNeedle wash Methanol:Water (50:50)
Table 1: Optimized parameters of HPLC method.
Factor Level Retention Time (tR) of LAT (min.) Assay (%)
A. Flow rate(ml/min)0.95 -1 7.24 101.62 ± 0.341.0 0 7.01 101.37 ± 0.421.05 1 6.95 101.64 ± 0.23
Mean ± SD 101.61 ± 0.33B. % of ACN in mobile phase
55 -1 5.29 101.56 ± 0.4860 0 7.01 101.29 ± 0.3765 1 8.94 101.63 ± 0.49
Mean ± SD 101.49 ± 0.45
Table 2: Robustness Evaluation.
S No *Mean Area (μV*s) ± SD (n=3) % RSD1 26594.5 ± 275 1.034292 61273 ± 411 0.671643 83589 ± 589 0.189494 115204 ± 1902 1.814355 132271 ± 1423 1.353586 167439 ± 1049 1.286357 187567.5 ± 1499 1.864968 211312.5 ± 1774 0.839589 237610.5 ± 3027 1.3763610 247109.5 ± 3203 1.34691
*Average of three determinantsTable 3: Calibration curve result.
*Average of three determinants
Figure 3: Calibration curve results.
Figure 4: Linearity Plot.
Citation: Patel P, Patel P, Giram P (2015) Bioanalytical Method Development and Validation for Latanoprost Quantification in Pharmaceutical Opthalmic Microemulsion Formulation by RP-HPLC. J Anal Bioanal Tech 6: 284. doi:10.4172/2155-9872.1000284
Page 4 of 5
Volume 6 • Issue 6 • 1000284J Anal Bioanal TechISSN: 2155-9872 JABT, an open access journal
Figure 5: Overlay chart of Calibration curve.
100908070
605040302010
00 5 10 15 20 25 30
Time(Hours)
Plain Drug Solution
F2
F3
F4
F5
Ch-F4
%CD
R
In Vitro Drug Release Study
Figure 6: In-vitro drug release study.
Excess drug added to
analyte (%)
Theoretical content (μg/ml)
aAmount Found
bRecovery (%) (n=3) %RSD (n=3)
80 4 4.02 100.5 0.54
100 5 5.04 100.8 1.5
120 6 6.02 100.33 0.46
amean concentration of three determinants.b%Recovery=mean measured concentration/nominal concentration × 100
Table 4: Recovery Study.
Precision
Conc. (ppm)% RSD (n=3)
Interday Intraday1 1.23 1.06
2 0.94 0.99
3 1.04 0.96
Table 5: Data for Precision.
Actual conc. (μg/ml) aMeasured conc. (μg/ml) % RSD
1 0.98 1.22
10 10.03 1.03
30 30.32 1.17
amean concentration of three determinants.Table 6: Stability of LAT in sample solution.
Formulations Actual Amount (μg/ml)
aAmount found ± SD % Assay
Market formulation 50 49.89 ± 0.35 99.78
Developed formulation 50 49.77 ± 0.28 99.54
Drug solutiion 50 50.19 ± 0.21 100.38
amean concentration of three determinantsTable 7: Assay of different formulations.
Parameters Value Standard valueRe t. Time (min) 7.01 5-10
LOQ (ppm) 0.019 0.1%
LOD (ppm) 0.07 0.05%
T. Plates 14253 >2000
Tailing Factor 1.089 <2
Resolution 4.23 >2
Capacity factor 2.33 >2
Table 8: Summary of validation parameters.
drug solution was less than half of the drug released from other drug formulations. So, these formulations increased the drug permeation. Ch-F4 showed controlled release than other microemulsions. These are summarized in Figure 6.
Analysis of marketed and developed formulations of LAT
To determine the content of LAT in formulations, an accurately weighed amount equivalent to 50 μg of LAT was transferred in to 50 ml volumetric flask, dissolved in 25 ml of acetonitrile :water and volume was made up to the mark 50 ml with the same solvent. The volumetric flask was sonicated for 2 min for complete dissolution and then filtered. The concentration of LAT in sample stock solution was 1 μg/ml. Then 20 μl of this solution was injected in to column and chromatogram was recorded. The analysis was repeated in triplicate.
ConclusionThe developed HPLC method is very simple and results confirm
suitable accuracy, linearity and precision. Therefore, the method could be useful for both routine analytical and quality control assay of Latanoprost in ophthalmic microemulsion and stability studies.
References
1. Nash RA, Watcher AH (2003) Pharmaceutical Process Validation. Marcel Dekker Inc., New York. pp: 159-190.
2. United States Pharmacopoeia (2012) US Pharmaceutical Convention Inc., Rockville, Volume I, II and III.
3. British Pharmacopoeia (2012) Her Majesty’s Stationary Office, London, Volume I, II and III.
4. Indian Pharmacopoeia (2010) Controller of Publication, Delhi, Volume I, II and III.
5. European Pharmacopoeia (2012) Council of Europe, 67075, Strasbourg cedex, France, Volume I, II and III.
6. http://www.ich.org/fileadmin/Public_Web_Site/ICH_Products/Guidelines/Quality/Q2_R1/Step4/Q2_R1__Guideline.pdf
7. Mehta J, Patel V, Kshatri N, Vyas N (2010) A versatile LC method for the simultaneous quantification of Latanoprost, Timolol and Benzalkonium chloride and related substances in the presence of their degradation products in ophthalmic solution. Analytical Methods 11: 1737-1744.
8. Skoog FA, Holler FJ, Nieman DJ (2009) Introduction to UV Spectroscopy. Principle of instrumental analysis, Brooks/Cole Publications. p: 301.
9. Jeffrey GH, Bassett J, Mendham J, Denney RC (1997) Introduction: Vogel Textbook of Quantitative Chemical Analysis. ELBS, Longman. pp: 3-8.
10. Snyder LR, Kirkland JJ, Glajch JL (1997) Practical HPLC method development. A Wiley Interscience Publication. pp: 697-709.
11. Lorenz LJ (2000) Modern Methods of Pharmaceutical Analysis. CRC Press, Florida, pp: 241-244.
Citation: Patel P, Patel P, Giram P (2015) Bioanalytical Method Development and Validation for Latanoprost Quantification in Pharmaceutical Opthalmic Microemulsion Formulation by RP-HPLC. J Anal Bioanal Tech 6: 284. doi:10.4172/2155-9872.1000284
Page 5 of 5
Volume 6 • Issue 6 • 1000284J Anal Bioanal TechISSN: 2155-9872 JABT, an open access journal
14. Morgan PV, Proniuk S, Blanchard J, Noecker RJ (1999) Effect of temperatureand light on the stability of latanoprost and its clinical relevance. J Glaucoma10: 401-405.
15. Redulescu V, Doneanu C, Mandruta C, Cocu F (1997) HPLC analysis of some synthetic prostaglandin compounds of therapeutic interest. Rev Roum Chim45: 1129-1135.
12. Mermet JM, Otto M, Valcarcel M, Widmer HM, Kellner R (2004) AnalyticalChemistry. Wiley-VCH, UK. pp: 533-534.
13. Rele RV, Mhatre VV, Parab JM, Warkar CB (2011) Simultaneous RP HPLCdetermination of Latanoprost and Timolol Maleate in combined pharmaceutical dosage form. J Chem Pharm Res 3: 138-144.