big bazaar (jyoti)
TRANSCRIPT
PROJECT REPORT ON BIG BAZAAR In Partial Fulfillment of Award of Post Graduate Diploma in Business Management
By
JYOTI SHARMA (212)
(PGDBM)ENTREPRENEURSHIP AND MANAGEMENT PROCESSES INTERNATIONAL
NEW DELHI-74
March 2011
Table of Contents
1. INTRODUCTION TO RETAIL INDUSTRY……………………………………………………….
2. PROFILE OF BIG BAZZAR (KORAMANGLA) ……………………………………………………….. 3. SAMPLING ……………………………………………………… 4. QUESTIONNAIRE ………………………………………………………... 5. FINDINGS AND SUGGESTIONS..…….…………………………………….
6. RECCOMENDATIONS AND CONCLUSION………………………………………………………………
RETAIL INDUSTRY IN INDIA
India has one of the largest numbers of retail outlets in the world. Of the 12
million retail outlets present in the country, nearly 5 million sell food and
related products. Thought the market has been dominated by unorganized
players, the entry of domestic and international organised players is set to
change the scenario.
Organized retail segment has been growing at a blistering pace, exceeding all
previous estimates. According to a study by Deloitte Haskins and Sells,
organised retail has increased its share from 8 per cent of total retail sales in
2007 to 10 per cent in 2008. The fastest growing segments have been the
wholesale cash and carry stores (150 per cent) followed by supermarkets (100
per cent) and hypermarkets (75-80 per cent). Further, it estimates the
organised segment to account for 25 per cent of the total sales by 2011.
India retail industry is the largest industry in India, with an employment of
around 8% and contributing to over 10% of the country's GDP. Retail
industry in India is expected to rise 25% yearly being driven by strong
income growth, changing lifestyles, and favourable demographic patterns.
PROFILE OF BIG BAZZAR
Big Bazaar is not just another hypermarket. It caters to every need of a family.
Where Big Bazaar scores over other stores is its value for money proposition for
the Indian customers. At Big Bazaar, one can get the best products at the best
prices – that is what they guarantee. With the ever increasing array of private
labels, it has opened the doors into the world of fashion and general merchandise
including home furnishings, utensils, crockery, cutlery, sports goods and much
more at prices that will surprise you. And this is just the beginning. Big Bazaar
plans to add much more to complete the shopping experience. Food is the main
shopped for category in this store.
Parent Company:- Pantaloon Retail (India) Limited, is India’s leading retailer
that operates multiple retail formats in both the value and lifestyle segment of the
Indian consumer market.
LINES OF BUSINESS OF THE ABOVE STORE:-
E-tailing
Food
Fashion
Home Solution
General Merchandise
Leisure and Entertainment
Wellness and Beauty
Books and Music
Marketing Strategy:- Big Bazaar is an Indian personification of retail.
It's like an Indian bazaar or mandi or mela, the environment created by traders
to give shoppers a sense of moment. Its personality is of being an entity away
from fancy or pretty and being authentically "no-frills". Kishore Biyani never hired
any foreign consultant for Big Bazaar which is evident from Indian-specific
personality of the brand. The brand's personality is self-explanatory by its tag-line
only. This statement places Big Bazaar at the top of customer's mind. It reflects
that entrepreneurship and simplicity are the essence of character of Big Bazaar.
To use predatory pricing is not in the personality of Big Bazaar, they never sell
goods below the price they have purchased it. Big Bazaar, the "Indian Wal-Mart",
is the modern Indian family's favorite store. Big Bazaar symbolizes modern retail,
the business which isn't looked up to in our country, is now in the eyes of many
multi-national biggies. Big Bazaar has shown a robust growth in recent years.
Scope and Uses:
1. It will extend to the actual field study of these outlets in NCR region.
2. It will give information to prospective customers.
3. Help us gain independent knowledge about the consumer perception of the
outlets identified.
4. The study can help the companies get additional research information.
5. It facilitates evaluation of brand name and customer satisfaction.
ANALYSIS AND INTERPRETATION:
The tools and methods of data collection identified earlier were employed to
gather data on the consumer perception on Big Bazaar. The data accrued,
especially from the interviews and questionnaires circulated, are tabulated and
depicted on graphs in the following pages. The data thus gathered and tabulated
is analysed. The data is then scrutinized and relevant interpretations are drawn.
The major objectives of analysis of data are:
1. To evaluate and enhance data quality
2. Examine effects of other relevant factors
3. CUSTOMER SATISFACTION RATIO, 4. LEVEL OF SATISFACTION, 5. CAUSES OF DISATISFACTION,
6. CUSTOMER RESPONSES REGARDING SERVICES
The data collection plan, including procedures, instruments, and forms, was
designed and pre-tested to maximize accuracy. All data collection activities were
monitored to ensure adherence to the data collection protocol and to prompt
actions to minimize and resolve missing and questionable data. Monitoring
procedures were instituted at the outset and maintained throughout the study,
since the faster irregularities can be detected; the greater the likelihood that they
can be resolved in a satisfactory manner and the sooner preventive measures can
be instituted.
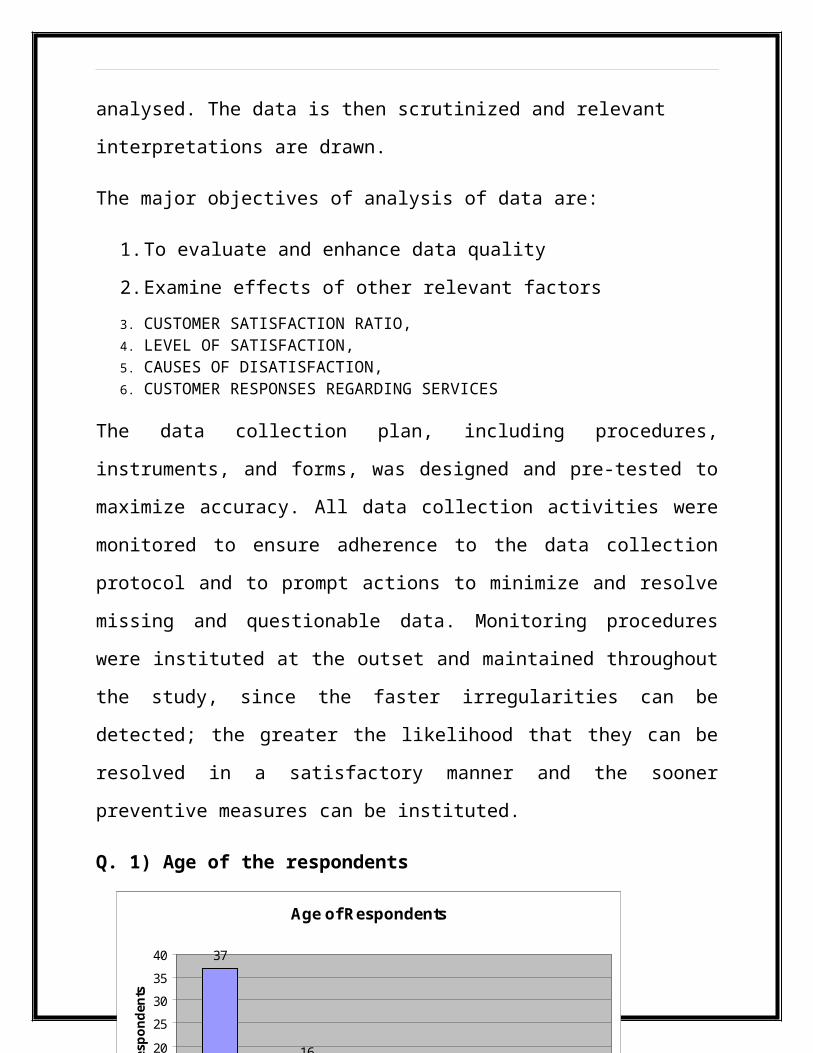
Q. 1) Age of the respondents
Analysis
Age of Respondents
37
16
8 9
5
0
5
10
15
20
25
30
35
40
18-28 28-38 38-48 48-58 58-65
Age
No
of
Res
po
nd
ents
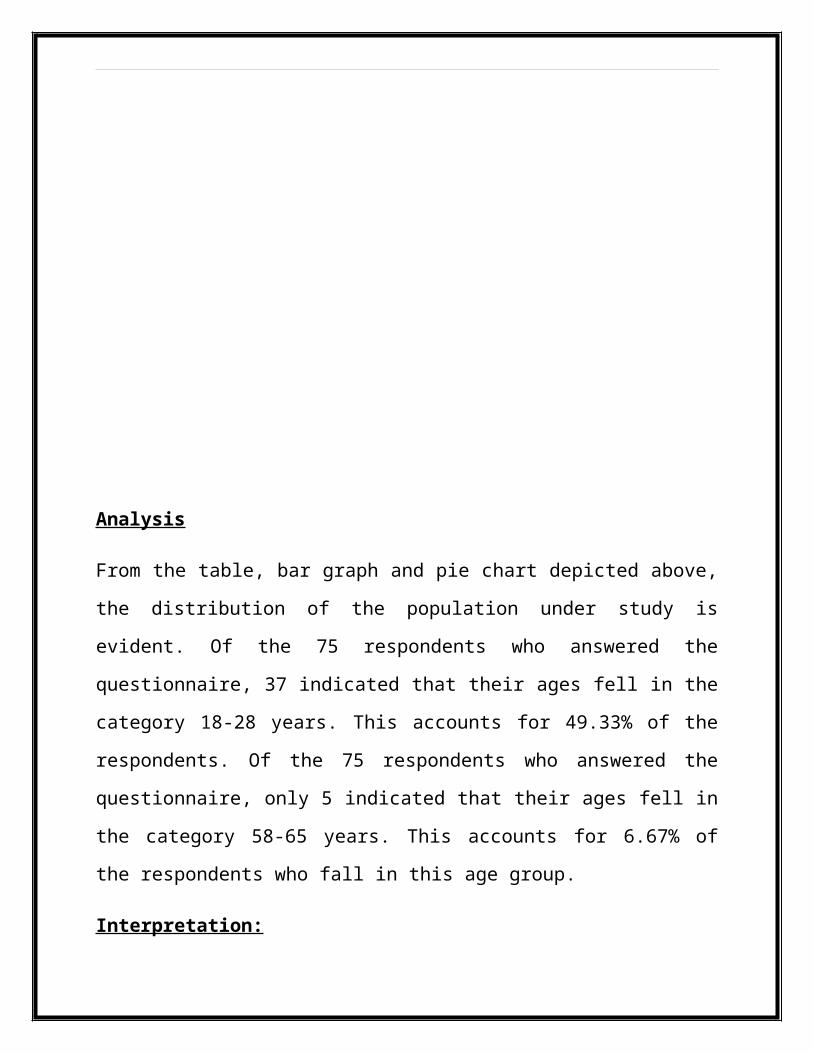
From the table, bar graph and pie chart depicted above, the distribution of the
population under study is evident. Of the 75 respondents who answered the
questionnaire, 37 indicated that their ages fell in the category 18-28 years. This
accounts for 49.33% of the respondents. Of the 75 respondents who answered
the questionnaire, only 5 indicated that their ages fell in the category 58-65 years.
This accounts for 6.67% of the respondents who fall in this age group.
Interpretation:
This question is aimed at analyzing the distribution of ages of the population that
visit the stores under study. The age groups laid before the respondent have been
the result of observation and interview. By analysing the responses to this
question, I, as a researcher, as well as companies, can identify the demographics
of the population that visit retail outlets.
The highest number of respondents falls in the age group 18-28. It can be
deduced that most of the consumers who visit retail outlets regularly are the
youth. They make up almost half of the population who shop at retail stores.
It is not surprising that the youth most frequent malls and retail stores. What is
unexpected, however, is the fact that more people who fall into the older age
group visit the retail stores than those who fall in the middle age group. Then
again, this deduction cannot be applied to the entire population of Bangalore. The
disparity can be attributed to the small size of the sample under study.
Q. 2) Gender of the respondents:
Analysis
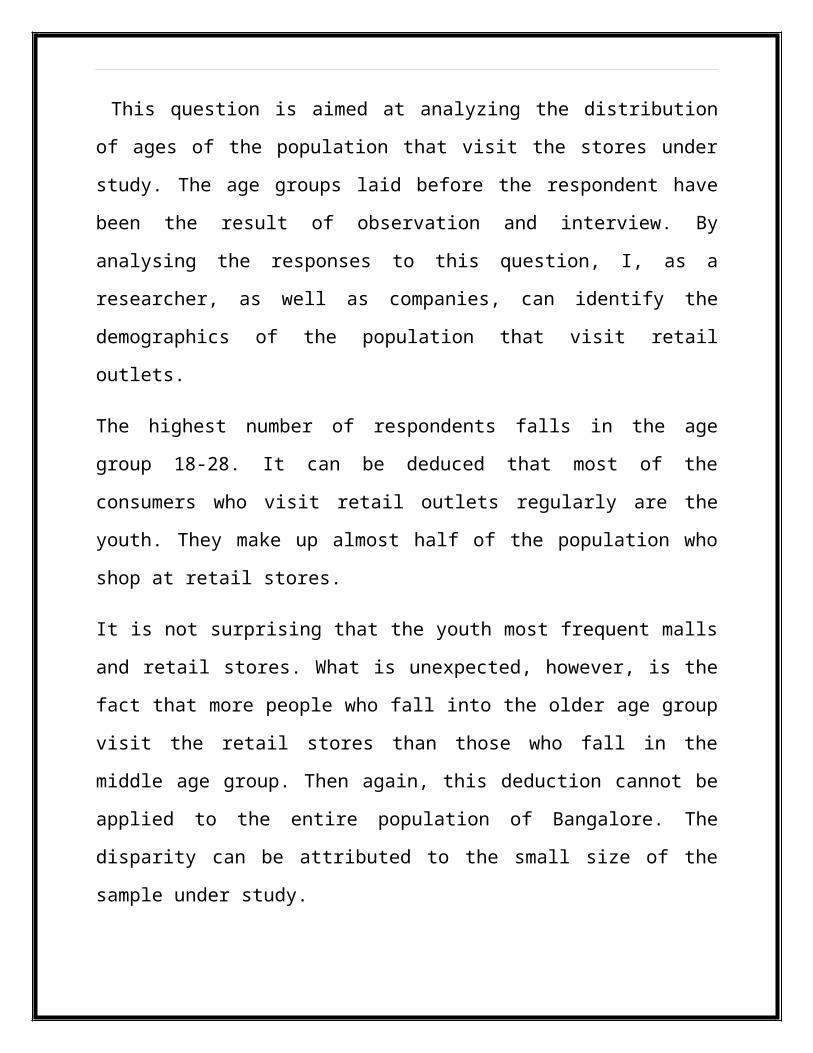
From the table, bar graph and pie chart depicted above, the distribution of the
consumers is evident. Of the 75 respondents who answered the questionnaire, 40
were female. This accounts for 53.33% of the respondents, almost half of the
population under study.
Of the 75 respondents who answered the questionnaire, the rest 35 were male.
This accounts for 46.67% of the population under study.
Interpretation
This question is aimed at identifying the distribution between the two genders
and how many of them visit the retail stores under study. By analysing the
responses to this question, I as ,a researcher, as well as companies, can identify
the distribution in the number of men and women who
Visit the retail outlets and appropriate decisions can be made keeping these
numbers in mind.
Gender of Respondents
Male46.67%Female
53.33%
The highest number of respondents were female, as is depicted by the graph and
chart presented above. The number of male respondents was less compared to
the female respondents.
This can help the companies and researchers in undertaking future decisions and
studies. Since more women can be inferred to visit retail stores than men,
companies can target their offerings and marketing strategies in two areas. Retail
outlets can appeal to the women customers by offering more products geared
especially towards women. They can provide a shopping experience that women
are particularly attracted to.
Another way that retail chains can use the above data is to appeal to the men
rather than the women. Since, fewer men visit retail stores as against women, the
companies have a large base of potential customers. By providing products that
are geared towards men and by providing a shopping experience that attracts
men, the retail chains can expand their customer base.
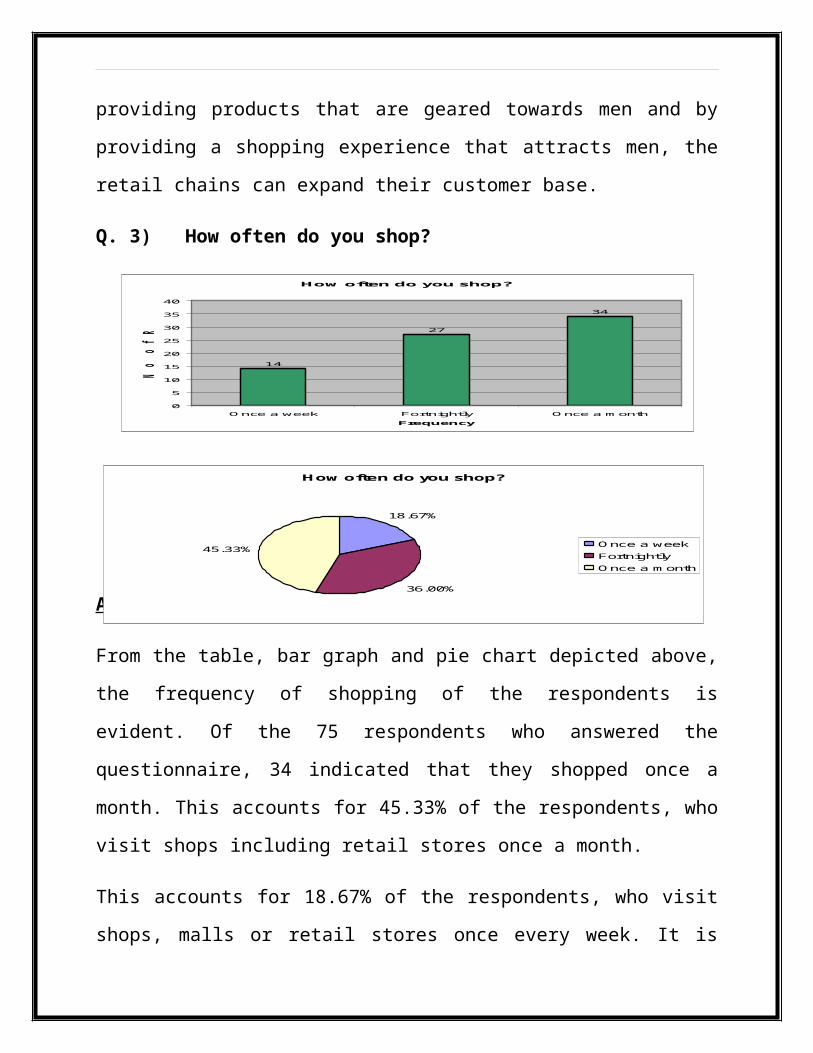
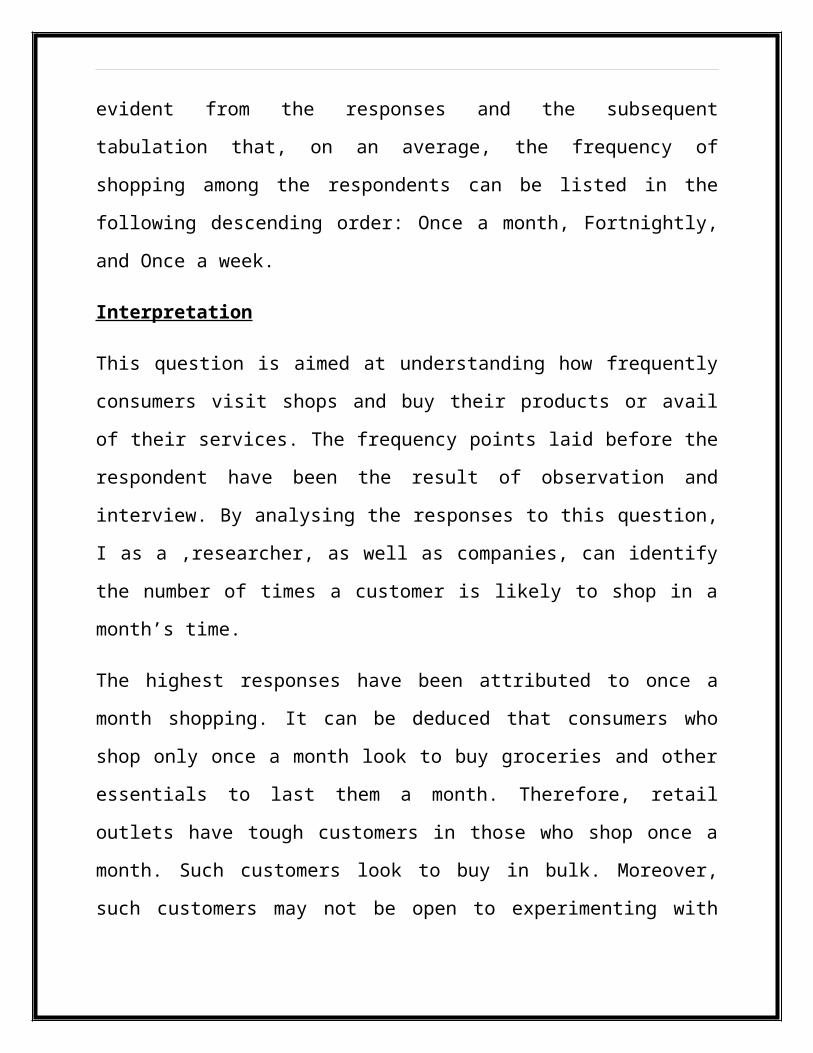
Q. 3) How often do you shop?
How often do you shop?
14
27
34
0
5
10
15
20
25
30
35
40
Once a week Fortnightly Once a month
Frequency
No
o
f R
esp
on
den
ts
How often do you shop?
18.67%
36.00%
45.33%Once a week
Fortnightly
Once a month
Analysis
From the table, bar graph and pie chart depicted above, the frequency of
shopping of the respondents is evident. Of the 75 respondents who answered the
questionnaire, 34 indicated that they shopped once a month. This accounts for
45.33% of the respondents, who visit shops including retail stores once a month.
This accounts for 18.67% of the respondents, who visit shops, malls or retail
stores once every week. It is evident from the responses and the subsequent
tabulation that, on an average, the frequency of shopping among the respondents
can be listed in the following descending order: Once a month, Fortnightly, and
Once a week.
Interpretation
This question is aimed at understanding how frequently consumers visit shops
and buy their products or avail of their services. The frequency points laid before
the respondent have been the result of observation and interview. By analysing
the responses to this question, I as a ,researcher, as well as companies, can
identify the number of times a customer is likely to shop in a month’s time.
The highest responses have been attributed to once a month shopping. It can be
deduced that consumers who shop only once a month look to buy groceries and
other essentials to last them a month. Therefore, retail outlets have tough
customers in those who shop once a month. Such customers look to buy in bulk.
Moreover, such customers may not be open to experimenting with new stores.
Hence, to capture this market, retail outlets must put in place strategies that
attract them. Once they profess a liking to a certain store, they turn out to be very
loyal customers.
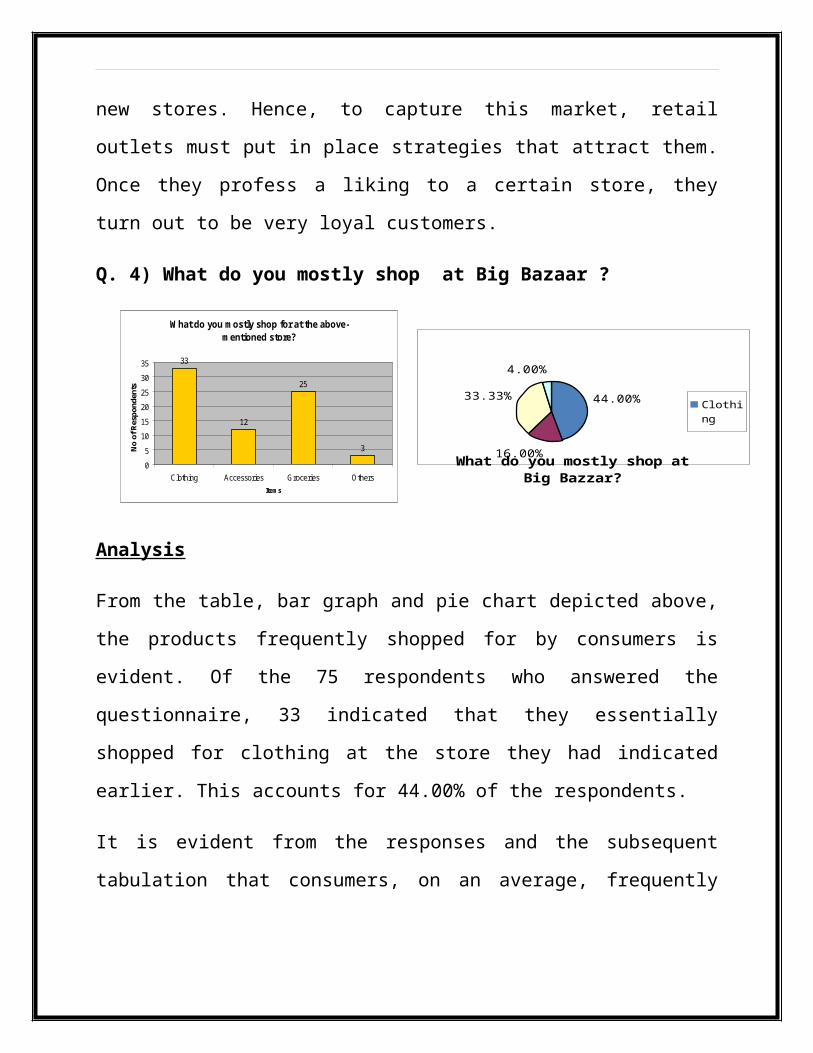
Q. 4) What do you mostly shop at Big Bazaar ?
Analysis
From the table, bar graph and pie chart depicted above, the products frequently
shopped for by consumers is evident. Of the 75 respondents who answered the
questionnaire, 33 indicated that they essentially shopped for clothing at the store
they had indicated earlier. This accounts for 44.00% of the respondents.
It is evident from the responses and the subsequent tabulation that consumers,
on an average, frequently shop for products in the following descending order:
Clothing, Groceries, Accessories, and Others.
Interpretation
This question is aimed at identifying the products consumers shop for frequently
at retail outlets. The product categories laid before the respondent are the result
of observation and interview. By analysing the responses to this question, we, the
44.00%
16.00%
33.33%
4.00%
What do you mostly shop at Big Bazzar?
ClothingAc-ces-sories
What do you mostly shop for at the above-mentioned store?
33
12
25
3
0
5
10
15
20
25
30
35
Clothing Accessories Groceries Others
Items
No
of R
espo
nden
ts
researchers, as well as companies, can identify the main attractions of products
and services offered.
The high number of responses indicate that a large number of consumers visit
retail outlets for clothes/dresses/apparel. Accoutrement is the hottest selling item
that any retail outlet can provide. One-third of the respondents indicated that the
visit retail outlets to purchase groceries. To the retail stores, the above tabulated
responses lead to a very important result. Clothing is the fastest moving
consumer good. Retail outlets that provide apparel can see a higher rate of
turnover and sales volume. However, the above results cannot be assumed to be
representative of the entire population of Bangalore city. The sample size consists
of only 75 respondents, who were approached on a random basis as they visited
the retail outlets.
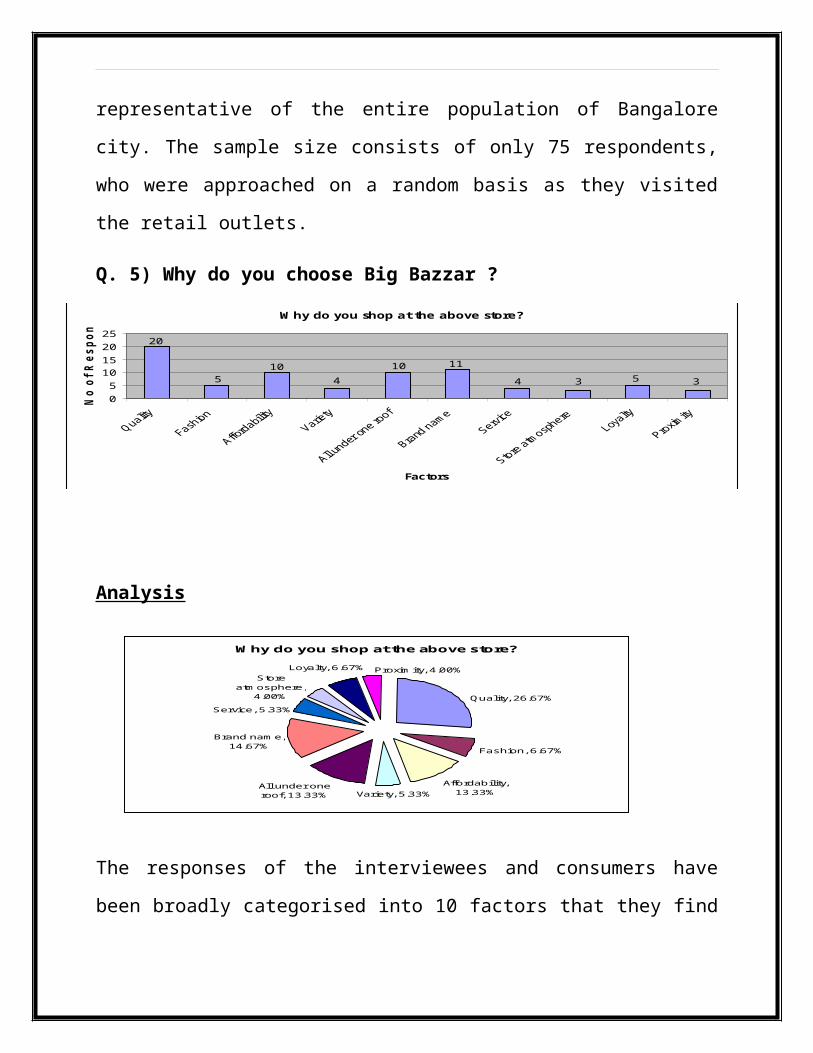
Q. 5) Why do you choose Big Bazzar ?
Why do you shop at the above store?
4
20
5
10
4
10 11
3 5 3
0
5
10
15
20
25
Factors
No
of
Re
sp
on
de
nts
Analysis
The responses of the interviewees and consumers have been broadly categorised
into 10 factors that they find impact their shopping decision and result in their
choosing one store over another.
Of the all respondents who answered the questionnaire, 20 replied that quality of
the products is generally the main reason they choose to shop at specific stores.
This accounts for 26.67% of the respondents, who replied saying quality was the
reason why they shopped at the store indicated earlier.
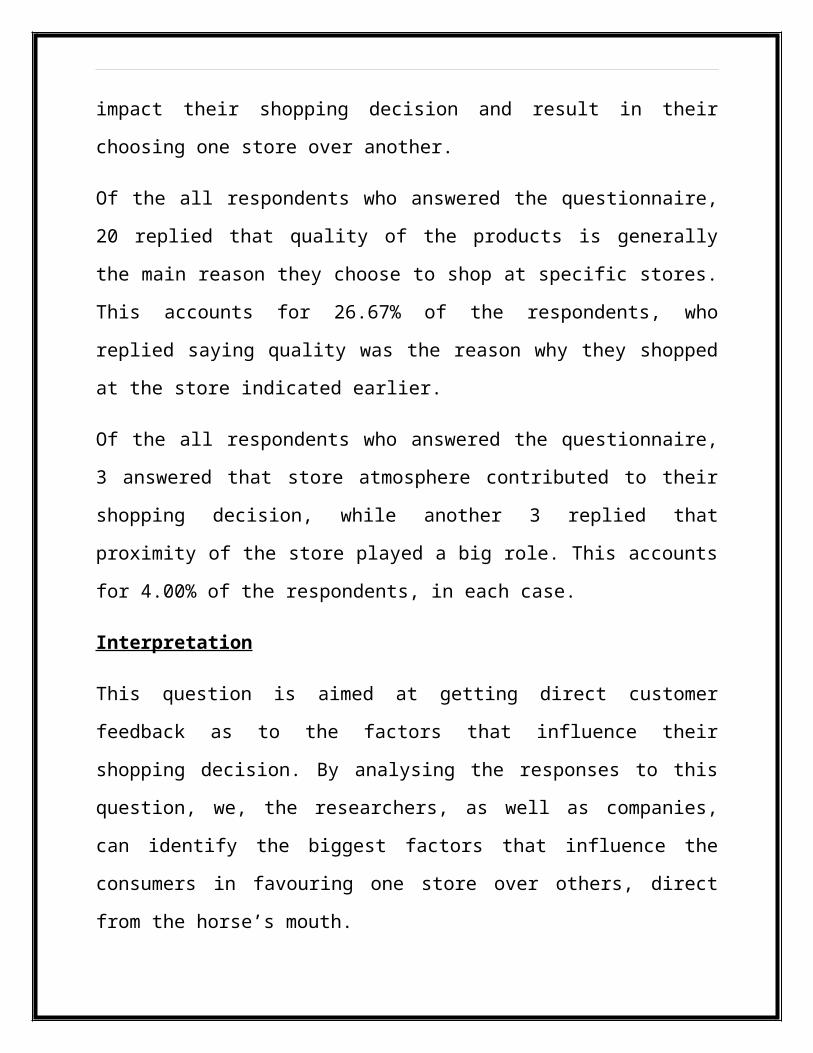
Of the all respondents who answered the questionnaire, 3 answered that store
atmosphere contributed to their shopping decision, while another 3 replied that
proximity of the store played a big role. This accounts for 4.00% of the
respondents, in each case.
Interpretation
This question is aimed at getting direct customer feedback as to the factors that
influence their shopping decision. By analysing the responses to this question, we,
the researchers, as well as companies, can identify the biggest factors that
Why do you shop at the above store?
Fashion, 6.67%
Affordability, 13.33%Variety, 5.33%
All under one roof, 13.33%
Brand name, 14.67%
Quality, 26.67%
Service, 5.33%
Loyalty, 6.67% Proximity, 4.00%Store
atmosphere, 4.00%
influence the consumers in favouring one store over others, direct from the
horse’s mouth.
From the table, graph and chart depicted above, it is evident that customers give
value to a great many number of factors when deciding which store to shop at. It
would be prudent on the part of the company to identify their strong and weak
areas, which attract or drive away customers to/from their stores.
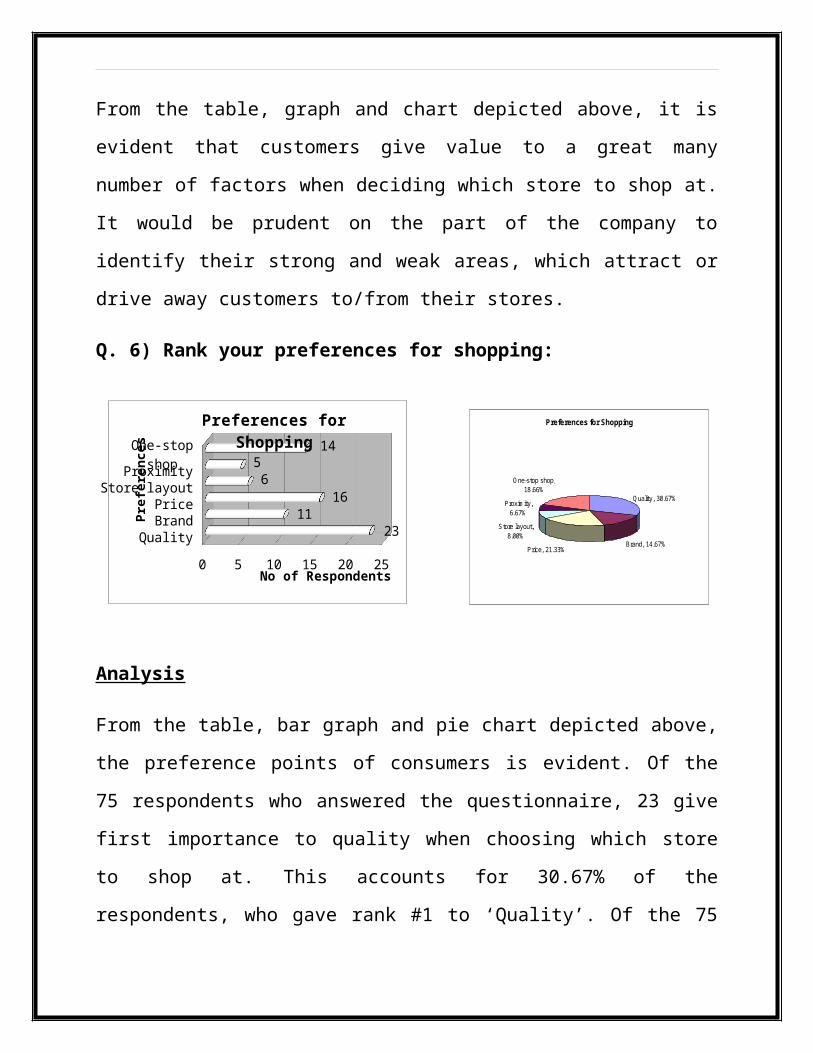
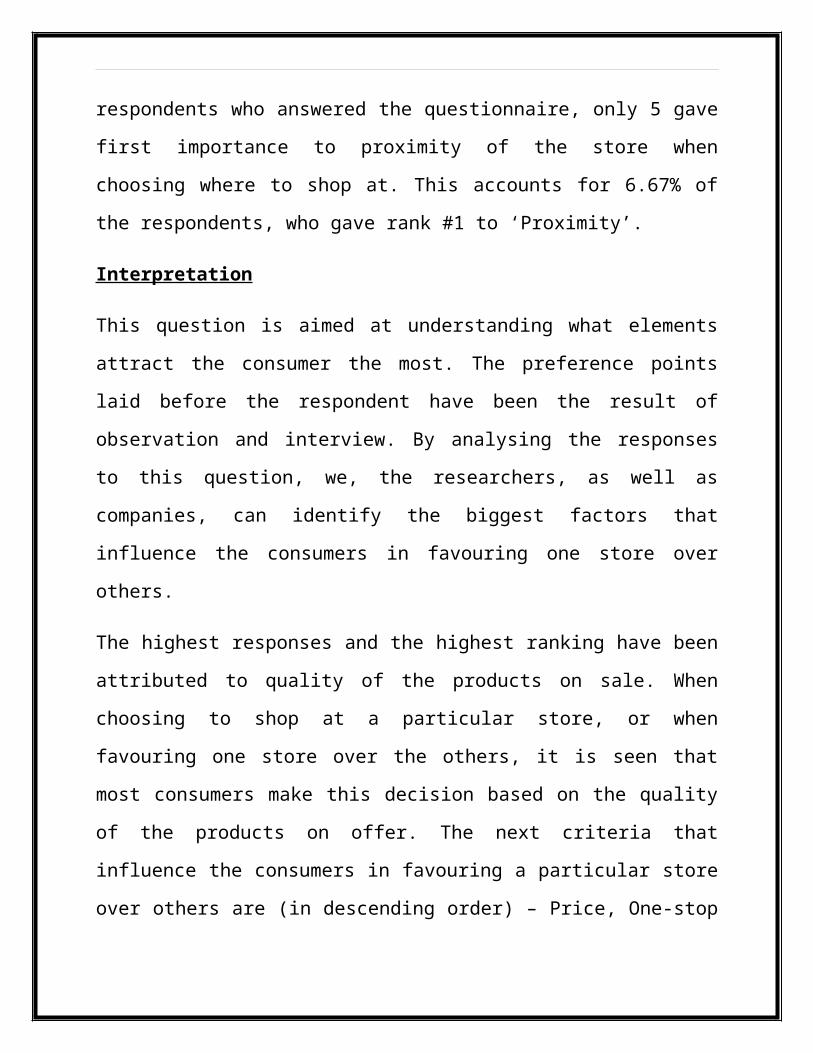
Q. 6) Rank your preferences for shopping:
Analysis
From the table, bar graph and pie chart depicted above, the preference points of
consumers is evident. Of the 75 respondents who answered the questionnaire, 23
give first importance to quality when choosing which store to shop at. This
accounts for 30.67% of the respondents, who gave rank #1 to ‘Quality’. Of the 75
respondents who answered the questionnaire, only 5 gave first importance to
proximity of the store when choosing where to shop at. This accounts for 6.67%
of the respondents, who gave rank #1 to ‘Proximity’.
Interpretation
QualityBrandPrice
Store layoutProximity
One-stop shop
0 5 10 15 20 25
2311
166
514
Preferences for Shopping
No of Respondents
Pre
fere
nce
s
Preferences for Shopping
Quality, 30.67%
Brand, 14.67%Price, 21.33%
Store layout, 8.00%
Proximity, 6.67%
One-stop shop, 18.66%
This question is aimed at understanding what elements attract the consumer the
most. The preference points laid before the respondent have been the result of
observation and interview. By analysing the responses to this question, we, the
researchers, as well as companies, can identify the biggest factors that influence
the consumers in favouring one store over others.
The highest responses and the highest ranking have been attributed to quality of
the products on sale. When choosing to shop at a particular store, or when
favouring one store over the others, it is seen that most consumers make this
decision based on the quality of the products on offer. The next criteria that
influence the consumers in favouring a particular store over others are (in
descending order) – Price, One-stop shop, Brand, Store layout, and Proximity. The
quality, price and variety of goods play big roles in the decision making process.
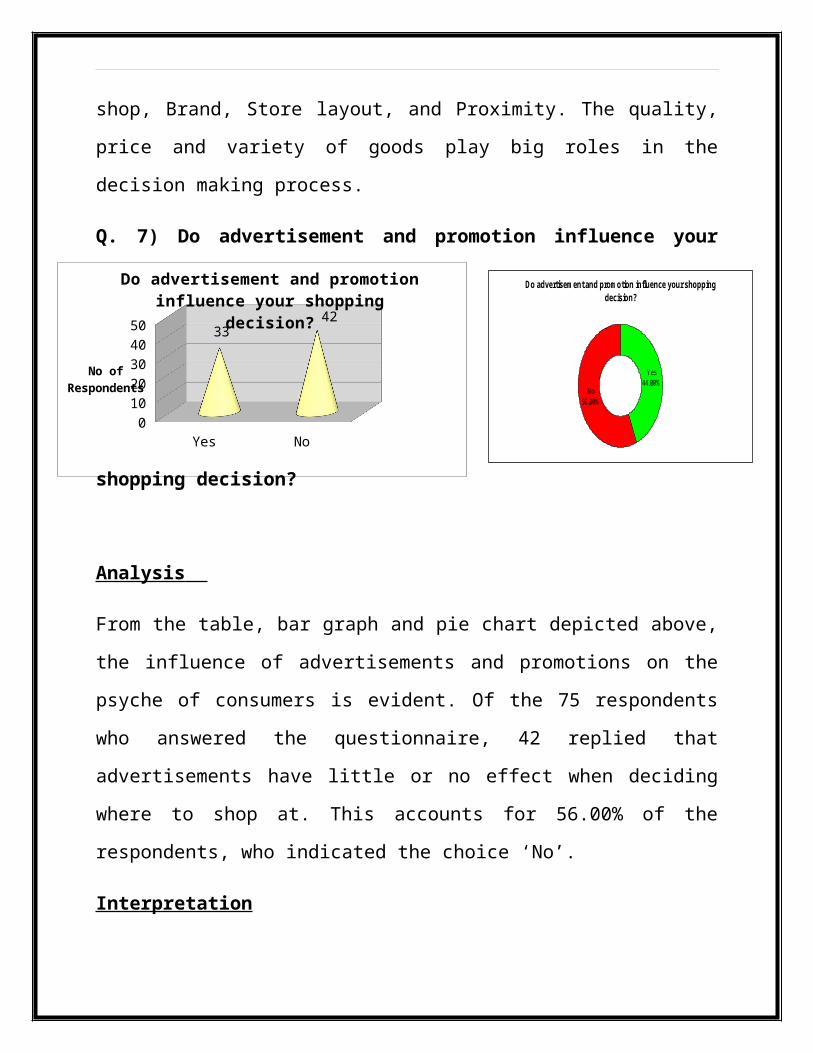
Q. 7) Do advertisement and promotion influence your shopping decision?
Analysis
From the table, bar graph and pie chart depicted above, the influence of
advertisements and promotions on the psyche of consumers is evident. Of the 75
Yes No0
10
20
30
40
5033
42
Do advertisement and promotion in-fluence your shopping decision?
No of Re-spondents
Do advertisement and promotion influence your shopping decision?
Yes44.00%
No56.00%
respondents who answered the questionnaire, 42 replied that advertisements
have little or no effect when deciding where to shop at. This accounts for 56.00%
of the respondents, who indicated the choice ‘No’.
Interpretation
This question is aimed at understanding the effect of advertisements and
promotional activities on the psyche of the consumers. The object is also to
analyze how far advertisements, promotions and other marketing strategies have
an impact on the shopping and buying behaviour of consumers. By analysing the
responses to this question, I as a , the researcher, as well as companies, can
identify the effect of advertising and marketing campaigns on the consumers’
minds and how far advertisements translate into sales.
This is not, however, to say that advertisements and promotional activities have
no bearing on the minds of the consumers at all. The responses only indicate that
advertisements serve to keep the brand in retention although they do not
guarantee sales. The products sold at the stores have the biggest impact on
attracting and retaining customers.
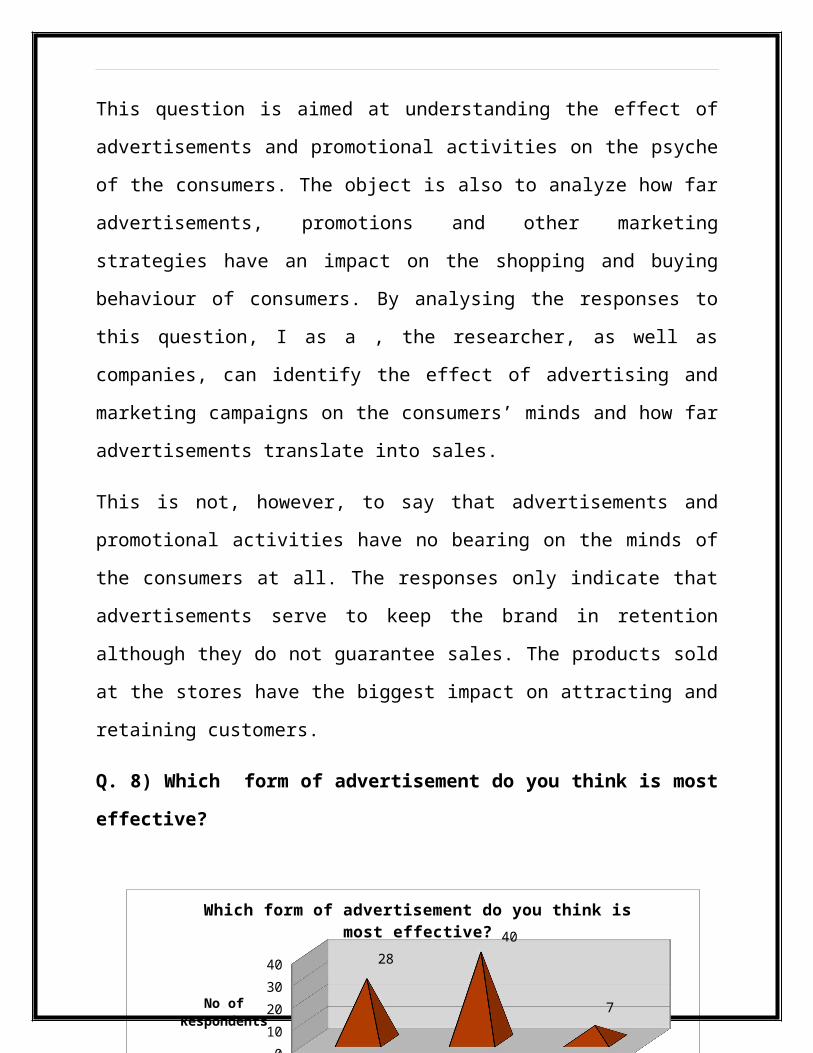
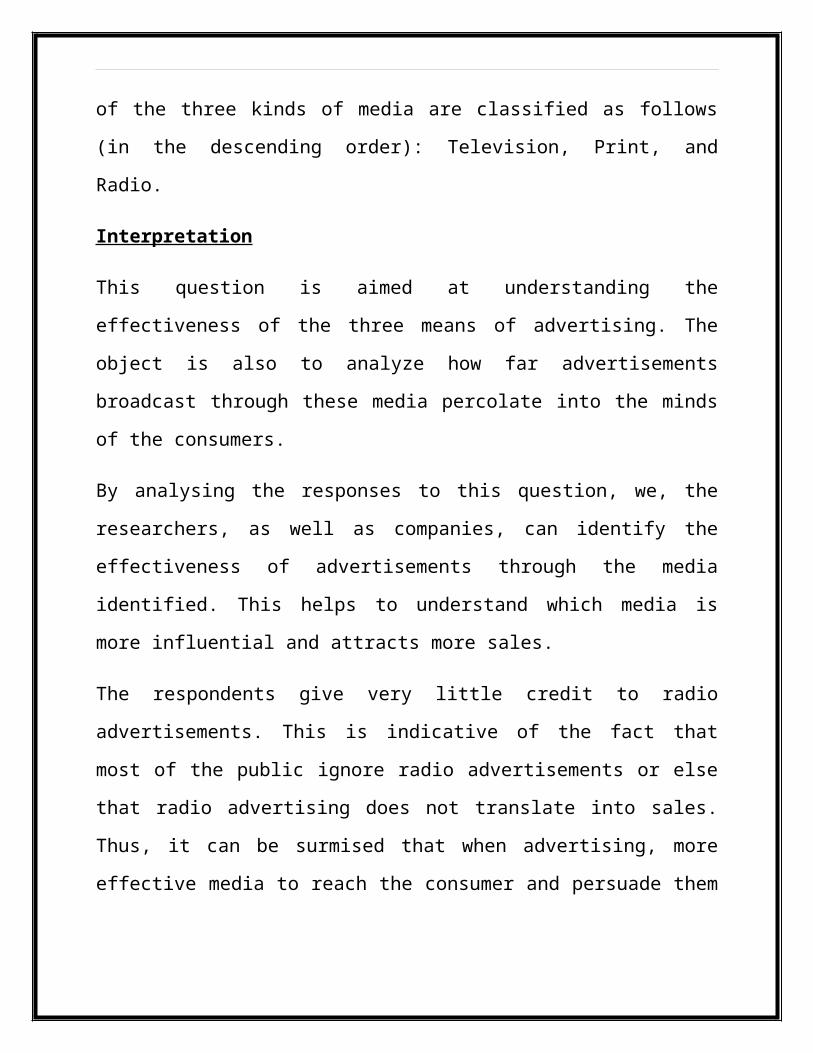
Q. 8) Which form of advertisement do you think is most effective?
Print TV Radio0
10
20
30
40 28
40
7
Which form of advertisement do you think is most effec-tive?
Promotion by
No of Re-spondents
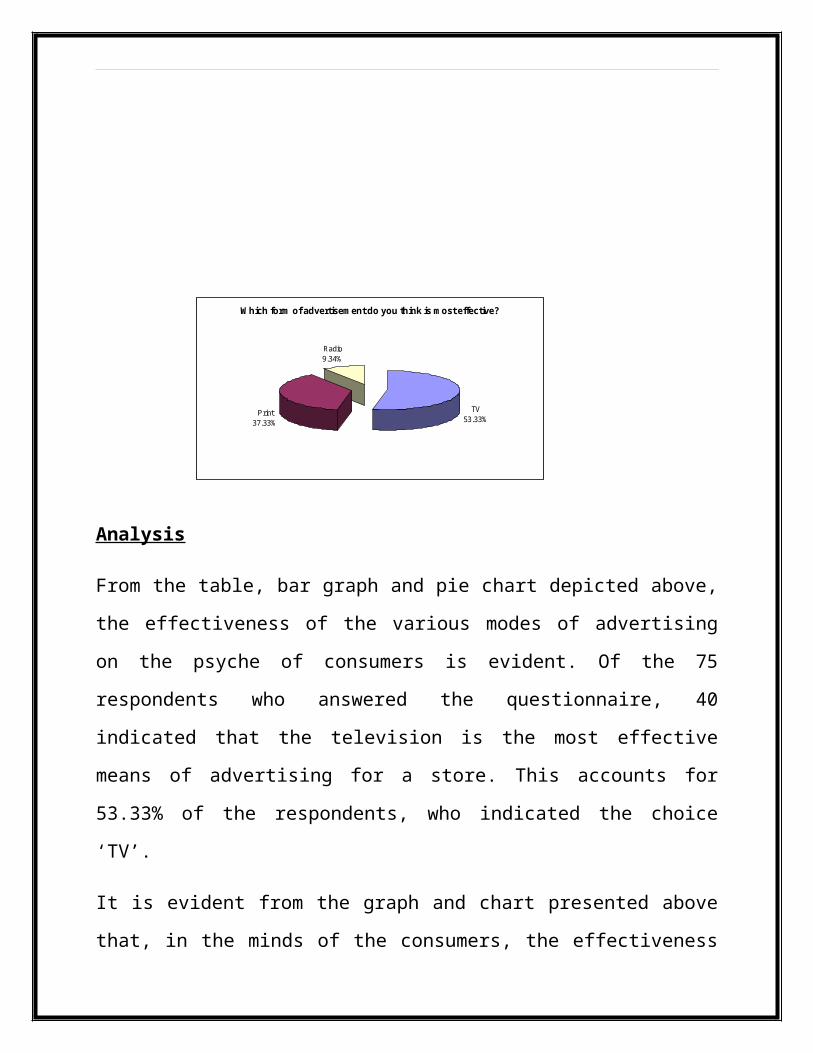
Which form of advertisement do you think is most effective?
TV53.33%
Print37.33%
Radio9.34%
Analysis
From the table, bar graph and pie chart depicted above, the effectiveness of the
various modes of advertising on the psyche of consumers is evident. Of the 75
respondents who answered the questionnaire, 40 indicated that the television is
the most effective means of advertising for a store. This accounts for 53.33% of
the respondents, who indicated the choice ‘TV’.
It is evident from the graph and chart presented above that, in the minds of the
consumers, the effectiveness of the three kinds of media are classified as follows
(in the descending order): Television, Print, and Radio.
Interpretation
This question is aimed at understanding the effectiveness of the three means of
advertising. The object is also to analyze how far advertisements broadcast
through these media percolate into the minds of the consumers.
By analysing the responses to this question, we, the researchers, as well as
companies, can identify the effectiveness of advertisements through the media
identified. This helps to understand which media is more influential and attracts
more sales.
The respondents give very little credit to radio advertisements. This is indicative of
the fact that most of the public ignore radio advertisements or else that radio
advertising does not translate into sales. Thus, it can be surmised that when
advertising, more effective media to reach the consumer and persuade them to
buy are the television and print media, more so than radio advertising.
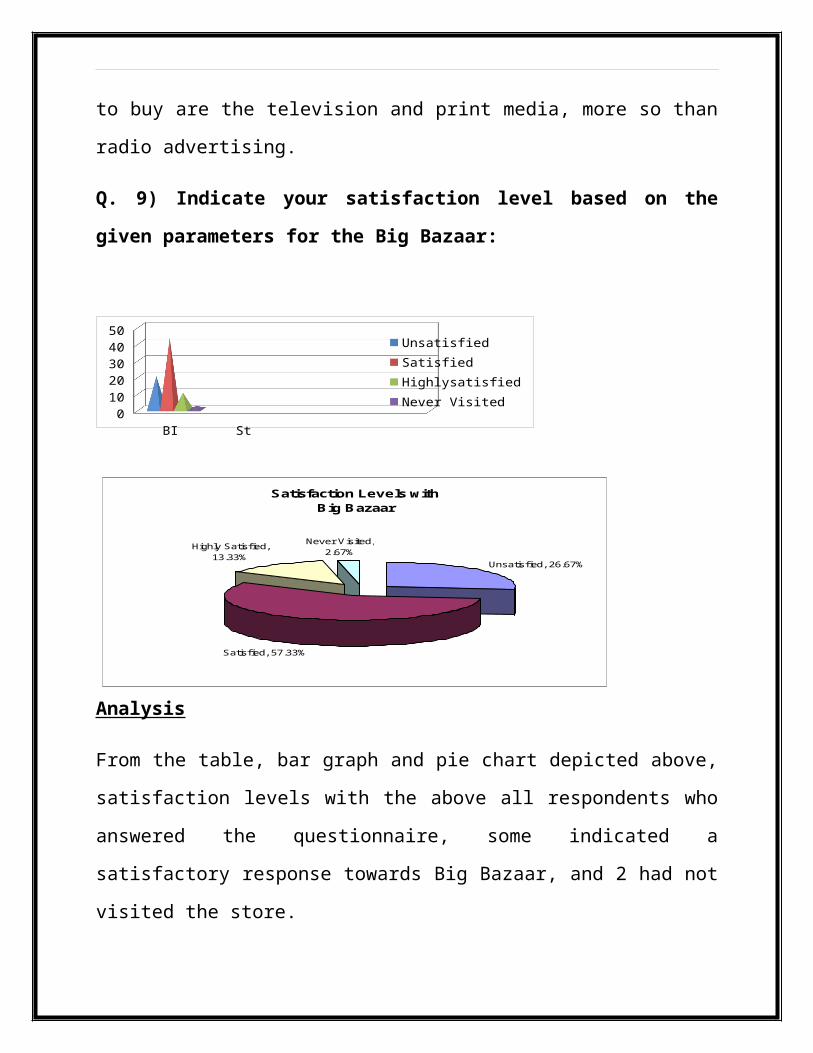
Q. 9) Indicate your satisfaction level based on the given parameters for the Big
Bazaar:
BIG BAZZAR Stores0
1020304050
UnsatisfiedSatisfiedHighlysatisfiedNever Visited
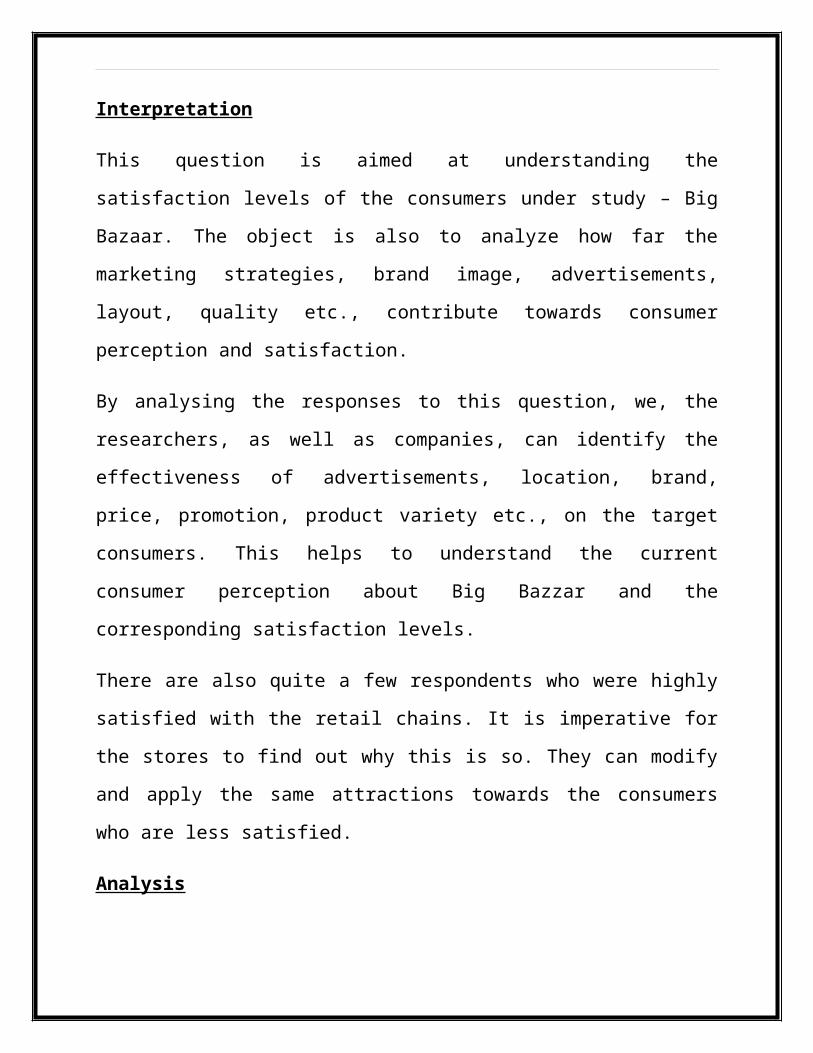
Analysis
From the table, bar graph and pie chart depicted above, satisfaction levels with
the above all respondents who answered the questionnaire, some indicated a
satisfactory response towards Big Bazaar, and 2 had not visited the store.
Interpretation
This question is aimed at understanding the satisfaction levels of the consumers
under study – Big Bazaar. The object is also to analyze how far the marketing
Satisfaction Levels with
Big Bazaar
Unsatisf ied, 26.67%
Satisfied, 57.33%
Highly Satisfied, 13.33%
Never Visited, 2.67%
strategies, brand image, advertisements, layout, quality etc., contribute towards
consumer perception and satisfaction.
By analysing the responses to this question, we, the researchers, as well as
companies, can identify the effectiveness of advertisements, location, brand,
price, promotion, product variety etc., on the target consumers. This helps to
understand the current consumer perception about Big Bazzar and the
corresponding satisfaction levels.
There are also quite a few respondents who were highly satisfied with the retail
chains. It is imperative for the stores to find out why this is so. They can modify
and apply the same attractions towards the consumers who are less satisfied.
Analysis
From the pie chart depicted above, satisfaction levels with Big Bazaar are evident.
Of the all consumers who answered this question, 57.33% indicate that they are
satisfied with Big Bazaar.
Interpretation:
Of the consumers approached, mostly agreed to fill in the questionnaire and
answer the above question. The aim of this question is to understand the level of
satisfaction that consumers feel with regards to the retail chain Big Bazaar.
As is evident from the pie chart presented above, a little more than half of the
respondents indicated that they are satisfied with Big Bazaar, while almost one-
eighth indicated that they are highly satisfied with the store. However, almost
one-fourth of the number of respondents indicated that they were unsatisfied
with Big Bazaar.
FINDINGS AND SUGGESTIONS
In the surveys, interviews and study conducted above, I came across many factors
that influence the consumers’ perception of a store and their subsequent
shopping and buying decisions. Here, I present the findings gathered and the
suggestions we offer to companies based on the data gathered and analyzed.
It is not surprising that the youth most frequent malls and retail stores. What is
unexpected, however, is the fact that more people who fall into the older age
group visit the retail stores than those who fall in the middle age group. Then
again, this deduction cannot be applied to the entire population of Bangalore. The
disparity can be attributed to the small size of the sample under study.
The highest number of respondents were female, as is depicted by the graph and
chart presented above. The number of male respondents was less compared to the
female respondents.
Two deductions can be made from the above data collected: one, more women
visit retail outlets than men. Two, more women are willing to fill out
questionnaires and take a survey than men.
This can help the companies and researchers in undertaking future decisions and
studies. Since more women can be inferred to visit retail stores than men,
companies can target their offerings and marketing strategies in two areas. Retail
outlets can appeal to the women customers by offering more products geared
especially towards women. They can provide a shopping experience that women
are particularly attracted to.
Another way that retail chains can use the above data is to appeal to the men rather
than the women. Since, fewer men visit retail stores as against women, the
companies have a large base of potential customers. By providing products that are
geared towards men and by providing a shopping experience that attracts men, the
retail chains can expand their customer base.
Consumers approached were asked about their frequency in visits to shops. The
frequency points furnished were: Once a week, Fortnightly, and Once a month. By
analysing the responses to this question, we, the researchers, as well as companies,
can identify the number of times a customer is likely to shop in a month’s time.
The highest responses have been attributed to once a month shopping. It can be
deduced that consumers who shop only once a month look to buy groceries and
other essentials to last them a month. Therefore, retail outlets have tough
customers in those who shop once a month. Such customers look to buy in bulk.
Moreover, such customers may not be open to experimenting with new stores.
Hence, to capture this market, retail outlets must put in place strategies that attract
them. Once they profess a liking to a certain store, they turn out to be very loyal
customers.
Consumers who shop once a week, on the other hand, pose very different
challenges to retail stores. Such customers can be presumed to have a high
disposable income and may buy more lifestyle or fashion products. Since they shop
so frequently, they must continually be entertained and attracted to make repeat
purchases at stores. When targeting this segment, companies must be able to get
new stock every week, and update their marketing strategies continuously.
Consumers approached were asked which stores they shopped at frequently. The
retail store brands placed before them were Big Bazaar, Shoppers’ Stop, Marks &
Spencer, and others. By analysing the responses to this question, I as, a researcher,
as well as companies, can identify customer preferences among the varied choices
of stores, and can calculate how much market share they hold..
The other stores can be ranked in descending order of preference or frequency of
visits as: Shoppers’ Stop, Others, and Marks & Spencer.
It can be deduced from the above figures that the category ‘Others’ was indicated
by more number of respondents than those who indicated they frequent Marks &
Spencer. This may be because Marks & Spencer targets only the elite classes in a
city where a higher percentage of the population belong to the middle income
group.
In analyzing the other stores that consumers frequent, outlets such as Westside,
Monday to Sunday, More, Central etc., featured. This indicates that more people
frequent stores that cater to the middle income group. This is not to say that Marks
& Spencer has no customer base. However, they may be unable to generate a high
volume of repeat sales.
Consumers approached were asked to indicate the types of products they mostly
shopped for at the stores they had selected earlier. The types of products presented
were Clothing, Accessories, Groceries and others. By analysing the responses to
this question, we, the researchers, as well as companies, can identify the main
attractions of products and services offered.
The high number of responses indicate that a large number of consumers visit retail
outlets for clothes/dresses/apparel. Accoutrement is the hottest selling item that any
retail outlet can provide. One-third of the respondents indicated that the visit retail
outlets to purchase groceries.
To the retail stores, the above tabulated responses lead to a very important result.
Clothing is the fastest moving consumer good. Retail outlets that provide apparel
can see a higher rate of turnover and sales volume.
However, the above results cannot be assumed to be representative of the entire
population of Bangalore city. The sample size consists of only 75 respondents,
who were approached on a random basis as they visited the retail outlets.
If set in descending order of influence as indicated by the consumers, the factors
can be listed as: Quality, Brand name, Affordability, All products under one roof,
Fashion, Loyalty, Service, Variety, Proximity, and Store atmosphere.
Consumers approached were asked to rank their preferences on a scale of 1 to 6 of
their preferences when choosing to shop at particular stores. The preference points
placed before them were ‘Quality, ‘Brand’, ‘Price’, ‘Store Layout’, ‘Proximity’,
‘One-stop shop’. By analysing the responses to this question, we, the researchers,
as well as companies, can identify the biggest factors that influence the consumers
in favouring one store over others.
The highest responses and the highest ranking have been attributed to quality of the
products on sale. When choosing to shop at a particular store, or when favouring
one store over the others, it is seen that most consumers make this decision based
on the quality of the products on offer.
The next criteria that influence the consumers in favouring a particular store over
others are (in descending order) – Price, One-stop shop, Brand, Store layout, and
Proximity.
Although it is said that the most important things in retail are “Location, location,
and location”, from the consumers’ point of view, proximity is of little concern.
The quality, price and variety of goods play big roles in the decision making
process.
Consumers approached were asked if advertisements and promotional activities
influence their shopping decisions. By analysing the responses to this question, we,
the researchers, as well as companies, can identify the effect of advertising and
marketing campaigns on the consumers’ minds and how far advertisements
translate into sales.
Consumers approached were asked which form of advertisement they thought was
most effective. The methods of advertising were restricted to three – Television,
Print and Radio. By analysing the responses to this question, I as, a the researcher,
as well as companies, can identify the effectiveness of advertisements through the
media identified.
From the tabulated data depicted above and responses of the consumers, it is
evident that the majority of the respondents feel that television advertising is the
most effective means of advertising. This is indicative in spite of large number of
commercials that the public is bombarded with.
The respondents give very little credit to radio advertisements. This is indicative of
the fact that most of the public ignore radio advertisements or else that radio
advertising does not translate into sales.
Thus, it can be surmised that when advertising, more effective media to reach the
consumer and persuade them to buy are the television and print media, more so
than radio advertising.
Consumers approached were asked about their satisfaction covered in this study.
The satisfaction scale of Big Bazaar comprised of four ranks – Unsatisfied,
Satisfied, Highly Satisfied and Never Visited. The object is also to analyze how far
the marketing strategies, brand image, advertisements, layout, quality etc.,
contribute towards consumer perception and satisfaction.
By analysing the responses to this question, we, the researchers, as well as
companies, can identify the effectiveness of advertisements, location, brand, price,
promotion, product variety etc., on the target consumers. This helps to understand
the current consumer perception of the three stores identified and the
corresponding satisfaction levels.
There are also quite a few respondents who were highly satisfied with the retail
chains. It is imperative for the stores to find out why this is so. They can modify
and apply the same attractions towards the consumers who are less satisfied.
A little more than half of the respondents indicated that they are satisfied with Big
Bazaar, while almost one-eighth indicated that they are highly satisfied with the
store. However, almost one-fourth of the number of respondents indicated that they
were unsatisfied with Big Bazaar.
This goes to show that although Big Bazaar may have an overall goodwill from the
consumers, there are still some things that they are not doing right. Big Bazaar
must identify exactly what the problem areas are and must address them quickly
and swiftly.
The above pie chart shows that almost 30% of the respondents fall into the
category of potential customers. Big Bazaar must take effective steps to attract
these consumers.
RECOMMENDATIONS AND CONCLUSION
BIG BAZAAR
Pros:
1. Variety : Big Bazaar offers a wide variety of products of different prices and
different qualities satisfying most of its customers.
2. Quality : Providing quality at low prices and having different types of
products for different income customers is another advantage.
3. Price : As noted the prices and offers in Big Bazaar have been one of the
main attractions and reasons for its popularity. The price ranges and the
products offered are very satisfying to the customers.
4. Location : The location of Big Bazaar has been mainly in the heart of the
city or in the out skirts giving a chance to both the City and the people living
outside the city to shop.
5. Advertisements : Big bazaar has endorsed very popular figure like M S
Dhoni and other famous personalities which has attracted a lot of
customers. This has resulted in increase of sale and the outdoor advertising
techniques have also helped Big Bazaar.
6. Middle class appeal : Considering the fact that there are a lot middle class
families in India, Big bazaar has had a huge impact on the middle class
section of India, the prices, quality and sales strategy has helped in getting
the middle income groups getting attracted towards Big Bazaar.
7. Attractive sales : Big bazaar has been known for its great sale and great
offers. Big bazaar has had long lines of people waiting to get into the store
for the sale. Therefore, the sales that Big Bazaar has had has increased sales
in a huge way due to the sales and offers, thus this has been one of the
main advantages of Big Bazaar.
Disadvantages:
1. Store layout : The store layout and the assortment of goods is not the best
at Big Bazaar, as the quantity of goods sold is more the arrangement and
assortment of goods in the store is the greatest. Hence at times customers
find it hard to find what they require, this leads to dissatisfaction of
customers.
2. Lower quality of goods : As Big bazaar aims more toward the middle
income group, the quality of goods is not of the highest quality, and this is
sometimes a disadvantage as some would prefer better quality to the price,
making customers to search for different places.
3. Does not appeal to the elite : As mentioned above, the main customers are
middle income and a few high income groups, The elite do not like to shop
at Big Bazaar as the quality of goods is lower and they would prefer a
higher price and get a better brand, this decreases sales from the elite class
4. Not acclaimed for very good service : Big Bazaar is not known for high
class service. The staff recruited is not very well trained and the billing
queues take a long time to move, this irritates customers which makes
them visit the store more seldom
5. Lower quality of goods : As the sore is trying to concentrate on the middle
income group the type of products used is not of the most superior quality
and most of the times nor branded, this may dissatisfy certain customers
6. Consumer satisfaction : Long queues and lower quality leads to
dissatisfaction of customers. Due to factors mentioned above Big Bazaar
shoppers are not always satisfied, this is not a positive for the store.