beyondie potash project - epa wa | epa … lakes potash pty ltd beyondie potash project preliminary...
TRANSCRIPT
Advisian 1
Beyondie Potash Project
Preliminary Water Supply Assessment
14/07/2017
Level 4, 600 Murray St
West Perth WA 6005
Australia
201320-14624
www.advisian.com
Kalium Lakes Potash Pty Ltd
Beyondie Potash Project
Preliminary Water Supply Assessment
Advisian 3
Table of Contents
1 Introduction .................................................................................................................................. 1
1.1 Previous Hydrogeological Work ........................................................................... 2
2 Hydrogeological Setting ......................................................................................................... 3
2.1 Climate .............................................................................................................................. 3
2.2 Geology and Hydrogeology ................................................................................... 3
2.3 Alluvium and Calcrete ................................................................................................ 4
2.4 Existing Groundwater Bores and Users .............................................................. 5
2.5 Groundwater Levels .................................................................................................... 8
2.6 Groundwater Salinity .................................................................................................. 8
2.7 Groundwater Dependent Ecosystems ................................................................ 8
2.8 Hydraulic Properties ................................................................................................ 12
2.9 Groundwater Recharge and Availability ......................................................... 12
3 Groundwater Supply Target Areas .................................................................................. 15
3.1 Water Supply Targets.............................................................................................. 15
3.2 Drawdown and Radius of Influence ................................................................. 21
3.3 GDE Considerations ................................................................................................. 21
4 Summary and Future Works Program ........................................................................... 22
4.1 Summary of the Desktop Assessment............................................................. 22
4.2 Future Works Program ........................................................................................... 23
5 References .................................................................................................................................. 25
Table List
Table 1: Average Climate Data .......................................................................................................................................... 3
Kalium Lakes Potash Pty Ltd
Beyondie Potash Project
Preliminary Water Supply Assessment
Advisian 4
Table 2: Groundwater Recharge Estimates ............................................................................................................... 14
Table 3: Preliminary Groundwater Supply Targets -Western Water Supply Area ..................................... 15
Table 4: Preliminary Groundwater Supply Targets –Southern Water Supply Area ................................... 18
Appendix List
Bore Data Appendix A
Drawdown Calculations Appendix B
Kalium Lakes Potash Pty Ltd
Beyondie Potash Project
Preliminary Water Supply Assessment
Advisian 1
1 Introduction
Kalium Lakes Potash Pty Ltd (KLP) engaged Advisian in April 2017 to undertake a preliminary
assessment of potential fresh water supply options for the Beyondie Sulphate of Potash Project
(BSOPP). The lakes being assessed under the ongoing resource assessment of the Project are
Beyondie, Ten Mile and Sunshine. The Project requires a water supply as part of the processing of
the brine to produce a sulphate of potash (SOP) product. It is understood that the current
estimated water demand for the Project is between 0.7 and 1.5 Gigalitres / annum (GLpa) for an
equivalent 75,000 or 150,000 tonnes per annum production rate of SOP.
This preliminary desktop water supply assessment aims to identify a water supply source for the
Project and estimate potential yields and impacts based on the available hydrogeological
information.
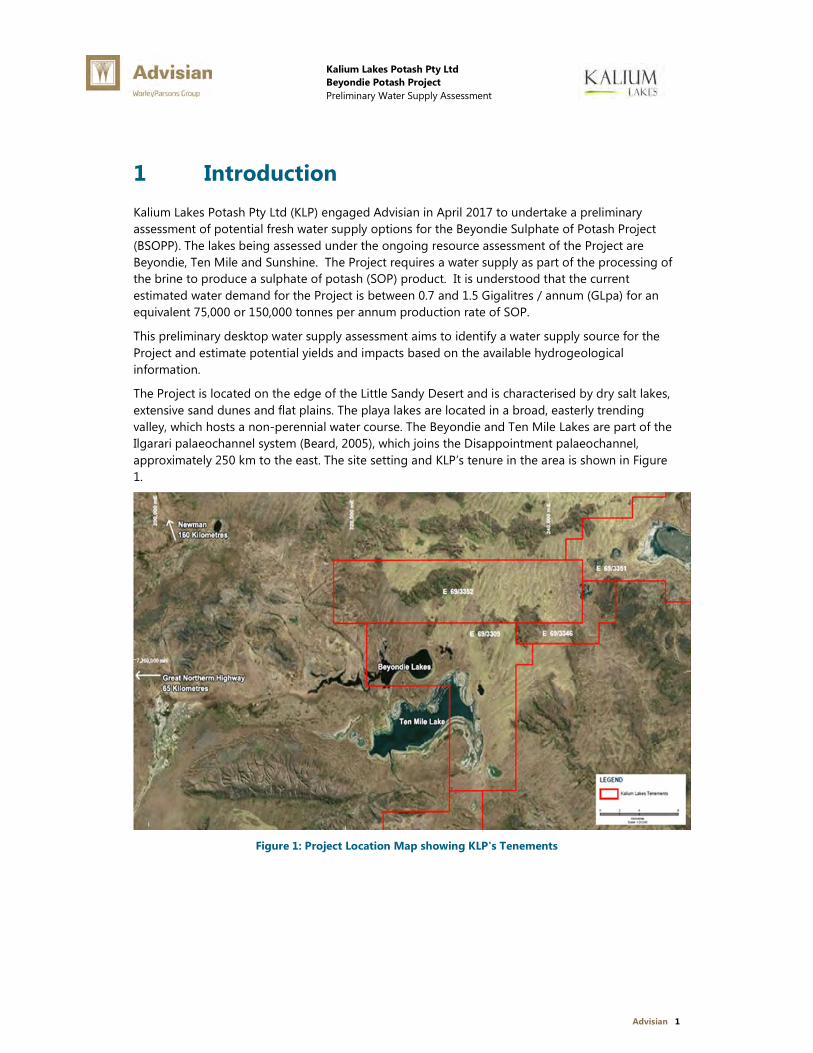
The Project is located on the edge of the Little Sandy Desert and is characterised by dry salt lakes,
extensive sand dunes and flat plains. The playa lakes are located in a broad, easterly trending
valley, which hosts a non-perennial water course. The Beyondie and Ten Mile Lakes are part of the
Ilgarari palaeochannel system (Beard, 2005), which joins the Disappointment palaeochannel,
approximately 250 km to the east. The site setting and KLP’s tenure in the area is shown in Figure
1.
Figure 1: Project Location Map showing KLP's Tenements
Kalium Lakes Potash Pty Ltd
Beyondie Potash Project
Preliminary Water Supply Assessment
Advisian 2
1.1 Previous Hydrogeological Work
Regional palaeovalley mapping has been undertaken by Geoscience Australia, the work involved
an assessment of regional palaeovalley systems throughout Australia mainly using remote sensing
techniques. A palaeovalley map covering Western Australia, South Australia and Northern Territory
(WASANT) was produced indicating the location of all interpreted palaeovalleys within these states
(Bell, et al, 2012). The delineation of the palaeovalley for the Project area was also indicated on this
map, identified as the Ilgarari Palaeovalley system. To define the extent of the thalweg of the
palaeovalley (deepest section) with the aim of identifying a basal sand palaeochannel aquifer, KLP
are undertaking gravity and passive seismic geophysical surveys within their tenements, with the
results being processed as part of the current resource exploration.
KLP are currently updating a pre-feasibility study (PFS) of the Project (KLP, 2016), providing the
hydrogeological and resources basis for its development and operation. A H2 level
hydrogeological report was submitted to the Department of Water (DoW), Western Australia (WA)
in May 2016 (AQ2, 2016) in support of a 1.5 GLpa groundwater abstraction licence. These works
concentrated mainly on the palaeochannel sand aquifer that hosts the brine for a long duration
pumping and evaporation trial.
Current hydrogeological investigations and geophysical interpretation is in progress to delineate
the basal sand aquifer, understand its geometry and hydraulic properties in the process of
estimating the SOP Resource. This report is focused on the potential freshwater resources to
support the processing and potable supplies for the Project. Whilst the investigations to date have
been focused on the hypersaline groundwater resources, they also provide a better understanding
of the upper alluvial and calcrete aquifer and improve the hydrogeological understanding of this
unconfined aquifer as a water supply source for the Project.
Kalium Lakes Potash Pty Ltd
Beyondie Potash Project
Preliminary Water Supply Assessment
Advisian 3
2 Hydrogeological Setting
In order to develop a preliminary hydrogeological understanding of the Project area the available
data and regional information on the following topics was collated and analysed:
� Climate, particularly rainfall and evaporation;
� Geology, focussing on the shallow geology in the vicinity of the Project;
� Hydrogeology, concentrating on the shallow alluvium and calcrete aquifers;
� Groundwater quality, particularly salinity, and
� Groundwater-surface water interactions in the vicinity of the Project.
It should be noted that site specific groundwater data from the calcrete aquifer outside of the
brine resource area was limited to pastoral well surveys. Regional geological data and the site
specific geophysical data collected by Kalium were used for hydrogeological understanding.
2.1 Climate
The climate within the Project area is arid. Nearby Bureau of Meteorology stations with long-term
data sets include Meekatharra, Newman and Three Rivers. Average rainfall at these sites is listed in
Table 1. The average annual rainfall at the Three Rivers station has been adopted in this study.
Table 1: Average Climate Data
Site Annual Rainfall (mm) Annual Evaporation (mm)
Meekatharra Airport (007045) 239.1 3506
Newman Aero (007176) 327.7 Not recorded
Kalium Lakes (K-UTEC, 2016) 238.4 4100
Three Rivers Station 227 -
2.2 Geology and Hydrogeology
Details of the geological and hydrogeological setting are provided in previous reports (KLP, 2016,
AQ2, 2016). Tertiary palaeovalley sediments comprise a basal sand unit (often referred to as the
palaeochannel), overlain by an interbedded sequence of dense, plastic clay with minor
interfingering sand lenses towards the base of the sequence. The palaeochannel sand underlying
the clay constitutes an important regional aquifer and is the target of the resource assessment.
Johnson et al (1999) report that the overlying clay is possibly of lacustrine origin and rests on the
basal sand with a gradational contact, comprising several metres of dark-grey clayey sand. At the
Beyondie and Ten Mile Project site, the clay has been mapped to be up to 65m thick and forms a
Kalium Lakes Potash Pty Ltd
Beyondie Potash Project
Preliminary Water Supply Assessment
Advisian 4
confining unit in the project area. Overlying the clays is a shallow unconfined surficial alluvial
aquifer composed of mostly silty and clayey deposits along with locally occurring calcrete deposits.
The bedrock geology is dominated by the Proterozoic sedimentary rocks of the North-West Officer
Basin, comprising a generally coarsening up sequence of mudstones, siltstones and sandstones
within the project area. Mafic igneous rocks have intruded the sedimentary sequence typically
interpreted as sills. The sedimentary sequence dips at a shallow angle in a north-easterly direction.
The basin margin environment within the Project area has resulted in complex structural features
evident in the GSWA mapping and aerial photography. It is considered that the main structures
are related to a regional scale half graben feature with a number of major shear zones evident.
This water supply assessment is concentrated on abstraction from shallow alluvial and calcrete
aquifer, supplemented where possible by structural features in the bedrock
2.3 Alluvium and Calcrete
The alluvial deposits are generally formed as transported sediments during rain periods forming
creek sediments and outwash fans on the flanks of the topographic lows and valleys. Thicker
deposits of colluvium may also occur within tributaries in general break of slope areas and along
steeper valley sides. These deposits are heterogeneous due to the nature of their deposition.
Localised groundwater supplies may also be obtained from intersections of present day drainage
and bedrock fracture zones. Storage may be within alluvial sediments fed by groundwater flows
through the fractures and/or within the weathered profile of the bedrock where the upper alluvium
is thin. Groundwater occurrence will depend on the nature of fractures, whether they are open or
closed and if they act as conduits of water. Yields can be low to moderate and highly variable.
Groundwater in the alluvial zones will be rainfall dependent and will be higher in areas of highly
heterogeneous coarser sediments. In windblown arid areas, the shallow alluvial sediments may
have been eroded away to expose the calcrete deposits which have become hard outcrop features
at the surface.
Calcretes are carbonate deposits formed within alluvial and colluvial sediments. They comprise of
magnesium and calcium carbonate precipitates from percolating carbonate-saturated water and
can be seen generally occurring in present-day salt lakes in some of the main palaeodrainages.
They form an important water resource in the Goldfields region and are capable of producing
significant bore yields of up to 2,000 kilolitres per day (kL/d) where there is sufficient thickness
below the water table (Johnson et al, 1999). Calcrete is often associated with lower salinity water
than other surrounding and deeper aquifers due to their ability to accept recharge. Within the
Project area the palaeochannel sand constitutes the main aquifer however these are likely to be
saline to hypersaline in quality. The overlying alluvial aquifer composed of silty and clayey deposits
and calcrete represent a relatively fresher quality aquifer.
Calcrete occurs in the region at the margins of the present day salt lakes, and in some of the main
sub-catchments in the palaeodrainages. Across the GoldFields Region calcrete aquifers are
reported to be generally less than 10 m in thickness and occur associated with karstic features,
including sinkholes and gilgai structures (Johnson and Commander, 2006). In the Project area the
Kalium Lakes Potash Pty Ltd
Beyondie Potash Project
Preliminary Water Supply Assessment
Advisian 5
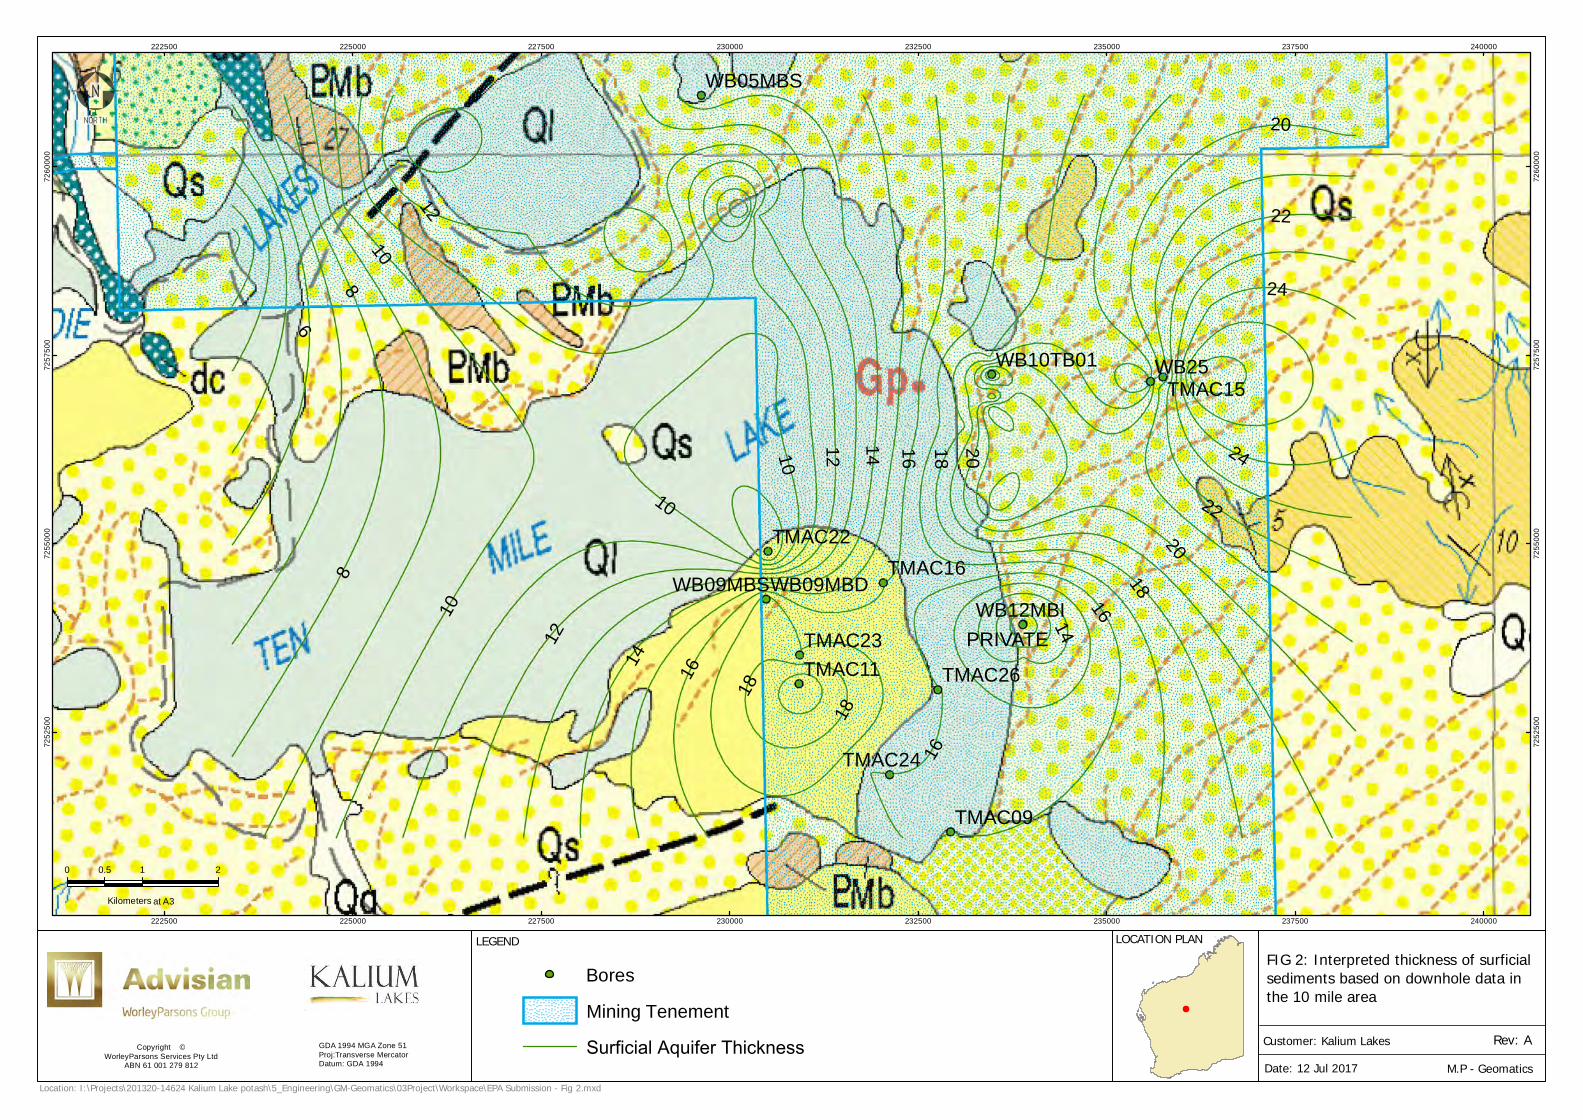
surficial unconfined aquifer comprising alluvium and colluvium associated with the present day
drainage and calcrete is interpreted to average around 10 to 15m overlying the confining stiff
clays. The thickness of surficial sediments is interpreted from the drilling data presented in .
Groundwater occurrence and availability in calcrete aquifers are related to well-developed
secondary porosity that results in high hydraulic conductivities. They can yield high volumes of
water, whilst salinity may vary depending on their occurrence in the landscape and proximity to
regular surface water flows that facilitates regular recharge. They are used regionally as potable
water supplies where relatively fresh and for supply of stock and mineral processing water, where
brackish.
The H2 Level Hydrogeological report (AQ2, 2016) identified the shallow surficial deposits as a
minor aquifer comprising gypsiferous sand, silts and calcrete within the project area. This
unconfined aquifer was reported to be generally less than 10 m thick.
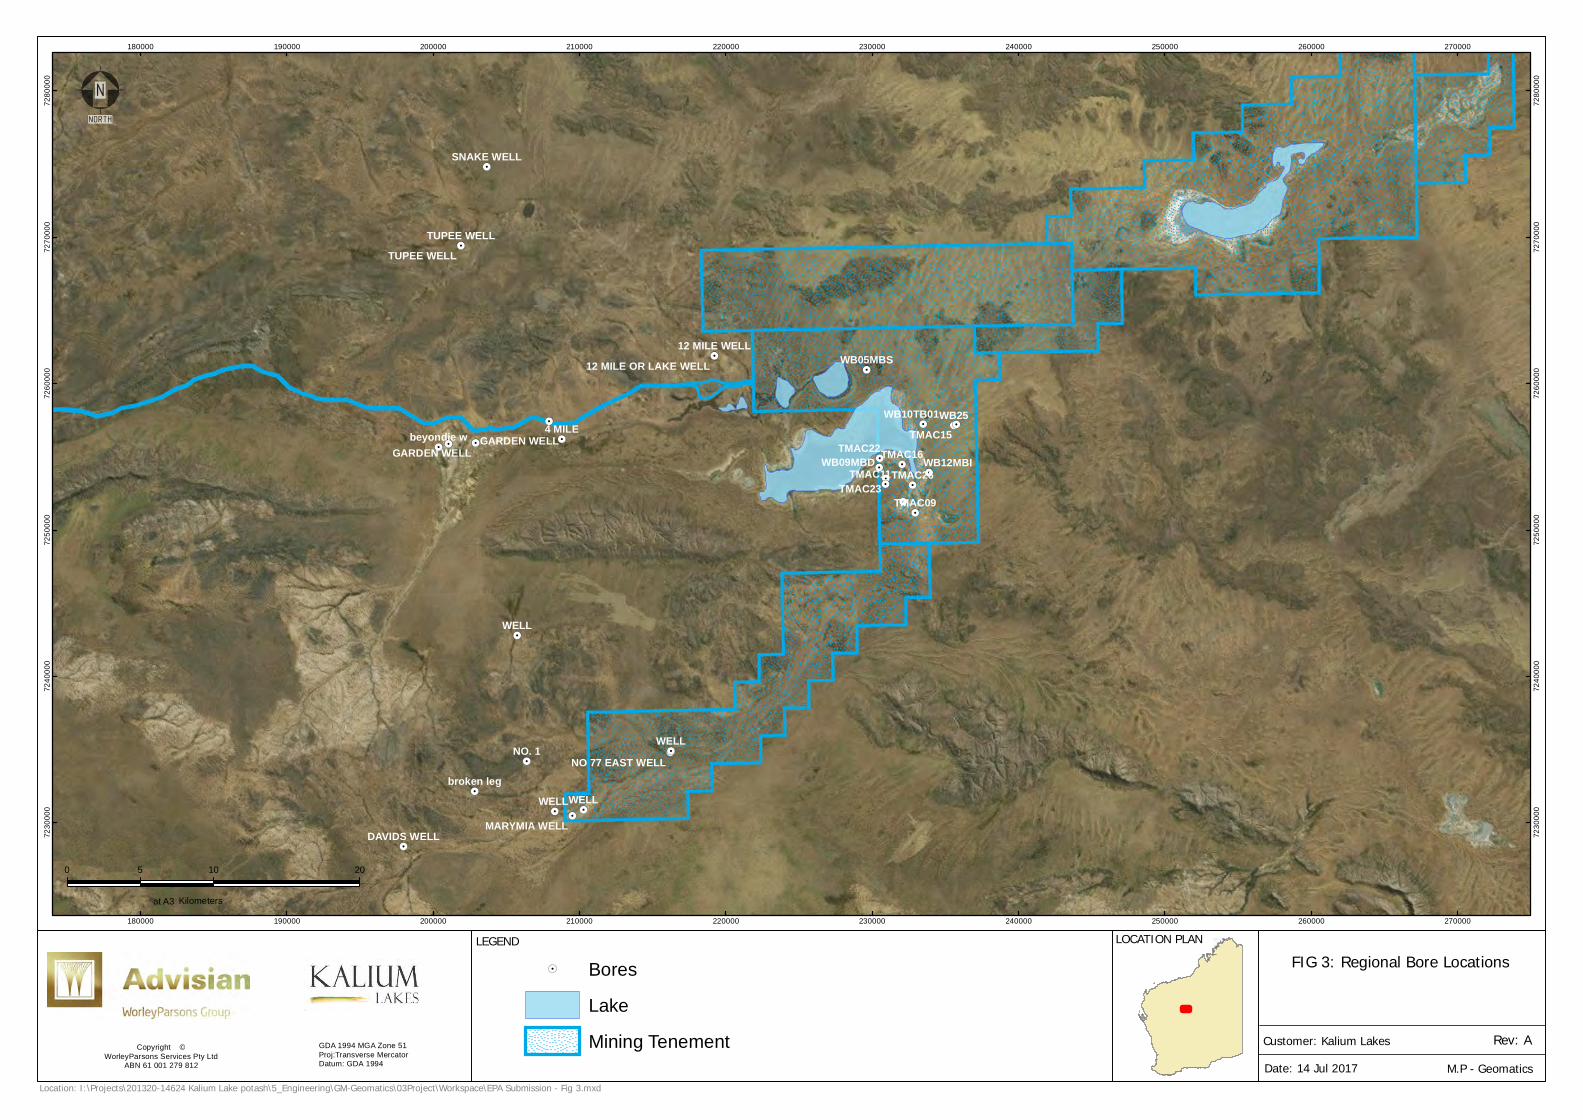
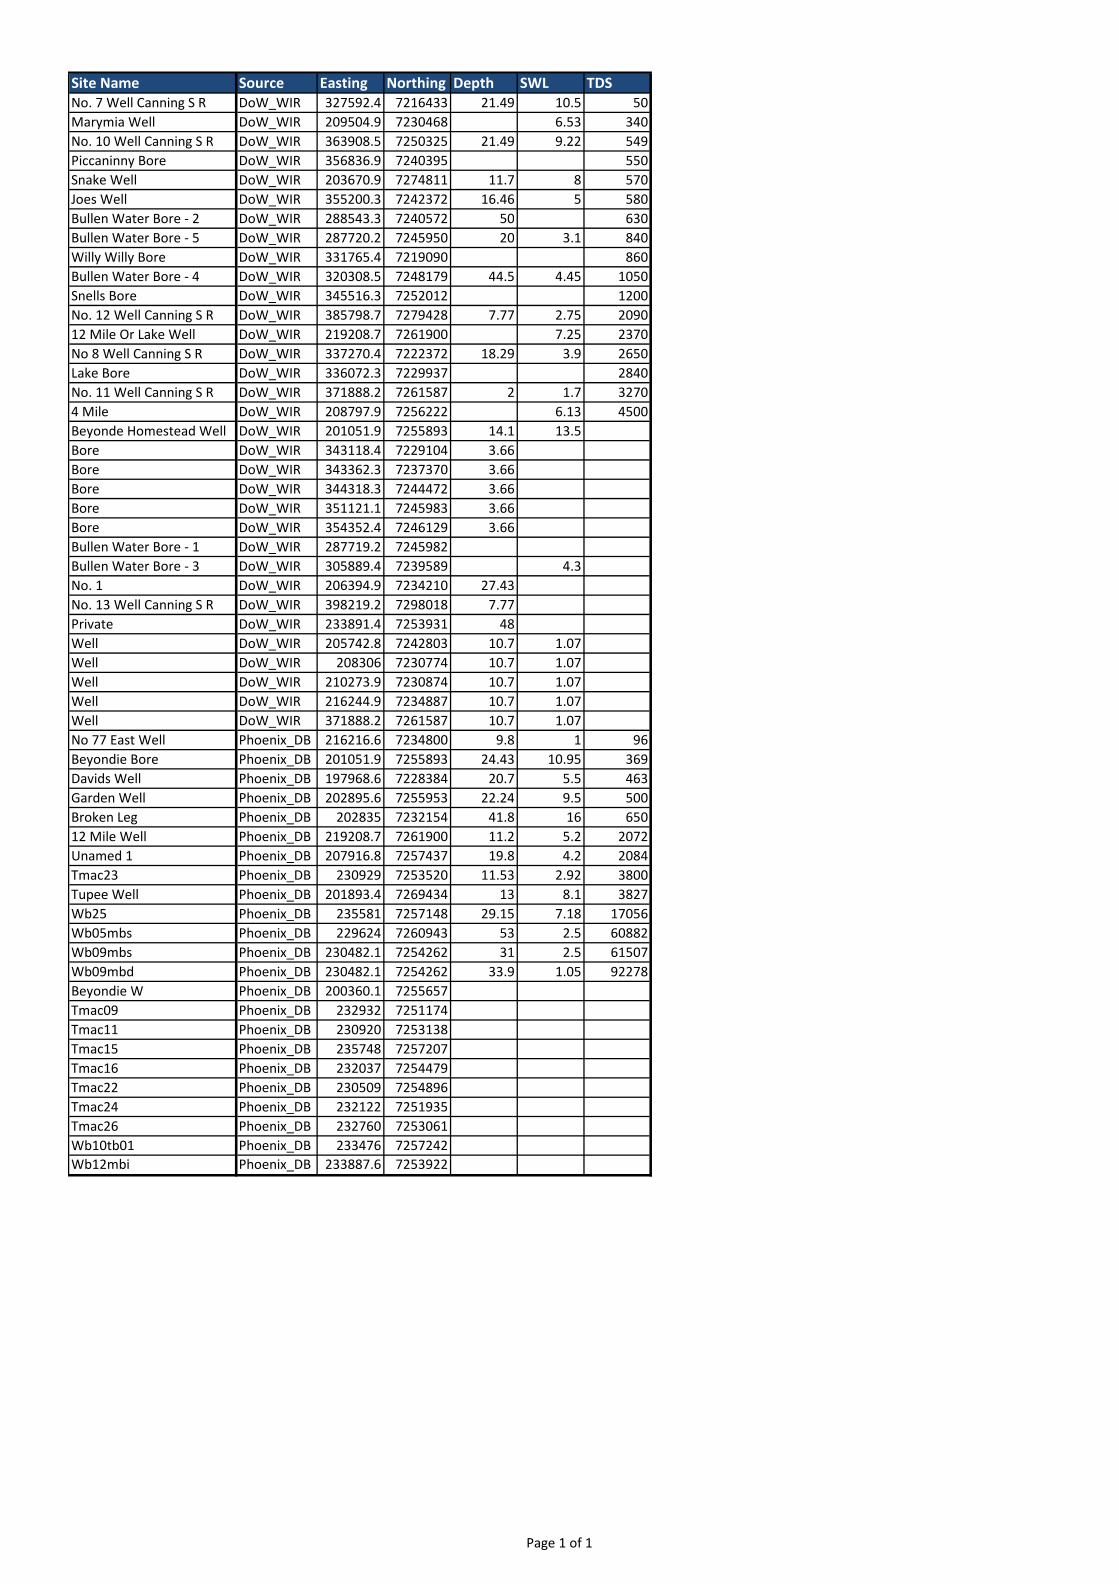
2.4 Existing Groundwater Bores and Users
Information on available groundwater bores in the vicinity of the Project, including the KLP bores
currently being assessed for subterranean fauna by Phoenix Environmental, and Department of
Water Information Reporting (WIR, DoW, 2017) database records, were obtained (see bore
locations in Figure 3 and details in Appendix A).
10
8
12
14 16 18
18
16
1614
1820
108
6
12
10
10
12 14 16 24
22
24
22
20
18 20
WB25TMAC15
TMAC09
TMAC26
TMAC24
TMAC16
TMAC11
TMAC22
TMAC23WB12MBI
PRIVATE
WB09MBDWB09MBS
WB05MBS
WB10TB01
222500
222500
225000
225000
227500
227500
230000
230000
232500
232500
235000
235000
237500
237500
240000
240000
7252
500
7252
500
7255
000
7255
000
7257
500
7257
500
7260
000
7260
000
LEGEND
Copyright ©WorleyParsons Services Pty Ltd
ABN 61 001 279 812
LOCATION PLAN
Rev: A
FIG 2: Interpreted thickness of surficial sediments based on downhole data in the 10 mile area
Date: 12 Jul 2017Customer: Kalium Lakes
M.P - GeomaticsLocation: I:\Projects\201320-14624 Kalium Lake potash\5_Engineering\GM-Geomatics\03Project\Workspace\EPA Submission - Fig 2.mxd
GDA 1994 MGA Zone 51Proj:Transverse MercatorDatum: GDA 1994
0 1 20.5
Kilometers at A3
BoresMining Tenement Surficial Aquifer Thickness
!.
!.
!.
!.
!.!.
!.
!.
!.
!.
!.
!.
!.!.
!.
!.
!.
!.!.
!.
!. !.
!.
!.
!.
!.
!.!.
!.
!.
!.
!.
!.
!.
!.
!.
WELL
WELLWELL
WELL
WB25
NO. 1
TMAC15
TMAC09
TMAC26TMAC16
TMAC11
TMAC224 MILE
TMAC23
WB12MBIWB09MBD
WB05MBS
WB10TB01beyondie w
TUPEE WELLTUPEE WELL
broken leg
SNAKE WELL
GARDEN WELLGARDEN WELL
DAVIDS WELL
12 MILE WELL
MARYMIA WELL
NO 77 EAST WELL
12 MILE OR LAKE WELL
180000
180000
190000
190000
200000
200000
210000
210000
220000
220000
230000
230000
240000
240000
250000
250000
260000
260000
270000
270000
7230
000
7230
000
7240
000
7240
000
7250
000
7250
000
7260
000
7260
000
7270
000
7270
000
7280
000
7280
000
LEGEND
Copyright ©WorleyParsons Services Pty Ltd
ABN 61 001 279 812
LOCATION PLAN
Rev: A
FIG 3: Regional Bore Locations
Date: 14 Jul 2017Customer: Kalium Lakes
M.P - GeomaticsLocation: I:\Projects\201320-14624 Kalium Lake potash\5_Engineering\GM-Geomatics\03Project\Workspace\EPA Submission - Fig 3.mxd
GDA 1994 MGA Zone 51Proj:Transverse MercatorDatum: GDA 1994
0 10 205
Kilometers at A3
!. BoresLakeMining Tenement
Kalium Lakes Potash Pty Ltd
Beyondie Potash Project
Preliminary Water Supply Assessment
Advisian 8
The WIR database records 36 regional bores in the vicinity of the Project, within a search radius of
approximately 100 km. These are generally shallow (between 4 and 22 metres below ground level
(mbgl), low yielding stock bores, and provide limited information on the seasonal groundwater
flow regime.
There are unlicensed bores within the search area believed to be constructed in the shallow
alluvium and calcrete aquifer. Bore construction details, downhole geology, borehole logs and
abstraction volumes are mostly unknown.
Phoenix Environmental has monitored some of the regional bores that are on the WIR database as
part of the recent subterranean fauna survey. Homestead well has historically been used for stock
watering however current use or volumes are unknown. It is also understood that Garden well and
4 Mile well supply water to tanks and cattle troughs and that 12 Mile well is currently unused. The
bores on the Kalium database including those assessed by Phoenix Environmental show depths
between 9.8 m and >100 mbgl, in areas of the resource exploration. Groundwater levels range
between 1 and 16 metres below Top of Casing (mbToC) and the available records suggest that the
water quality is likely to be fresh to saline, depending on the geology, depth and relative position
in the basin.
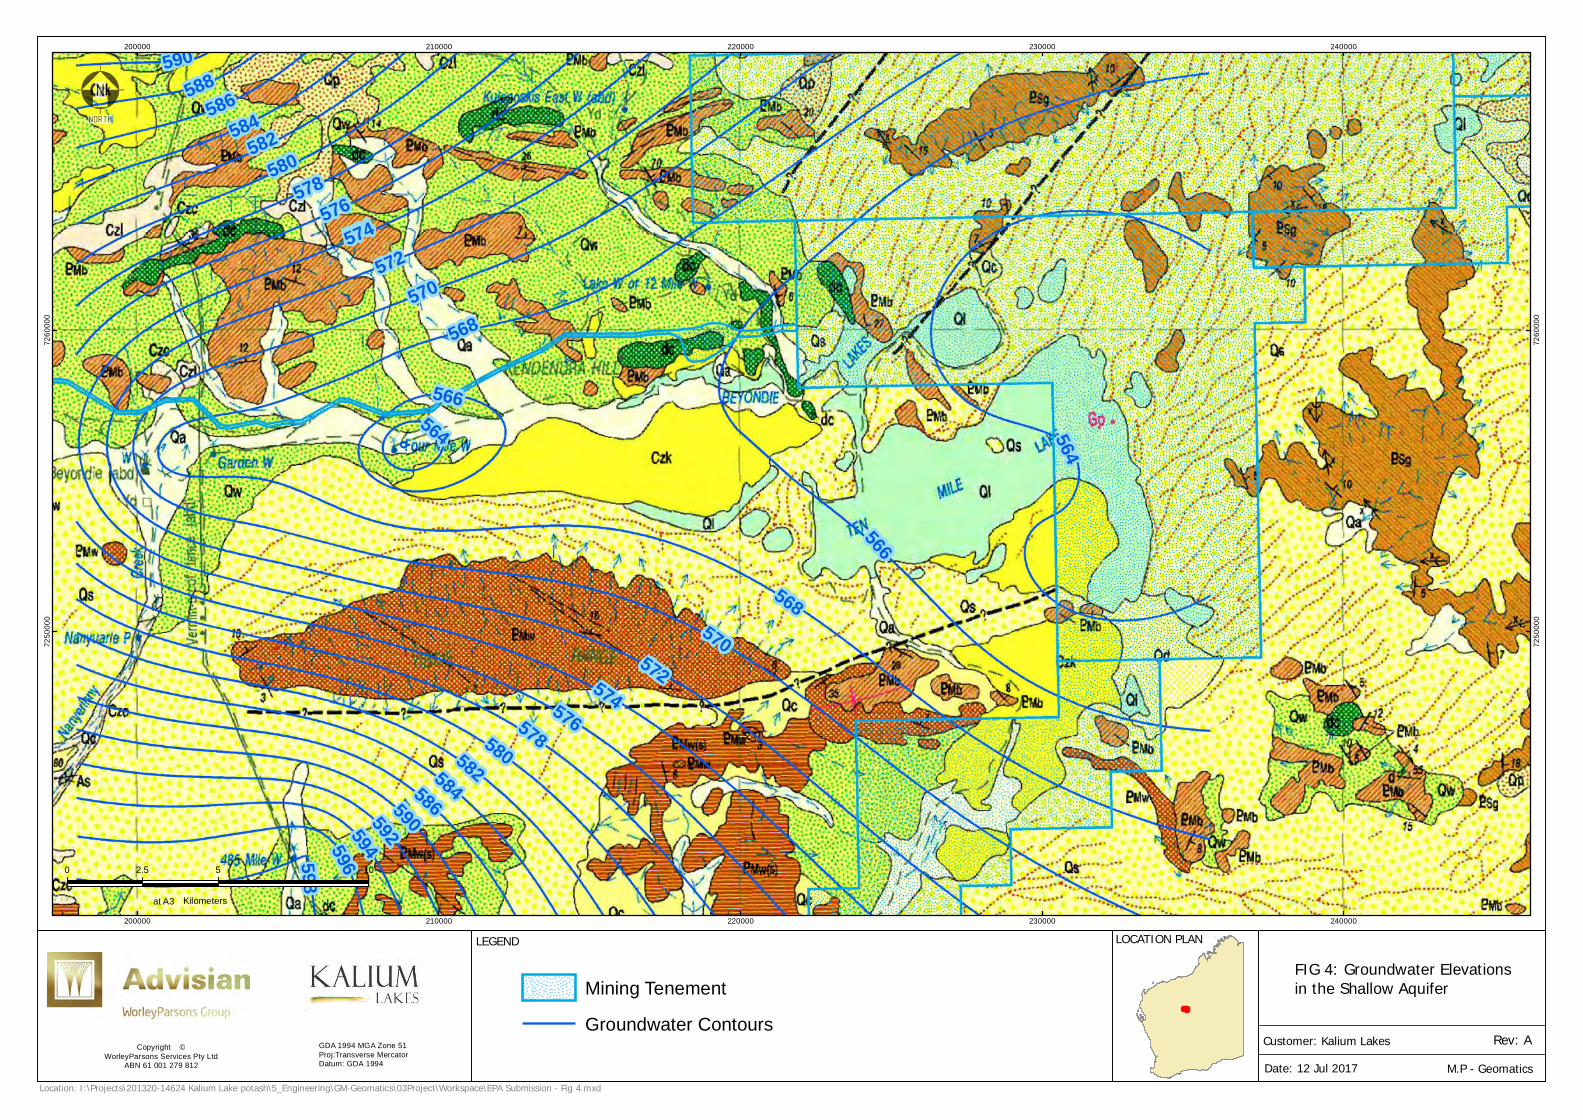
2.5 Groundwater Levels
Standing water levels (SWLs) range between 1 and 17 mbToC in the WIR database and between 1
and 16 mbToC in the bores in the immediate vicinity of the Project area, as derived from the
Phoenix Environmental database (Appendix A). Groundwater table elevations have been derived
from SRTM data and/or Google Earth and contours presented in Figure 4. This contour map
indicates that shallow groundwater flow is from west to east across the wider project area,
approximately reflecting topography.
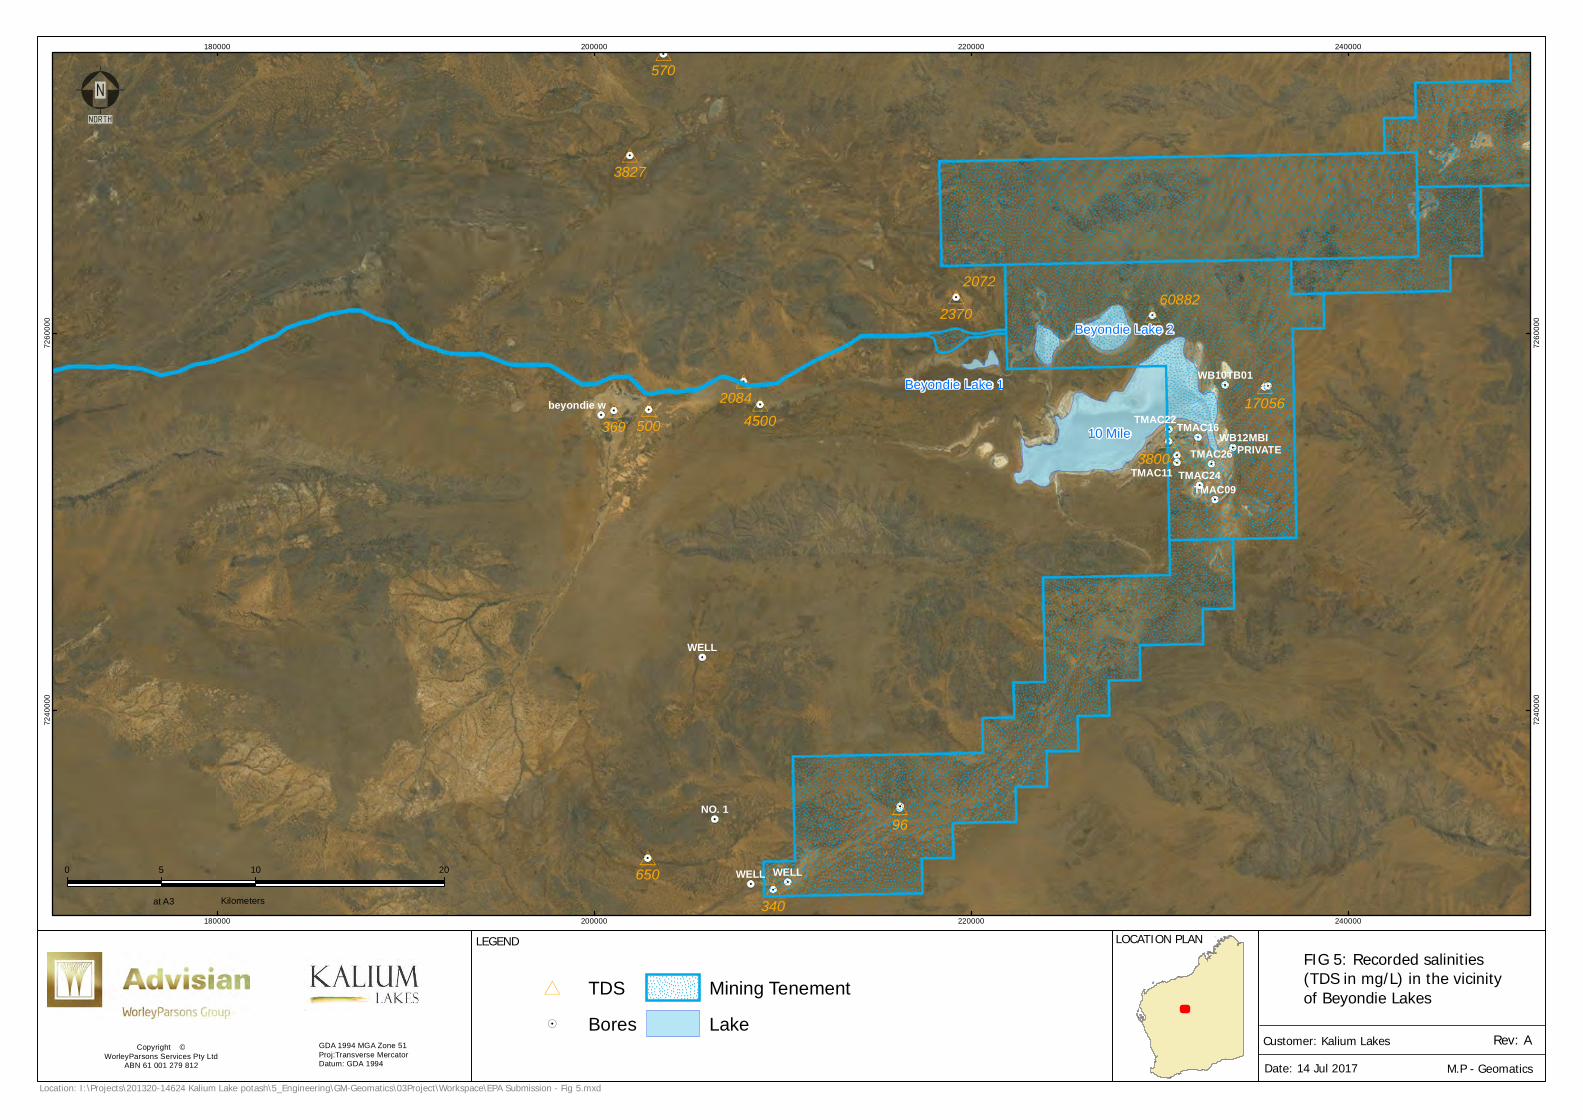
2.6 Groundwater Salinity
Recorded groundwater salinities as Total Dissolved Solids (TDS) range between 340 and 4,500
milligrams /litre (mg/L) in the WIR regional bores. In the vicinity of the Project area, salinity values
range between 100 and 4,500 mg/L (Appendix A). Figure 5 shows the salinity values recorded and
indicates that the lower salinities occur at break of slope areas within small catchment divides and
near direct surface recharge zones whereas the higher salinities are recorded closer to the
palaeodrainage.
2.7 Groundwater Dependent Ecosystems
The Bureau of Meteorology (BoM) Groundwater Dependent Ecosystems (GDE) Atlas (BoM, 2017)
does not indicate GDEs of concern in the project area. The preliminary PFS and subsequent
hydrogeological report (KLP 2016, AQ2 2016) also reported that there are no GDEs within 30 km
radius from the Beyondie Lakes project. It is concluded in the PFS that the proposed pumping from
the main basal sand aquifer and shallow surficial aquifers during mining are highly unlikely to have

Kalium Lakes Potash Pty Ltd
Beyondie Potash Project
Preliminary Water Supply Assessment
Advisian 9
any adverse impacts on the environment, owing to groundwater being hypersaline. However,
abstraction of groundwater from shallow calcrete and alluvial aquifers may have a potential
localised impact on groundwater dependent vegetation (GDVs) due to reduced water availability.
This will need to be quantified in future water supply impact assessments.
564
566
568570
572574576578580582584586590
568570
572574576574
578580582584586588590
592594596598
566564
200000
200000
210000
210000
220000
220000
230000
230000
240000
240000
7250
000
7250
000
7260
000
7260
000
LEGEND
Copyright ©WorleyParsons Services Pty Ltd
ABN 61 001 279 812
LOCATION PLAN
Rev: ADate: 12 Jul 2017Customer: Kalium Lakes
M.P - GeomaticsLocation: I:\Projects\201320-14624 Kalium Lake potash\5_Engineering\GM-Geomatics\03Project\Workspace\EPA Submission - Fig 4.mxd
GDA 1994 MGA Zone 51Proj:Transverse MercatorDatum: GDA 1994
0 5 102.5
Kilometers at A3
Mining TenementGroundwater Contours
FIG 4: Groundwater Elevationsin the Shallow Aquifer
10 Mile
Beyondie Lake 2
Beyondie Lake 1
WELLWELL
WELL
NO. 1
TMAC09
TMAC26TMAC24
TMAC16
TMAC11
TMAC22WB12MBI
PRIVATE
WB10TB01
beyondie w
96
650
570
500369
340
4500
3827
3800
2370
2084
207260882
17056
180000
180000
200000
200000
220000
220000
240000
240000
7240
000
7240
000
7260
000
7260
000
LEGEND
Copyright ©WorleyParsons Services Pty Ltd
ABN 61 001 279 812
LOCATION PLAN
Rev: ADate: 14 Jul 2017 M.P - Geomatics
Location: I:\Projects\201320-14624 Kalium Lake potash\5_Engineering\GM-Geomatics\03Project\Workspace\EPA Submission - Fig 5.mxd
GDA 1994 MGA Zone 51Proj:Transverse MercatorDatum: GDA 1994
0 10 205
Kilometers at A3
* TDS!. Bores
Mining TenementLake
FIG 5: Recorded salinities(TDS in mg/L) in the vicinityof Beyondie Lakes
Customer: Kalium Lakes
Kalium Lakes Potash Pty Ltd
Beyondie Potash Project
Preliminary Water Supply Assessment
Advisian 12
2.8 Hydraulic Properties
Regionally, calcrete aquifers are reported to have highly varying hydraulic conductivities (k) and
specific yield (Sy) values. Johnson et al, 1999 state that specific yields are high where associated
with karstic development, commonly close to or at the water table, and lowest where the calcrete is
massive. Hydraulic conductivity will depend on the vuggy and karstic nature of the calcretes.
Within the Project area, test bore WB11 was completed in calcrete and test pumped during the
2016 program at approximately 3 L/s, the aquifer parameters derived from the test indicated a k
value of approximately 4 metres / day (m/d) for the calcrete aquifer (AQ2, 2016). Mini constant
rate aquifer tests, conducted in bores in the calcrete aquifer recorded k values between 12 m/d
(WB10_I) and 7.6 m/d (WB11_I), which gives an average of 10.1 m/d. These k values show that the
aquifer is potentially capable of supplying water if an adequate thickness of the aquifer is
encountered.
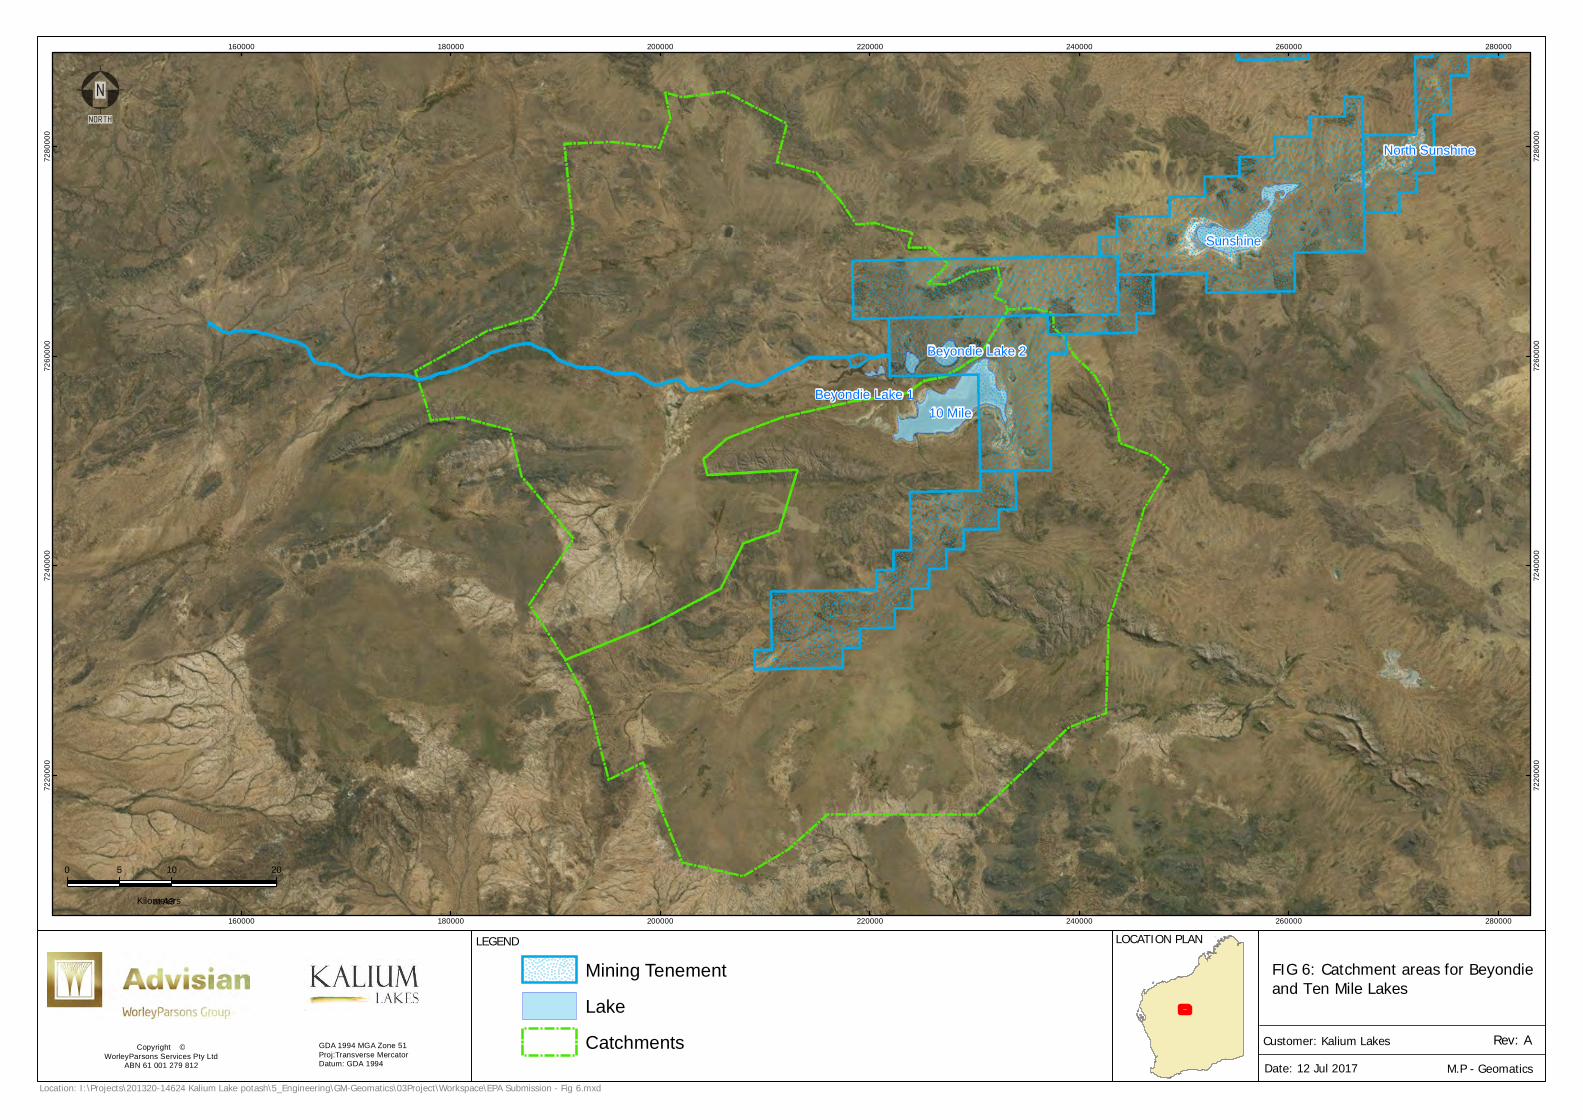
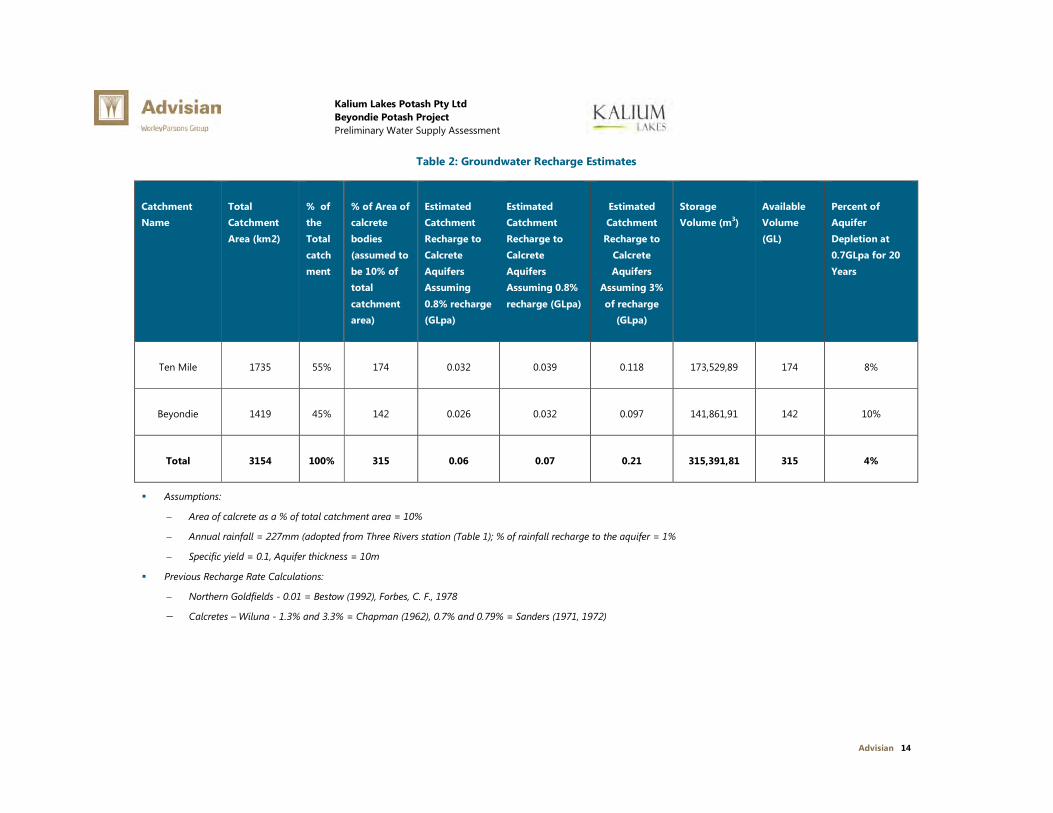
2.9 Groundwater Recharge and Availability
Calcrete aquifers are recharged through direct rainfall, local runoff where they outcrop and / or by
infiltration during sheet run off or stream flows. Groundwater recharge and available groundwater
storage in the calcrete aquifer has been estimated (Table 2) by assuming that calcrete bodies form
10% of the total available catchment areas of Beyondie and Ten Mile creek. The catchment areas
for Beyondie and Ten Mile Lake extend more than 50 km upstream (Figure 6), with the lakes fed by
ephemeral streams that drain from west to east and terminate at 10 Mile Lake. Catchment areas
were calculated from the available SRTM data and are presented in Table 2.
Available groundwater recharge is estimated by multiplying the annual rainfall, assumed as 227
mm/yr, based on data from the Three Rivers Station rainfall gauge, catchment areas of the two
individual sub-catchments and the areal extent of the individual calcrete bodies assumed to be
10% of the total catchment area. Recharge to groundwater is assumed to range between 0.7 and
3% of rainfall from available literature. The results in Table 2 indicate that based on available data
annual recharge of the calcrete aquifers is estimated to range between 0.06 and 0.2 GLpa.
Available storage volume in the aquifer was also estimated for the assumed calcrete area, using a
conservative thickness of 10 m and a specific yield of 0.1. The results indicate that the aquifer
depletion for the project water demand of 0.7 GLpa for the 20 year mine life is approximately 4%
of the total available storage volume and approximately 10% for 1.5 GLpa. This is an indicative
estimate only and will need to be confirmed after field exploration, aquifer testing and predictive
modelling.
10 Mile
Sunshine
Beyondie Lake 2
Beyondie Lake 1
North Sunshine
160000
160000
180000
180000
200000
200000
220000
220000
240000
240000
260000
260000
280000
280000
7220
000
7220
000
7240
000
7240
000
7260
000
7260
000
7280
000
7280
000
LEGEND
Copyright ©WorleyParsons Services Pty Ltd
ABN 61 001 279 812
LOCATION PLAN
Rev: ADate: 12 Jul 2017 M.P - Geomatics
Location: I:\Projects\201320-14624 Kalium Lake potash\5_Engineering\GM-Geomatics\03Project\Workspace\EPA Submission - Fig 6.mxd
GDA 1994 MGA Zone 51Proj:Transverse MercatorDatum: GDA 1994
0 10 205
Kilometers at A3
Mining TenementLakeCatchments
FIG 6: Catchment areas for Beyondieand Ten Mile Lakes
Customer: Kalium Lakes
Kalium Lakes Potash Pty Ltd
Beyondie Potash Project
Preliminary Water Supply Assessment
Advisian 14
Table 2: Groundwater Recharge Estimates
Catchment
Name
Total
Catchment
Area (km2)
% of
the
Total
catch
ment
% of Area of
calcrete
bodies
(assumed to
be 10% of
total
catchment
area)
Estimated
Catchment
Recharge to
Calcrete
Aquifers
Assuming
0.8% recharge
(GLpa)
Estimated
Catchment
Recharge to
Calcrete
Aquifers
Assuming 0.8%
recharge (GLpa)
Estimated
Catchment
Recharge to
Calcrete
Aquifers
Assuming 3%
of recharge
(GLpa)
Storage
Volume (m3)
Available
Volume
(GL)
Percent of
Aquifer
Depletion at
0.7GLpa for 20
Years
Ten Mile 1735 55% 174 0.032 0.039 0.118 173,529,89 174 8%
Beyondie 1419 45% 142 0.026 0.032 0.097 141,861,91 142 10%
Total 3154 100% 315 0.06 0.07 0.21 315,391,81 315 4%
� Assumptions:
− Area of calcrete as a % of total catchment area = 10%
− Annual rainfall = 227mm (adopted from Three Rivers station (Table 1); % of rainfall recharge to the aquifer = 1%
− Specific yield = 0.1, Aquifer thickness = 10m
� Previous Recharge Rate Calculations:
− Northern Goldfields - 0.01 = Bestow (1992), Forbes, C. F., 1978
− Calcretes – Wiluna - 1.3% and 3.3% = Chapman (1962), 0.7% and 0.79% = Sanders (1971, 1972)
Kalium Lakes Potash Pty Ltd
Beyondie Potash Project
Preliminary Water Supply Assessment
Advisian 15
3 Groundwater Supply Target Areas
Surface drainage catchments running from west to east within the Beyondie and Ten Mile Lake
catchments feeding large calcrete deposits are interpreted to be primary water supply targets.
Calcretes occurring in drainage depressions or valleys and alluvial material transported by the
present day channel or deposited along intersections of fractures and drainage lines can form
potential water supply zones in these areas where they have saturated thicknesses of greater than
10 m. Assuming a bore yield of 2 to 5 L/s, it is estimated that between 5 and 12 bores may be
needed in the calcrete and alluvial aquifer to meet the project water demand of 0.7 GLpa
(Approximately 22 L/s). Drilling and exploration will be needed to confirm the saturated thickness
and water quality within these aquifer targets.
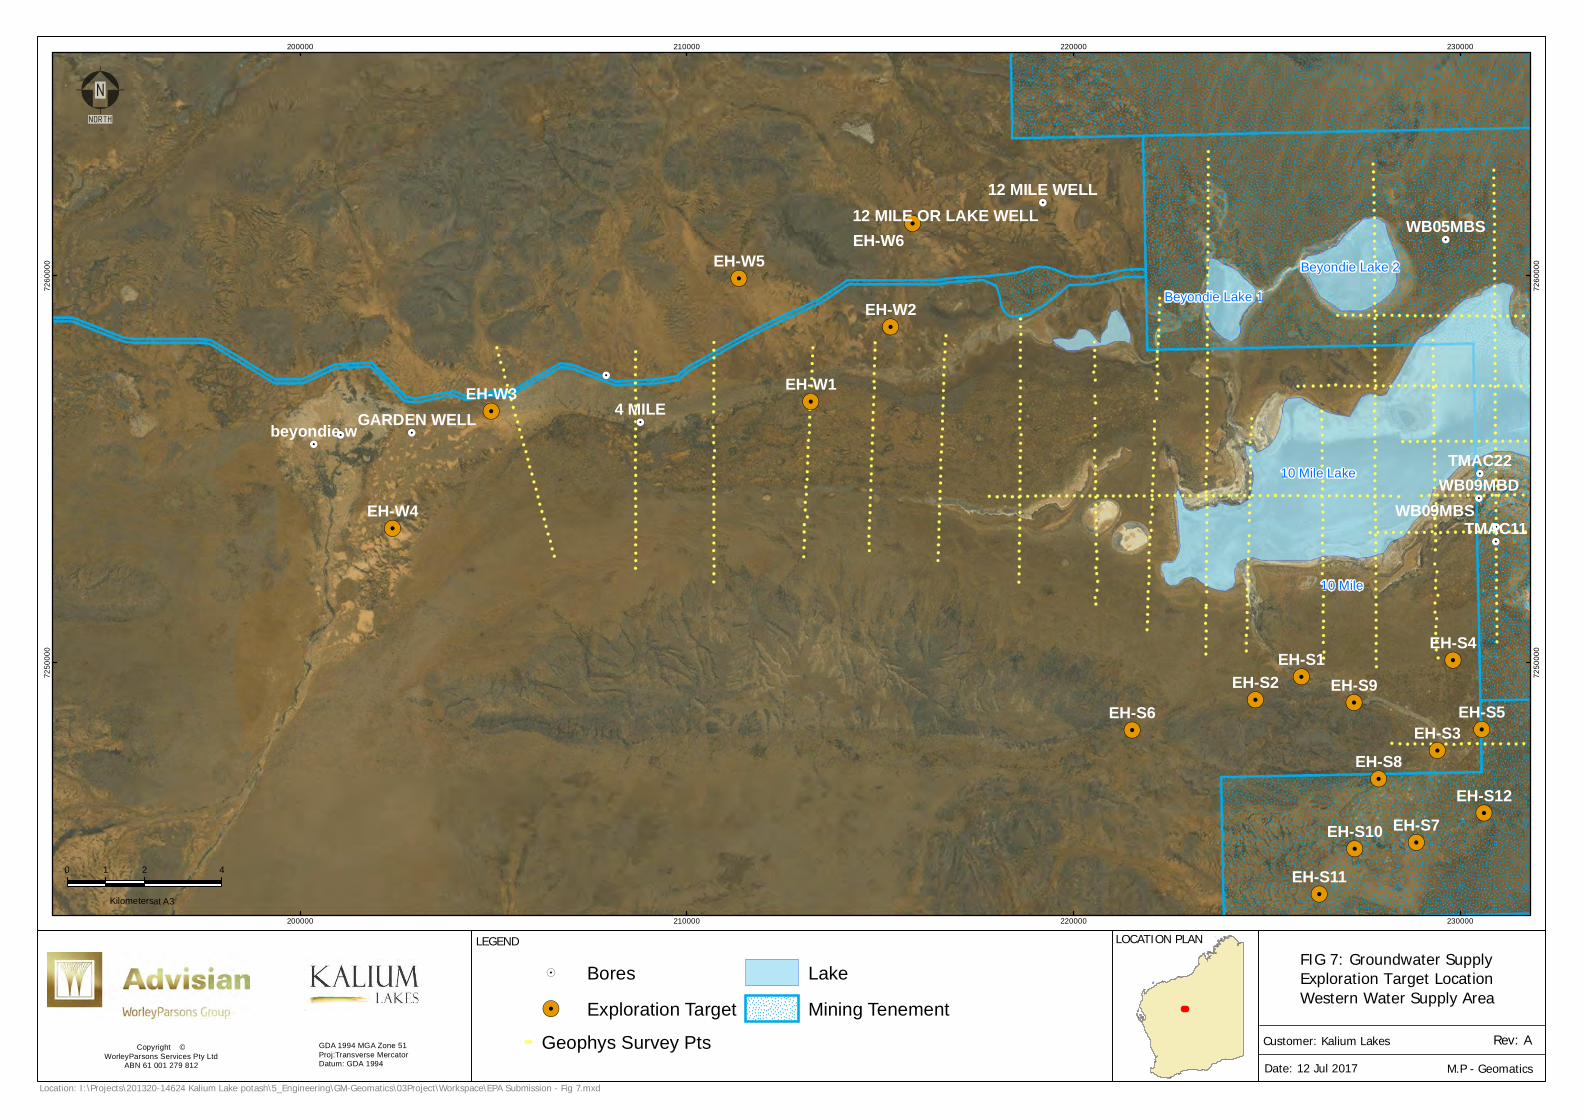
3.1 Water Supply Targets
Potential exploration drill targets have been identified based on the results of the geophysical
testing program, surface geology, topography and analytical predictions. Two main water supply
areas, one to the west of the lakes and the other to the south have been selected, keeping the
minimum distance between targets to be greater than 1 km. The western locations are shown on
and the rationale behind their selection is presented in Table 3.
The Figure 7 shows that three of the locations are selected in the main alluvial channel of the
present day drainage. The remaining target locations are along the break of slope where smaller
tributaries join the main channel and the change in slope, even if minor, may result in a change in
velocity resulting in deposition of alluvial and colluvial sediments. EH-W3 and EH-W4 are closer to
Homestead Well, where groundwater quality has been tested to be fresh, may be better locations
than EH-W2 if the site reconnaissance indicates evidence of thicker sediments and relative
intersection with the structural feature at depth, specifically at EH-W3. The order of preference is
indicative at this stage and will be finalised during a site reconnaissance that is essential prior to
commencement of the exploration program.
Locations and the rationale behind the selection of the exploration drill targets in the southern
water supply area are outlined in Table 3.
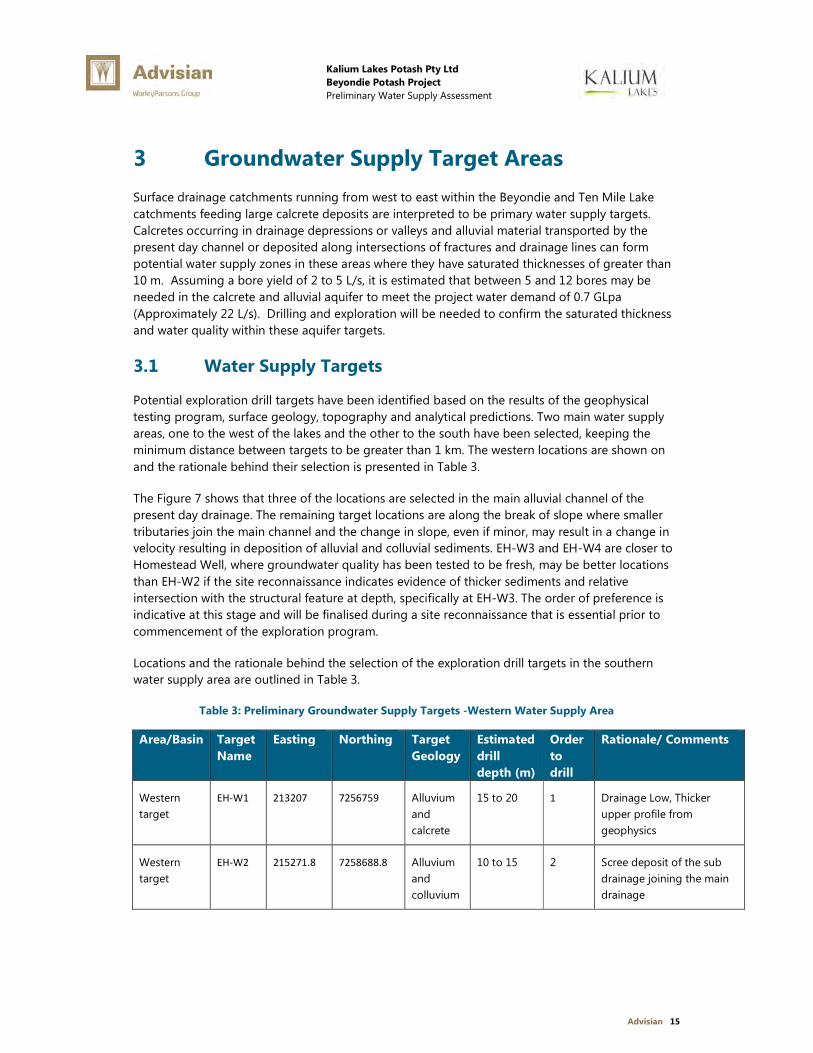
Table 3: Preliminary Groundwater Supply Targets -Western Water Supply Area
Area/Basin Target
Name
Easting Northing Target
Geology
Estimated
drill
depth (m)
Order
to
drill
Rationale/ Comments
Western
target
EH-W1 213207 7256759 Alluvium
and
calcrete
15 to 20 1 Drainage Low, Thicker
upper profile from
geophysics
Western
target
EH-W2 215271.8 7258688.8 Alluvium
and
colluvium
10 to 15 2 Scree deposit of the sub
drainage joining the main
drainage
Kalium Lakes Potash Pty Ltd
Beyondie Potash Project
Preliminary Water Supply Assessment
Advisian 16
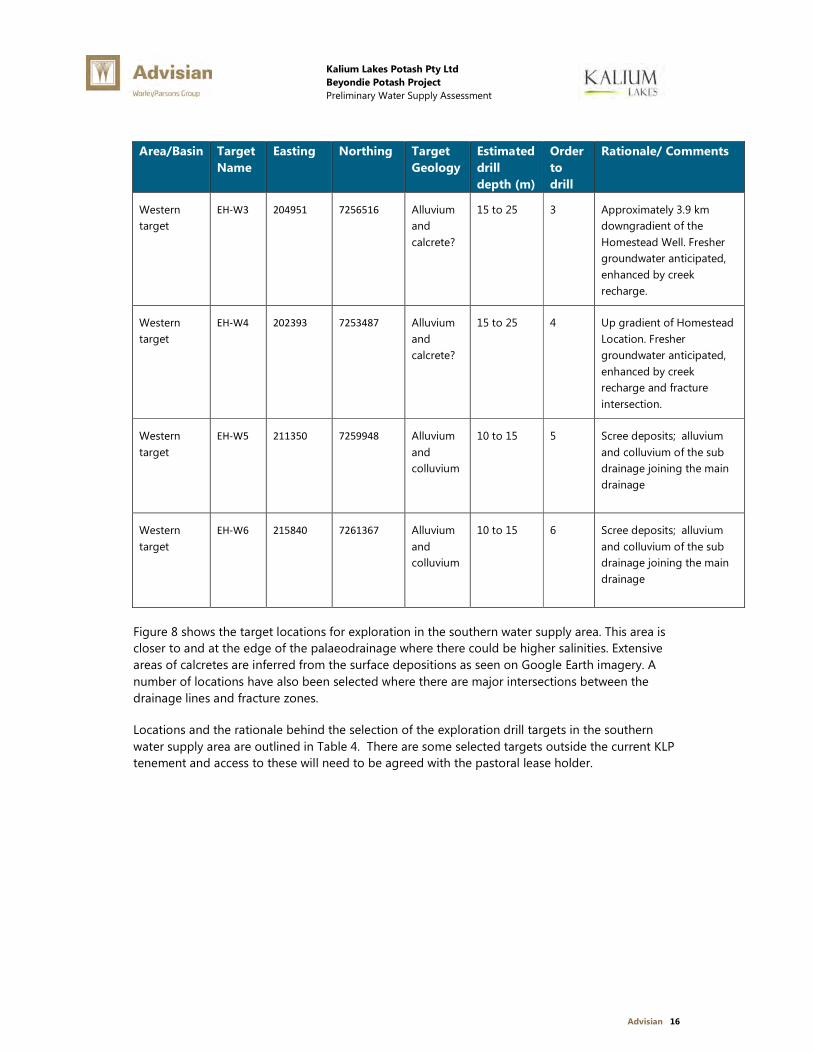
Area/Basin Target
Name
Easting Northing Target
Geology
Estimated
drill
depth (m)
Order
to
drill
Rationale/ Comments
Western
target
EH-W3 204951 7256516 Alluvium
and
calcrete?
15 to 25 3 Approximately 3.9 km
downgradient of the
Homestead Well. Fresher
groundwater anticipated,
enhanced by creek
recharge.
Western
target
EH-W4 202393 7253487 Alluvium
and
calcrete?
15 to 25 4 Up gradient of Homestead
Location. Fresher
groundwater anticipated,
enhanced by creek
recharge and fracture
intersection.
Western
target
EH-W5 211350 7259948 Alluvium
and
colluvium
10 to 15 5 Scree deposits; alluvium
and colluvium of the sub
drainage joining the main
drainage
Western
target
EH-W6 215840 7261367 Alluvium
and
colluvium
10 to 15 6 Scree deposits; alluvium
and colluvium of the sub
drainage joining the main
drainage
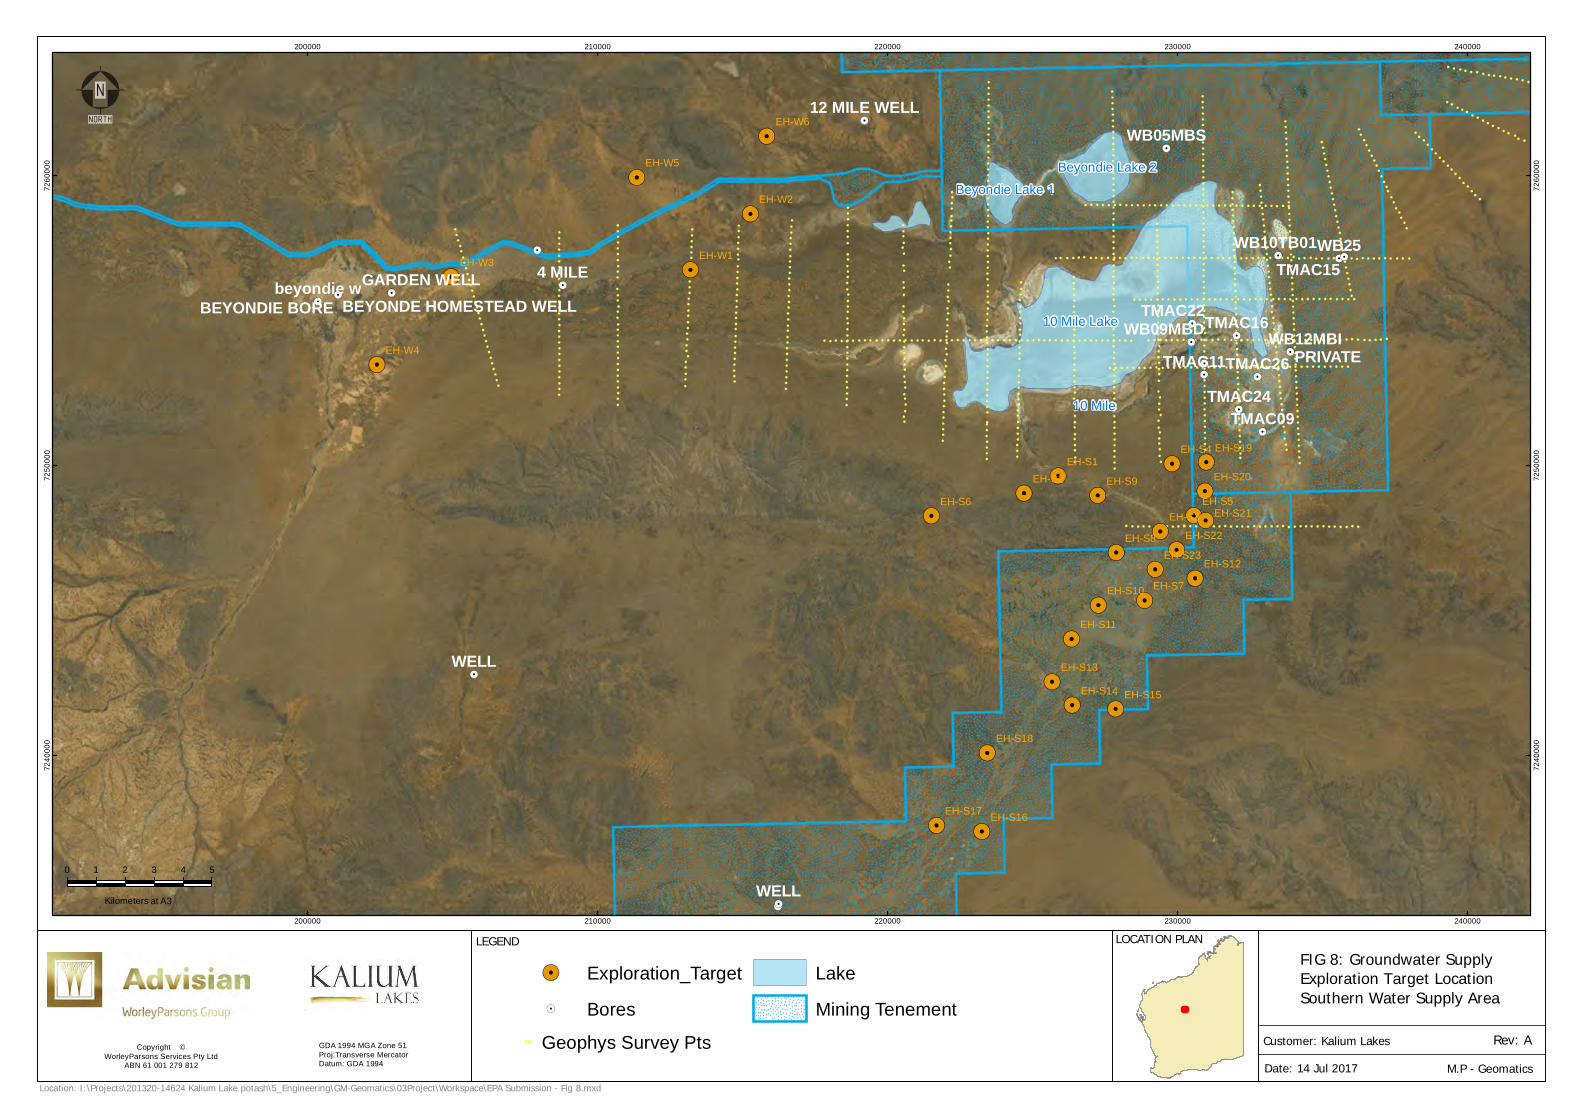
Figure 8 shows the target locations for exploration in the southern water supply area. This area is
closer to and at the edge of the palaeodrainage where there could be higher salinities. Extensive
areas of calcretes are inferred from the surface depositions as seen on Google Earth imagery. A
number of locations have also been selected where there are major intersections between the
drainage lines and fracture zones.
Locations and the rationale behind the selection of the exploration drill targets in the southern
water supply area are outlined in Table 4. There are some selected targets outside the current KLP
tenement and access to these will need to be agreed with the pastoral lease holder.
!. !.!.
!.
!.
!.
!.
!.
!.
!.!.
!.!.
!.
!.
!.
!.
!.
!.
!.
!.
!.
!.!.
!.
!.
!.!.
!.
!.
!.
!.
!.
!.
10 Mile
Beyondie Lake 2
10 Mile Lake
Beyondie Lake 1
TMAC11
TMAC22
4 MILE
WB09MBDWB09MBS
WB05MBS
beyondie wGARDEN WELL
12 MILE WELL12 MILE OR LAKE WELL
EH-S9
EH-S8
EH-S7
EH-S6 EH-S5
EH-S4
EH-S3
EH-S2EH-S1
EH-W6EH-W5
EH-W4
EH-W3
EH-W2
EH-W1
EH-S12
EH-S11
EH-S10
200000
200000
210000
210000
220000
220000
230000
230000
7250
000
7250
000
7260
000
7260
000
LEGEND
Copyright ©WorleyParsons Services Pty Ltd
ABN 61 001 279 812
LOCATION PLAN
Rev: ADate: 12 Jul 2017 M.P - Geomatics
Location: I:\Projects\201320-14624 Kalium Lake potash\5_Engineering\GM-Geomatics\03Project\Workspace\EPA Submission - Fig 7.mxd
GDA 1994 MGA Zone 51Proj:Transverse MercatorDatum: GDA 1994
0 2 41
Kilometers at A3
!. Bores!. Exploration TargetGeophys Survey Pts
LakeMining Tenement
FIG 7: Groundwater SupplyExploration Target Location Western Water Supply Area
Customer: Kalium Lakes
Kalium Lakes Potash Pty Ltd
Beyondie Potash Project
Preliminary Water Supply Assessment
Advisian 18
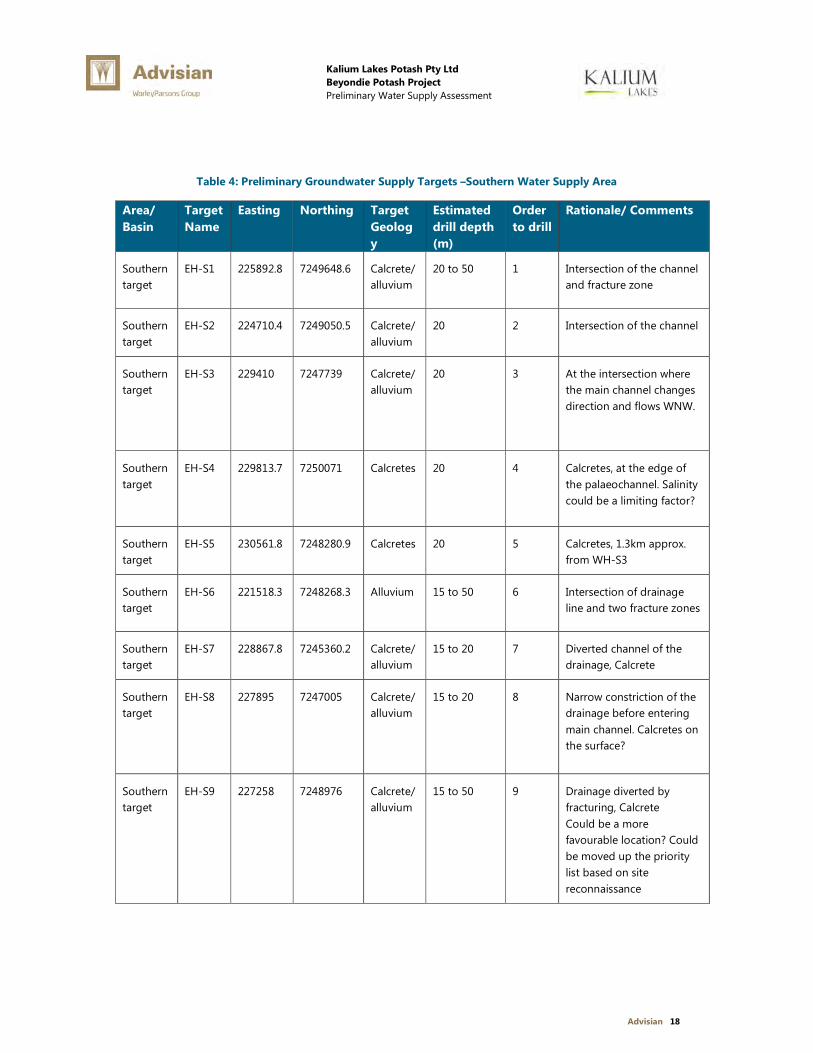
Table 4: Preliminary Groundwater Supply Targets –Southern Water Supply Area
Area/
Basin
Target
Name
Easting Northing Target
Geolog
y
Estimated
drill depth
(m)
Order
to drill
Rationale/ Comments
Southern
target
EH-S1 225892.8 7249648.6 Calcrete/
alluvium
20 to 50 1 Intersection of the channel
and fracture zone
Southern
target
EH-S2 224710.4 7249050.5 Calcrete/
alluvium
20 2 Intersection of the channel
Southern
target
EH-S3 229410 7247739 Calcrete/
alluvium
20 3 At the intersection where
the main channel changes
direction and flows WNW.
Southern
target
EH-S4 229813.7 7250071 Calcretes 20 4 Calcretes, at the edge of
the palaeochannel. Salinity
could be a limiting factor?
Southern
target
EH-S5 230561.8 7248280.9 Calcretes 20 5 Calcretes, 1.3km approx.
from WH-S3
Southern
target
EH-S6 221518.3 7248268.3 Alluvium 15 to 50 6 Intersection of drainage
line and two fracture zones
Southern
target
EH-S7 228867.8 7245360.2 Calcrete/
alluvium
15 to 20 7 Diverted channel of the
drainage, Calcrete
Southern
target
EH-S8 227895 7247005 Calcrete/
alluvium
15 to 20 8 Narrow constriction of the
drainage before entering
main channel. Calcretes on
the surface?
Southern
target
EH-S9 227258 7248976 Calcrete/
alluvium
15 to 50 9 Drainage diverted by
fracturing, Calcrete
Could be a more
favourable location? Could
be moved up the priority
list based on site
reconnaissance
Kalium Lakes Potash Pty Ltd
Beyondie Potash Project
Preliminary Water Supply Assessment
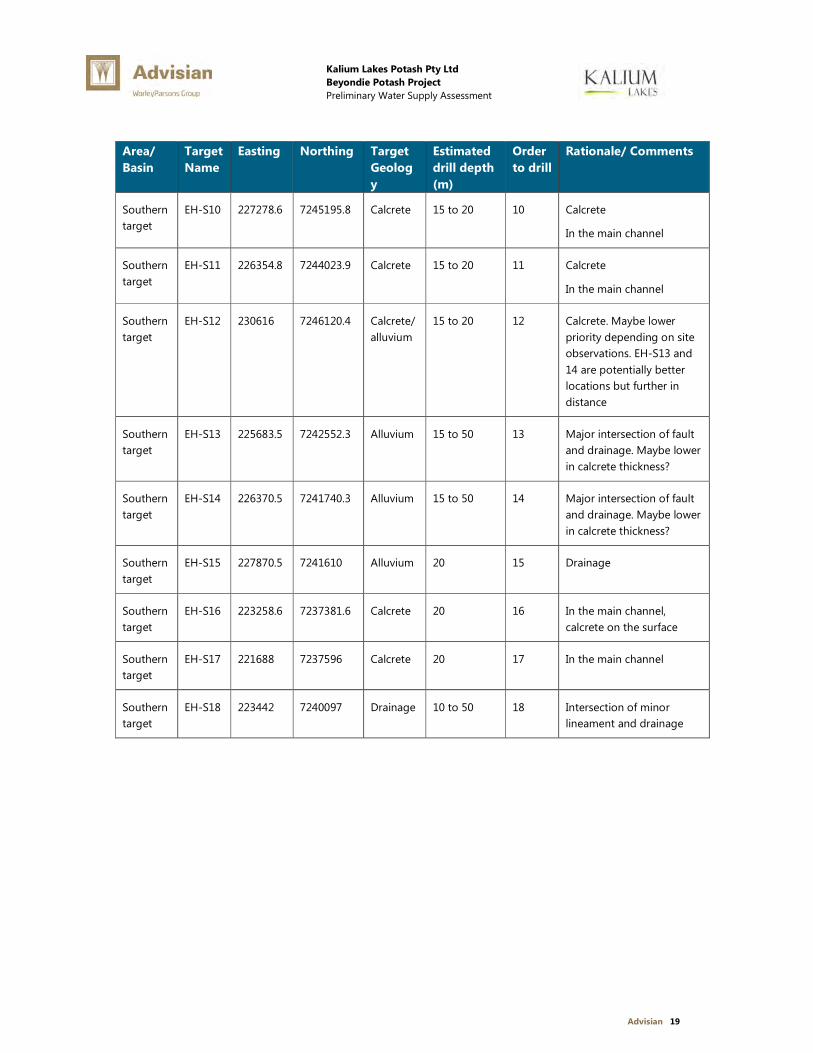
Advisian 19
Area/
Basin
Target
Name
Easting Northing Target
Geolog
y
Estimated
drill depth
(m)
Order
to drill
Rationale/ Comments
Southern
target
EH-S10 227278.6 7245195.8 Calcrete 15 to 20 10 Calcrete
In the main channel
Southern
target
EH-S11 226354.8 7244023.9 Calcrete 15 to 20 11 Calcrete
In the main channel
Southern
target
EH-S12 230616 7246120.4 Calcrete/
alluvium
15 to 20 12 Calcrete. Maybe lower
priority depending on site
observations. EH-S13 and
14 are potentially better
locations but further in
distance
Southern
target
EH-S13 225683.5 7242552.3 Alluvium 15 to 50 13 Major intersection of fault
and drainage. Maybe lower
in calcrete thickness?
Southern
target
EH-S14 226370.5 7241740.3 Alluvium 15 to 50 14 Major intersection of fault
and drainage. Maybe lower
in calcrete thickness?
Southern
target
EH-S15 227870.5 7241610 Alluvium 20 15 Drainage
Southern
target
EH-S16 223258.6 7237381.6 Calcrete 20 16 In the main channel,
calcrete on the surface
Southern
target
EH-S17 221688 7237596 Calcrete 20 17 In the main channel
Southern
target
EH-S18 223442 7240097 Drainage 10 to 50 18 Intersection of minor
lineament and drainage
!.
!. !.!.
!.
!.
!.
!.
!.
!.
!.
!.!.
!.
!.
!.
!.
!.
!.
!.
!.
!.
!.
!.
!.
!.
!.
!.
!.
!.
!.
!.
!.
!.
!.!.
!.
!.
!.!.
!.
!.
!.
!.
!.
!.
!.!. !.
!.!.
!.
!.
!.
!.
!.!.
10 Mile
Beyondie Lake 2
10 Mile Lake
Beyondie Lake 1
EH-S9
EH-S8
EH-S7
EH-S6 EH-S5
EH-S4
EH-S3
EH-S2EH-S1
EH-W6
EH-W5
EH-W4
EH-W3
EH-W2
EH-W1
EH-S23EH-S22
EH-S21
EH-S20
EH-S19
EH-S18
EH-S17 EH-S16
EH-S15EH-S14EH-S13
EH-S12
EH-S11
EH-S10
WELL
WELL
WB25TMAC15
TMAC09
TMAC26TMAC24
TMAC16
TMAC11
TMAC224 MILE
WB12MBIPRIVATE
WB09MBD
WB05MBS
WB10TB01
beyondie wGARDEN WELL
12 MILE WELL
BEYONDIE BORE BEYONDE HOMESTEAD WELL
200000
200000
210000
210000
220000
220000
230000
230000
240000
240000
7240
000
7240
000
7250
000
7250
000
7260
000
7260
000
LEGEND
Copyright ©WorleyParsons Services Pty Ltd
ABN 61 001 279 812
LOCATION PLAN
Rev: ADate: 14 Jul 2017 M.P - Geomatics
Location: I:\Projects\201320-14624 Kalium Lake potash\5_Engineering\GM-Geomatics\03Project\Workspace\EPA Submission - Fig 8.mxd
GDA 1994 MGA Zone 51Proj:Transverse MercatorDatum: GDA 1994
0 1 2 3 4 5
Kilometers at A3
!. Exploration_Target!. BoresGeophys Survey Pts
LakeMining Tenement
FIG 8: Groundwater SupplyExploration Target Location Southern Water Supply Area
Customer: Kalium Lakes
Kalium Lakes Potash Pty Ltd
Beyondie Potash Project
Preliminary Water Supply Assessment
Advisian 21
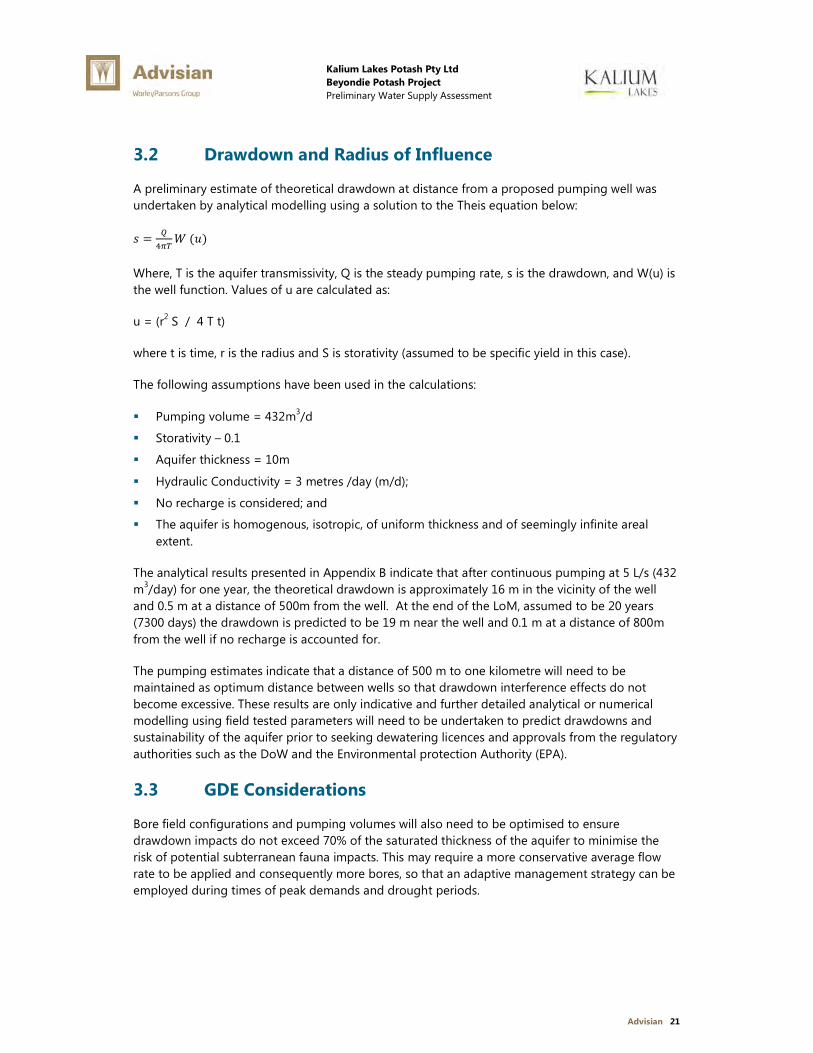
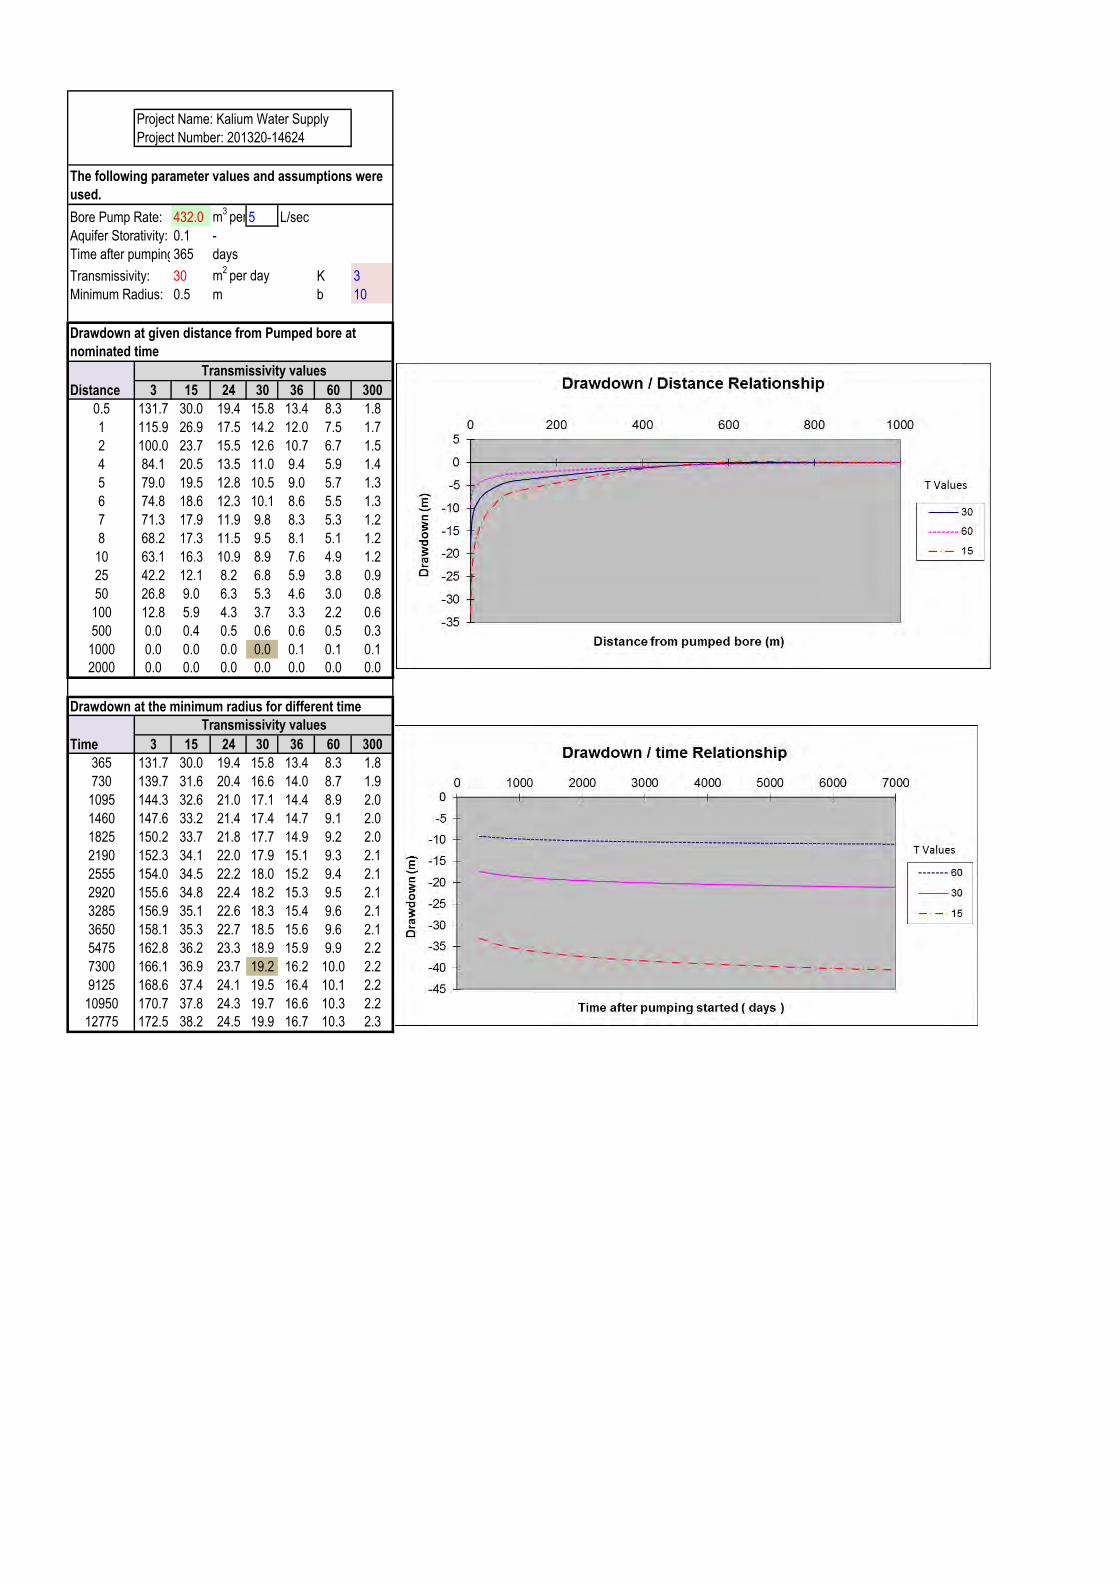
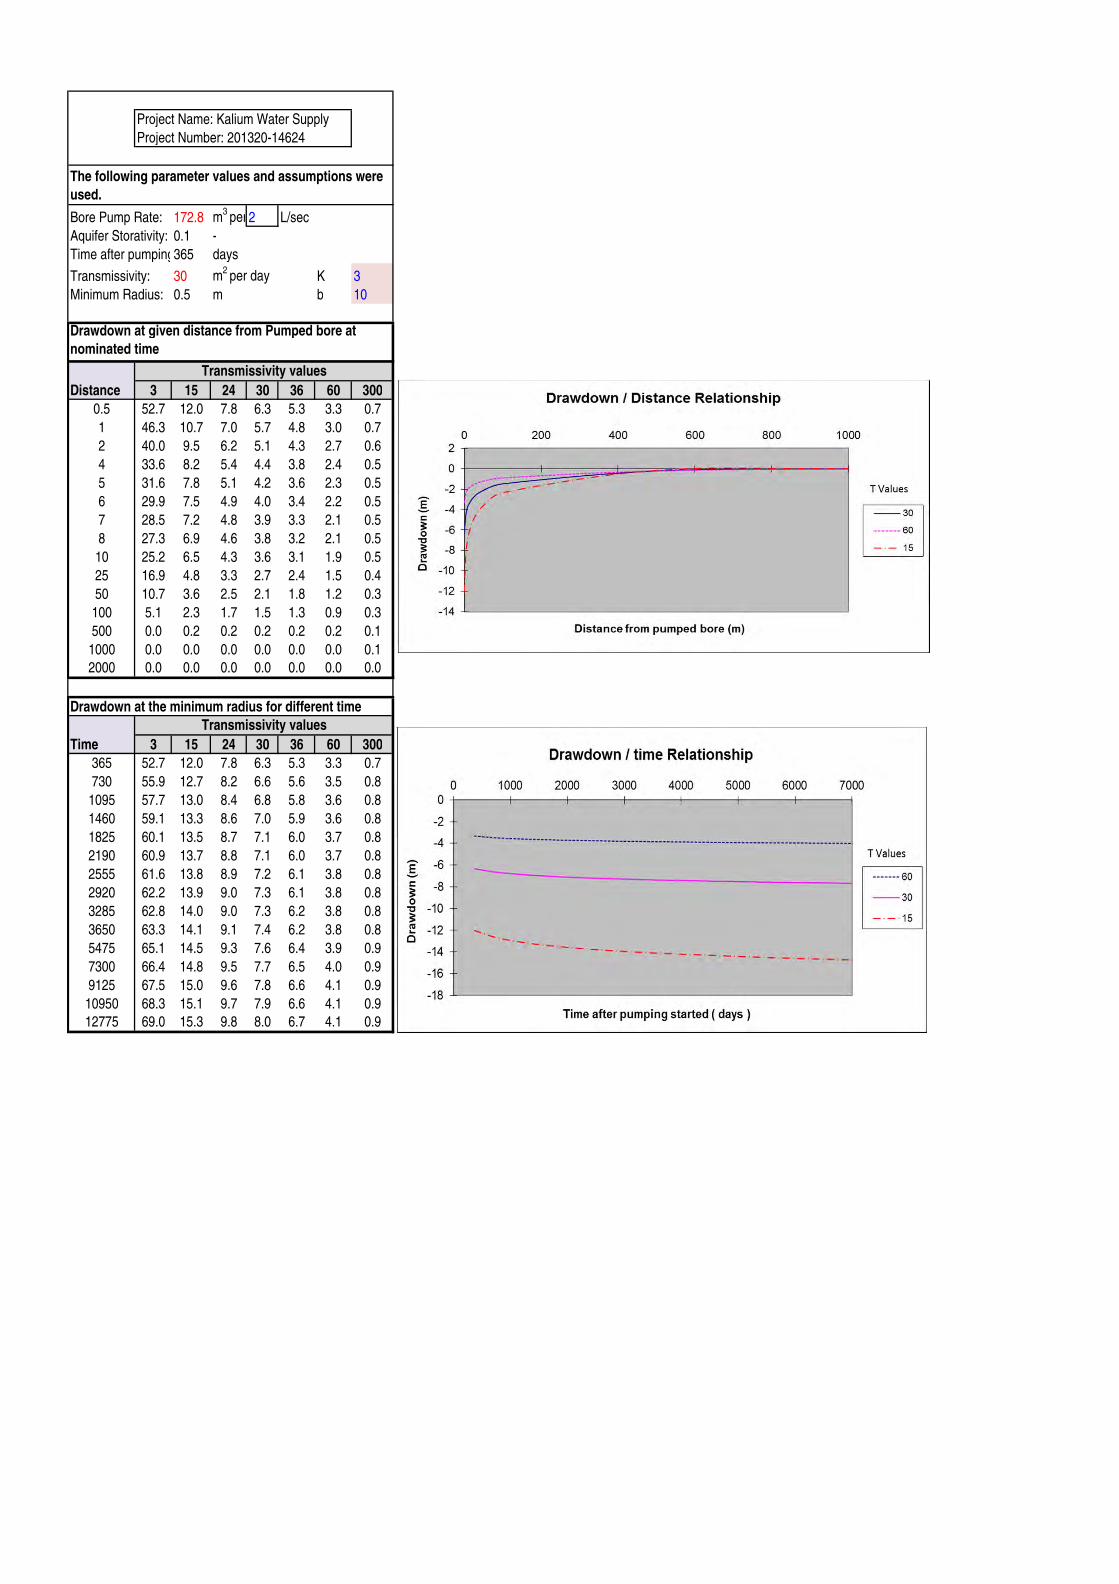
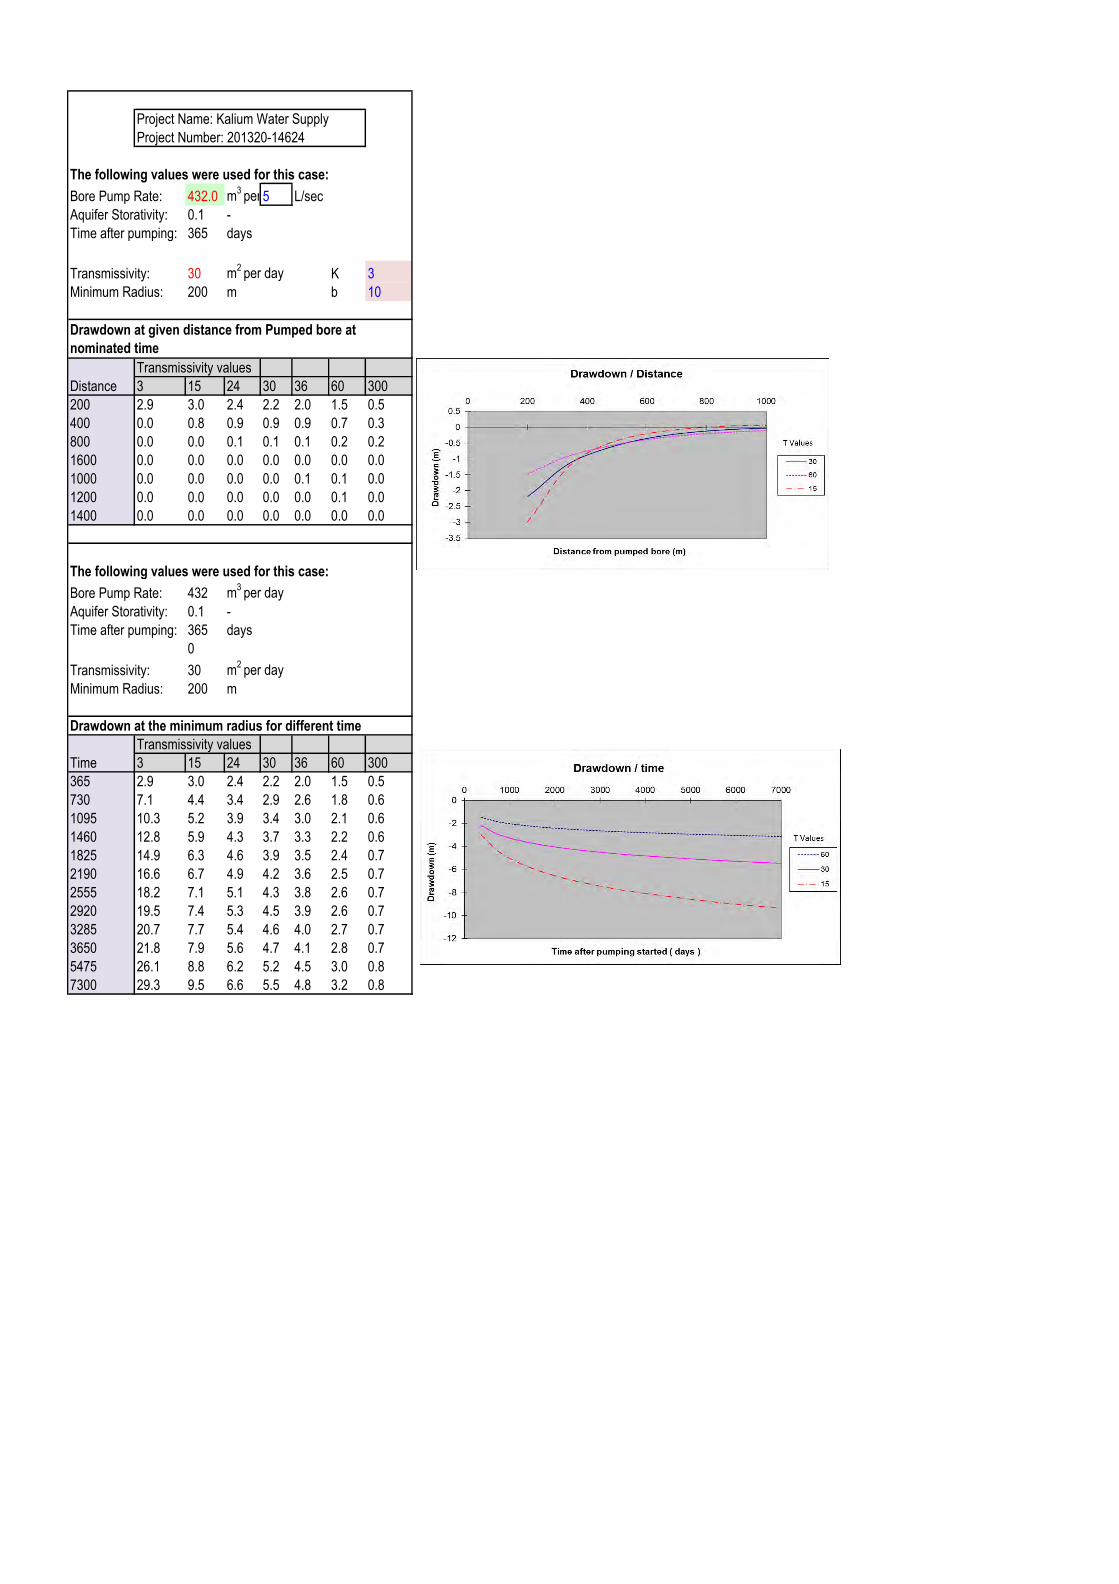
3.2 Drawdown and Radius of Influence
A preliminary estimate of theoretical drawdown at distance from a proposed pumping well was
undertaken by analytical modelling using a solution to the Theis equation below:
� =�
����()
Where, T is the aquifer transmissivity, Q is the steady pumping rate, s is the drawdown, and W(u) is
the well function. Values of u are calculated as:
u = (r2 S / 4 T t)
where t is time, r is the radius and S is storativity (assumed to be specific yield in this case).
The following assumptions have been used in the calculations:
� Pumping volume = 432m3/d
� Storativity – 0.1
� Aquifer thickness = 10m
� Hydraulic Conductivity = 3 metres /day (m/d);
� No recharge is considered; and
� The aquifer is homogenous, isotropic, of uniform thickness and of seemingly infinite areal
extent.
The analytical results presented in Appendix B indicate that after continuous pumping at 5 L/s (432
m3/day) for one year, the theoretical drawdown is approximately 16 m in the vicinity of the well
and 0.5 m at a distance of 500m from the well. At the end of the LoM, assumed to be 20 years
(7300 days) the drawdown is predicted to be 19 m near the well and 0.1 m at a distance of 800m
from the well if no recharge is accounted for.
The pumping estimates indicate that a distance of 500 m to one kilometre will need to be
maintained as optimum distance between wells so that drawdown interference effects do not
become excessive. These results are only indicative and further detailed analytical or numerical
modelling using field tested parameters will need to be undertaken to predict drawdowns and
sustainability of the aquifer prior to seeking dewatering licences and approvals from the regulatory
authorities such as the DoW and the Environmental protection Authority (EPA).
3.3 GDE Considerations
Bore field configurations and pumping volumes will also need to be optimised to ensure
drawdown impacts do not exceed 70% of the saturated thickness of the aquifer to minimise the
risk of potential subterranean fauna impacts. This may require a more conservative average flow
rate to be applied and consequently more bores, so that an adaptive management strategy can be
employed during times of peak demands and drought periods.
Kalium Lakes Potash Pty Ltd
Beyondie Potash Project
Preliminary Water Supply Assessment
Advisian 22
4 Summary and Future Works Program
4.1 Summary of the Desktop Assessment
The Beyondie Potash Project requires a fresh water supply as part of the processing of the brine to
produce a sulphate of potash (SOP) product. The current estimated water demand for the Project
is between 0.7 GLpa to 1.5 GLpa. A preliminary desktop hydrogeological assessment has been
undertaken which aims to identify a water supply source for the Project and estimate potential
yields and impacts based on the available hydrogeological information. The results of the
assessment are summarised as follows:
� The water supply assessment concentrated on potential abstraction from shallow alluvial and
calcrete of the surficial aquifer that overlies the regional palaeovalley system. The palaeovalley
sediments comprise thick lacustrine clay of up to 65m thick within the Beyondie and Ten Mile
Project area, which acts as a confining layer between the basal sand aquifer of the
palaeochannel and the surficial aquifer.
� The shallow surficial alluvial aquifer is composed of mostly silty and clayey deposits along with
locally occurring calcrete deposits.
� Calcrete, heterogeneous creek sediments and outwash fans on the flanks of the topographic
lows and valleys are the primary targets for project water supply from this surficial aquifer.
Localised groundwater supplies may also be obtained from intersections of present day
drainage and fracture zones.
� Groundwater occurrence and availability in calcrete is related to well-developed secondary
porosity that results in high hydraulic conductivities. They can yield high volumes of water,
whilst salinity may vary depending on their occurrence in the landscape and proximity to
regular recharge.
� There are existing bores in the vicinity of the Project recorded to be used for stock watering
and pastoral water supply needs will need to be maintained.
� Recorded groundwater salinities are variable between fresh to brackish in the shallow alluvium
with the lower salinities occurring at break of slope areas within small catchment divides and
near direct surface recharge zones whereas the higher salinities are recorded closer to the
palaeodrainage. In general terms the closer to the salt lake the higher the salinity.
� There are no GDEs of concern currently mapped in the project area. However, abstraction of
groundwater from shallow calcrete and alluvial aquifers may have a potential impact on GDEs
(including subterranean fauna and vegetation) locally due to reduced water availability.
Groundwater modelling and impact assessments based on results of the water supply
exploration program will determine the potential imapcts.
� Recorded hydraulic conductivity values in regional shallow bores indicate that the aquifer is
potentially capable of supplying the required volume of water for the Project if an adequate
saturated thickness is encountered during drilling.
� Annual recharge to the shallow aquifer in the Beyondie Lakes and Ten Mile Lake catchments is
estimated to range between 0.06 and 0.2 GLpa, based on a number of assumptions that are
Kalium Lakes Potash Pty Ltd
Beyondie Potash Project
Preliminary Water Supply Assessment
Advisian 23
outlined in the report. Further studies and longer term monitoring is required to improve
these estimates.
� Assuming a bore yield of 2 to 5 L/s it is estimated that between 5 and 12 bores may be needed
in the calcrete and alluvial aquifer, spaced at between 500 m and 1 km apart to meet the
minimum project water demand of 0.7 GLpa.
� Potential exploration targets for groundwater supply bores have been identified based on the
results of the geophysical testing program, surface geology, topography and analytical
predictions. Two main water supply areas, one to the west of the Lakes and the other to the
south have been selected.
� Exploration holes will be drilled and aquifer tests carried out with an approach to identifying
potential impacts and applying Adaptive management approach to minimise risks based on a
future works program outlined below.
4.2 Future Works Program
A field exploration and hydrogeological investigation comprising the following tasks will be
required as a part of the detailed water supply assessment.
� A site walk over / field reconnaissance will be conducted to assess the identified target sites,
potential constrains, if any, and the suitability of each site, drill rig access, tenement status etc.
� KLP will organise and obtain adequate tenement access, approvals and appropriate licences
including DoW licences to ‘drill’ and ‘take water’; for testing.
� Vegetation and subterranean fauna risk mapping based on the exploration program to be
undertaken will be completed so that high risk areas can be excluded from the exploration
drilling.
� Exploration holes will be drilled using air rotary or aircore methods and logged by a suitably
qualified geologist/hydrogeologist. The alluvial profile will be logged appropriately and nature
of the alluvial horizons recorded. This will drive the selection of appropriate screen intervals for
the monitoring and production bores. Groundwater information, including airlift yields, flow
and quality variations with depth will be recorded on site by a site hydrogeologist.;
� Drilled exploration holes will be converted to monitoring bores (50mm PVC casing slotted over
target interval, based on downhole geology / logs). This will establish a baseline shallow
aquifer monitoring network on site. Slug testing of monitoring bores will be undertaken by
removing a known quantity of water and measuring the water level recovery, to assess the
hydraulic conductivity. This will aid in collecting baseline data on the aquifer for abstraction
licence approvals.
� Up to four test production bores will be drilled and constructed based on exploration drilling
results.
� Test pumping of the production bores will be undertaken (including step rate tests and
constant rate tests) and continuous monitoring of the test wells and monitoring wells to
provide data on aquifer conditions.
� The results of test pumping will be analysed to provide information on aquifer conditions,
hydraulic conductivity, storage potential, bore efficiency and likely sustainable yield.
Kalium Lakes Potash Pty Ltd
Beyondie Potash Project
Preliminary Water Supply Assessment
Advisian 24
� Groundwater monitoring loggers will be deployed within the monitoring bores so that
seasonal groundwater levels can be monitored and recharge estimates improved.
� A groundwater flow model will be designed, constructed and calibrated using the drilling and
test pumping results to assess longer term sustainable yields, optimise a well field
configuration and potential impacts from operating a borefield.
� In reference to the DoW reporting guidelines for hydrogeological assessment (DoW 2009),
Table 1 indicates that the water supply assessment would fall under the H3 level of assessment
(22 points), mainly due to the volume (8 points), proximity to GDEs and other users (5 points
each), and salinity (4 points).
� The results of the field investigation, modelling and impact assessment will be presented in a
H3 level hydrogeological report for submission to regulatory authorities for approval.
Kalium Lakes Potash Pty Ltd
Beyondie Potash Project
Preliminary Water Supply Assessment
Advisian 25
5 References
AQ2, 2016. Beyondie Lakes Project H2 Level of Assessment Prepared for Kalium Lakes May 2016
Beard, J.S., 2005. Drainage Evolution in the Lake Disappointment catchment, Western Australia – a
discussion, Journal of the Royal Society of Western Australia, 88: 57-64.
Bell, J.G., Kilgour, P.L., English, P.M., Woodgate, M.F., Lewis, S.J. and Wischusen, J.D.H. (compilers),
2012. WASANT Palaeovalley Map – Distribution of Palaeovalleys in Arid and Semi-arid WA-SA-NT
(First Edition), scale: 1:4 500 000, Geoscience Australia Thematic Map (Geocat № 73980) – hardcopy
and digital data publication: http://www.ga.gov.au/cedda/maps/96.
BOM, 2017. Atlas of Groundwater Dependent Ecosystems.
http://www.bom.gov.au/water/groundwater/gde/map.shtml, accessed May 2017
Bureau of Meteorology (BOM), 2017. Climate Data Online, Http://Www.Bom.Gov.Au/, accessed
May 2017
Department of Water (DoW), 2009. Operational policy no. 5.12 – Hydrogeological Reporting
Associated with a Groundwater Well Licence: Department of Water Perth.
DoW, 2017. Water Information Reporting Data Online. http://www.water.wa.gov.au/maps-
anddata/monitoring/water-information-reporting, accessed April 2017
Johnson S.L. and Commander D.P 2006, Mid West Minerals Province – Groundwater Resource
Appraisal, Water Resource Management Division, Department of Water, Department of Water
Hydrogeological Record Series Report No. HG
Johnson, S. L., Commander, D. P. & O’boy, C. A. 1999, Groundwater resources of the Northern
Goldfields, Western Australia: Water and Rivers Commission, Hydrogeological Record Series,
Report HG 2, 57p.
Kalium Lakes, Draft Pre-Feasibility Study, Section 3, Hydrology, Hydrogeology & Resources, April
2016.
Magee, J.W., 2009. Palaeovalley Groundwater Resources in Arid and Semi-Arid Australia – A
Literature Review. Geoscience Australia Record 2009/03. 224 pp.
Bore DataAppendix A
Site Name Source Easting Northing Depth SWL TDS
No. 7 Well Canning S R DoW_WIR 327592.4 7216433 21.49 10.5 50
Marymia Well DoW_WIR 209504.9 7230468 6.53 340
No. 10 Well Canning S R DoW_WIR 363908.5 7250325 21.49 9.22 549
Piccaninny Bore DoW_WIR 356836.9 7240395 550
Snake Well DoW_WIR 203670.9 7274811 11.7 8 570
Joes Well DoW_WIR 355200.3 7242372 16.46 5 580
Bullen Water Bore - 2 DoW_WIR 288543.3 7240572 50 630
Bullen Water Bore - 5 DoW_WIR 287720.2 7245950 20 3.1 840
Willy Willy Bore DoW_WIR 331765.4 7219090 860
Bullen Water Bore - 4 DoW_WIR 320308.5 7248179 44.5 4.45 1050
Snells Bore DoW_WIR 345516.3 7252012 1200
No. 12 Well Canning S R DoW_WIR 385798.7 7279428 7.77 2.75 2090
12 Mile Or Lake Well DoW_WIR 219208.7 7261900 7.25 2370
No 8 Well Canning S R DoW_WIR 337270.4 7222372 18.29 3.9 2650
Lake Bore DoW_WIR 336072.3 7229937 2840
No. 11 Well Canning S R DoW_WIR 371888.2 7261587 2 1.7 3270
4 Mile DoW_WIR 208797.9 7256222 6.13 4500
Beyonde Homestead Well DoW_WIR 201051.9 7255893 14.1 13.5
Bore DoW_WIR 343118.4 7229104 3.66
Bore DoW_WIR 343362.3 7237370 3.66
Bore DoW_WIR 344318.3 7244472 3.66
Bore DoW_WIR 351121.1 7245983 3.66
Bore DoW_WIR 354352.4 7246129 3.66
Bullen Water Bore - 1 DoW_WIR 287719.2 7245982
Bullen Water Bore - 3 DoW_WIR 305889.4 7239589 4.3
No. 1 DoW_WIR 206394.9 7234210 27.43
No. 13 Well Canning S R DoW_WIR 398219.2 7298018 7.77
Private DoW_WIR 233891.4 7253931 48
Well DoW_WIR 205742.8 7242803 10.7 1.07
Well DoW_WIR 208306 7230774 10.7 1.07
Well DoW_WIR 210273.9 7230874 10.7 1.07
Well DoW_WIR 216244.9 7234887 10.7 1.07
Well DoW_WIR 371888.2 7261587 10.7 1.07
No 77 East Well Phoenix_DB 216216.6 7234800 9.8 1 96
Beyondie Bore Phoenix_DB 201051.9 7255893 24.43 10.95 369
Davids Well Phoenix_DB 197968.6 7228384 20.7 5.5 463
Garden Well Phoenix_DB 202895.6 7255953 22.24 9.5 500
Broken Leg Phoenix_DB 202835 7232154 41.8 16 650
12 Mile Well Phoenix_DB 219208.7 7261900 11.2 5.2 2072
Unamed 1 Phoenix_DB 207916.8 7257437 19.8 4.2 2084
Tmac23 Phoenix_DB 230929 7253520 11.53 2.92 3800
Tupee Well Phoenix_DB 201893.4 7269434 13 8.1 3827
Wb25 Phoenix_DB 235581 7257148 29.15 7.18 17056
Wb05mbs Phoenix_DB 229624 7260943 53 2.5 60882
Wb09mbs Phoenix_DB 230482.1 7254262 31 2.5 61507
Wb09mbd Phoenix_DB 230482.1 7254262 33.9 1.05 92278
Beyondie W Phoenix_DB 200360.1 7255657
Tmac09 Phoenix_DB 232932 7251174
Tmac11 Phoenix_DB 230920 7253138
Tmac15 Phoenix_DB 235748 7257207
Tmac16 Phoenix_DB 232037 7254479
Tmac22 Phoenix_DB 230509 7254896
Tmac24 Phoenix_DB 232122 7251935
Tmac26 Phoenix_DB 232760 7253061
Wb10tb01 Phoenix_DB 233476 7257242
Wb12mbi Phoenix_DB 233887.6 7253922
Page 1 of 1
Kalium Lakes Potash Pty Ltd
Beyondie Potash Project
Preliminary Water Supply Assessment
Drawdown Calculations Appendix B
Project Name: Kalium Water Supply
Project Number: 201320-14624
Bore Pump Rate: 432.0 m3
per day5 L/sec
Aquifer Storativity: 0.1 -
Time after pumping:365 days
Transmissivity: 30 m2
per day K 3
Minimum Radius: 0.5 m b 10
Distance 3 15 24 30 36 60 300
0.5 131.7 30.0 19.4 15.8 13.4 8.3 1.8
1 115.9 26.9 17.5 14.2 12.0 7.5 1.7
2 100.0 23.7 15.5 12.6 10.7 6.7 1.5
4 84.1 20.5 13.5 11.0 9.4 5.9 1.4
5 79.0 19.5 12.8 10.5 9.0 5.7 1.3
6 74.8 18.6 12.3 10.1 8.6 5.5 1.3
7 71.3 17.9 11.9 9.8 8.3 5.3 1.2
8 68.2 17.3 11.5 9.5 8.1 5.1 1.2
10 63.1 16.3 10.9 8.9 7.6 4.9 1.2
25 42.2 12.1 8.2 6.8 5.9 3.8 0.9
50 26.8 9.0 6.3 5.3 4.6 3.0 0.8
100 12.8 5.9 4.3 3.7 3.3 2.2 0.6
500 0.0 0.4 0.5 0.6 0.6 0.5 0.3
1000 0.0 0.0 0.0 0.0 0.1 0.1 0.1
2000 0.0 0.0 0.0 0.0 0.0 0.0 0.0
Drawdown at the minimum radius for different time
Time 3 15 24 30 36 60 300
365 131.7 30.0 19.4 15.8 13.4 8.3 1.8
730 139.7 31.6 20.4 16.6 14.0 8.7 1.9
1095 144.3 32.6 21.0 17.1 14.4 8.9 2.0
1460 147.6 33.2 21.4 17.4 14.7 9.1 2.0
1825 150.2 33.7 21.8 17.7 14.9 9.2 2.0
2190 152.3 34.1 22.0 17.9 15.1 9.3 2.1
2555 154.0 34.5 22.2 18.0 15.2 9.4 2.1
2920 155.6 34.8 22.4 18.2 15.3 9.5 2.1
3285 156.9 35.1 22.6 18.3 15.4 9.6 2.1
3650 158.1 35.3 22.7 18.5 15.6 9.6 2.1
5475 162.8 36.2 23.3 18.9 15.9 9.9 2.2
7300 166.1 36.9 23.7 19.2 16.2 10.0 2.2
9125 168.6 37.4 24.1 19.5 16.4 10.1 2.2
10950 170.7 37.8 24.3 19.7 16.6 10.3 2.2
12775 172.5 38.2 24.5 19.9 16.7 10.3 2.3
Drawdown at given distance from Pumped bore at
nominated time
Transmissivity values
The following parameter values and assumptions were
used.
Transmissivity values
Project Name: Kalium Water Supply
Project Number: 201320-14624
Bore Pump Rate: 172.8 m3
per day2 L/sec
Aquifer Storativity: 0.1 -
Time after pumping:365 days
Transmissivity: 30 m2
per day K 3
Minimum Radius: 0.5 m b 10
Distance 3 15 24 30 36 60 300
0.5 52.7 12.0 7.8 6.3 5.3 3.3 0.7
1 46.3 10.7 7.0 5.7 4.8 3.0 0.7
2 40.0 9.5 6.2 5.1 4.3 2.7 0.6
4 33.6 8.2 5.4 4.4 3.8 2.4 0.5
5 31.6 7.8 5.1 4.2 3.6 2.3 0.5
6 29.9 7.5 4.9 4.0 3.4 2.2 0.5
7 28.5 7.2 4.8 3.9 3.3 2.1 0.5
8 27.3 6.9 4.6 3.8 3.2 2.1 0.5
10 25.2 6.5 4.3 3.6 3.1 1.9 0.5
25 16.9 4.8 3.3 2.7 2.4 1.5 0.4
50 10.7 3.6 2.5 2.1 1.8 1.2 0.3
100 5.1 2.3 1.7 1.5 1.3 0.9 0.3
500 0.0 0.2 0.2 0.2 0.2 0.2 0.1
1000 0.0 0.0 0.0 0.0 0.0 0.0 0.1
2000 0.0 0.0 0.0 0.0 0.0 0.0 0.0
Drawdown at the minimum radius for different time
Time 3 15 24 30 36 60 300
365 52.7 12.0 7.8 6.3 5.3 3.3 0.7
730 55.9 12.7 8.2 6.6 5.6 3.5 0.8
1095 57.7 13.0 8.4 6.8 5.8 3.6 0.8
1460 59.1 13.3 8.6 7.0 5.9 3.6 0.8
1825 60.1 13.5 8.7 7.1 6.0 3.7 0.8
2190 60.9 13.7 8.8 7.1 6.0 3.7 0.8
2555 61.6 13.8 8.9 7.2 6.1 3.8 0.8
2920 62.2 13.9 9.0 7.3 6.1 3.8 0.8
3285 62.8 14.0 9.0 7.3 6.2 3.8 0.8
3650 63.3 14.1 9.1 7.4 6.2 3.8 0.8
5475 65.1 14.5 9.3 7.6 6.4 3.9 0.9
7300 66.4 14.8 9.5 7.7 6.5 4.0 0.9
9125 67.5 15.0 9.6 7.8 6.6 4.1 0.9
10950 68.3 15.1 9.7 7.9 6.6 4.1 0.9
12775 69.0 15.3 9.8 8.0 6.7 4.1 0.9
The following parameter values and assumptions were
used.
Drawdown at given distance from Pumped bore at
nominated time
Transmissivity values
Transmissivity values
Project Name: Kalium Water Supply
Project Number: 201320-14624
The following values were used for this case:
Bore Pump Rate: 432.0 m3
per day5 L/sec
Aquifer Storativity: 0.1 -
Time after pumping: 365 days
Transmissivity: 30 m2
per day K 3
Minimum Radius: 200 m b 10
Transmissivity values
Distance 3 15 24 30 36 60 300
200 2.9 3.0 2.4 2.2 2.0 1.5 0.5
400 0.0 0.8 0.9 0.9 0.9 0.7 0.3
800 0.0 0.0 0.1 0.1 0.1 0.2 0.2
1600 0.0 0.0 0.0 0.0 0.0 0.0 0.0
1000 0.0 0.0 0.0 0.0 0.1 0.1 0.0
1200 0.0 0.0 0.0 0.0 0.0 0.1 0.0
1400 0.0 0.0 0.0 0.0 0.0 0.0 0.0
The following values were used for this case:
Bore Pump Rate: 432 m3
per day
Aquifer Storativity: 0.1 -
Time after pumping: 365 days
0
Transmissivity: 30 m2
per day
Minimum Radius: 200 m
Drawdown at the minimum radius for different time
Transmissivity values
Time 3 15 24 30 36 60 300
365 2.9 3.0 2.4 2.2 2.0 1.5 0.5
730 7.1 4.4 3.4 2.9 2.6 1.8 0.6
1095 10.3 5.2 3.9 3.4 3.0 2.1 0.6
1460 12.8 5.9 4.3 3.7 3.3 2.2 0.6
1825 14.9 6.3 4.6 3.9 3.5 2.4 0.7
2190 16.6 6.7 4.9 4.2 3.6 2.5 0.7
2555 18.2 7.1 5.1 4.3 3.8 2.6 0.7
2920 19.5 7.4 5.3 4.5 3.9 2.6 0.7
3285 20.7 7.7 5.4 4.6 4.0 2.7 0.7
3650 21.8 7.9 5.6 4.7 4.1 2.8 0.7
5475 26.1 8.8 6.2 5.2 4.5 3.0 0.8
7300 29.3 9.5 6.6 5.5 4.8 3.2 0.8
Drawdown at given distance from Pumped bore at
nominated time