beyond pre-anaesthetic testing nick carmichael bvm&s, bsc vetsci(hons), diploma vcs(syd),...
Post on 19-Dec-2015
219 views
TRANSCRIPT
Beyond Pre-Anaesthetic Testing
Nick Carmichael
BVM&S, BSc VetSci(Hons), Diploma VCS(Syd),
Diploma RCPath, Diplomate ECVCP, MRCVS
Aims of pre-anaesthetic testing Screen for the presence of intercurrent
disease Allow adjustments in anaesthetics/ drugs
used to be made Provide baseline data if problem develops
later
Benefits of pre-anaesthetic testing Safer anaesthesia Appropriate perioperative management Early identification of clinically silent
problems
Drawbacks of pre-anaesthetic testing Cost benefit analysis “False positive” screening test results Inappropriate labelling of cases “False negative” screening test results Decision time pressure
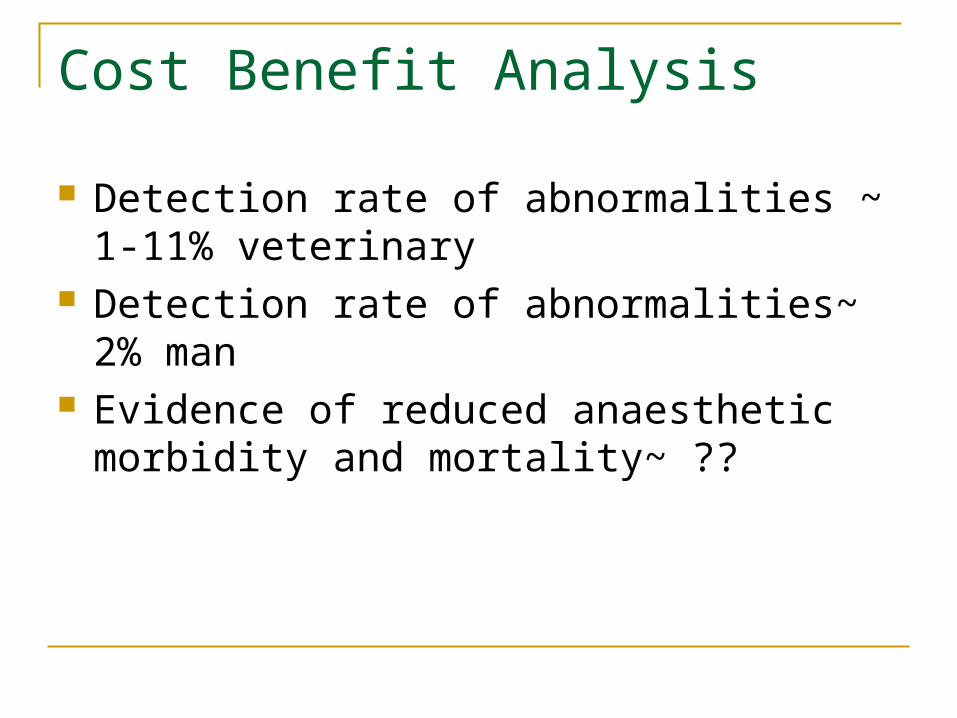
Cost Benefit Analysis
Detection rate of abnormalities ~ 1-11% veterinary
Detection rate of abnormalities~ 2% man Evidence of reduced anaesthetic morbidity
and mortality~ ??
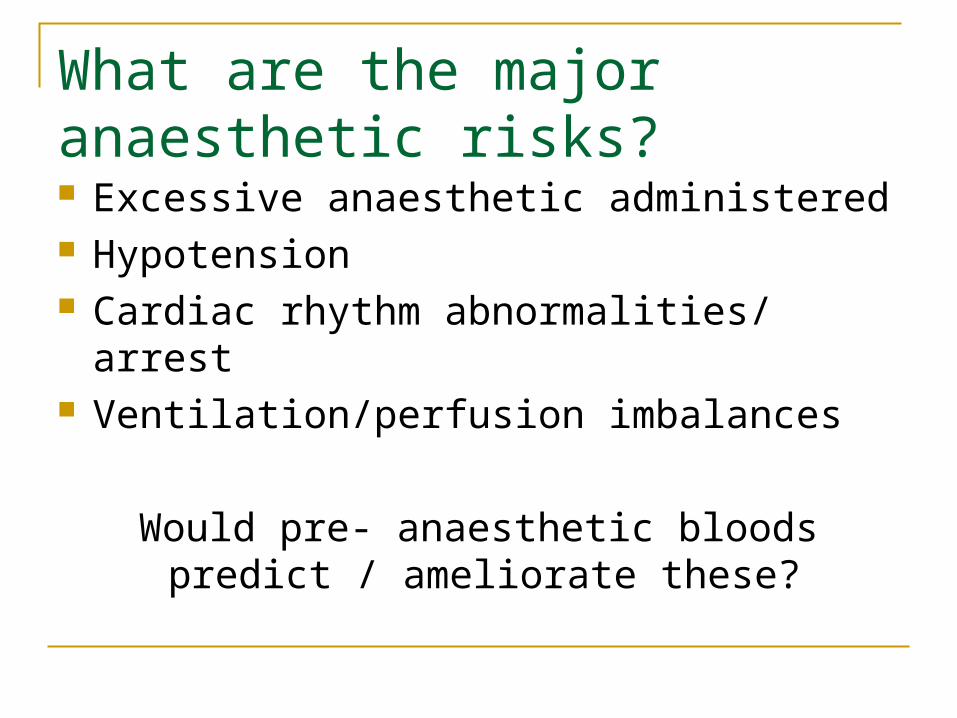
What are the major anaesthetic risks? Excessive anaesthetic administered Hypotension Cardiac rhythm abnormalities/ arrest Ventilation/perfusion imbalances
Would pre- anaesthetic bloods predict / ameliorate these?
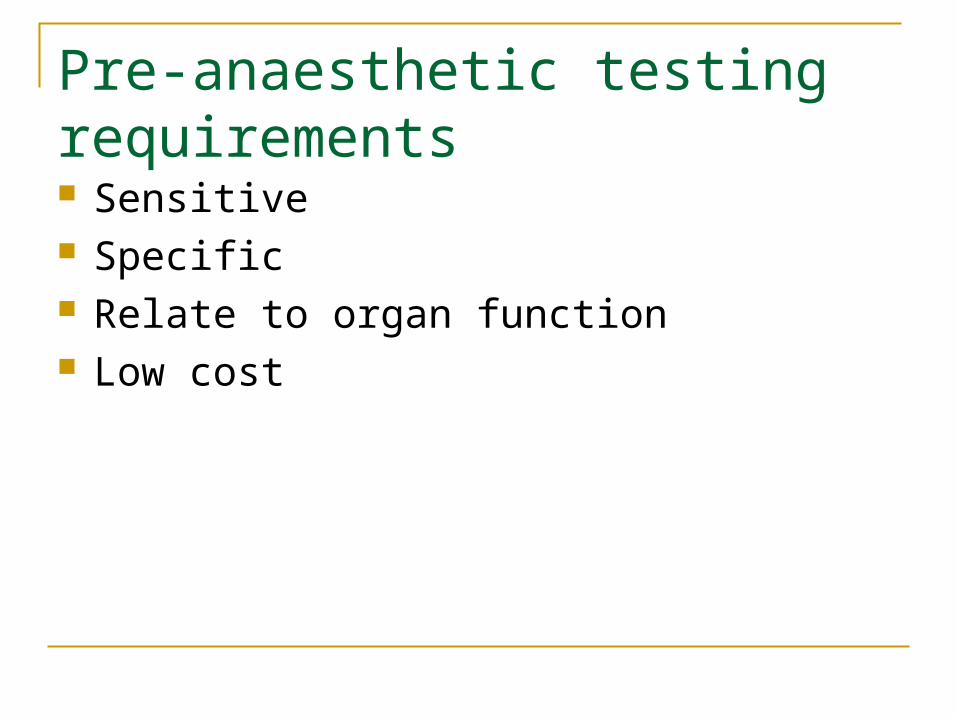
Pre-anaesthetic testing requirements Sensitive Specific Relate to organ function Low cost
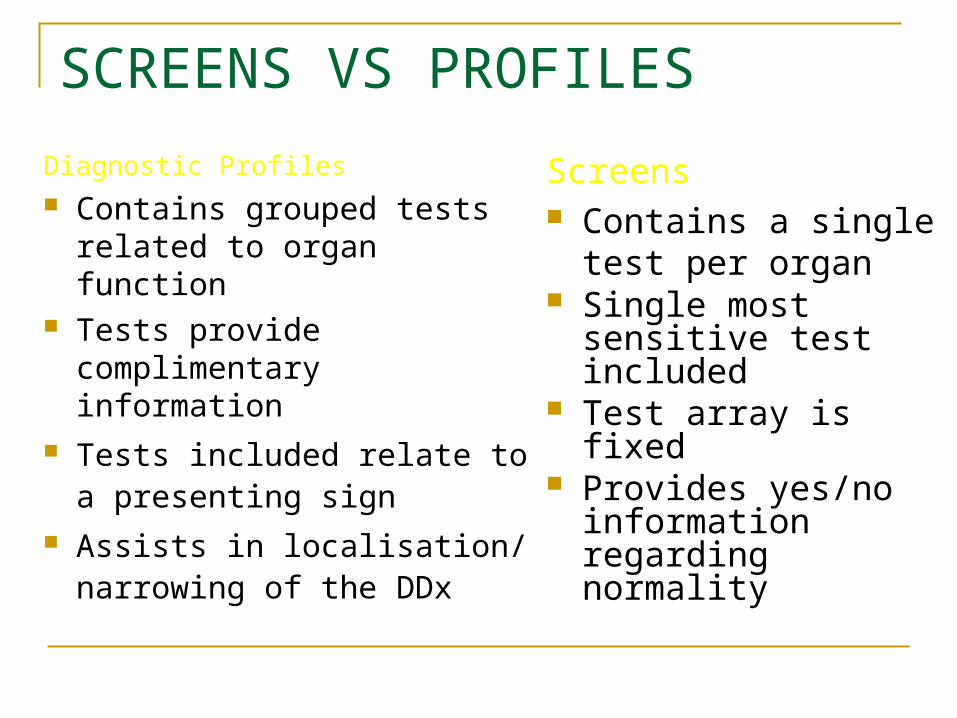
Diagnostic Profiles Contains grouped tests
related to organ function Tests provide
complimentary information
Tests included relate to a presenting sign
Assists in localisation/ narrowing of the DDx
Screens Contains a single test
per organ Single most sensitive
test included Test array is fixed Provides yes/no
information regarding normality
SCREENS VS PROFILES
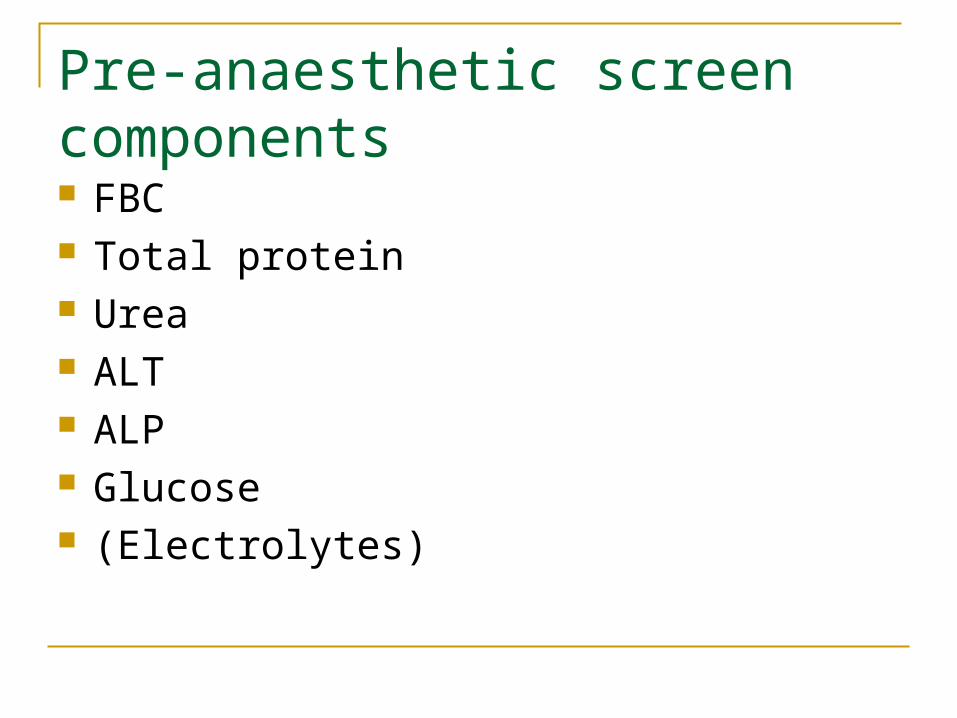
Pre-anaesthetic screen components FBC Total protein Urea ALT ALP Glucose (Electrolytes)
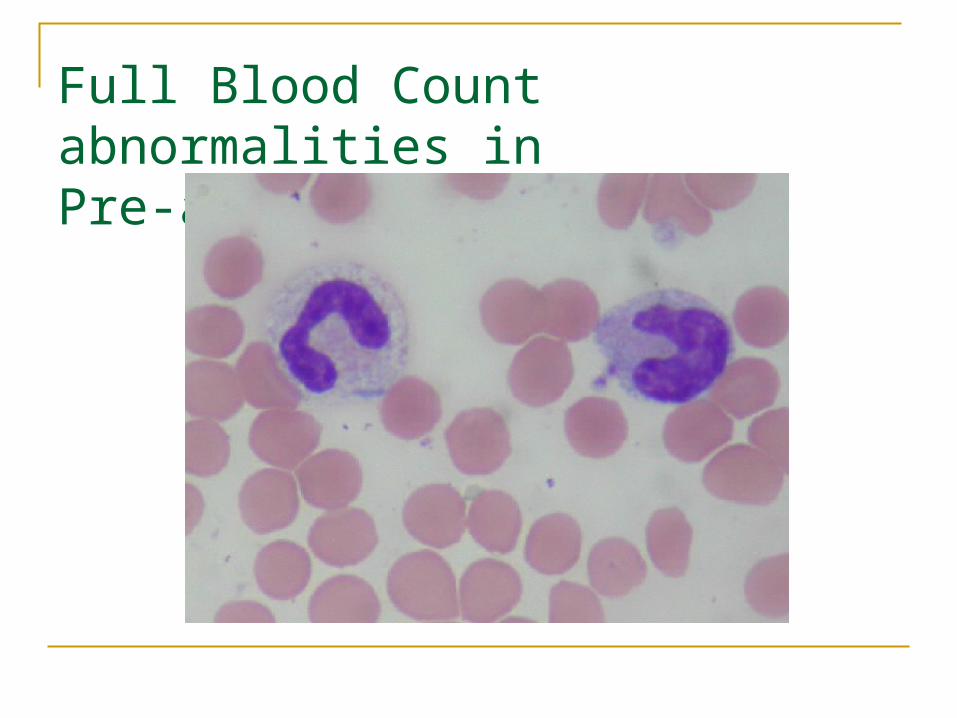
Full Blood Count abnormalities in Pre-anaesthetic screens
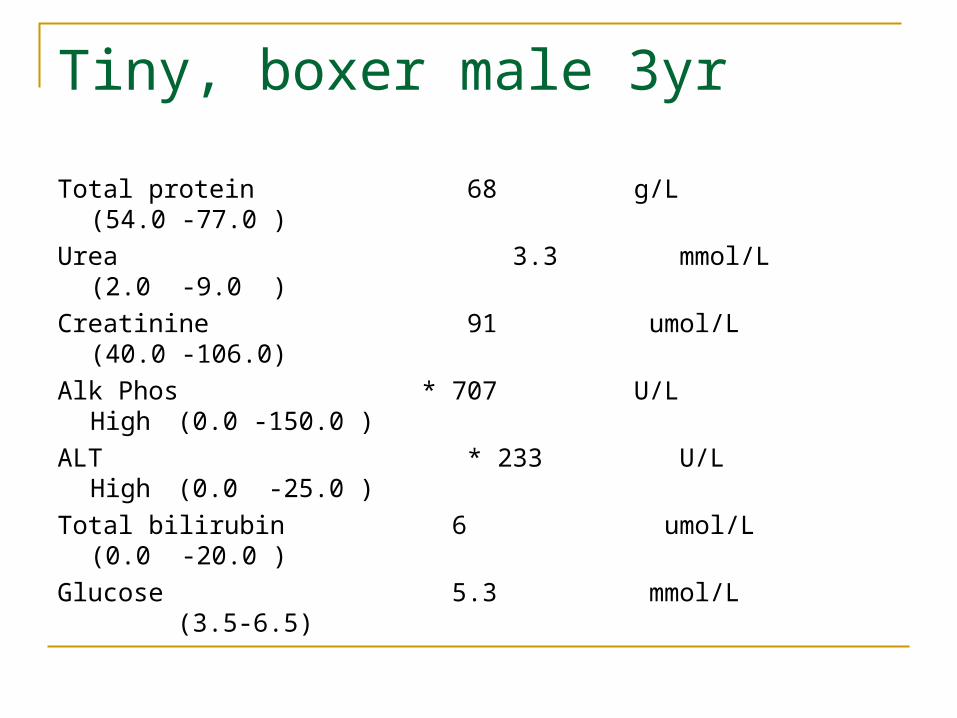
Tiny, boxer male 3yr
Total protein 68 g/L (54.0 -77.0 )
Urea 3.3 mmol/L (2.0 -9.0 )
Creatinine 91 umol/L (40.0 -106.0)
Alk Phos * 707 U/L High (0.0 -150.0 )
ALT * 233 U/L High (0.0 -25.0 )
Total bilirubin 6 umol/L (0.0 -20.0 )
Glucose 5.3 mmol/L (3.5-6.5)
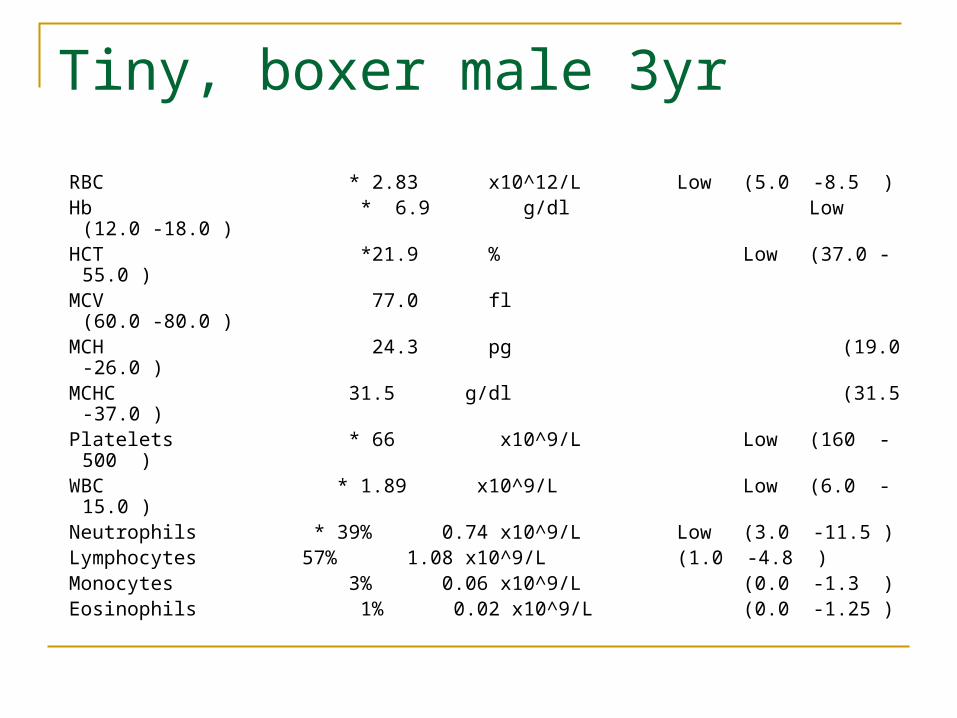
Tiny, boxer male 3yr
RBC * 2.83 x10^12/L Low (5.0 -8.5 ) Hb * 6.9 g/dl Low (12.0 -18.0 ) HCT *21.9 % Low (37.0 -55.0 ) MCV 77.0 fl (60.0 -80.0 ) MCH 24.3 pg (19.0 -26.0 ) MCHC 31.5 g/dl (31.5 -37.0 ) Platelets * 66 x10^9/L Low (160 -500 ) WBC * 1.89 x10^9/L Low (6.0 -15.0 ) Neutrophils * 39% 0.74 x10^9/L Low (3.0 -11.5 ) Lymphocytes 57% 1.08 x10^9/L (1.0 -4.8 ) Monocytes 3% 0.06 x10^9/L (0.0 -1.3 ) Eosinophils 1% 0.02 x10^9/L (0.0 -1.25 )
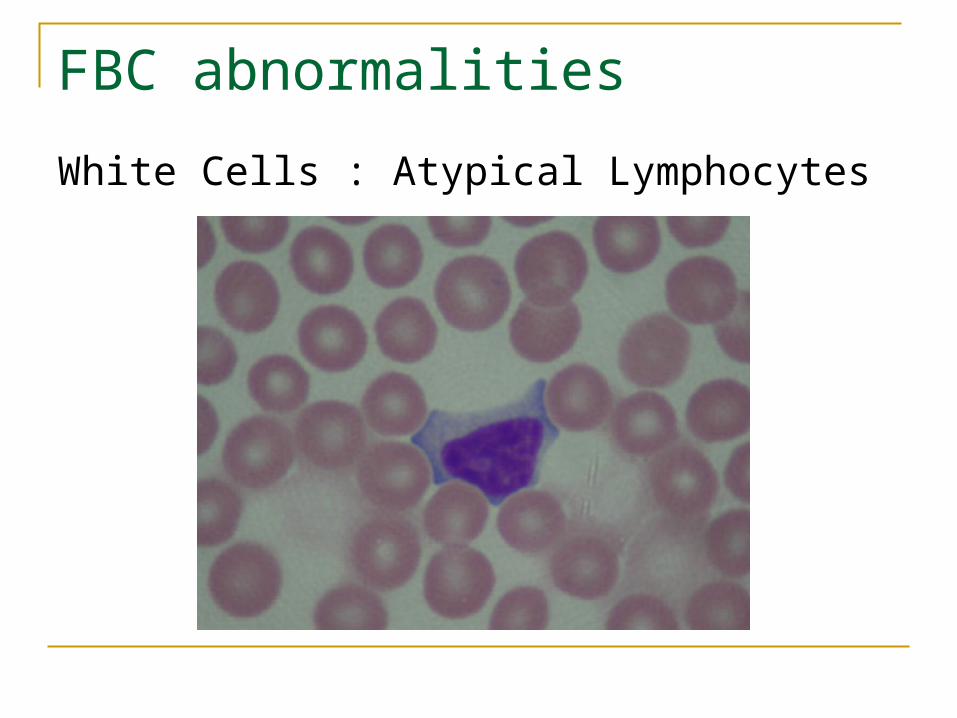
FBC abnormalities
White Cells : Atypical Lymphocytes
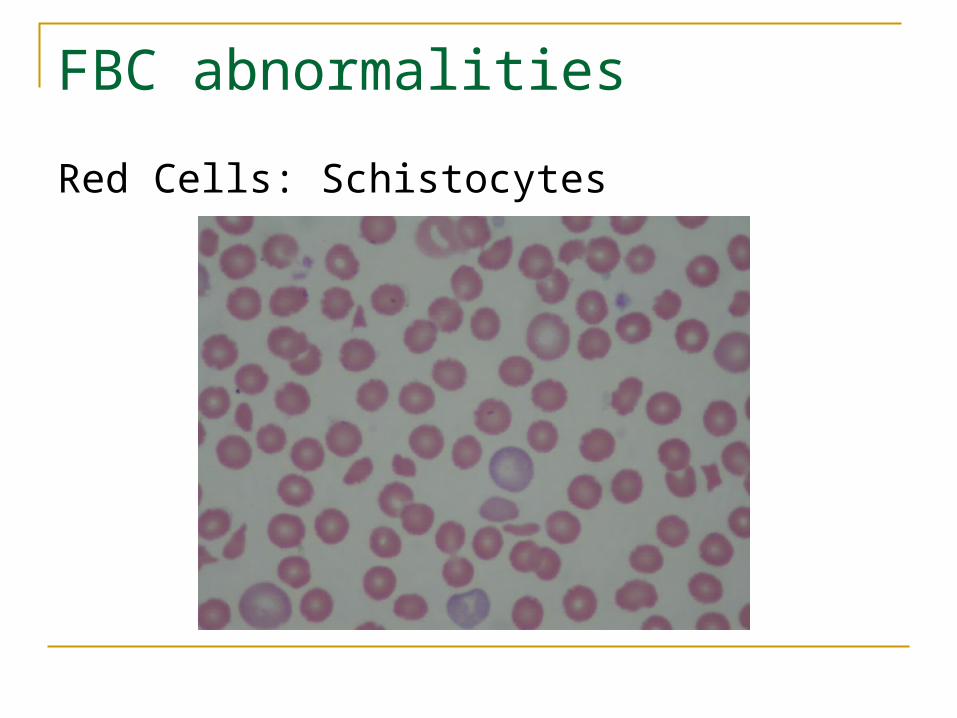
FBC abnormalities
Red Cells: Schistocytes
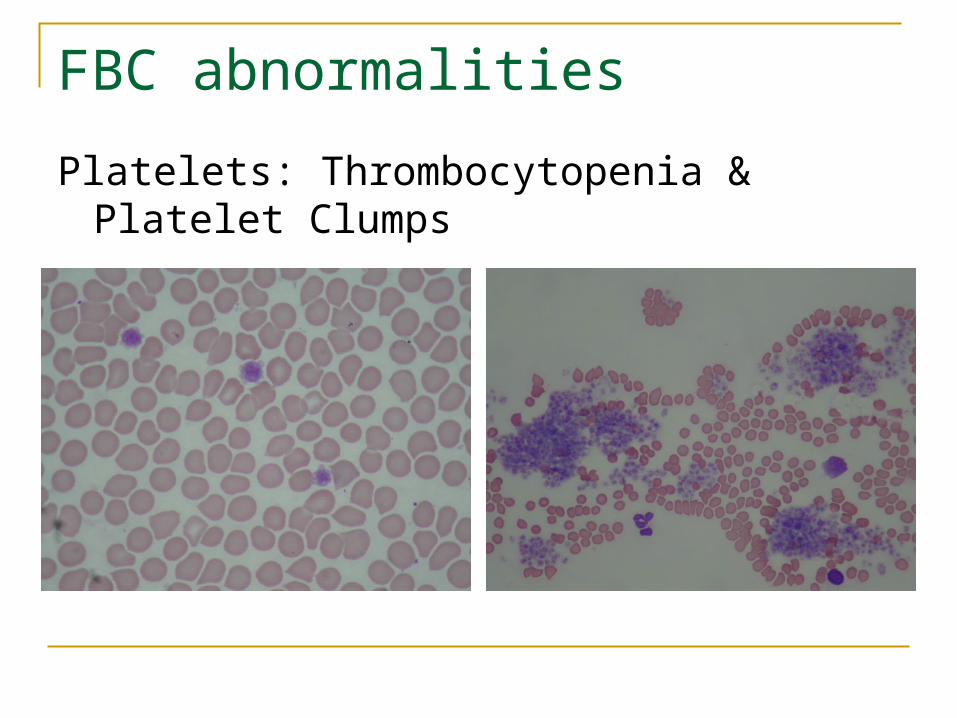
FBC abnormalities
Platelets: Thrombocytopenia & Platelet Clumps
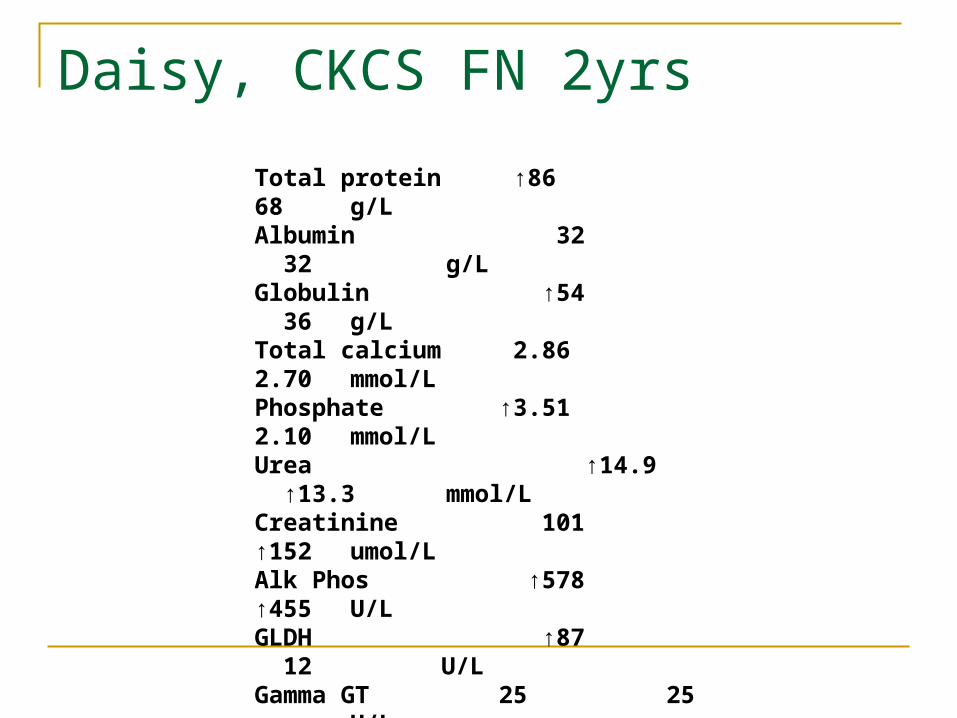
Daisy, CKCS FN 2yrs
Total protein ↑86 68 g/L Albumin 32 32 g/L Globulin ↑54 36 g/L Total calcium 2.86 2.70 mmol/L Phosphate ↑3.51 2.10 mmol/L Urea ↑14.9 ↑13.3 mmol/L Creatinine 101 ↑152 umol/L Alk Phos ↑578 ↑455 U/L GLDH ↑87 12 U/L Gamma GT 25 25 U/L Total bilirubin ↑30 6 umol/L Bile acids ↑26.7 9.7 umol/L
Glucose 6.4 5.6 mmol/L
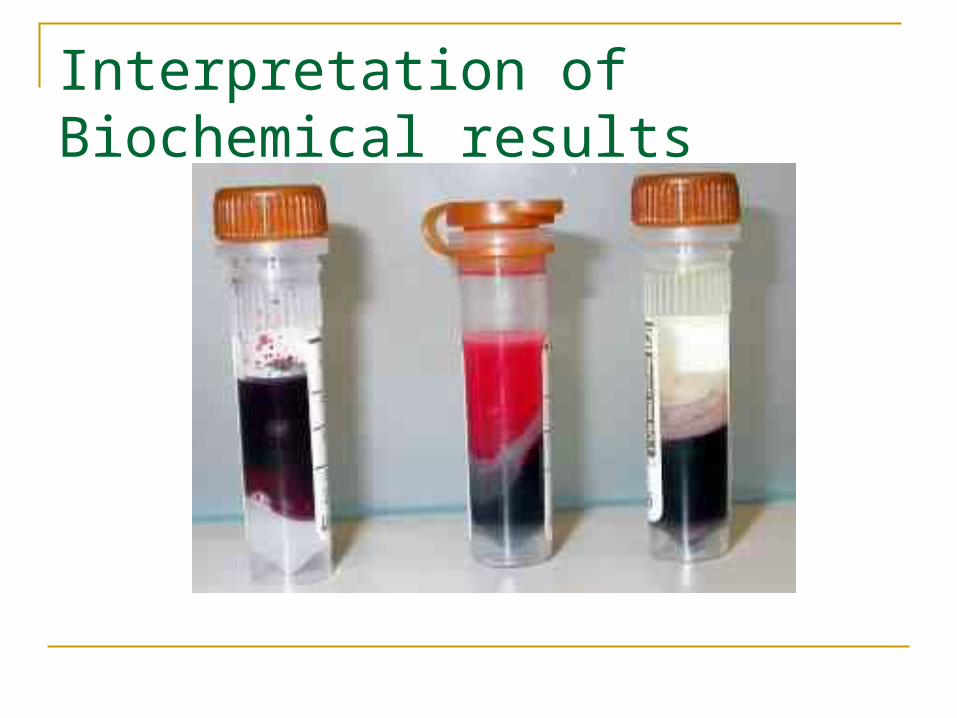
Interpretation of Biochemical results
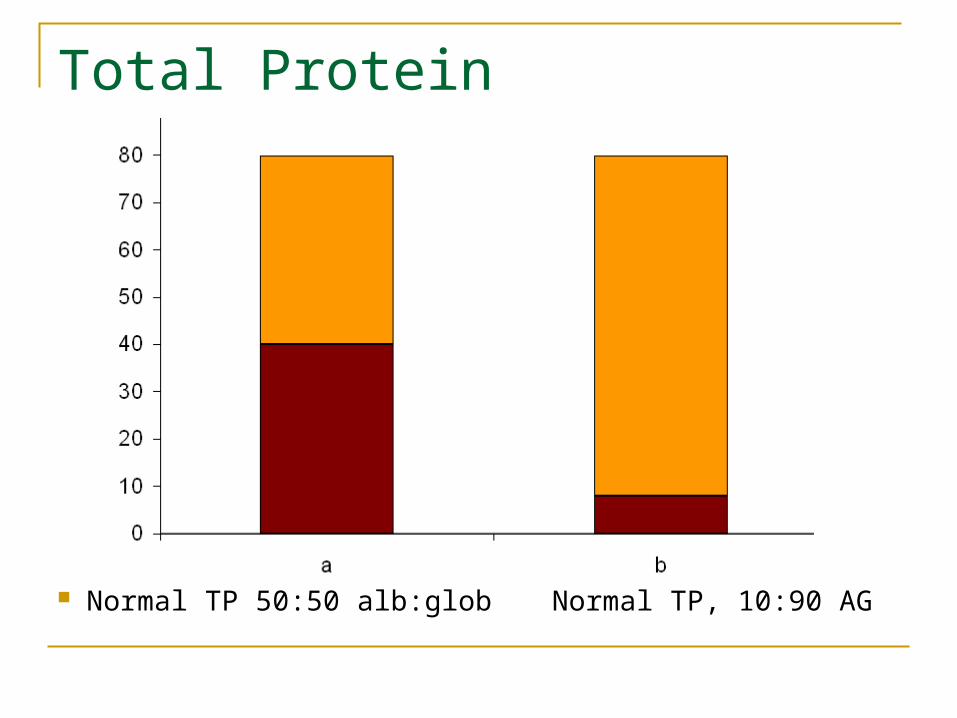
Total Protein
Normal TP 50:50 alb:glob Normal TP, 10:90 AG
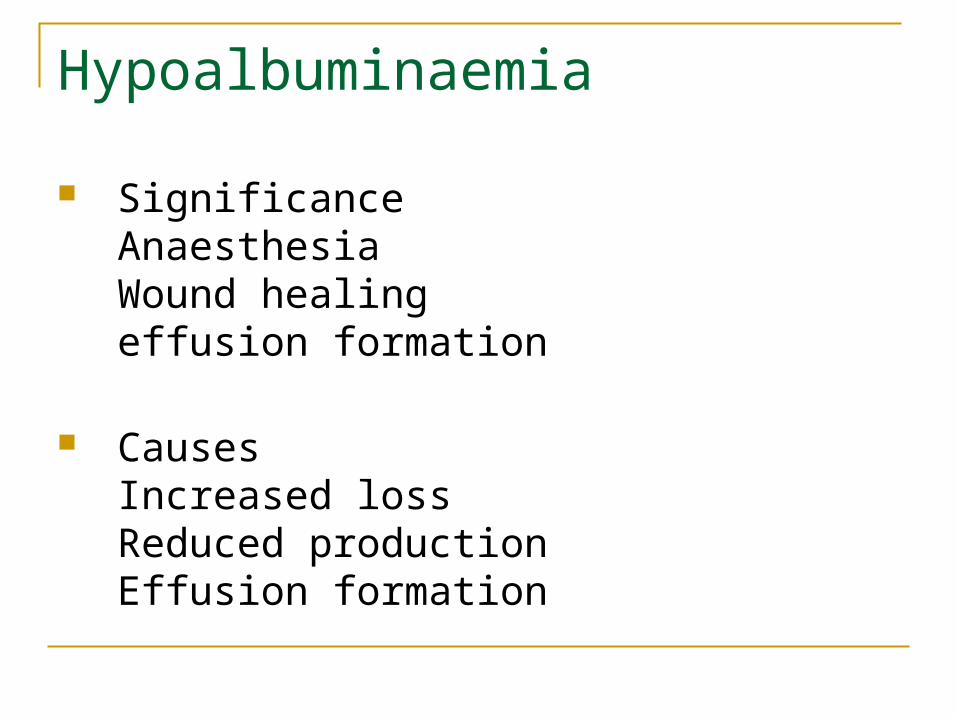
Hypoalbuminaemia
SignificanceAnaesthesiaWound healingeffusion formation
CausesIncreased lossReduced productionEffusion formation
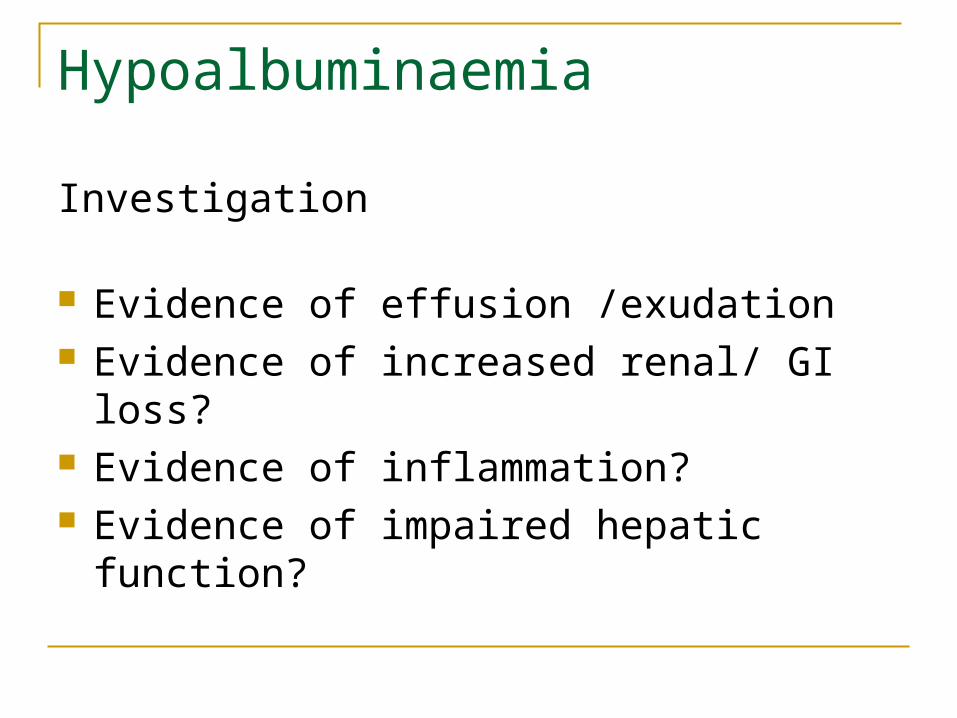
Hypoalbuminaemia
Investigation
Evidence of effusion /exudation Evidence of increased renal/ GI loss? Evidence of inflammation? Evidence of impaired hepatic function?
Hyperglobulinaemia
Associated with
Inflammation Viral infection Neoplasia
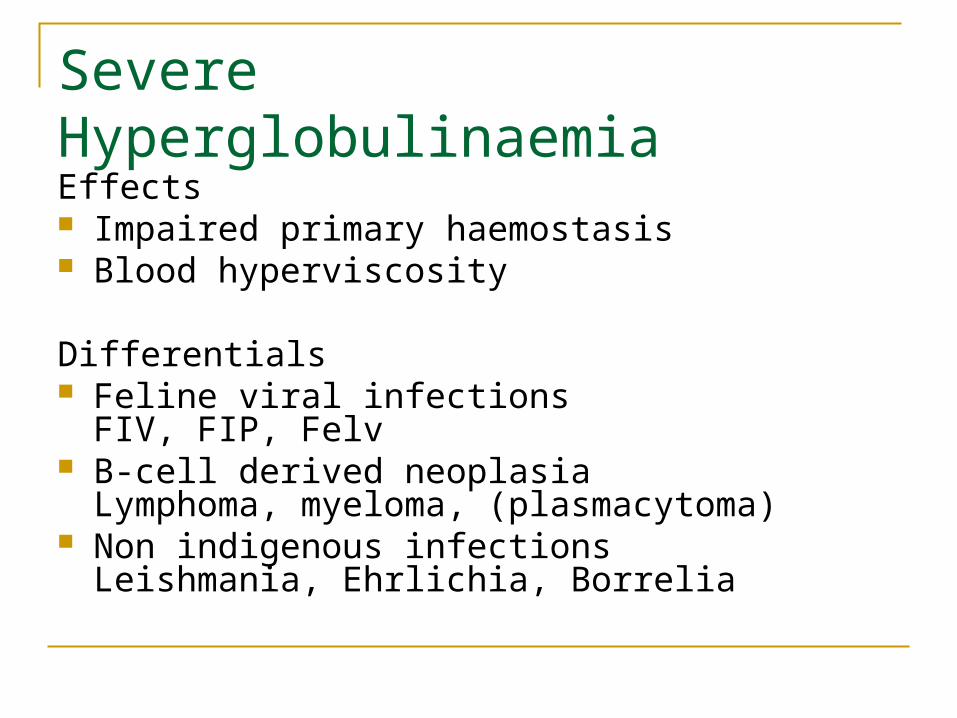
Severe Hyperglobulinaemia
Effects Impaired primary haemostasis Blood hyperviscosity
Differentials Feline viral infections
FIV, FIP, Felv B-cell derived neoplasia
Lymphoma, myeloma, (plasmacytoma) Non indigenous infections
Leishmania, Ehrlichia, Borrelia
Hyperglobulinaemia
Diagnostic evaluation
Clinical examination FBC – smear evaluation Viral screening Serum protein electrophoresis Non indigenous infection serology/ PCR
testing
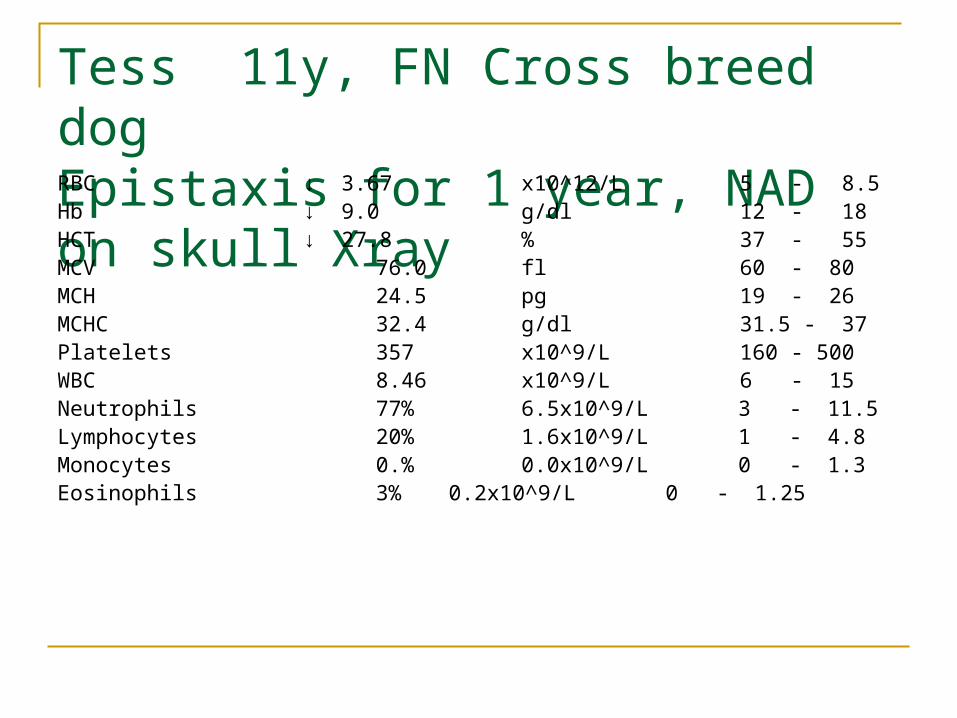
Tess 11y, FN Cross breed dogEpistaxis for 1 year, NAD on skull XrayRBC ↓ 3.67 x10^12/L 5 - 8.5Hb ↓ 9.0 g/dl 12 - 18HCT ↓ 27.8 % 37 - 55MCV 76.0 fl 60 - 80MCH 24.5 pg 19 - 26MCHC 32.4 g/dl 31.5 - 37Platelets 357 x10^9/L 160 - 500WBC 8.46 x10^9/L 6 - 15Neutrophils 77% 6.5x10^9/L 3 - 11.5Lymphocytes 20% 1.6x10^9/L 1 - 4.8Monocytes 0.% 0.0x10^9/L 0 - 1.3Eosinophils 3% 0.2x10^9/L 0 - 1.25
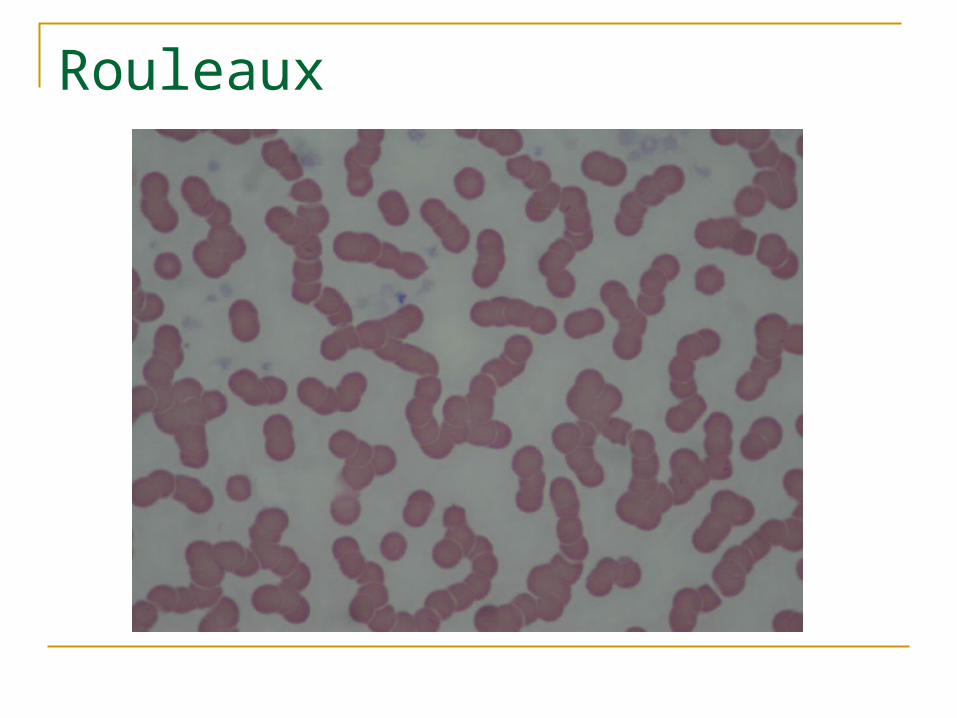
Rouleaux
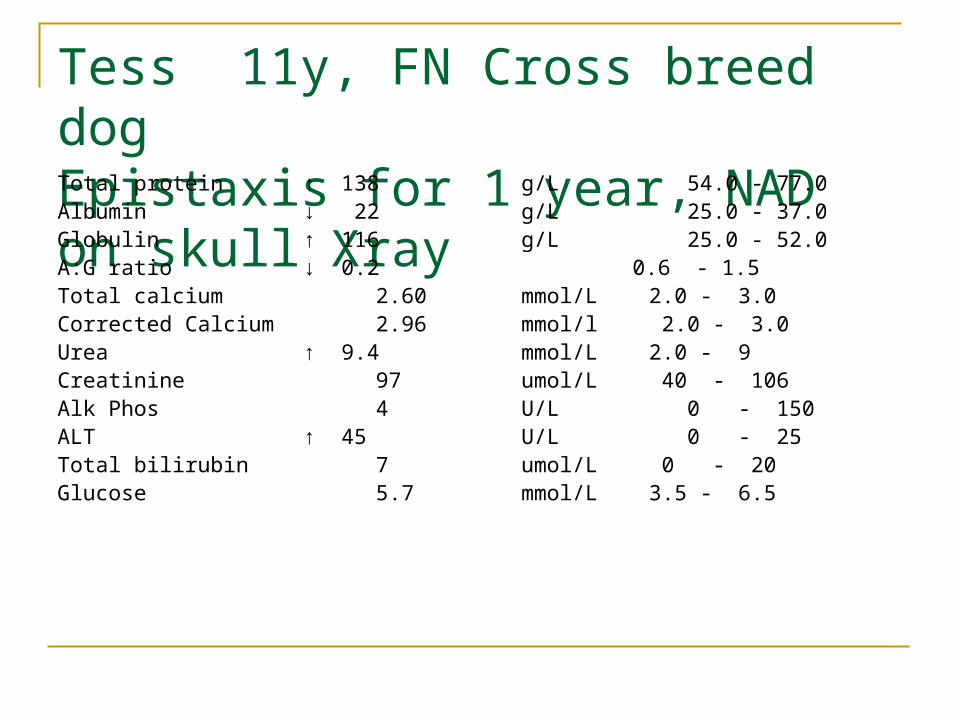
Tess 11y, FN Cross breed dogEpistaxis for 1 year, NAD on skull XrayTotal protein ↑ 138 g/L 54.0 - 77.0 Albumin ↓ 22 g/L 25.0 - 37.0 Globulin ↑ 116 g/L 25.0 - 52.0 A:G ratio ↓ 0.2 0.6 - 1.5 Total calcium 2.60 mmol/L 2.0 - 3.0Corrected Calcium 2.96 mmol/l 2.0 - 3.0 Urea ↑ 9.4 mmol/L 2.0 - 9 Creatinine 97 umol/L 40 - 106 Alk Phos 4 U/L 0 - 150 ALT ↑ 45 U/L 0 - 25 Total bilirubin 7 umol/L 0 - 20 Glucose 5.7 mmol/L 3.5 - 6.5
Diagnostic evaluation of liver disease Useful information
Is there liver disease present likely to be exacerbated by anaesthetic agents?
Is liver function significantly impaired?Metabolising/clearing anaesthetic agentsProduction of coagulation proteins
Diagnostic evaluation of liver diseaseIs liver disease present?
Hepatocellular damageALT
CholestasisALP
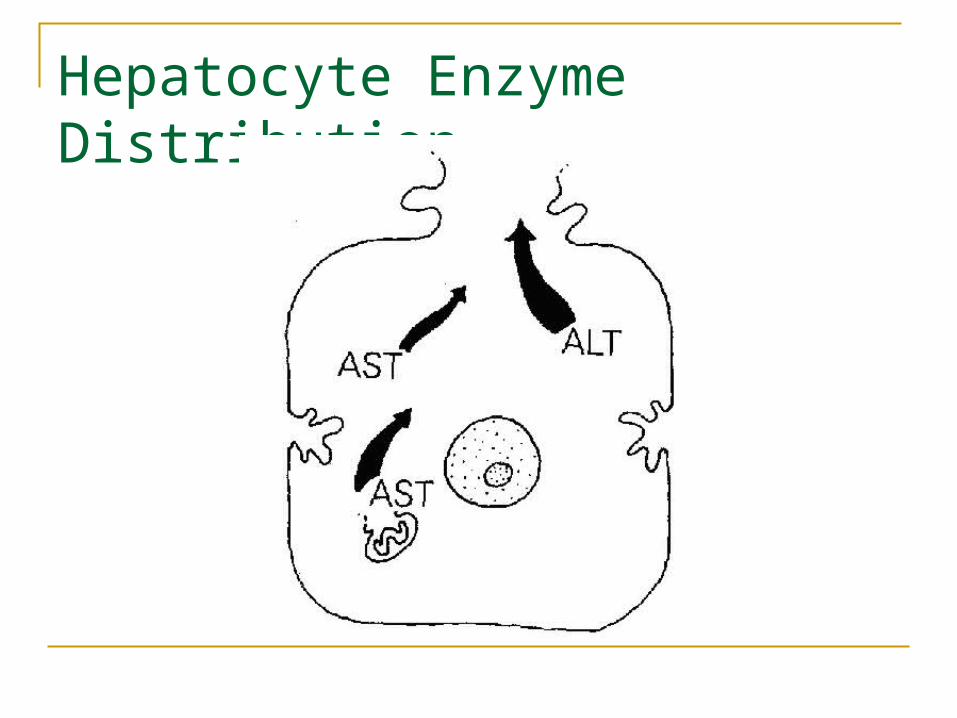
Hepatocyte Enzyme Distribution
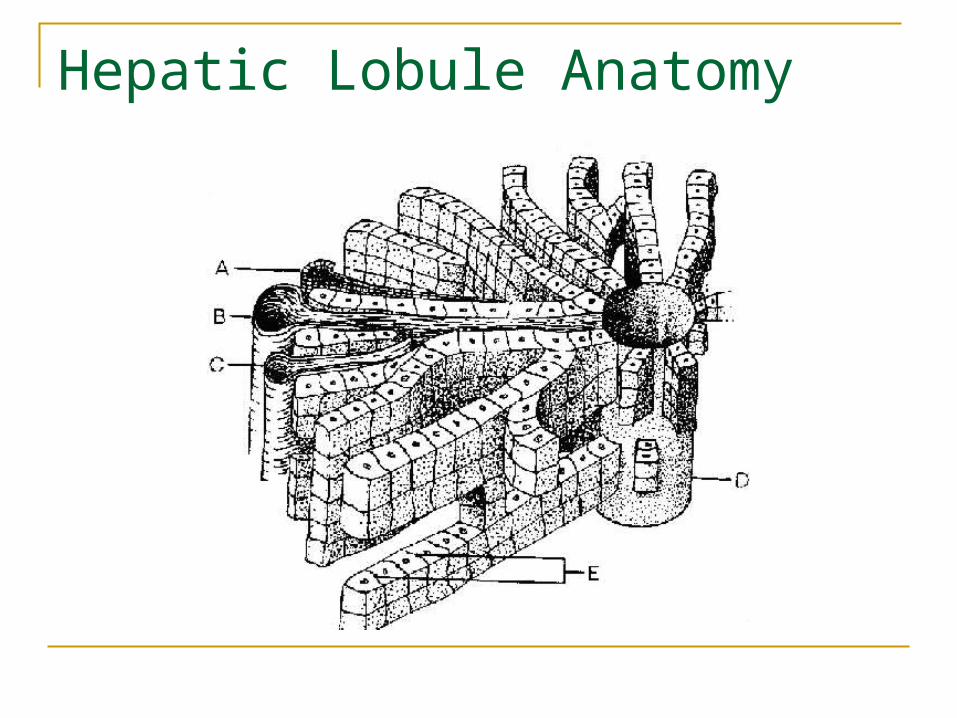
Hepatic Lobule Anatomy
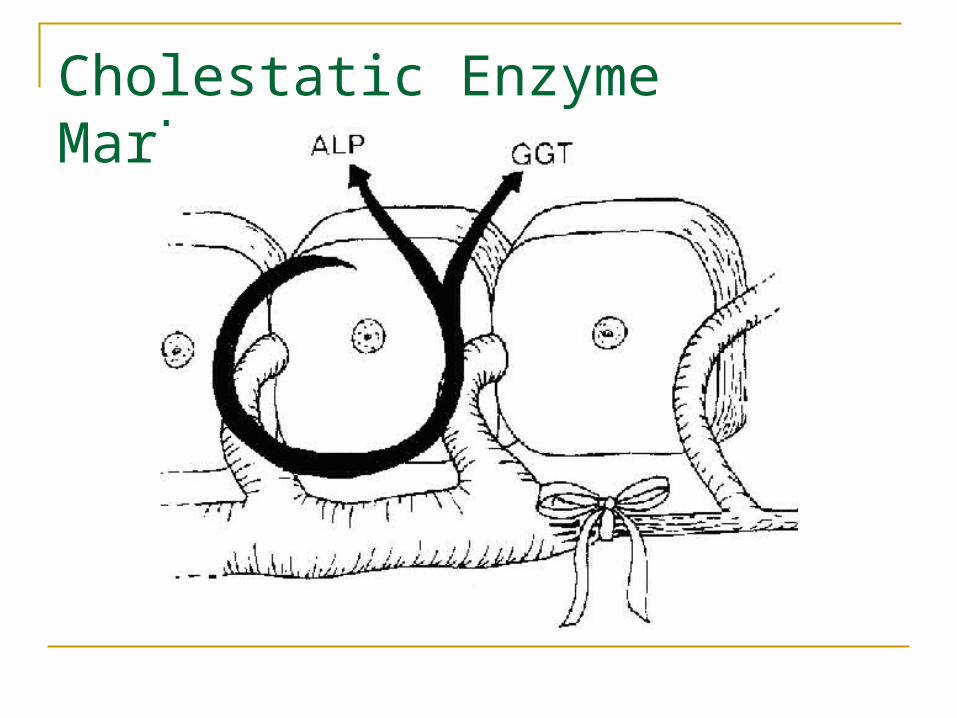
Cholestatic Enzyme Markers
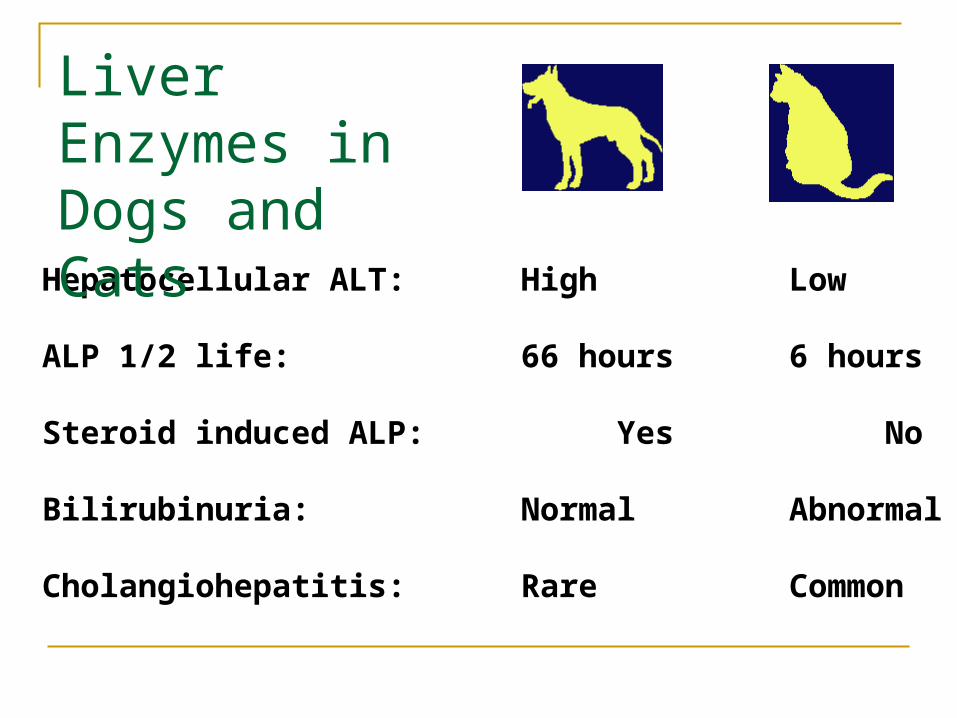
Hepatocellular ALT: High Low
ALP 1/2 life: 66 hours 6 hours
Steroid induced ALP: Yes No
Bilirubinuria: Normal Abnormal
Cholangiohepatitis: Rare Common
Liver Enzymes in Dogs and Cats
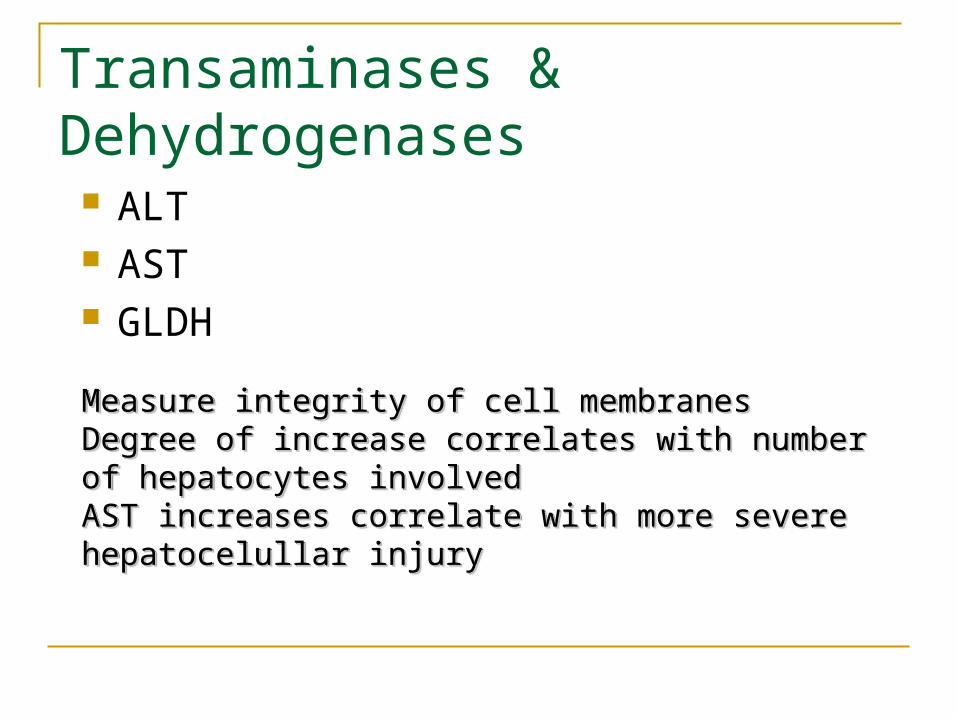
Transaminases & Dehydrogenases
ALT AST GLDH
Measure integrity of cell membranesMeasure integrity of cell membranesDegree of increase correlates with number of Degree of increase correlates with number of hepatocytes involvedhepatocytes involvedAST increases correlate with more severe AST increases correlate with more severe hepatocelullar injuryhepatocelullar injury
Measure integrity of cell membranesMeasure integrity of cell membranesDegree of increase correlates with number of Degree of increase correlates with number of hepatocytes involvedhepatocytes involvedAST increases correlate with more severe AST increases correlate with more severe hepatocelullar injuryhepatocelullar injury

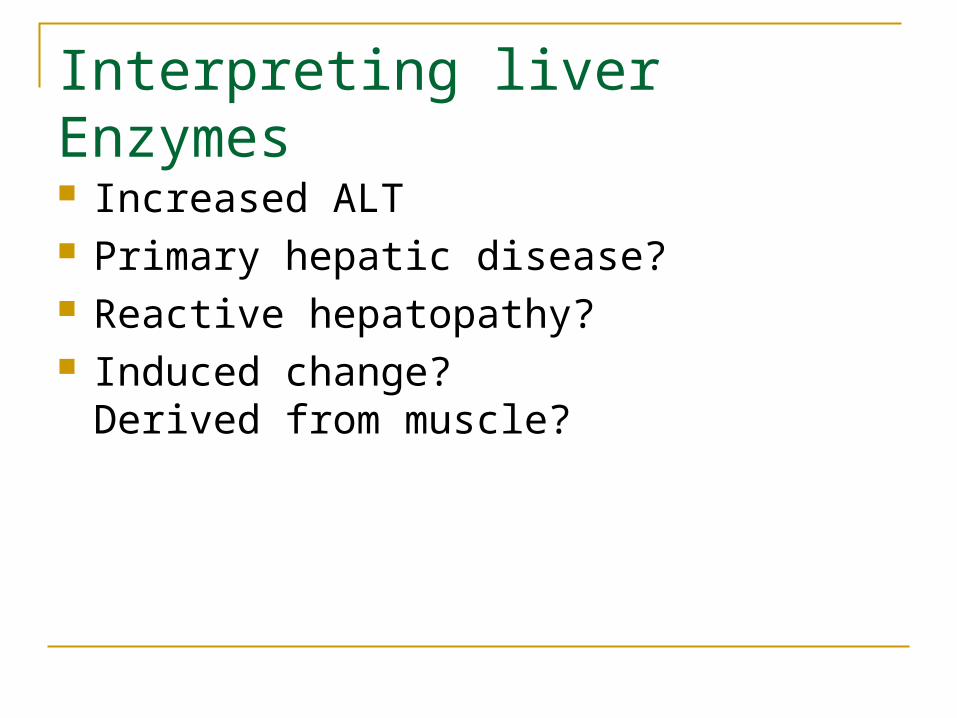
Interpreting liver Enzymes
Increased ALT Primary hepatic disease? Reactive hepatopathy? Induced change?
Derived from muscle?
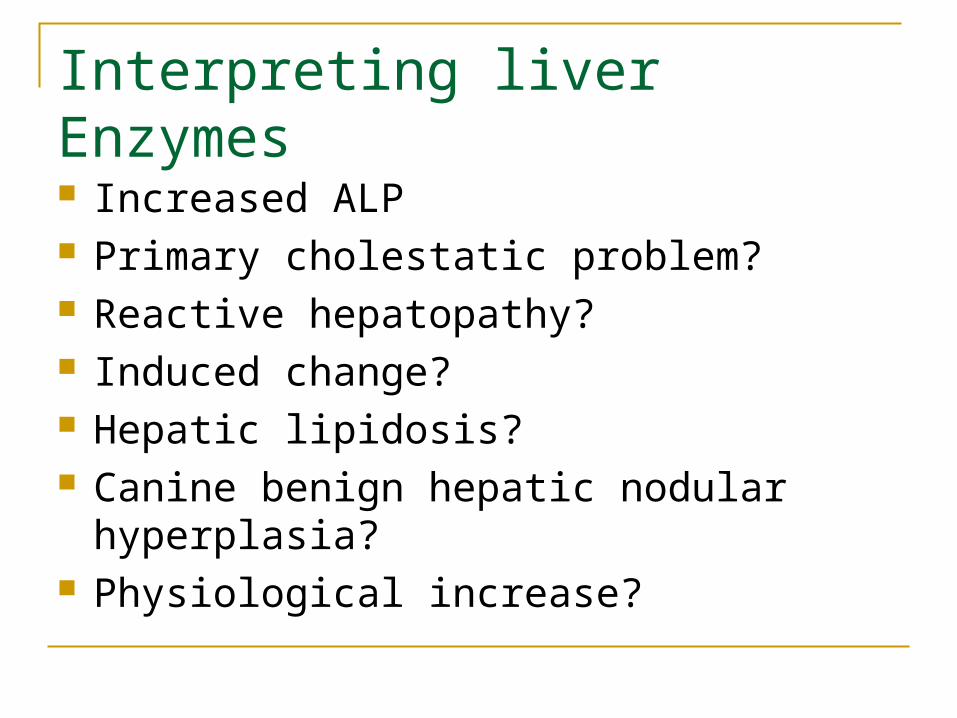
Interpreting liver Enzymes
Increased ALP Primary cholestatic problem? Reactive hepatopathy? Induced change? Hepatic lipidosis? Canine benign hepatic nodular hyperplasia? Physiological increase?
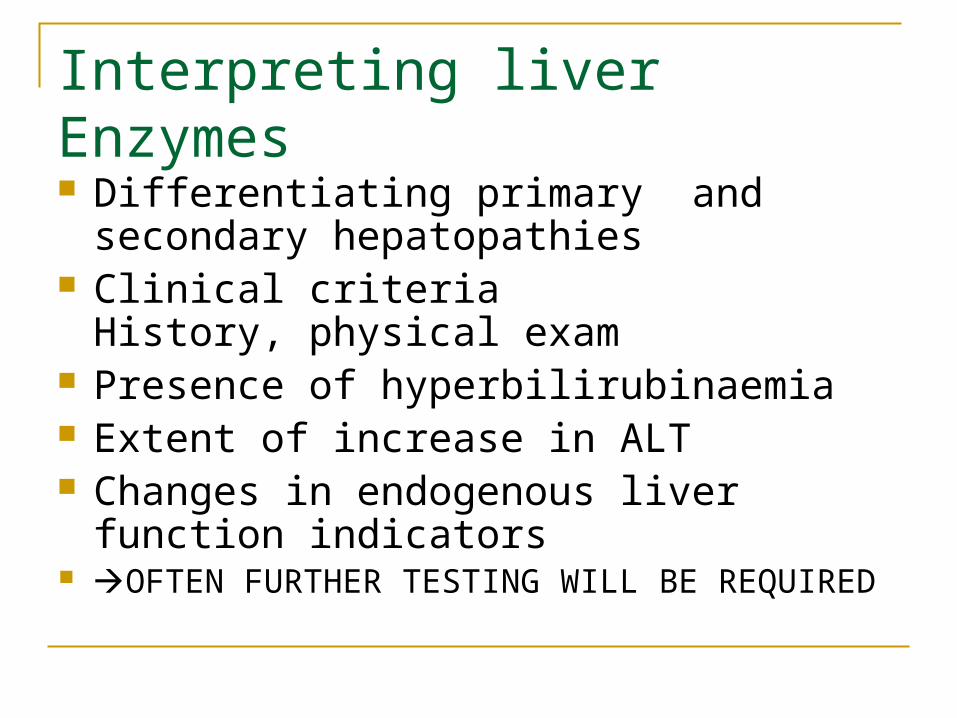
Interpreting liver Enzymes
Differentiating primary and secondary hepatopathies
Clinical criteriaHistory, physical exam
Presence of hyperbilirubinaemia Extent of increase in ALT Changes in endogenous liver function
indicators OFTEN FURTHER TESTING WILL BE REQUIRED
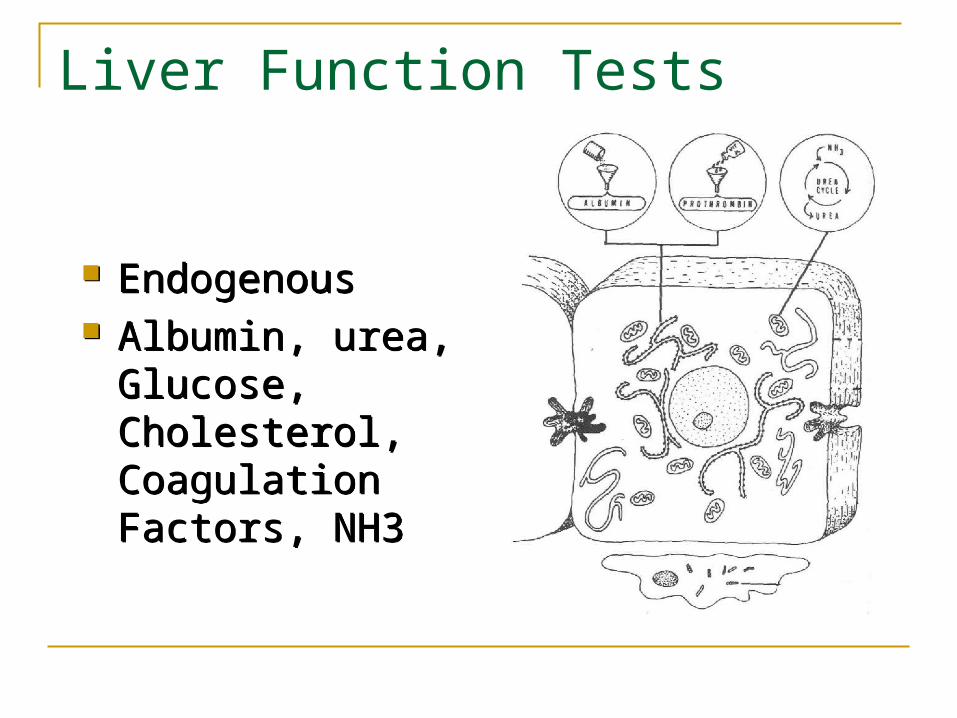
Liver Function Tests
Endogenous Albumin, urea,
Glucose, Cholesterol, Coagulation Factors, NH3
Endogenous Albumin, urea,
Glucose, Cholesterol, Coagulation Factors, NH3
“Alarm” blood screen abnormalities in liver disease Marked increases in ALT Increased bilirubin Reductions in urea, albumin, A:G ratio,
cholesterol Microcytosis +/- anaemia
Further investigation of liver abnormalities Review history and physical findings Run a liver profile with FBC Include post prandial bile acids Consider abdominal imaging
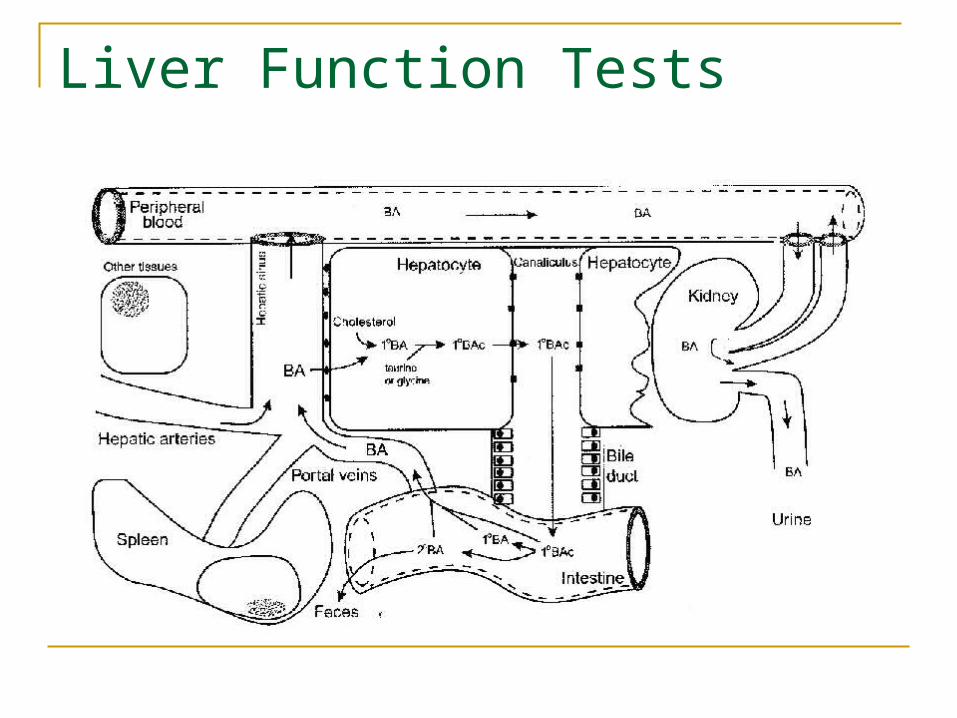
Liver Function Tests
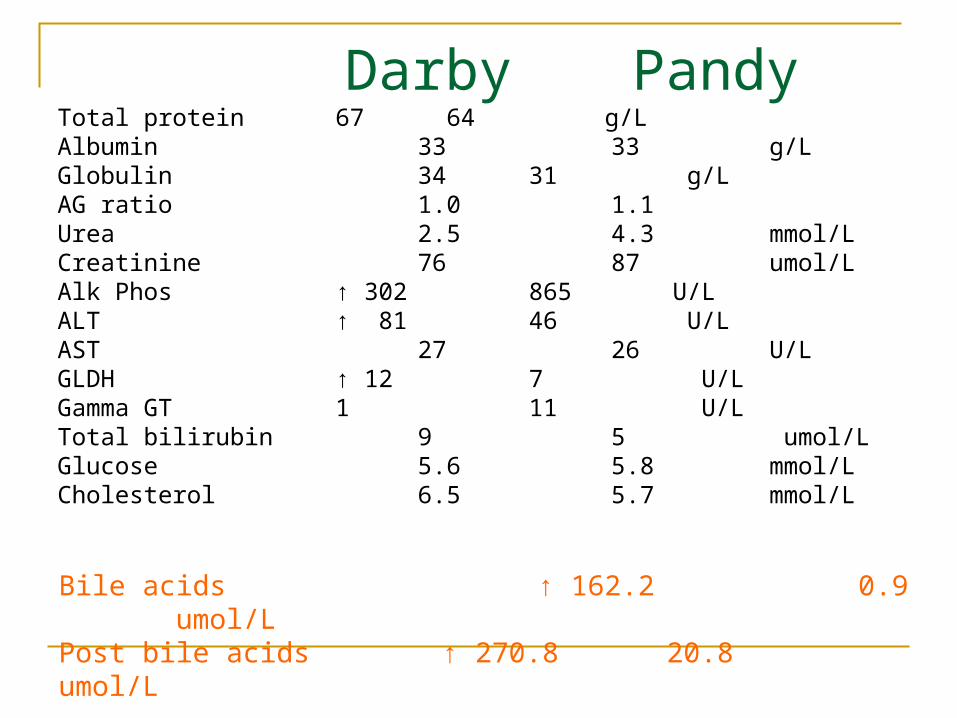
Darby PandyTotal protein 67 64 g/LAlbumin 33 33 g/LGlobulin 34 31 g/LAG ratio 1.0 1.1 Urea 2.5 4.3 mmol/LCreatinine 76 87 umol/L Alk Phos ↑ 302 865 U/L ALT ↑ 81 46 U/L AST 27 26 U/L GLDH ↑ 12 7 U/L Gamma GT 1 11 U/L Total bilirubin 9 5 umol/LGlucose 5.6 5.8 mmol/LCholesterol 6.5 5.7 mmol/L Bile acids ↑ 162.2 0.9 umol/L Post bile acids ↑ 270.8 20.8 umol/L
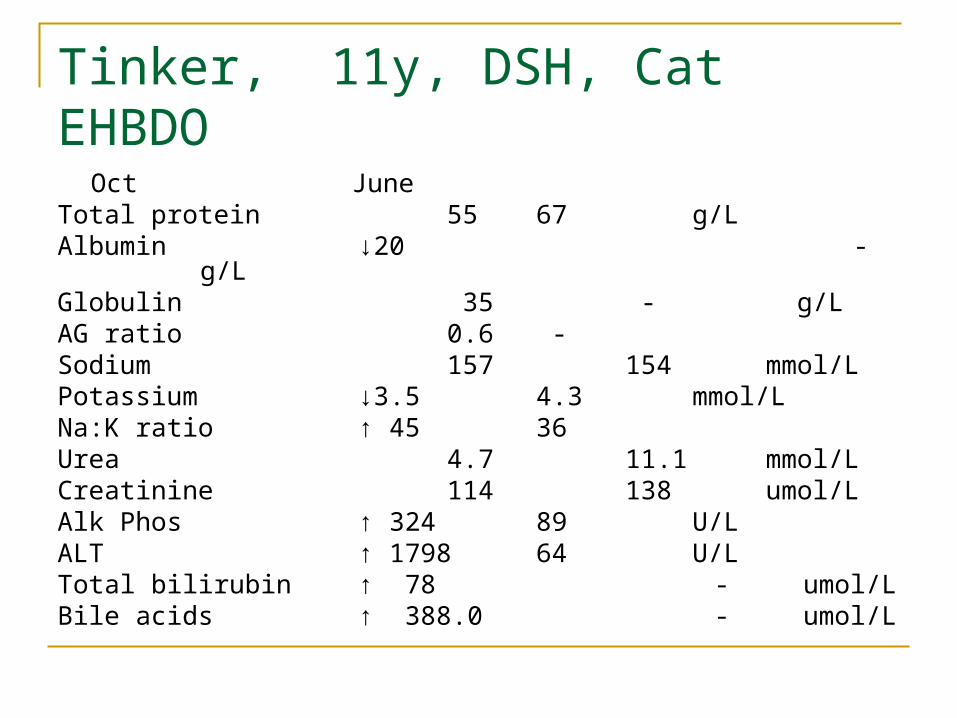
Tinker, 11y, DSH, CatEHBDO
Oct JuneTotal protein 55 67 g/LAlbumin ↓20 - g/LGlobulin 35 - g/LAG ratio 0.6 -Sodium 157 154 mmol/LPotassium ↓3.5 4.3 mmol/LNa:K ratio ↑ 45 36Urea 4.7 11.1 mmol/LCreatinine 114 138 umol/LAlk Phos ↑ 324 89 U/LALT ↑ 1798 64 U/LTotal bilirubin ↑ 78 - umol/LBile acids ↑ 388.0 - umol/L
Evaluating renal function
Urea used as a sentinel molecule for nitrogenous waste in blood
Urea concentration is affected byRate of NH4 formation (protein breakdown)Rate of hepatic conversion to ureaRate of renal clearance Rate of intestinal excretion
Serum urea represents a composite of these factors
Evaluating renal function
Urea is more sensitive but less specific for renal function than creatinine
Hypovolaemia allows increased renal reabsorption of urea
Protein load from GI tract is variable GI bleeding may result in dogs in urea
increase unrelated to GFR
Causes of azotaemia
Prerenal causeshypovolaemia, shock, reduced cardiac output, hypoadrenocorticism
Renal causescongenital, inflammatory, toxic, renal ischaemia, neoplasia
Post renal causesurinary tract obstruction or leakage
Investigation of renal disease
Document persistence of the azotaemia Urinalysis
SG , dipstick, sediment (culture) Complete the profile
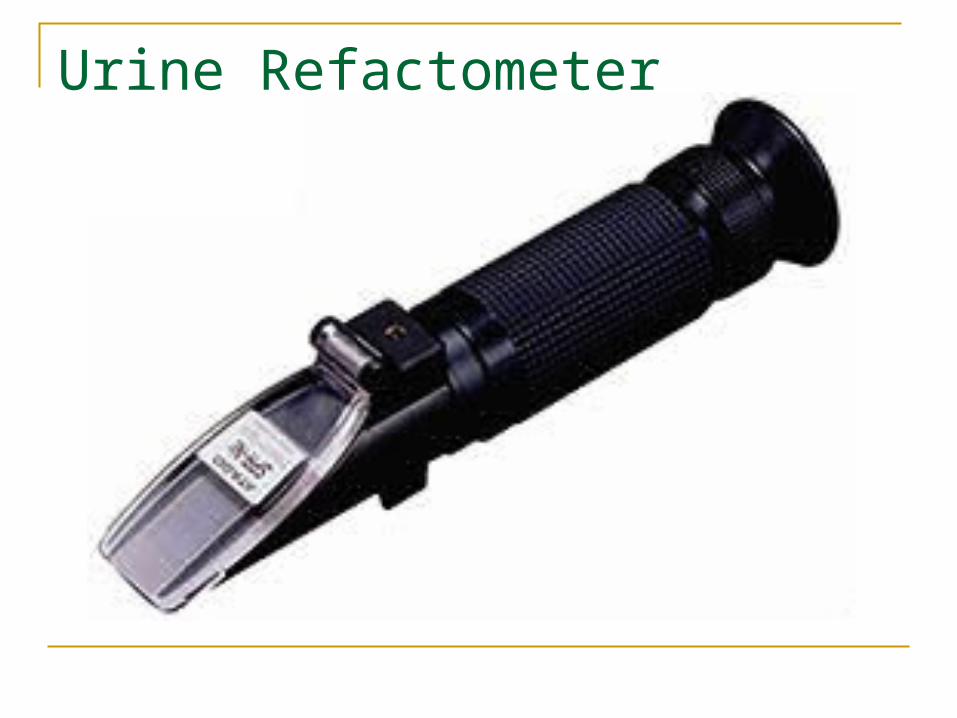
Urine Refactometer
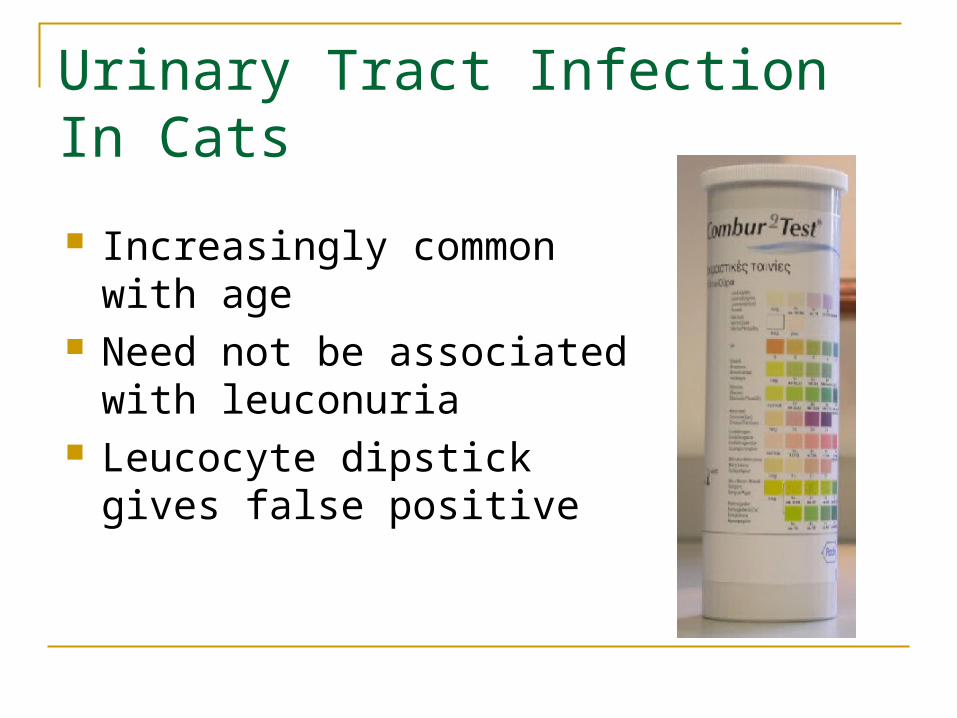
Urinary Tract Infection In Cats
Increasingly common with age
Need not be associated with leuconuria
Leucocyte dipstick gives false positive
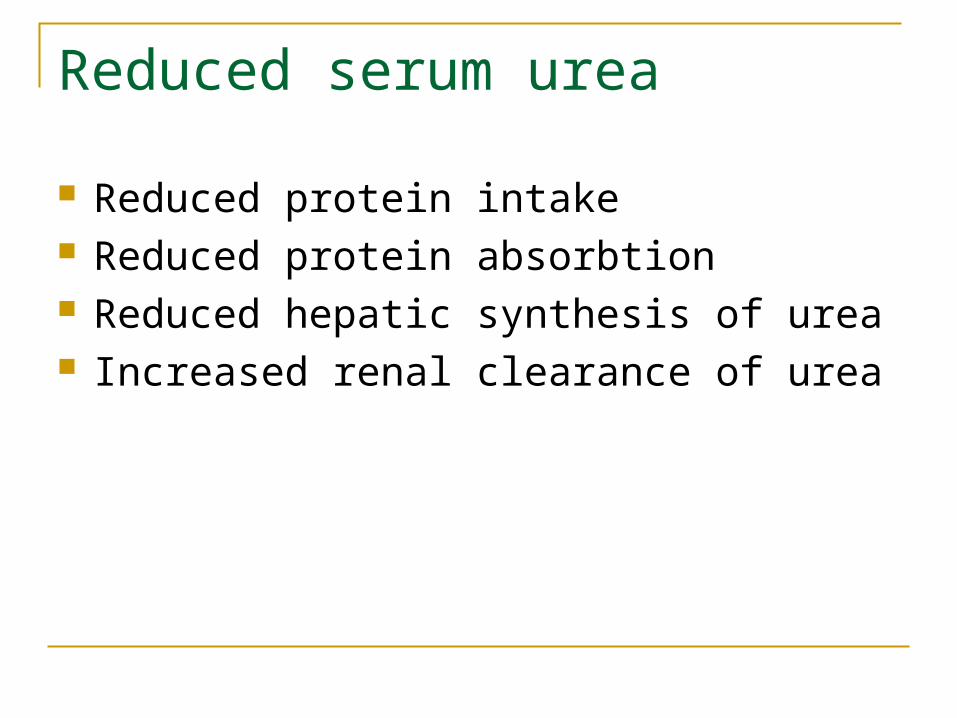
Reduced serum urea
Reduced protein intake Reduced protein absorbtion Reduced hepatic synthesis of urea Increased renal clearance of urea
Serum Electrolytes
Sodium Potassium Chloride
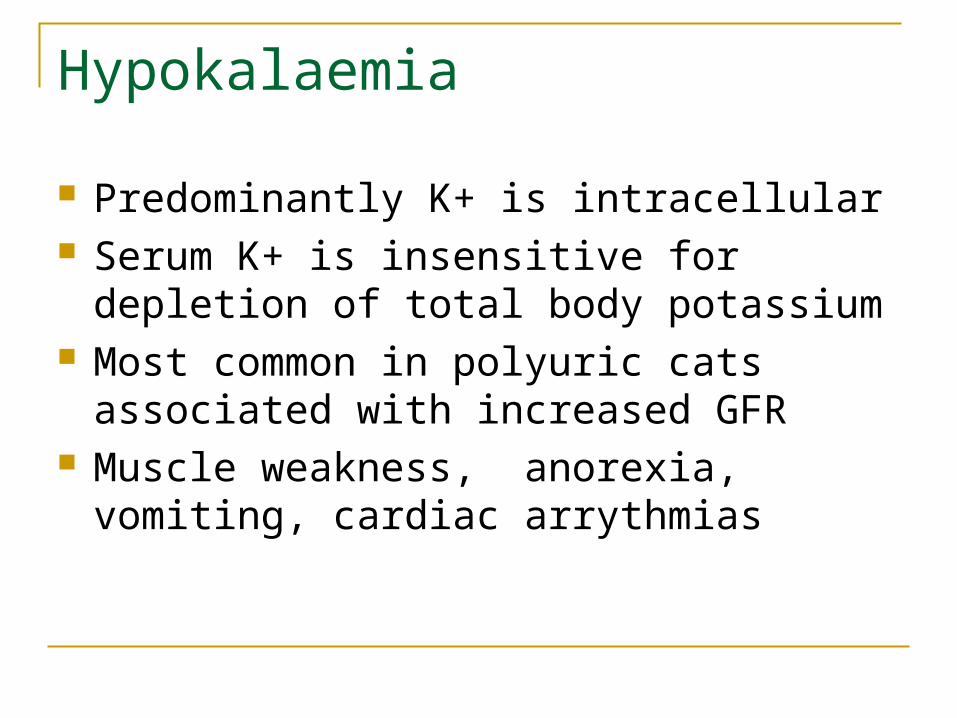
Hypokalaemia
Predominantly K+ is intracellular Serum K+ is insensitive for depletion of total
body potassium Most common in polyuric cats associated
with increased GFR Muscle weakness, anorexia, vomiting,
cardiac arrythmias
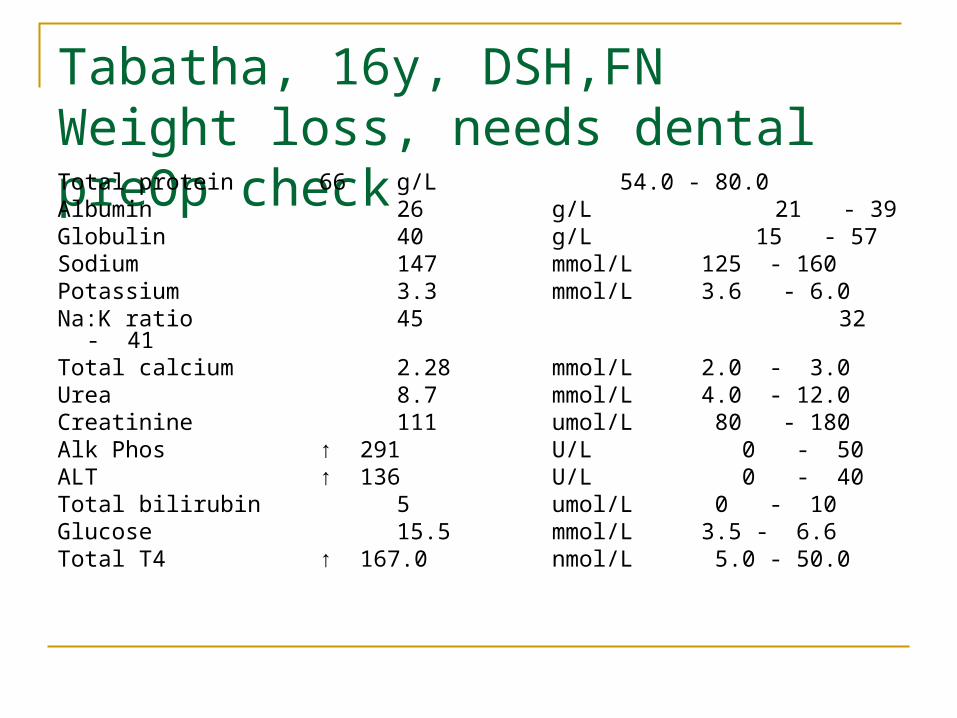
Tabatha, 16y, DSH,FNWeight loss, needs dental preOp checkTotal protein 66 g/L 54.0 - 80.0Albumin 26 g/L 21 - 39Globulin 40 g/L 15 - 57Sodium 147 mmol/L 125 - 160Potassium 3.3 mmol/L 3.6 - 6.0Na:K ratio 45 32 - 41Total calcium 2.28 mmol/L 2.0 - 3.0Urea 8.7 mmol/L 4.0 - 12.0Creatinine 111 umol/L 80 - 180Alk Phos ↑ 291 U/L 0 - 50ALT ↑ 136 U/L 0 - 40Total bilirubin 5 umol/L 0 - 10Glucose 15.5 mmol/L 3.5 - 6.6Total T4 ↑ 167.0 nmol/L 5.0 - 50.0
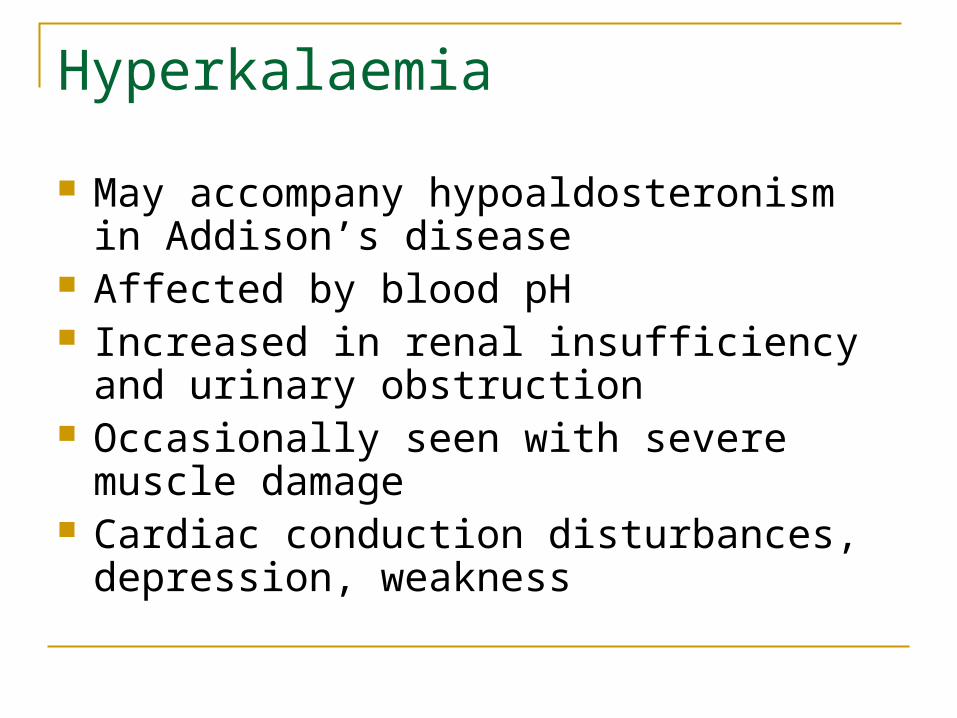
Hyperkalaemia
May accompany hypoaldosteronism in Addison’s disease
Affected by blood pH Increased in renal insufficiency and urinary
obstruction Occasionally seen with severe muscle
damage Cardiac conduction disturbances, depression,
weakness
Investigation of Electrolyte Abnormalities Exclude artefacts
preanalytical, analytical Check for underlying disease Correct pre-operatively
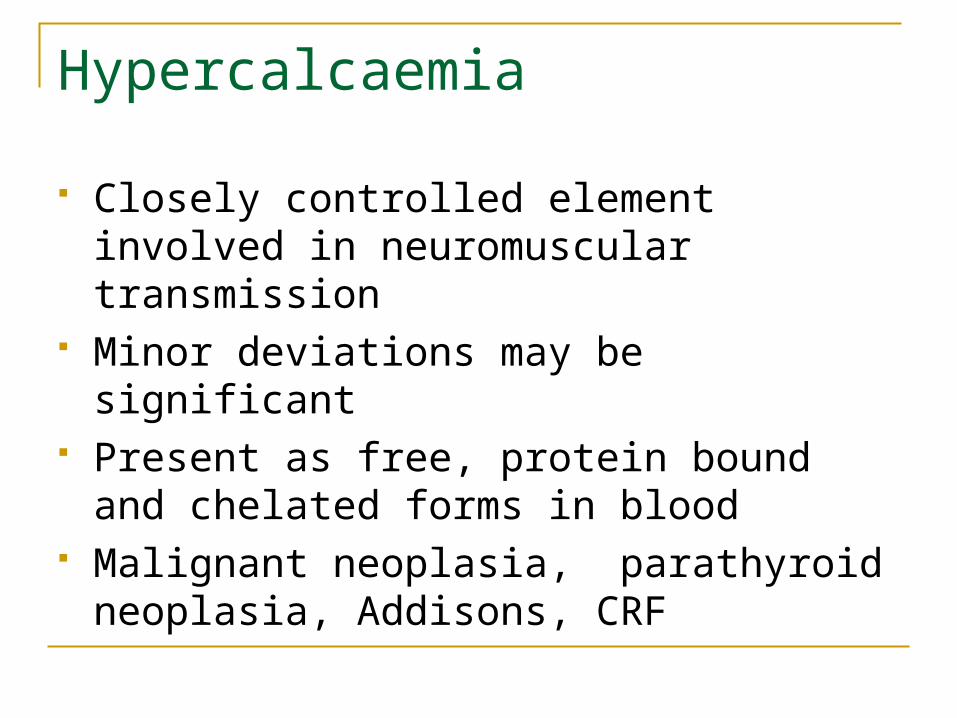
Hypercalcaemia
Closely controlled element involved in neuromuscular transmission
Minor deviations may be significant Present as free, protein bound and chelated
forms in blood Malignant neoplasia, parathyroid neoplasia,
Addisons, CRF

Preanaesthetic blood testing
Elective blood Testing
Sampling at consultation or vaccination Removes time pressure for medical decision
making Allows further testing if required ahead of
anaesthesia Increases flexibility of test procedures Improves client communication and
understanding
Elective blood Testing
Aims Screen for clinically occult disease where
early intervention is beneficial Provides baseline data Retained for future use To guide additional testing Facilitate improved perioperative
management
Elective blood testing
Test selection is based onHistory, signalment, physical findings
Screen or profile may be appropriateincorporate appropriate additional tests
Ensure pre-analytical & analytical error is minimised
Retain and compare data for an individual over time