beyond compliance: the doe residential energy code field study · beyond compliance: the doe...
TRANSCRIPT

Beyond Compliance: The DOE Residential Energy Code Field Study
David Cohan and Jeremy Williams, U.S. Department of Energy Rosemarie Bartlett, Mark Halverson, and Vrushali Mendon, Pacific Northwest National
Laboratory
ABSTRACT
In 2014, the U.S. Department of Energy (DOE) issued a FOA (Funding Opportunity Announcement) to conduct residential energy code field studies using a radically different methodology from previous studies. Historically, studies defined and measured “compliance” as the portion of all code requirements being met on a house-by-house basis. Compliance was assumed to be a surrogate for energy, but that connection was never empirically established. Low compliance rates reported by many past studies resulted in the widespread belief that large potential energy savings were available from improving code compliance.
DOE’s new methodology focuses directly on energy impacts. A preliminary analysis identified key code requirements accounting for a large majority of the energy used in the new single-family homes which comprised the study population. State-level sampling plans ensured statistically representative samples of each of these requirements were obtained.
For each state, energy use intensities (EUI’s) were calculated for a home just meeting the state prescriptive code requirements and compared to an EUI representing the collected field data. Results suggest that, on average, energy codes deliver most or all expected energy savings for the code adopted in a given state, overall—the opposite of conventional wisdom. At the same time, many sampled homes failed to meet at least one key code requirement, and many of the non-key requirements were not met. Also, the adopted code varied by state so there is clearly more energy savings potential available from adopting new codes. This rich new data set will drive important discussions on the value and role of energy codes.
Introduction
From a physics perspective, we know that energy codes save energy. More insulation and better windows reduce heat loss rates, tighter homes require less heated and cooled air, and more efficient lights use less energy. But a construction site is not a physics laboratory. So how do we know how much energy is actually saved in the field?
The answer is that we don’t. When you hear that a new code is 10% or 15% or 20% better than the old one, it is always a “code book-to-code book” comparison based strictly on what is written in the code, not on what happens in the field. A prototypical house is first modeled using the old code requirements (and standard assumptions for things like thermostat settings) and energy simulation software is used to calculate annual energy use. The model is then adjusted to reflect the changed requirements in the newer code, and run again to give a second annual energy use. These results are then compared by subtracting the second result from the first, giving you the annual savings—meaning, how much less energy a house built to the new code would use compared to the same house built to the old code. Dividing the annual savings by the original energy use gives you a savings percentage, and this is the number that is likely to be cited during code trainings or adoption hearings.
5-1©2016 ACEEE Summer Study on Energy Efficiency in Buildings

The benefit of this approach is that it can be done quickly and easily, and it is reproducible. The problem is that it assumes 100% compliance with the code. That everyone uses R-19 wherever it is required. That no one ever forgets to install it anywhere, and no one ever uses R-15 instead of R-19 because there was leftover in the truck from the last job they did. The models also assume that everything is installed perfectly. If the wall insulation requirement is R-19, then it is modeled as R-19, implicitly attributing a perfect installation every time—no voids, no compression, no breaks in the air barrier. This divide between the perfect world of the computer models and the reality of how homes are actually constructed is of increasing concern as more and more states and utilities rely on energy codes to deliver savings.
Of equal concern is that the few field studies which have looked at the impacts of energy codes did not get directly at energy savings. Instead, the historical approach has been to measure “compliance” in the way that a building official thinks of it: a checklist is developed containing all of the code requirements, homes are visited multiple times, and each requirement is observed and determined to be either compliant or non-compliant. The results are then published as percentages, so a typical study would conclude that the compliance rate was 72% or 83% or some other number for a given state or locality.
The weakness of this approach is that compliance does not translate directly into energy savings because some energy code requirements save a lot of energy while others don’t save any. For example, there has been a requirement for many years that R-values, performance test results and equipment efficiencies have to be documented on a label that is affixed to the electrical panel. There is a good reason to have such a label, but the act of sticking it on the electrical panel clearly does not save any energy. So, if your focus is energy savings, you might not care at all about what the compliance rate is for labels, but you would care a great deal about the compliance rates for things like windows and insulation.
Field Study
To address the lack of information available on energy code impacts, the U.S. Department of Energy (DOE) Building Energy Codes Program (BECP) developed a methodology specifically designed to determine energy savings and is implementing it in a multistate field research study. The study comprises three main phases:
• Phase I (Year 1): A statistically representative baseline field study to identify: (a) the
energy use in typical residential buildings in a given state, and; (b) opportunities for improving energy efficiency.
• Phase II (Years 1-3): An education, training & outreach phase targeting the opportunities identified in the baseline study.
• Phase III (Year 3): A follow-up field study to identify the change in energy use following phase II activities. Contractors were selected through a public solicitation that resulted in the eight state
projects shown in Table 1. (The concentration in eastern states was the result of the competitive solicitation process rather than any constraint imposed by BECP, and any extrapolation of results to other states would be purely speculative.) In late 2014, stakeholder meetings were held in each state to kick off the projects. The Pacific Northwest National Laboratory (PNNL) assisted in the development of the sampling methodology and conducted the analysis of the field data.
5-2 ©2016 ACEEE Summer Study on Energy Efficiency in Buildings
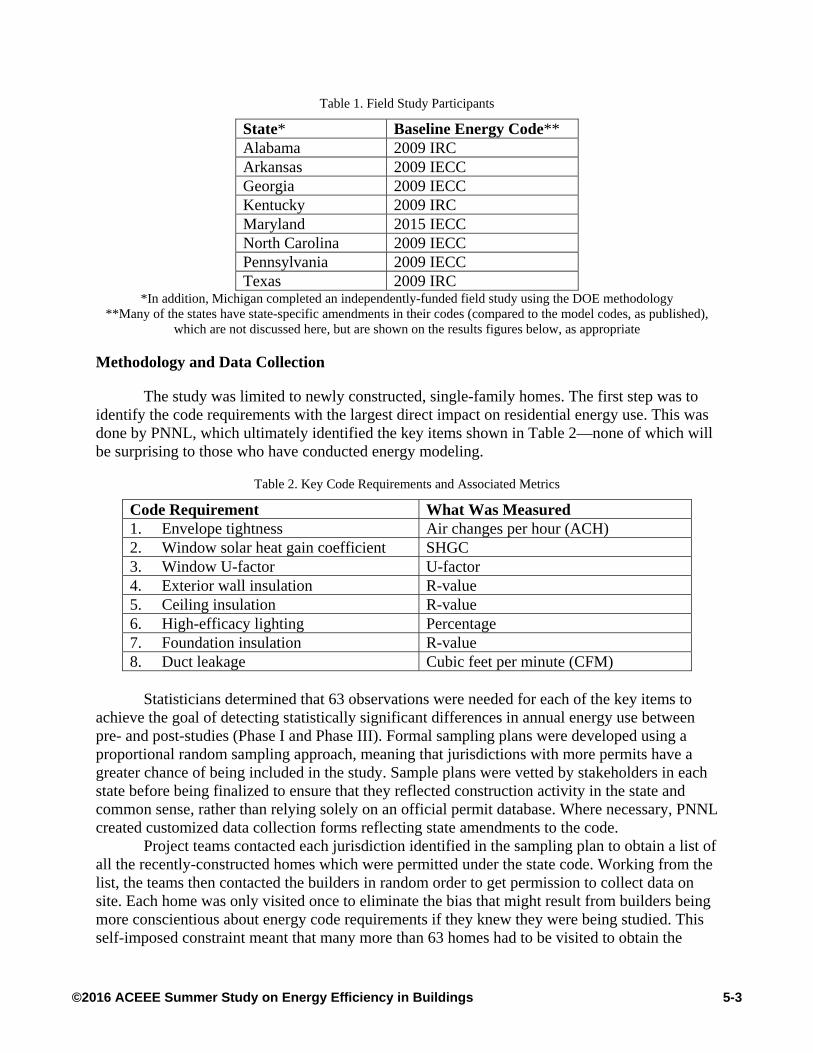
Table 1. Field Study Participants
State* Baseline Energy Code** Alabama 2009 IRC Arkansas 2009 IECC Georgia 2009 IECC Kentucky 2009 IRC Maryland 2015 IECC North Carolina 2009 IECC Pennsylvania 2009 IECC Texas 2009 IRC
*In addition, Michigan completed an independently-funded field study using the DOE methodology **Many of the states have state-specific amendments in their codes (compared to the model codes, as published),
which are not discussed here, but are shown on the results figures below, as appropriate
Methodology and Data Collection
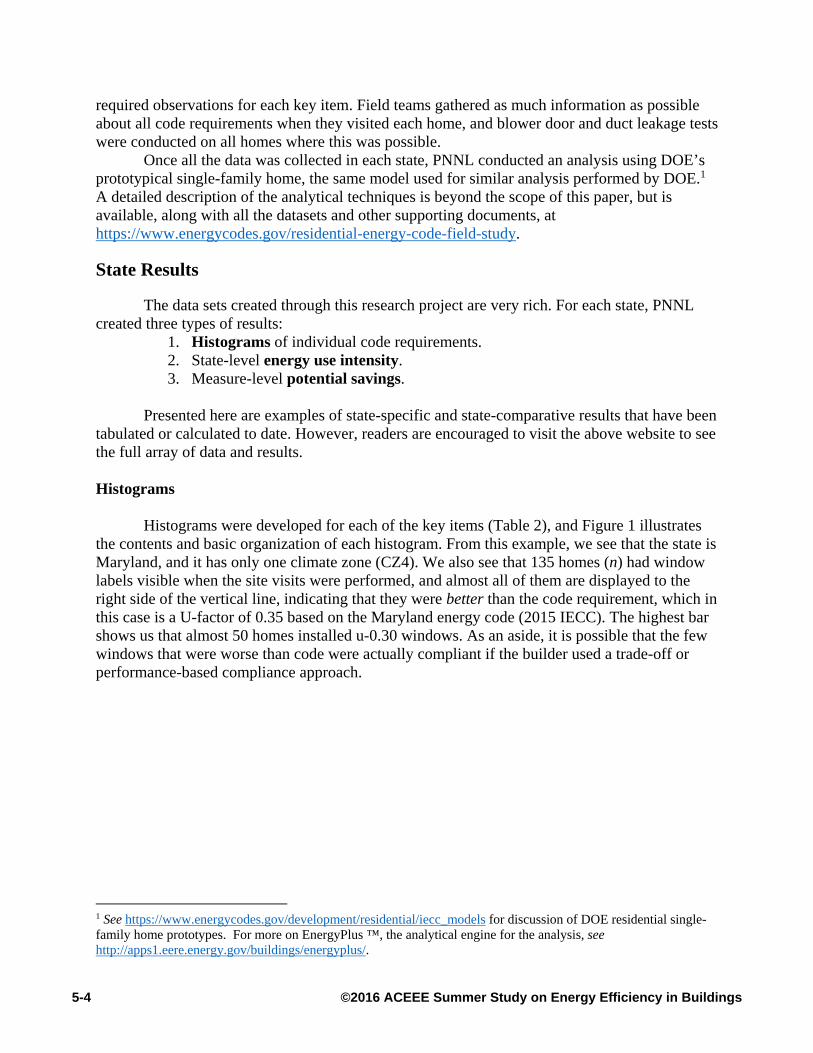
The study was limited to newly constructed, single-family homes. The first step was to identify the code requirements with the largest direct impact on residential energy use. This was done by PNNL, which ultimately identified the key items shown in Table 2—none of which will be surprising to those who have conducted energy modeling.
Table 2. Key Code Requirements and Associated Metrics
Code Requirement What Was Measured 1. Envelope tightness Air changes per hour (ACH) 2. Window solar heat gain coefficient SHGC 3. Window U-factor U-factor 4. Exterior wall insulation R-value 5. Ceiling insulation R-value 6. High-efficacy lighting Percentage 7. Foundation insulation R-value 8. Duct leakage Cubic feet per minute (CFM)
Statisticians determined that 63 observations were needed for each of the key items to
achieve the goal of detecting statistically significant differences in annual energy use between pre- and post-studies (Phase I and Phase III). Formal sampling plans were developed using a proportional random sampling approach, meaning that jurisdictions with more permits have a greater chance of being included in the study. Sample plans were vetted by stakeholders in each state before being finalized to ensure that they reflected construction activity in the state and common sense, rather than relying solely on an official permit database. Where necessary, PNNL created customized data collection forms reflecting state amendments to the code.
Project teams contacted each jurisdiction identified in the sampling plan to obtain a list of all the recently-constructed homes which were permitted under the state code. Working from the list, the teams then contacted the builders in random order to get permission to collect data on site. Each home was only visited once to eliminate the bias that might result from builders being more conscientious about energy code requirements if they knew they were being studied. This self-imposed constraint meant that many more than 63 homes had to be visited to obtain the
5-3©2016 ACEEE Summer Study on Energy Efficiency in Buildings
required observations for each key item. Field teams gathered as much information as possible about all code requirements when they visited each home, and blower door and duct leakage tests were conducted on all homes where this was possible.
Once all the data was collected in each state, PNNL conducted an analysis using DOE’s prototypical single-family home, the same model used for similar analysis performed by DOE.1 A detailed description of the analytical techniques is beyond the scope of this paper, but is available, along with all the datasets and other supporting documents, at https://www.energycodes.gov/residential-energy-code-field-study.
State Results
The data sets created through this research project are very rich. For each state, PNNL created three types of results:
1. Histograms of individual code requirements. 2. State-level energy use intensity. 3. Measure-level potential savings.
Presented here are examples of state-specific and state-comparative results that have been
tabulated or calculated to date. However, readers are encouraged to visit the above website to see the full array of data and results.
Histograms
Histograms were developed for each of the key items (Table 2), and Figure 1 illustrates the contents and basic organization of each histogram. From this example, we see that the state is Maryland, and it has only one climate zone (CZ4). We also see that 135 homes (n) had window labels visible when the site visits were performed, and almost all of them are displayed to the right side of the vertical line, indicating that they were better than the code requirement, which in this case is a U-factor of 0.35 based on the Maryland energy code (2015 IECC). The highest bar shows us that almost 50 homes installed u-0.30 windows. As an aside, it is possible that the few windows that were worse than code were actually compliant if the builder used a trade-off or performance-based compliance approach.
1 See https://www.energycodes.gov/development/residential/iecc_models for discussion of DOE residential single- family home prototypes. For more on EnergyPlus ™, the analytical engine for the analysis, see http://apps1.eere.energy.gov/buildings/energyplus/.
5-4 ©2016 ACEEE Summer Study on Energy Efficiency in Buildings

Figure 1. Example Result Figure with Annotations
Figures 2 through 5 show the observed data for each key item for the state of North Carolina, along with the effective code requirement based on the 2012 North Carolina Energy Conservation Code. North Carolina has two IECC climate zones, 3A and 4A, which have different code requirements.
Figure 2. Envelope Tightness and Duct Tightness for North Carolina
5-5©2016 ACEEE Summer Study on Energy Efficiency in Buildings
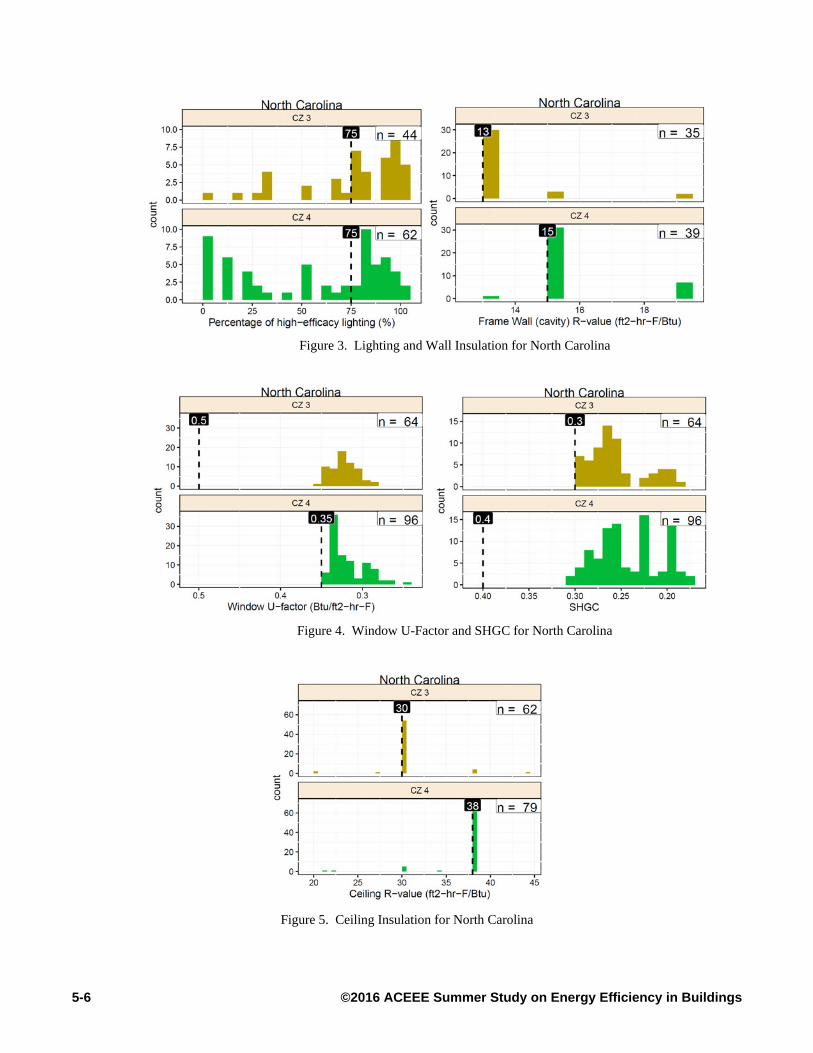
Figure 3. Lighting and Wall Insulation for North Carolina
Figure 4. Window U-Factor and SHGC for North Carolina
Figure 5. Ceiling Insulation for North Carolina
5-6 ©2016 ACEEE Summer Study on Energy Efficiency in Buildings

Energy Use Intensity (EUI)
Applying a Monte Carlo statistical method and modeling to the field data,2 PNNL calculated an EUI (kBtu/sf/year) for the code-regulated loads in a typical home in each state. They then created a second EUI using a model that exactly met the minimum code requirements. Figure 6 shows the results for Alabama. The black line represents the code-minimum house and has an EUI of 22.4; the purple line represents the average home based on the field data and has an EUI of 19.8. This means that the average home in Alabama uses less energy than we would expect based solely on the code requirements. This result may initially seem counter-intuitive, but the data were very consistent. Overall for all states, of the key requirements shown in Table 1, only one was rarely met (lighting), five were met or exceeded most of the time (air and duct leakage, insulation levels) and two were almost always exceeded (window U and window SHGC). As an example, Figure 4 above shows that virtually all windows in North Carolina exceed code, most of them by a large amount. Also, despite the widespread prior beliefs about low compliance, the study results make sense under the basic theory that codes establish minimum requirements which most people tend to obey.
Figure 6. Alabama EUI Results
Potential Savings The objective of the potential savings analysis was to identify building components that
are consistently weaker than what the code requires (in terms of energy efficiency), which can in turn inform the design of Phase 2 energy, training and outreach activities to help improve the relevant building practices. Increased energy savings that can result from improving these
2 Available at https://www.energycodes.gov/residential-energy-code-field-study
5-7©2016 ACEEE Summer Study on Energy Efficiency in Buildings
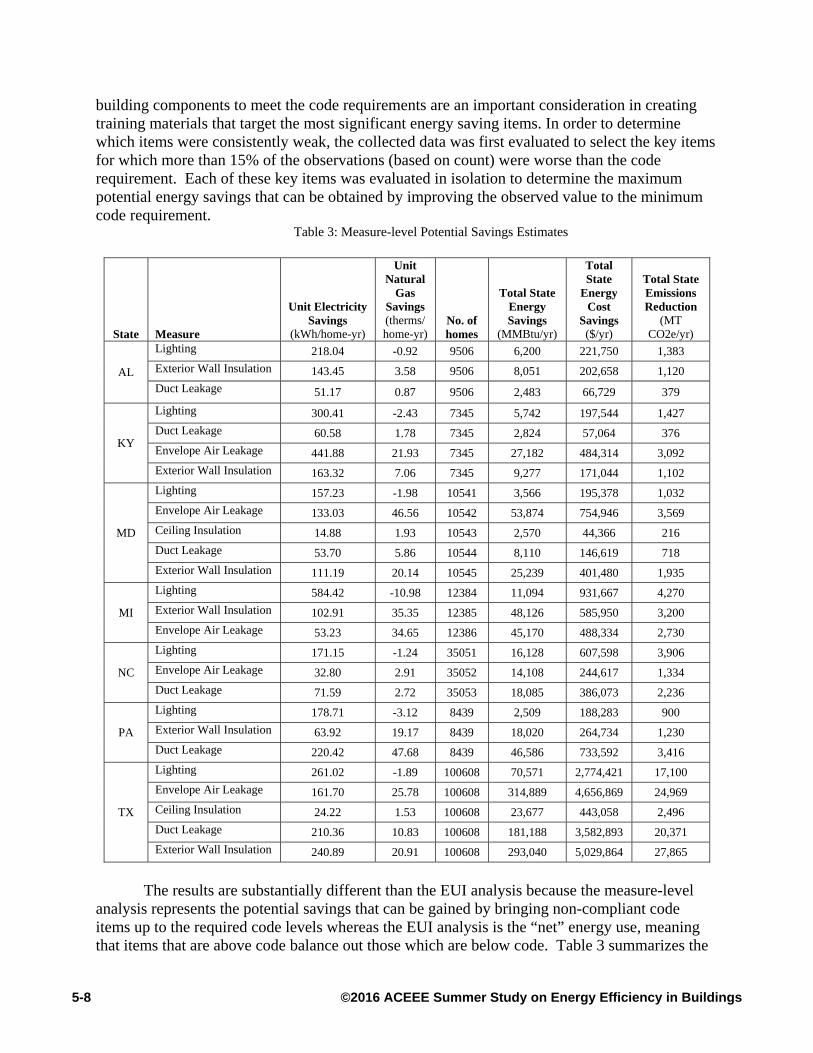
building components to meet the code requirements are an important consideration in creating training materials that target the most significant energy saving items. In order to determine which items were consistently weak, the collected data was first evaluated to select the key items for which more than 15% of the observations (based on count) were worse than the code requirement. Each of these key items was evaluated in isolation to determine the maximum potential energy savings that can be obtained by improving the observed value to the minimum code requirement.
Table 3: Measure-level Potential Savings Estimates
State Measure
Unit Electricity Savings
(kWh/home-yr)
Unit Natural
Gas Savings (therms/home-yr)
No. of homes
Total State Energy Savings
(MMBtu/yr)
Total State
Energy Cost
Savings ($/yr)
Total State Emissions Reduction
(MT CO2e/yr)
AL
Lighting 218.04 -0.92 9506 6,200 221,750 1,383
Exterior Wall Insulation 143.45 3.58 9506 8,051 202,658 1,120
Duct Leakage 51.17 0.87 9506 2,483 66,729 379
KY
Lighting 300.41 -2.43 7345 5,742 197,544 1,427
Duct Leakage 60.58 1.78 7345 2,824 57,064 376
Envelope Air Leakage 441.88 21.93 7345 27,182 484,314 3,092
Exterior Wall Insulation 163.32 7.06 7345 9,277 171,044 1,102
MD
Lighting 157.23 -1.98 10541 3,566 195,378 1,032
Envelope Air Leakage 133.03 46.56 10542 53,874 754,946 3,569
Ceiling Insulation 14.88 1.93 10543 2,570 44,366 216
Duct Leakage 53.70 5.86 10544 8,110 146,619 718
Exterior Wall Insulation 111.19 20.14 10545 25,239 401,480 1,935
MI
Lighting 584.42 -10.98 12384 11,094 931,667 4,270
Exterior Wall Insulation 102.91 35.35 12385 48,126 585,950 3,200
Envelope Air Leakage 53.23 34.65 12386 45,170 488,334 2,730
NC
Lighting 171.15 -1.24 35051 16,128 607,598 3,906
Envelope Air Leakage 32.80 2.91 35052 14,108 244,617 1,334
Duct Leakage 71.59 2.72 35053 18,085 386,073 2,236
PA
Lighting 178.71 -3.12 8439 2,509 188,283 900
Exterior Wall Insulation 63.92 19.17 8439 18,020 264,734 1,230
Duct Leakage 220.42 47.68 8439 46,586 733,592 3,416
TX
Lighting 261.02 -1.89 100608 70,571 2,774,421 17,100
Envelope Air Leakage 161.70 25.78 100608 314,889 4,656,869 24,969
Ceiling Insulation 24.22 1.53 100608 23,677 443,058 2,496
Duct Leakage 210.36 10.83 100608 181,188 3,582,893 20,371
Exterior Wall Insulation 240.89 20.91 100608 293,040 5,029,864 27,865
The results are substantially different than the EUI analysis because the measure-level
analysis represents the potential savings that can be gained by bringing non-compliant code items up to the required code levels whereas the EUI analysis is the “net” energy use, meaning that items that are above code balance out those which are below code. Table 3 summarizes the
5-8 ©2016 ACEEE Summer Study on Energy Efficiency in Buildings

measure-level potential savings estimates for the seven states for which this analysis has been completed. The average per home energy savings estimates were extrapolated to state-wide energy savings using new residential building construction volumes from the latest full year of U.S. Census Bureau permit data (Census Bureau 2016). Energy costs and emissions reduction estimates were calculated using state-specific fuel prices from the Energy Information Administration (EIA 2016a and EIA 2016b). Estimated reduction in emissions was calculated using emission factors associated with electricity and natural gas from the U.S. Environmental Protection Agency (EPA 2016).
State Comparisons
An infinite number of comparisons could be made between states. Here we give three examples that highlight broader trends.
Figure 7 places the observed window U-factors from all states analyzed on one graph. It is immediately clear that, regardless of the code requirement or the climate zone, builders in every state are installing windows with U-factors at or below 0.35.
Figure 7. Window U-Factor Across States
Figure 8 shows envelope tightness for eight states. Five of the eight show almost no observed values over 7ACH. Maryland, which has the stricter 3ACH requirement, does not appear to have a greatly different range of values than the states with a 7ACH requirement. North Carolina has the tightest distribution with very few houses over 5ACH.
5-9©2016 ACEEE Summer Study on Energy Efficiency in Buildings
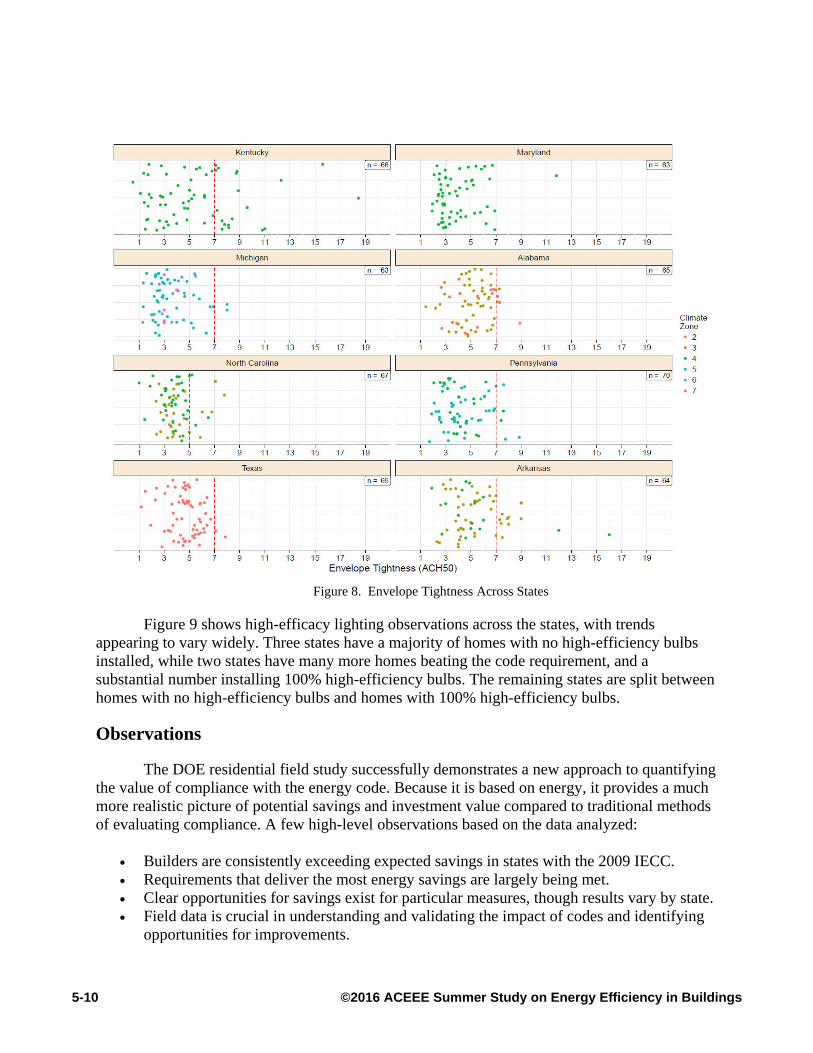
Figure 8. Envelope Tightness Across States
Figure 9 shows high-efficacy lighting observations across the states, with trends appearing to vary widely. Three states have a majority of homes with no high-efficiency bulbs installed, while two states have many more homes beating the code requirement, and a substantial number installing 100% high-efficiency bulbs. The remaining states are split between homes with no high-efficiency bulbs and homes with 100% high-efficiency bulbs.
Observations
The DOE residential field study successfully demonstrates a new approach to quantifying the value of compliance with the energy code. Because it is based on energy, it provides a much more realistic picture of potential savings and investment value compared to traditional methods of evaluating compliance. A few high-level observations based on the data analyzed:
• Builders are consistently exceeding expected savings in states with the 2009 IECC. • Requirements that deliver the most energy savings are largely being met. • Clear opportunities for savings exist for particular measures, though results vary by state. • Field data is crucial in understanding and validating the impact of codes and identifying
opportunities for improvements.
5-10 ©2016 ACEEE Summer Study on Energy Efficiency in Buildings
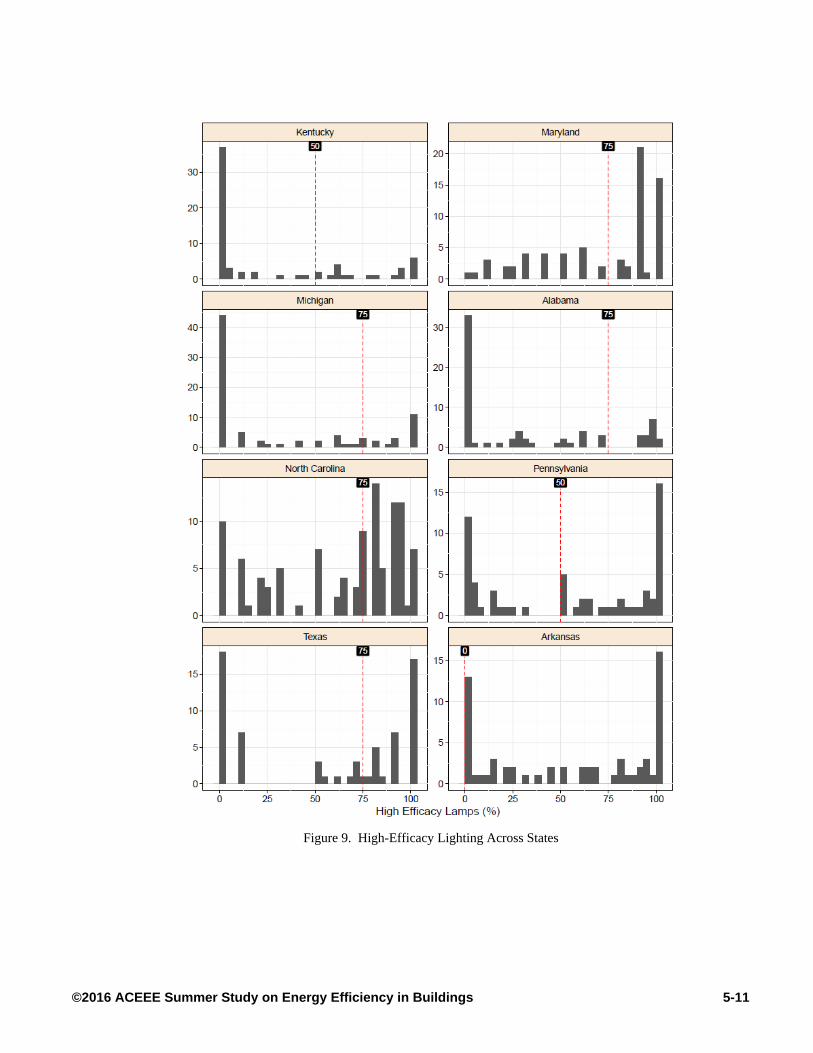
Figure 9. High-Efficacy Lighting Across States
5-11©2016 ACEEE Summer Study on Energy Efficiency in Buildings
At a more granular level, individual code requirements appear to consistently fall into one of three categories regardless of which state’s data is being looked at:
• A large majority of homes exactly meet the code requirement. The clearest example of
this is wall insulation, where most homes visited exactly met code requirement for insulation level. Installation quality on the other hand, was weak in many cases.
• A large majority of homes are better than the code. Windows were consistently better than code in every state.
• Homes vary over a broad range. In each state, envelope and duct leakage rates and lighting all have a large range of values, including non-compliant values.
At the same time, it is important to remember that these results come from only eight states,
which are concentrated in the south and east of the country. Only a few of these have cold winters, and none are in the hot-dry region of the country. DOE hopes that these limitations will be overcome as more states use the new methodology, and has an open offer to provide the sample design and data analysis free of charge for any state willing to use its methodology.
As of publication of this paper, states participating in the field study have begun to implement Phase II, using education, training and outreach to target the opportunities identified in the work presented here. Each state is using its own approach with the shared goal of modifying typical construction practices to produce more code compliant buildings and more energy savings. DOE will be reporting on these activities in a future paper.
References
Census Bureau. 2016. CENSTATS Database. 2014 permit data available at http://www.census.gov/construction/bps/txt/tb2u2014.txt.
EIA (Energy Information Administration). 2016a. Electric Power Annual. Washington, DC: U.S.
http://www.eia.gov/electricity/annual/. EIA (Energy Information Administration). 2016b. Natural Gas Annual. Washington, DC: U.S.
http://www.eia.gov/naturalgas/annual/. EPA (U.S. Environmental Protection Agency). 2016. Greenhouse Gas Equivalencies Calculator.
Washington, DC: http://www.epa.gov/energy/greenhouse-gas-equivalencies-calculator. DOE Building Energy Codes Program. 2016. Residential Energy Code Field Study. Washington,
DC: https://www.energycodes.gov/compliance/residential-energy-code-field-study.
5-12 ©2016 ACEEE Summer Study on Energy Efficiency in Buildings