better detection and discrimination of seagrasses using ... · coastal zone mapping and imaging...
TRANSCRIPT
11/8/2012 1 11/8/2012 1
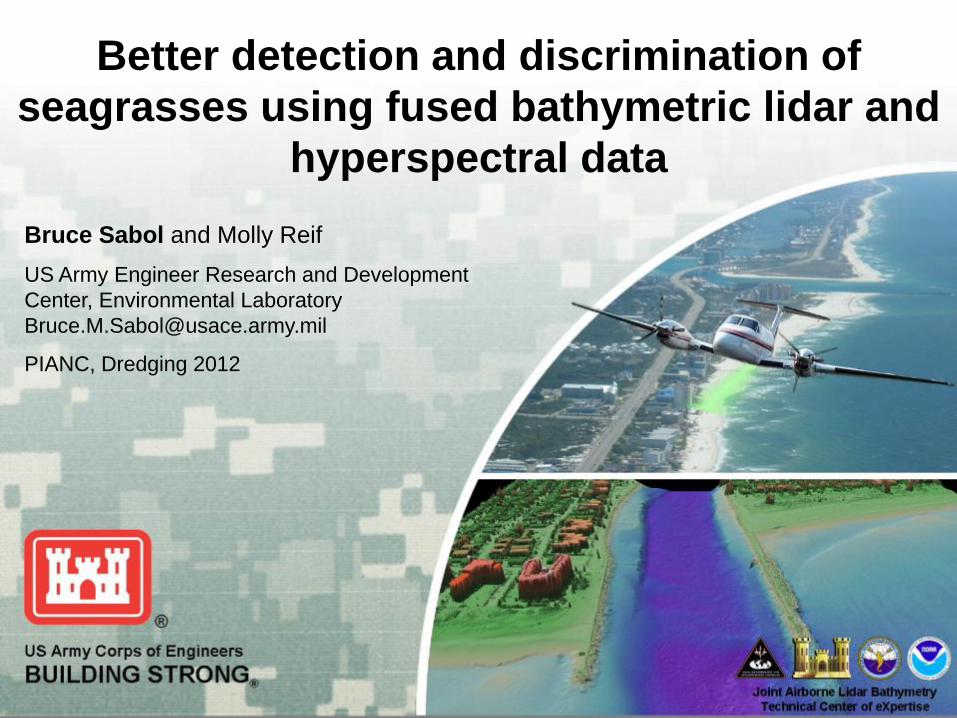
Better detection and discrimination of seagrasses using fused bathymetric lidar and
hyperspectral data Bruce Sabol and Molly Reif US Army Engineer Research and Development Center, Environmental Laboratory [email protected]
PIANC, Dredging 2012
11/8/2012 2 11/8/2012 2
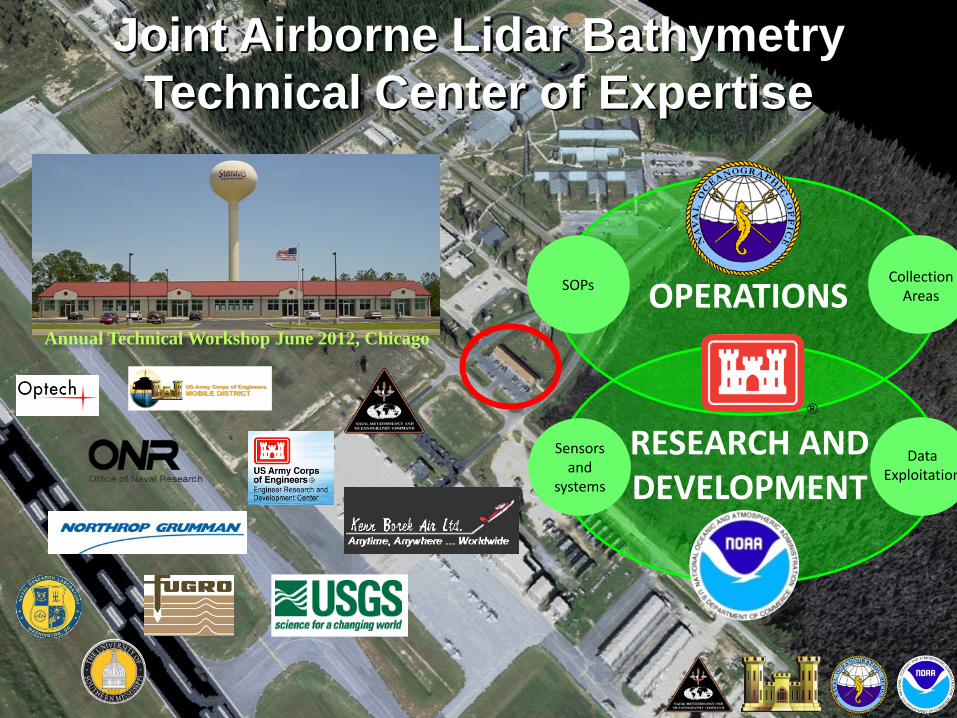
Joint Airborne Lidar Bathymetry Technical Center of Expertise
OPERATIONS
RESEARCH AND DEVELOPMENT
Annual Technical Workshop June 2012, Chicago
Sensors and
systems
SOPs Collection Areas
Data Exploitation
11/8/2012 3 11/8/2012 3
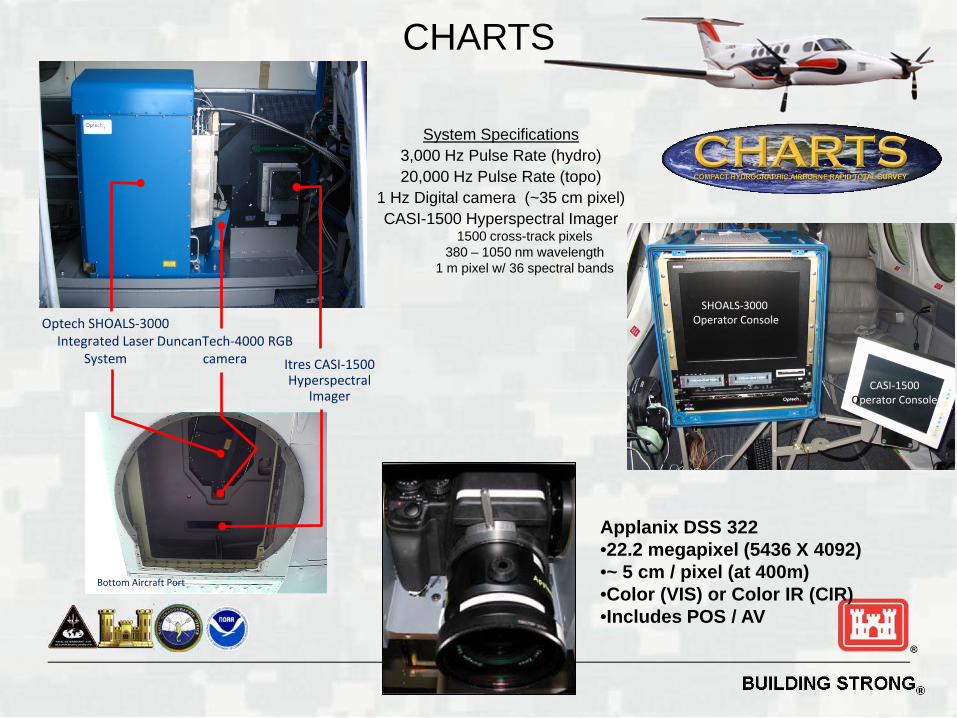
CASI-1500 Operator Console
SHOALS-3000 Operator Console
Bottom Aircraft Port
Optech SHOALS-3000 Integrated Laser
System DuncanTech-4000 RGB
camera Itres CASI-1500 Hyperspectral
Imager
System Specifications 3,000 Hz Pulse Rate (hydro) 20,000 Hz Pulse Rate (topo)
1 Hz Digital camera (~35 cm pixel) CASI-1500 Hyperspectral Imager
1500 cross-track pixels 380 – 1050 nm wavelength
1 m pixel w/ 36 spectral bands
CHARTS
Applanix DSS 322 •22.2 megapixel (5436 X 4092) •~ 5 cm / pixel (at 400m) •Color (VIS) or Color IR (CIR) •Includes POS / AV
BUILDING STRONG®
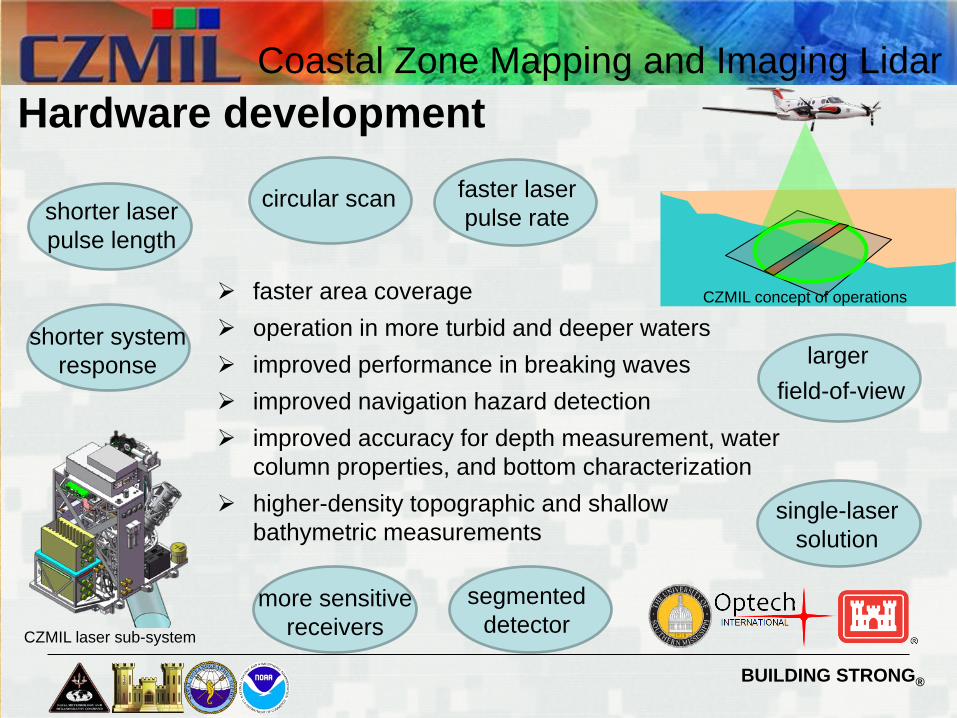
Coastal Zone Mapping and Imaging Lidar
CZMIL concept of operations
Hardware development
faster area coverage operation in more turbid and deeper waters improved performance in breaking waves improved navigation hazard detection improved accuracy for depth measurement, water
column properties, and bottom characterization higher-density topographic and shallow
bathymetric measurements
CZMIL laser sub-system
faster laser pulse rate
single-laser solution
larger field-of-view
more sensitive receivers
segmented detector
circular scan
shorter system response
shorter laser pulse length
BUILDING STRONG®
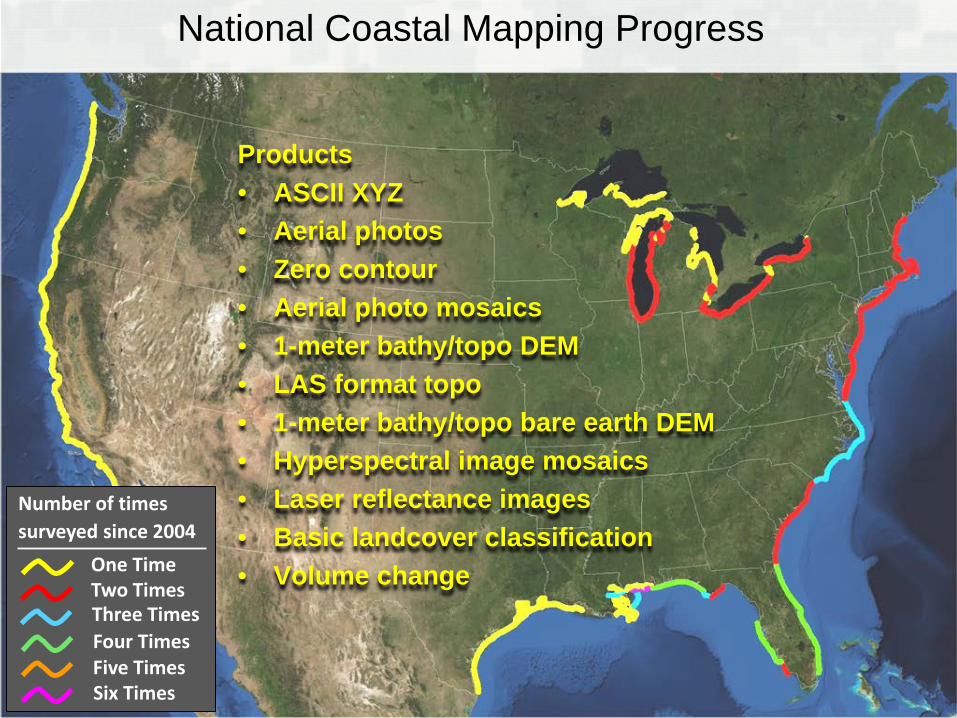
Products • ASCII XYZ • Aerial photos • Zero contour • Aerial photo mosaics • 1-meter bathy/topo DEM • LAS format topo • 1-meter bathy/topo bare earth DEM • Hyperspectral image mosaics • Laser reflectance images • Basic landcover classification • Volume change
National Coastal Mapping Progress
Number of times surveyed since 2004
One Time Two Times Three Times Four Times Five Times Six Times
BUILDING STRONG®
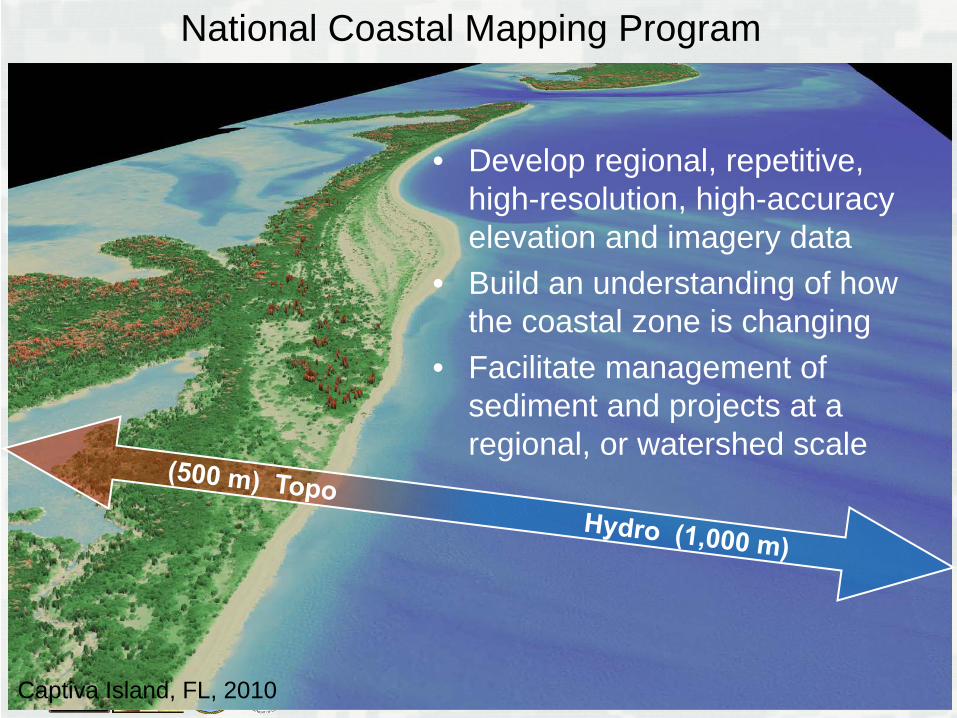
National Coastal Mapping Program
Captiva Island, FL, 2010
• Develop regional, repetitive, high-resolution, high-accuracy elevation and imagery data
• Build an understanding of how the coastal zone is changing
• Facilitate management of sediment and projects at a regional, or watershed scale
BUILDING STRONG®
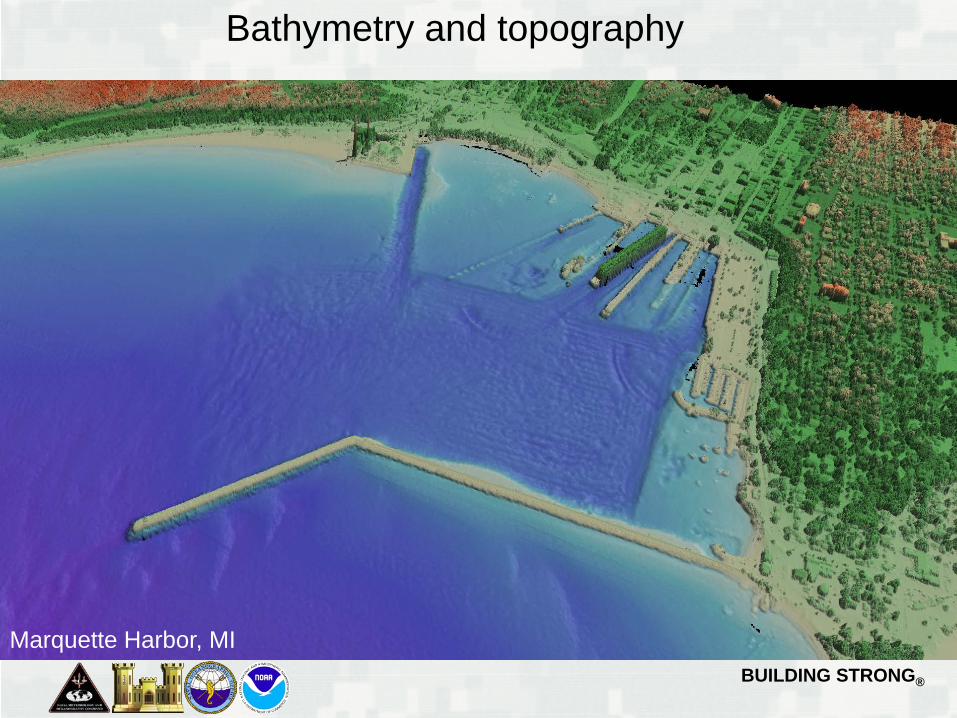
Bathymetry and topography
Marquette Harbor, MI
BUILDING STRONG®
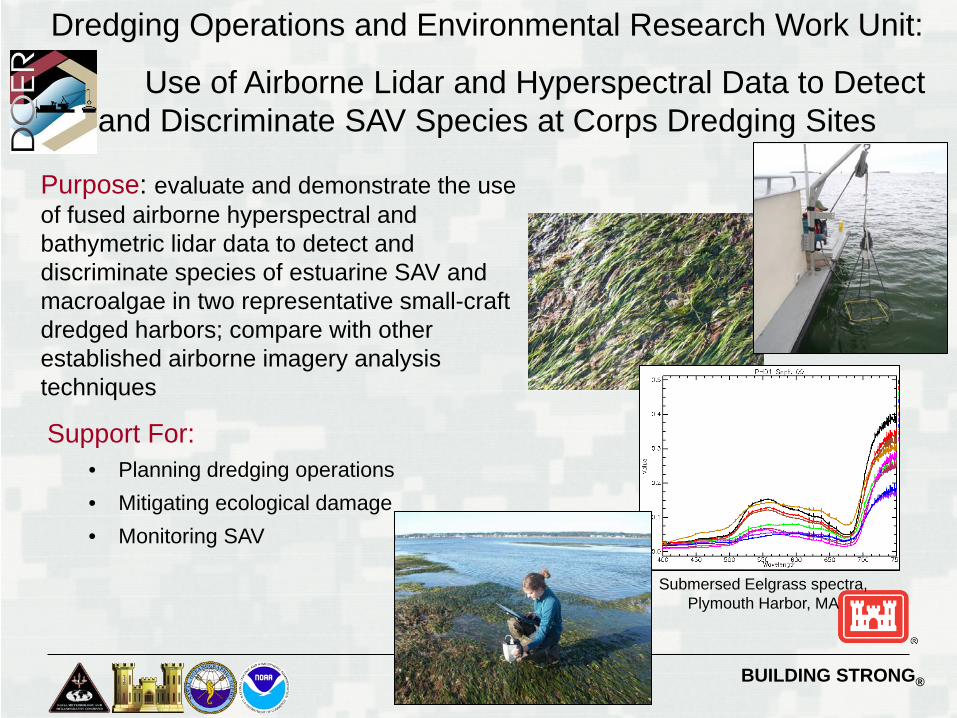
Purpose: evaluate and demonstrate the use of fused airborne hyperspectral and bathymetric lidar data to detect and discriminate species of estuarine SAV and macroalgae in two representative small-craft dredged harbors; compare with other established airborne imagery analysis techniques
Support For: • Planning dredging operations • Mitigating ecological damage • Monitoring SAV
Dredging Operations and Environmental Research Work Unit:
Use of Airborne Lidar and Hyperspectral Data to Detect and Discriminate SAV Species at Corps Dredging Sites
Submersed Eelgrass spectra, Plymouth Harbor, MA
BUILDING STRONG®
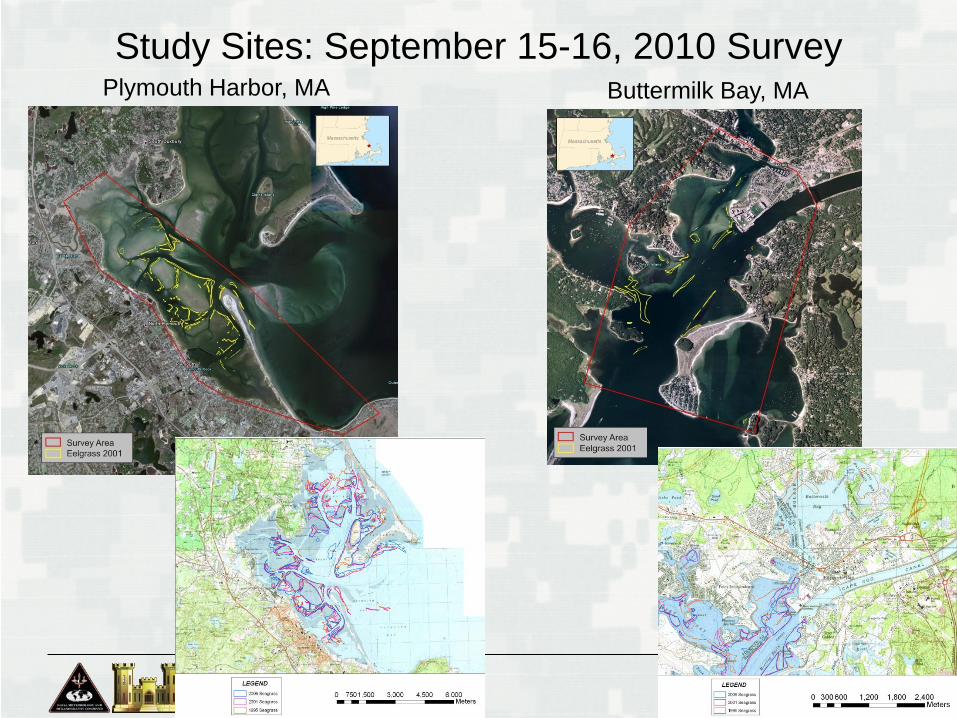
Study Sites: September 15-16, 2010 Survey Plymouth Harbor, MA Buttermilk Bay, MA
BUILDING STRONG®
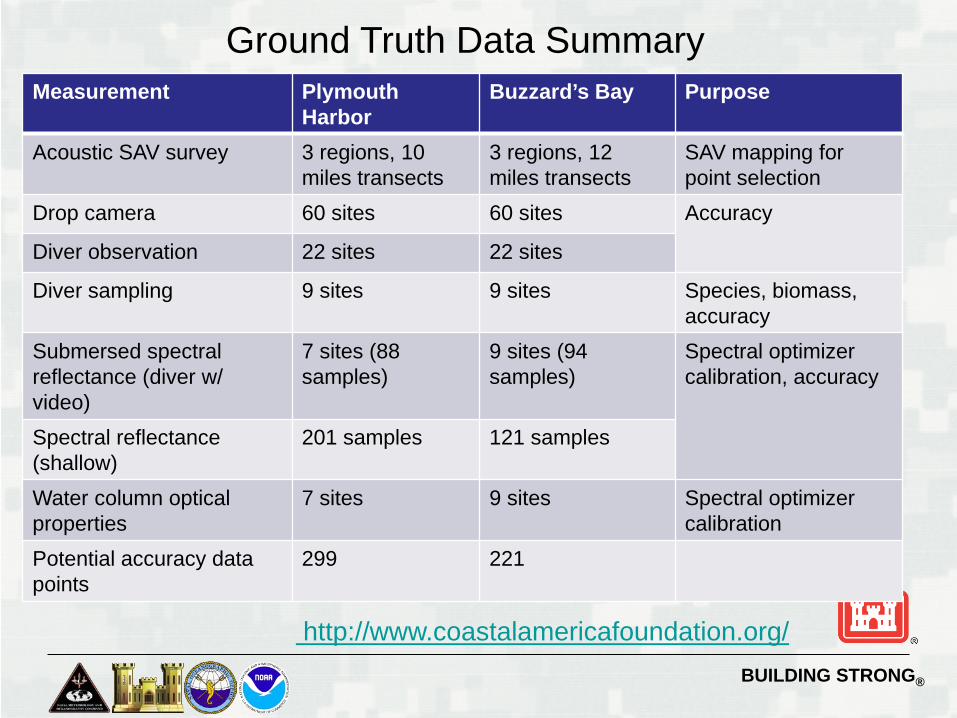
http://www.coastalamericafoundation.org/
Measurement Plymouth Harbor
Buzzard’s Bay Purpose
Acoustic SAV survey 3 regions, 10 miles transects
3 regions, 12 miles transects
SAV mapping for point selection
Drop camera 60 sites 60 sites Accuracy
Diver observation 22 sites 22 sites
Diver sampling 9 sites 9 sites Species, biomass, accuracy
Submersed spectral reflectance (diver w/ video)
7 sites (88 samples)
9 sites (94 samples)
Spectral optimizer calibration, accuracy
Spectral reflectance (shallow)
201 samples 121 samples
Water column optical properties
7 sites 9 sites Spectral optimizer calibration
Potential accuracy data points
299 221
Ground Truth Data Summary
BUILDING STRONG®
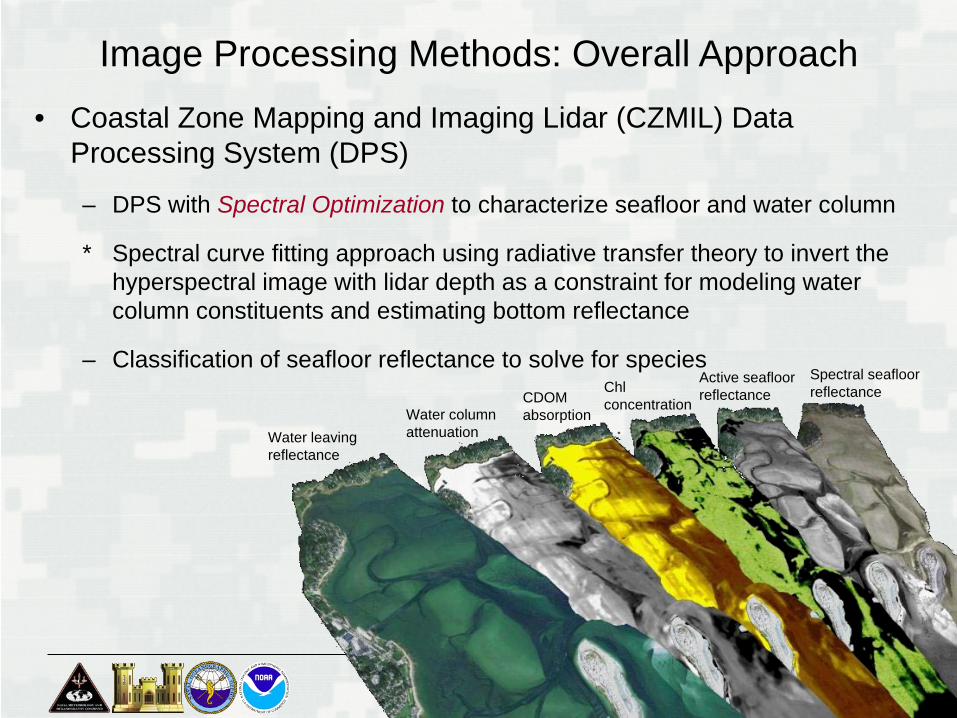
Image Processing Methods: Overall Approach • Coastal Zone Mapping and Imaging Lidar (CZMIL) Data
Processing System (DPS)
– DPS with Spectral Optimization to characterize seafloor and water column
* Spectral curve fitting approach using radiative transfer theory to invert the hyperspectral image with lidar depth as a constraint for modeling water column constituents and estimating bottom reflectance
– Classification of seafloor reflectance to solve for species
Water leaving reflectance
Water column attenuation
CDOM absorption
Chl concentration
Active seafloor reflectance
Spectral seafloor reflectance
BUILDING STRONG®
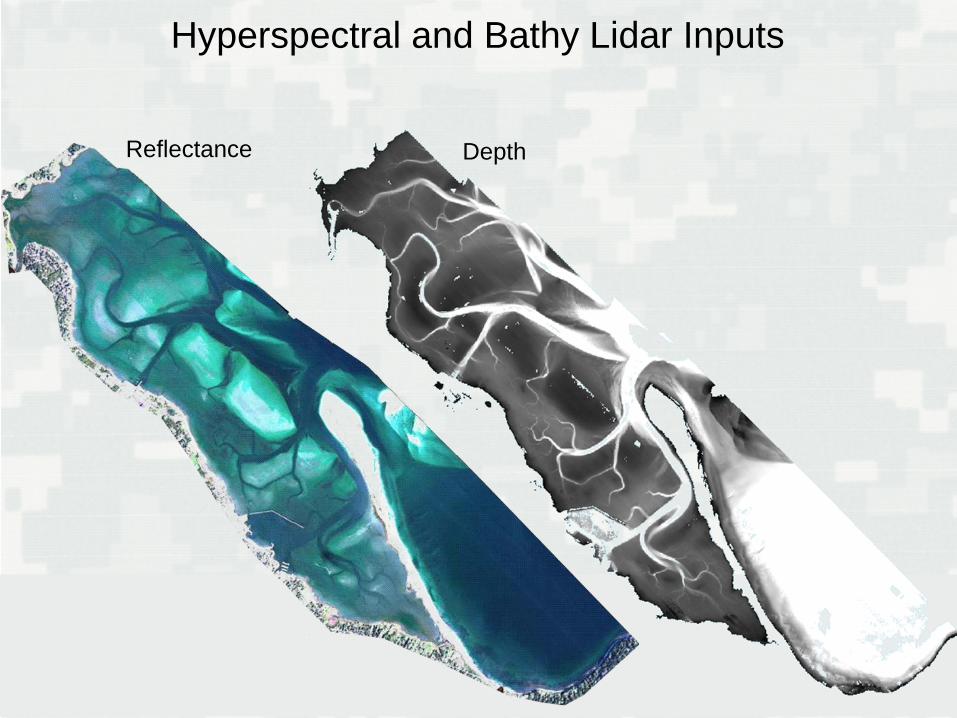
Hyperspectral and Bathy Lidar Inputs
Reflectance Depth
BUILDING STRONG®
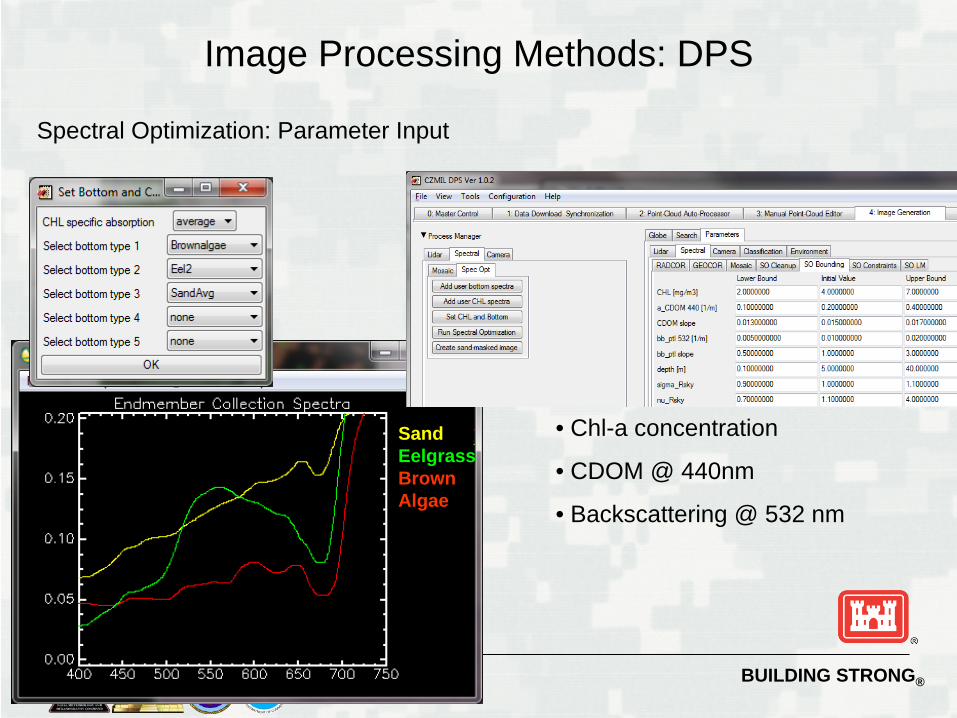
Image Processing Methods: DPS
• Chl-a concentration
• CDOM @ 440nm
• Backscattering @ 532 nm
Spectral Optimization: Parameter Input
Sand Eelgrass Brown Algae
BUILDING STRONG®
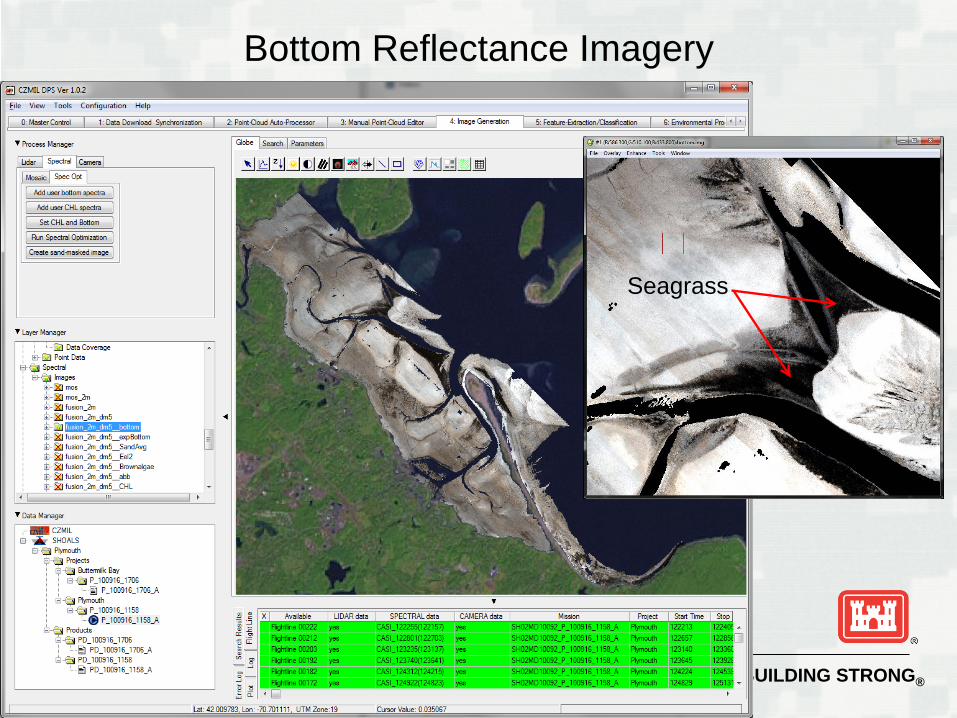
Bottom Reflectance Imagery
Seagrass
BUILDING STRONG®
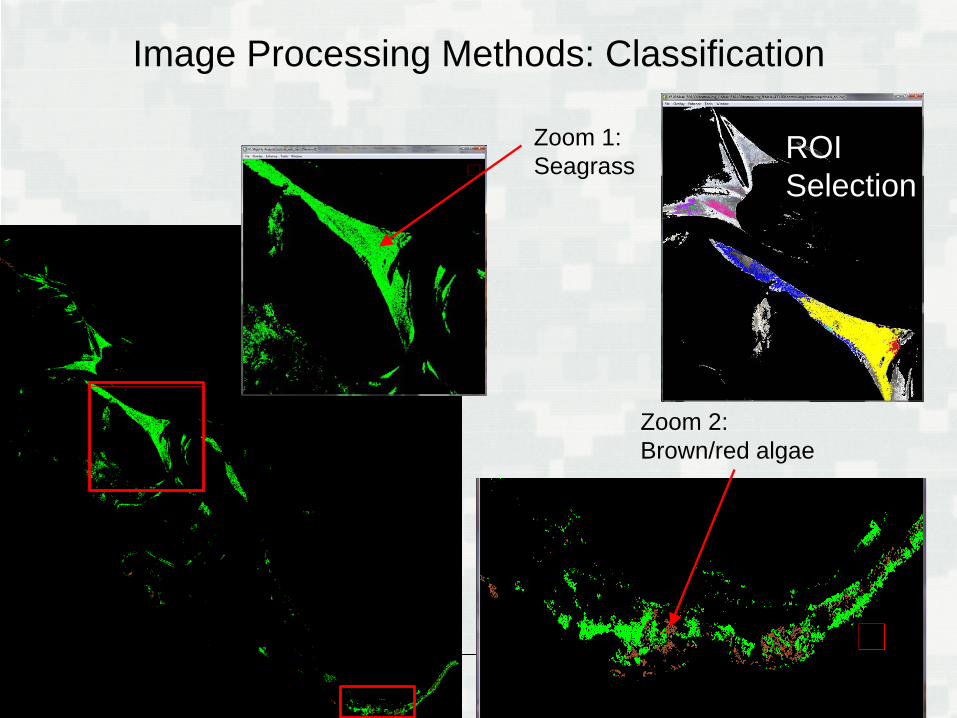
Image Processing Methods: Classification
Zoom 1: Seagrass
Zoom 2: Brown/red algae
ROI Selection
BUILDING STRONG®
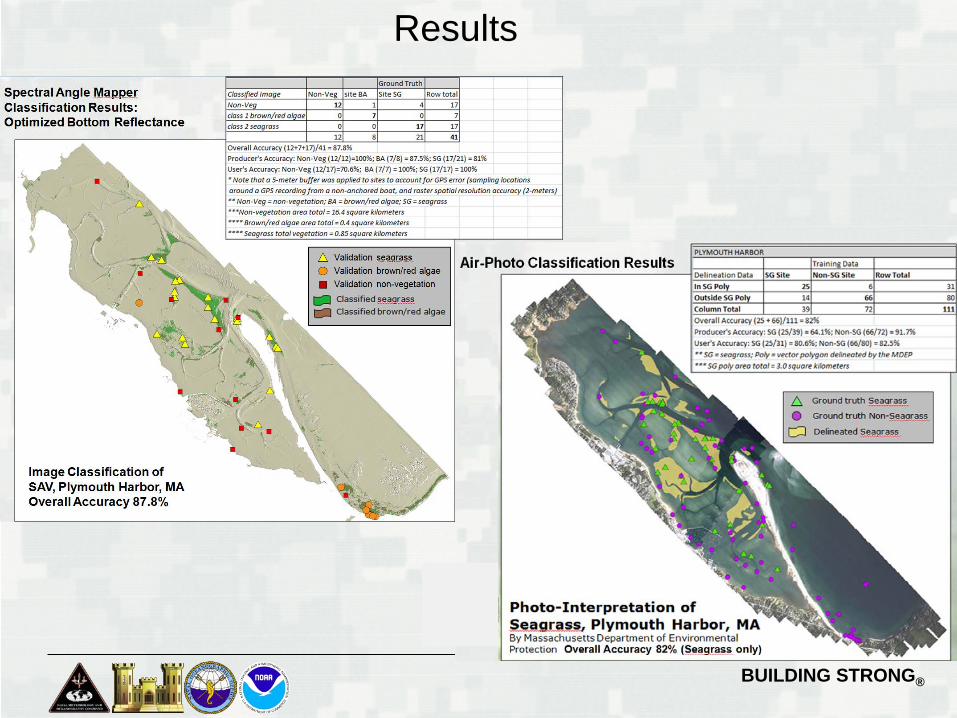
Results
BUILDING STRONG®
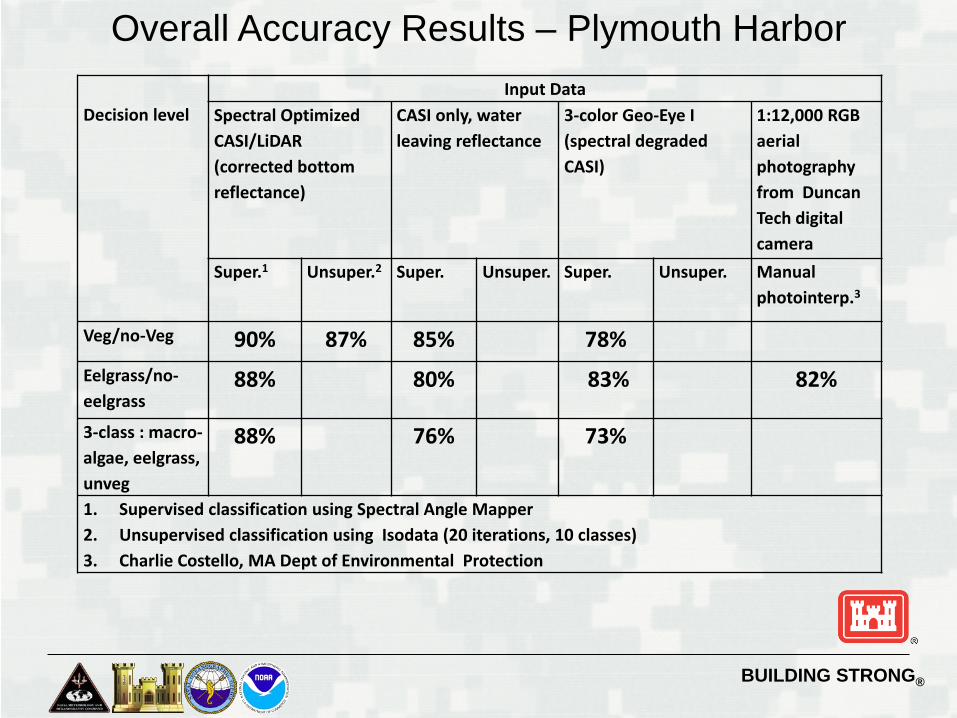
Decision level
Input Data Spectral Optimized CASI/LiDAR (corrected bottom reflectance)
CASI only, water leaving reflectance
3-color Geo-Eye I (spectral degraded CASI)
1:12,000 RGB aerial photography from Duncan Tech digital camera
Super.1 Unsuper.2 Super. Unsuper. Super. Unsuper. Manual photointerp.3
Veg/no-Veg 90% 87% 85% 78% Eelgrass/no-eelgrass
88% 80% 83% 82%
3-class : macro-algae, eelgrass, unveg
88% 76% 73%
1. Supervised classification using Spectral Angle Mapper 2. Unsupervised classification using Isodata (20 iterations, 10 classes) 3. Charlie Costello, MA Dept of Environmental Protection
Overall Accuracy Results – Plymouth Harbor
BUILDING STRONG®
Summary and Benefits
• Benefits:
• More accurately identify SAV presence and type to reduce SAV impacts and potential dredge restrictions
• Model results with SAV type may provide a better understanding of impacts and potential exposure resulting from navigation and dredging
• Detailed SAV in dredge planning for identification of source/disposal sites and alternative scenario comparison
• Determine the level of information needed for dredging operations
planning
• Determine appropriate data requirements for specific SAV mapping tasks
BUILDING STRONG®
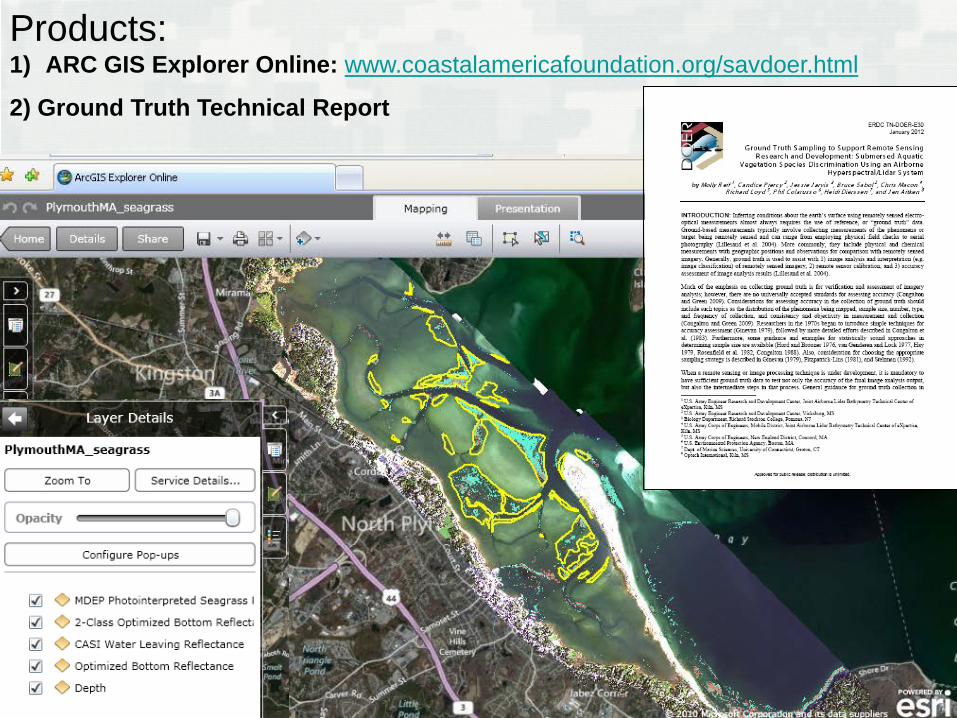
Products: 1) ARC GIS Explorer Online: www.coastalamericafoundation.org/savdoer.html
2) Ground Truth Technical Report
BUILDING STRONG®
Acknowledgements: the team
• NAE: Bill Hubbard, Ben Loyd, Angela Repella, Phoebe Chu
• EPA: Phil Colarusso and dive team • MA DEP: Charlie Costello • U. of Connecticut: Dr. Heidi Dierssen and grad
students • Optech International: Jen Aitken • ERDC: Bruce Sabol, Molly Reif, Candice Piercy,
Jessie Jarvis • JALBTCX: Chris Macon • Coastal Diving Service
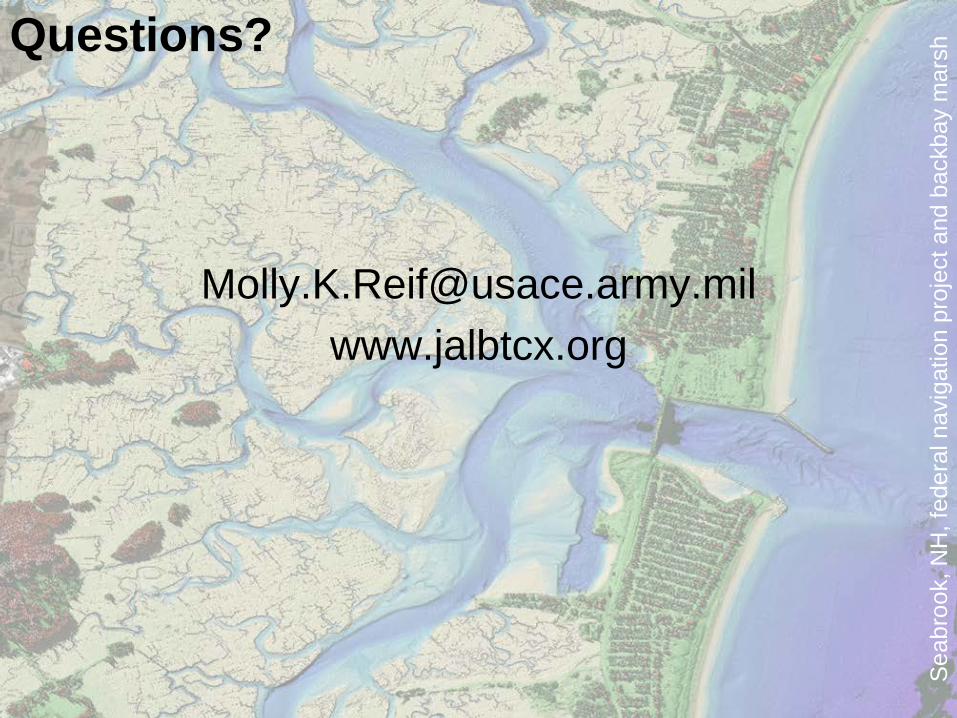
BUILDING STRONG® Sea
broo
k, N
H, f
eder
al n
avig
atio
n pr
ojec
t and
bac
kbay
mar
sh Questions?
[email protected] www.jalbtcx.org