best practice in benchmarking - gov.uk...ipa best practice in benchmarking 5 benchmarking will help...
TRANSCRIPT

Best Practice in Benchmarking

© Crown copyright 2019
Produced by the Infrastructure and Projects Authority.
This publication is licensed under the terms of the Open Government Licence v3.0 except where otherwise stated.
To view this licence, visit nationalarchives.gov.uk/doc/open-government-licence/version/3
Where we have identified any third party copyright information you will need to obtain permission from the copyright holders concerned.
This publication is available at https://www.gov.uk/government/publications
Any enquiries regarding this publication should be sent to us at [email protected]
3
Contents4 Foreword
6 Best practice in benchmarking
8 IPA Benchmarking Methodology - a summary
11 Benchmarking
11 What is benchmarking?12 Why do we need benchmarks?15 Who should benchmark?20 Challenges to benchmarking
21 IPA benchmarking methodology
21 Introduction21 Top-down benchmarking 22 Step 1: Confirm the project objectives and set the metrics26 Step 2: Break the project into major components for benchmarking28 Step 3: Develop templates for data gathering32 Step 4: Scope sources and gather data36 Step 5: Validate and re-base the data40 Step 6: Produce and test the benchmark figure42 Step 7: Review and repeat, if necessary, before using data for benchmarking
44 Summary

IPA Best practice in Benchmarking
4
ForewordPublic capital investment is set to reach levels not sustained in 40 years. Building a strong delivery record, and ensuring value for money for taxpayers and end users, will be crucial to underpin confidence in this high level of investment in our future. We must also ensure that infrastructure projects are driving an increase in UK productivity and improve environmental and social outcomes for citizens.The government has ambitious plans for the UK’s infrastructure over the next decade. We estimate over £600 billion1 of both public and private investment and through the Transforming Infrastructure Performance (TIP)2 programme, the Infrastructure and Projects Authority (IPA) has outlined a long-term plan to ensure we all, across the sector, make the most out of this investment.
A fundamental part of our programme is to develop a firm understanding of project costs and performance. Benchmarking - the process of comparing projected or actual project cost and performance information against information from similar projects - is critical to selecting the right projects at the outset and to set them up for success. Inaccurate estimates can lead to unrealistic expectations, which can ultimately lead to selecting and investing in projects that will fail to deliver the benefits expected, often at the expense of investing in other projects and harming confidence in future investment.
That is why over the past year the IPA has established a dedicated benchmarking team to promote and embed best practices across projects, learning from some of the most significant projects from recent years and those still ongoing. Our next step is to define a more consistent approach to cost and performance benchmarking, with the ambition that all major projects use this to support decisions at each stage of their lifecycle.
We view benchmarking as being useful at three key stages. The first, during policy creation as a way to select the right projects. The second, during more detailed deliverability conversations, providing challenge and a way to build confidence. And thirdly, at the end of a project when we can assess how we performed, share learning and build continuous improvement into the system.
1 ‘National Infrastructure and Construction Pipeline’, Infrastructure and Projects Authority, December 2018.
2 ‘Transforming Infrastructure Performance’, Infrastructure and Projects Authority, December 2017.

IPA Best Practice in Benchmarking
5
Benchmarking will help both government and industry make more informed and transparent decisions about the future of our infrastructure. It provides the evidence and analysis needed for government to make important decisions with greater confidence, ensure value for money for taxpayers and avoid excess costs and missed benefits. Our proposed approach is aligned to the Department for Transport’s Transport Infrastructure Efficiency Strategy (TIES).
Going forward, we will drive the application of cost and performance benchmarking on all major infrastructure projects. Open collaboration and data sharing between organisations will be vital in order to make this happen. But we want to see a step change in the quality of benchmarking being applied, and to make the approach much more consistent across projects which are initiated in the public sector.
Matthew VickerstaffInterim Chief Executive, Infrastructure and Projects Authority
IPA Best practice in Benchmarking
6
Best practice in benchmarkingThe Infrastructure and Projects Authority (IPA) is the government’s centre of expertise for infrastructure and major project delivery. The IPA supports the successful delivery and continuous improvement of all types of infrastructure, working with government and industry to ensure projects are delivered efficiently and effectively.In December 2017, the IPA set out an ambitious plan for transforming infrastructure and the construction sector over the long term through its Transforming Infrastructure Performance (TIP) programme. As part of TIP, the IPA established a team to support benchmarking initiatives. The team aims to establish and help embed a consistent approach to benchmarking across major infrastructure projects and programmes through the project lifecycle.
Benchmarking for infrastructure projects involves using data from other projects to better inform project development and decision making. Too often, inaccurate estimates on capital and lifecycle cost and expected benefits can lead to unrealistic expectations and a failure to deliver desired outcomes.
Consistent, effective benchmarking should help underpin government and industry decisions on project selection and delivery. It can play an important role across the project lifecycle but is most needed at the start of the process, where wrong or ill-informed choices can derail a project’s chance of success. There is unavoidable uncertainty (on cost, schedule and expected outcomes) at this early stage, where project scope is still being defined and multiple options being considered. Benchmarking will help to provide an additional level of informed challenge and assurance during this critical phase, leveraging data and experience from previous projects.
This document outlines the IPA’s recommended methodology for cost and performance benchmarking. It introduces the concept and includes a step-by-step guide to undertaking, or commissioning, a benchmarking exercise. It sets out why sponsors and delivery bodies, such as HM Government departments and relevant Arm’s-Length Bodies (ALBs), as well as consultants and suppliers, could benefit from using benchmarking to improve project performance.
“Benchmarking has the potential to drive performance in infrastructure delivery by providing both project sponsors and delivery bodies with strong evidence on which to base their targets and ambitions.
Bernadette KellyPermanent Secretary, Department for Transport

IPA Best Practice in Benchmarking
7
The proposed methodology has been formulated in collaboration with a range of partners across government and industry. It builds on previous publications, including ‘Government Construction: Cost Benchmarking Principles and Expectations’3 and the ‘Infrastructure Cost Review’.4 It is also in step with the Department for Transport (DfT) Transport Infrastructure Efficiency Strategy (TIES).5 TIES outlines a strategy to address seven challenges to improve transport infrastructure efficiency and provide better outcomes for transport users. Improved benchmarking is a key part of the strategy to improve cost confidence and assurance.
For many large and complex projects, a benchmarking methodology can act as a valuable tool to build understanding and confidence in expected project outcomes from the start. At the project initiation stage, benchmarking is essential to ensure government selects the right projects.
The guidance intends to promote a step change in the quality and consistency of benchmarking approaches in projects initiated by government and to learn from and influence best practice in industry. It is primarily aimed at project sponsors, clients, Senior Responsible Owners (SROs) and project delivery bodies, all of whom will benefit from a shared understanding of best practice in benchmarking.
The IPA supports the development and application of benchmarking by facilitating the consistent collection, collation and sharing of comparable data across infrastructure delivery organisations. Our aim is to build mutual understanding of, and confidence in, the data which underpins successful benchmarking. For example, the IPA worked with the British Tunnelling Society (BTS), ALBs and private infrastructure organisations to share data to produce an accepted benchmark for tunnelling cost and production rates.6 The IPA has shared experiences from this process internationally including through the G20’s Global Infrastructure Hub and the OECD.
The IPA will continue to provide support and advice on benchmarking, as well as the gathering and sharing of benchmarking information. Where focused on transport, the TIES taskforce will look to define the format of the information, and data used in benchmarking exercises, with the aim of facilitating collaboration between organisations. IPA and TIES plan to work with industry to establish a set of metrics which can be applied as cross-sector benchmarks to assess performance. Once established, the IPA will recommend that project sponsors, delivery bodies and their consultants use those metrics as part of our proposed approach to benchmarking.
“As we look to invest billions in the country’s infrastructure, we need to ensure we get the most for our money and that communities see the real benefits of what we deliver. By embedding this guidance, the UK can have confidence in its decision making and its ability to finance and deliver innovative, world leading, well designed projects for long into the future.
Sir John ArmittChair, National Infrastructure Commission
3 ‘Government Construction: Cost Benchmarking Principles and Expectations’, Cabinet Office, 10 February 2012.
4 ‘Infrastructure Cost Review’, HM Treasury, 21 December 2010.5 ‘Transforming Infrastructure Efficiency Strategy’, Department for Transport, December 2017.6 ‘Case Study: UK Tunnelling Benchmarking Forum’, Infrastructure and Projects Authority,
6 December 2018.
IPA Best practice in Benchmarking
8
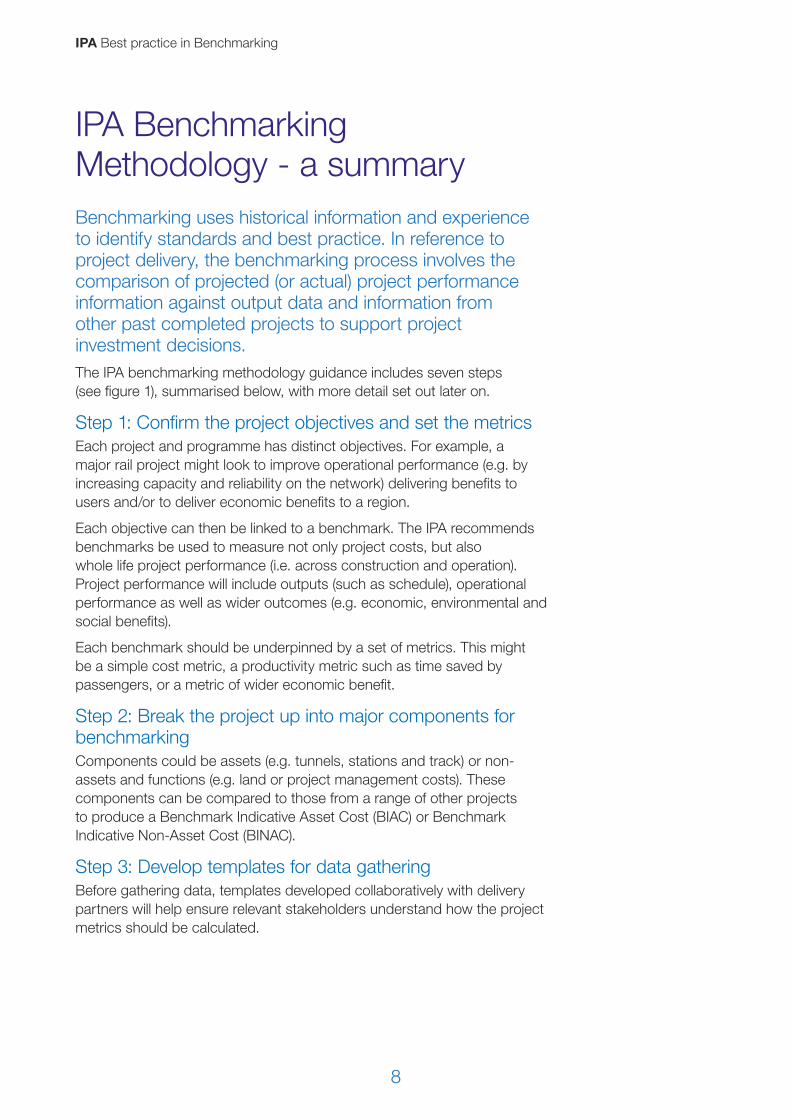
IPA Benchmarking Methodology - a summary Benchmarking uses historical information and experience to identify standards and best practice. In reference to project delivery, the benchmarking process involves the comparison of projected (or actual) project performance information against output data and information from other past completed projects to support project investment decisions.The IPA benchmarking methodology guidance includes seven steps (see figure 1), summarised below, with more detail set out later on.
Step 1: Confirm the project objectives and set the metricsEach project and programme has distinct objectives. For example, a major rail project might look to improve operational performance (e.g. by increasing capacity and reliability on the network) delivering benefits to users and/or to deliver economic benefits to a region.
Each objective can then be linked to a benchmark. The IPA recommends benchmarks be used to measure not only project costs, but also whole life project performance (i.e. across construction and operation). Project performance will include outputs (such as schedule), operational performance as well as wider outcomes (e.g. economic, environmental and social benefits).
Each benchmark should be underpinned by a set of metrics. This might be a simple cost metric, a productivity metric such as time saved by passengers, or a metric of wider economic benefit.
Step 2: Break the project up into major components for benchmarkingComponents could be assets (e.g. tunnels, stations and track) or non-assets and functions (e.g. land or project management costs). These components can be compared to those from a range of other projects to produce a Benchmark Indicative Asset Cost (BIAC) or Benchmark Indicative Non-Asset Cost (BINAC).
Step 3: Develop templates for data gatheringBefore gathering data, templates developed collaboratively with delivery partners will help ensure relevant stakeholders understand how the project metrics should be calculated.
IPA Best Practice in Benchmarking
9
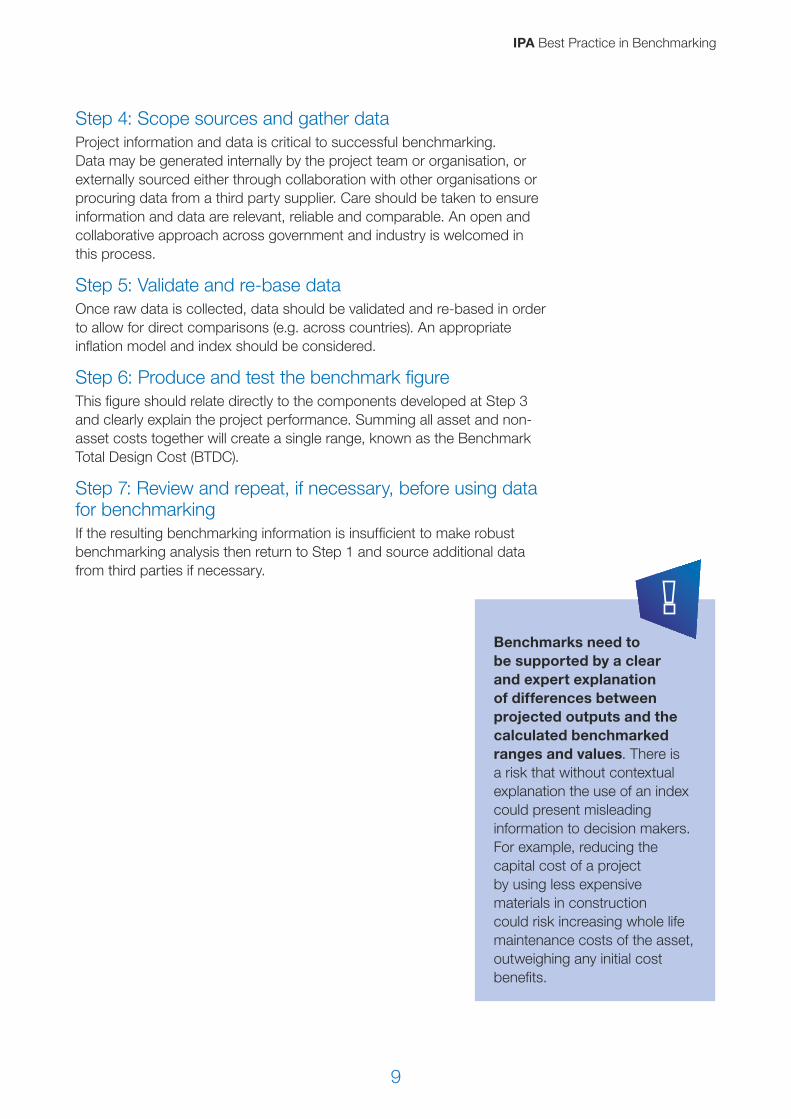
Step 4: Scope sources and gather dataProject information and data is critical to successful benchmarking. Data may be generated internally by the project team or organisation, or externally sourced either through collaboration with other organisations or procuring data from a third party supplier. Care should be taken to ensure information and data are relevant, reliable and comparable. An open and collaborative approach across government and industry is welcomed in this process.
Step 5: Validate and re-base dataOnce raw data is collected, data should be validated and re-based in order to allow for direct comparisons (e.g. across countries). An appropriate inflation model and index should be considered.
Step 6: Produce and test the benchmark figureThis figure should relate directly to the components developed at Step 3 and clearly explain the project performance. Summing all asset and non-asset costs together will create a single range, known as the Benchmark Total Design Cost (BTDC).
Step 7: Review and repeat, if necessary, before using data for benchmarkingIf the resulting benchmarking information is insufficient to make robust benchmarking analysis then return to Step 1 and source additional data from third parties if necessary.
Benchmarks need to be supported by a clear and expert explanation of differences between projected outputs and the calculated benchmarked ranges and values. There is a risk that without contextual explanation the use of an index could present misleading information to decision makers. For example, reducing the capital cost of a project by using less expensive materials in construction could risk increasing whole life maintenance costs of the asset, outweighing any initial cost benefits.
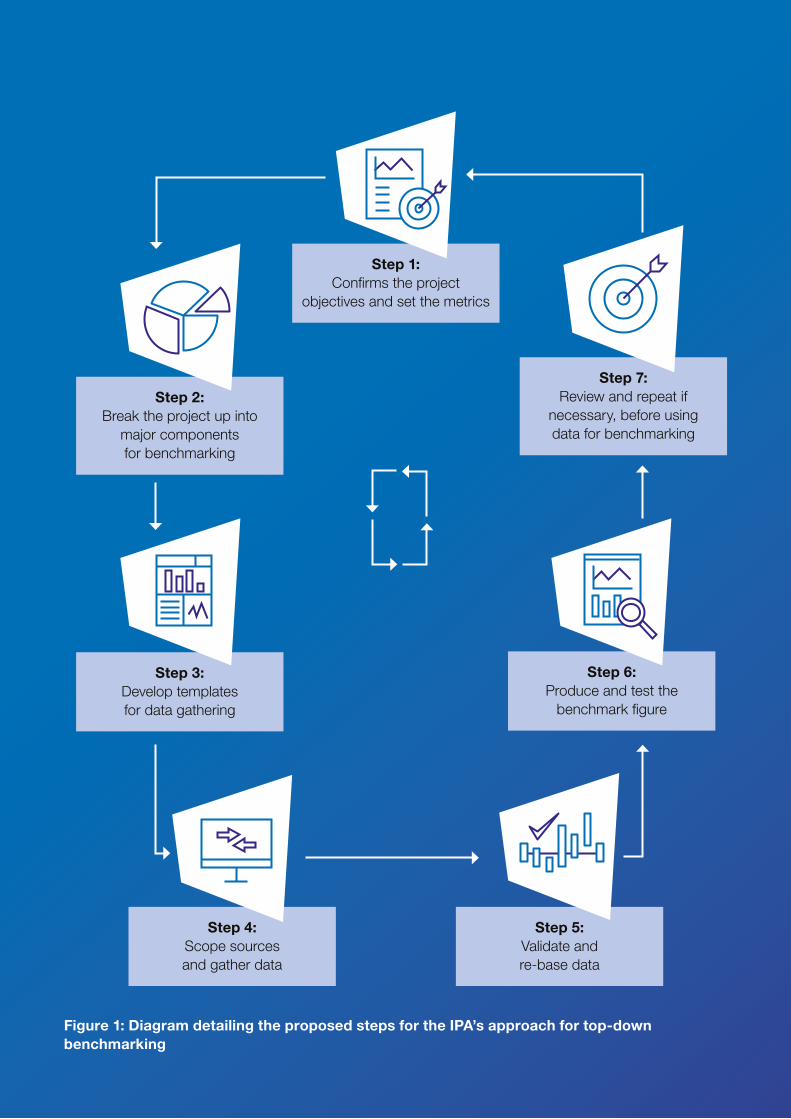
Figure 1: Diagram detailing the proposed steps for the IPA’s approach for top-down benchmarking
Step 1: Confirms the project
objectives and set the metrics
Step 2: Break the project up into
major components for benchmarking
Step 3: Develop templates for data gathering
Step 4: Scope sources and gather data
Step 5: Validate and re-base data
Step 6: Produce and test the
benchmark figure
Step 7: Review and repeat if
necessary, before using data for benchmarking
IPA Best Practice in Benchmarking
11
BenchmarkingWhat is benchmarking?Benchmarking uses historical information to identify standards and best practice. In reference to project delivery, the process involves comparing projected, or actual, project performance information against similar information from past projects with the aim of improving assurance and delivery.
The benchmarking process will analyse information from past projects and programmes to create a point of reference to compare observed or predicted details of a particular project. Given no two projects are the same, project managers and subject matter experts should be involved to help explain any differences, especially when the number of comparable projects is low.
There are two types of benchmarking activities that project teams and organisations can undertake: top-down and bottom-up. Both of these methods have their own advantages and disadvantages and should be used appropriately to suit the requirement.
Higher-level (top-down) benchmarks start with an estimated complete, or total, figure for a project or programme, which is then broken down into smaller pieces. A top-down approach is therefore better suited to strategic decision making which looks to consider the overall benefit of a project. This is different to Reference Class Forecasting.7
Lower-level (bottom-up) benchmarks are developed using information which references units or aspects of a project. For example the costs of labour, plant and materials are bottom up benchmarks, which can be added together to produce an overall cost. While this information is often more readily available and understood by industry, an existing design is needed to provide cost estimates. It is therefore difficult for bottom-up benchmarks to support early decisions on quality and affordability, for example, which are based on hypothetical or proposed schemes.
To illustrate: a simple low-level (bottom-up) benchmark might show the average hours of an operator’s time taken to find and fix each leaking water pipe, while a high-level (top-down) benchmark might show the overall water loss from leakage per household served and the cost per household of repair work.
Different organisations and industries will have varying views about which types of benchmark should be used, with other types being more appropriate at certain stages of a project. Bottom-up benchmarks may be less appropriate for use in the early decision-making stages of project delivery, although the two processes can complement each other at later stages.
7 Reference Class Forecasting takes a project/programme “entirety” approach to challenging forecasts by looking at the performance of past projects or programmes of a similar type. Mapping the probability distribution of these actual results allows a quantified view of the risk of poor performance associated with a new project. The approach encourages risks to be managed at a portfolio level.
IPA Best practice in Benchmarking
12
Why do we need benchmarks?A firm understanding of cost and performance is critical to good decision making and successful project delivery. Inaccurate estimates can lead to unrealistic expectations which can derail a project’s chances of success.
Benchmarking helps both government and industry make informed decisions about our infrastructure, particularly around capital investment and delivery efficiencies. It uses previous experience and industry best practice to provide the evidence and analysis needed to make decisions on project performance progress with greater confidence, and help avoid increased costs and missed benefits.
A consistent approach to benchmarking allows for greater transparency in decision making. Properly applied, benchmarking supports better project governance and assurance, more robust design, planning, selection, investment and budgeting decisions as well as continuous improvement in delivery. A benchmarking approach which looks beyond initial costs alone to overall performance will support decision making that considers infrastructure assets at a whole life basis.
By supporting benchmarking, the IPA has two goals:1. To deliver better performance. This covers the use of cost, schedule
and performance benchmarks to support the selection, budgeting and design of projects for government sponsored infrastructure projects. This will in turn support increased productivity and better environmental and social outcomes.
2. To foster greater collaboration when it comes to sharing and understanding data from projects. This aligns with the National Infrastructure Commission’s recommendations as set out in ‘Data for the Public Good’.8
8 ‘Data for the Public Good’, National Infrastructure Commission, 14 December 2017
IPA Best Practice in Benchmarking
13
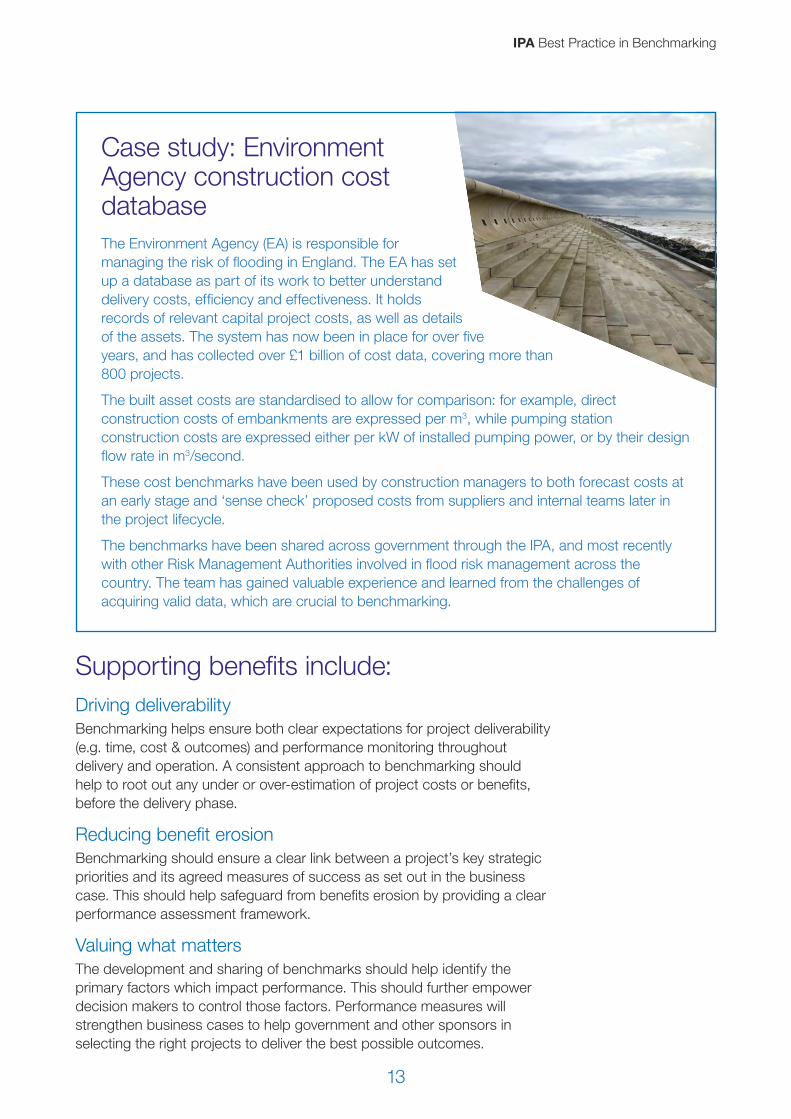
Case study: Environment Agency construction cost databaseThe Environment Agency (EA) is responsible for managing the risk of flooding in England. The EA has set up a database as part of its work to better understand delivery costs, efficiency and effectiveness. It holds records of relevant capital project costs, as well as details of the assets. The system has now been in place for over five years, and has collected over £1 billion of cost data, covering more than 800 projects.
The built asset costs are standardised to allow for comparison: for example, direct construction costs of embankments are expressed per m3, while pumping station construction costs are expressed either per kW of installed pumping power, or by their design flow rate in m3/second.
These cost benchmarks have been used by construction managers to both forecast costs at an early stage and ‘sense check’ proposed costs from suppliers and internal teams later in the project lifecycle.
The benchmarks have been shared across government through the IPA, and most recently with other Risk Management Authorities involved in flood risk management across the country. The team has gained valuable experience and learned from the challenges of acquiring valid data, which are crucial to benchmarking.
Supporting benefits include:Driving deliverabilityBenchmarking helps ensure both clear expectations for project deliverability (e.g. time, cost & outcomes) and performance monitoring throughout delivery and operation. A consistent approach to benchmarking should help to root out any under or over-estimation of project costs or benefits, before the delivery phase.
Reducing benefit erosionBenchmarking should ensure a clear link between a project’s key strategic priorities and its agreed measures of success as set out in the business case. This should help safeguard from benefits erosion by providing a clear performance assessment framework.
Valuing what mattersThe development and sharing of benchmarks should help identify the primary factors which impact performance. This should further empower decision makers to control those factors. Performance measures will strengthen business cases to help government and other sponsors in selecting the right projects to deliver the best possible outcomes.
IPA Best practice in Benchmarking
14
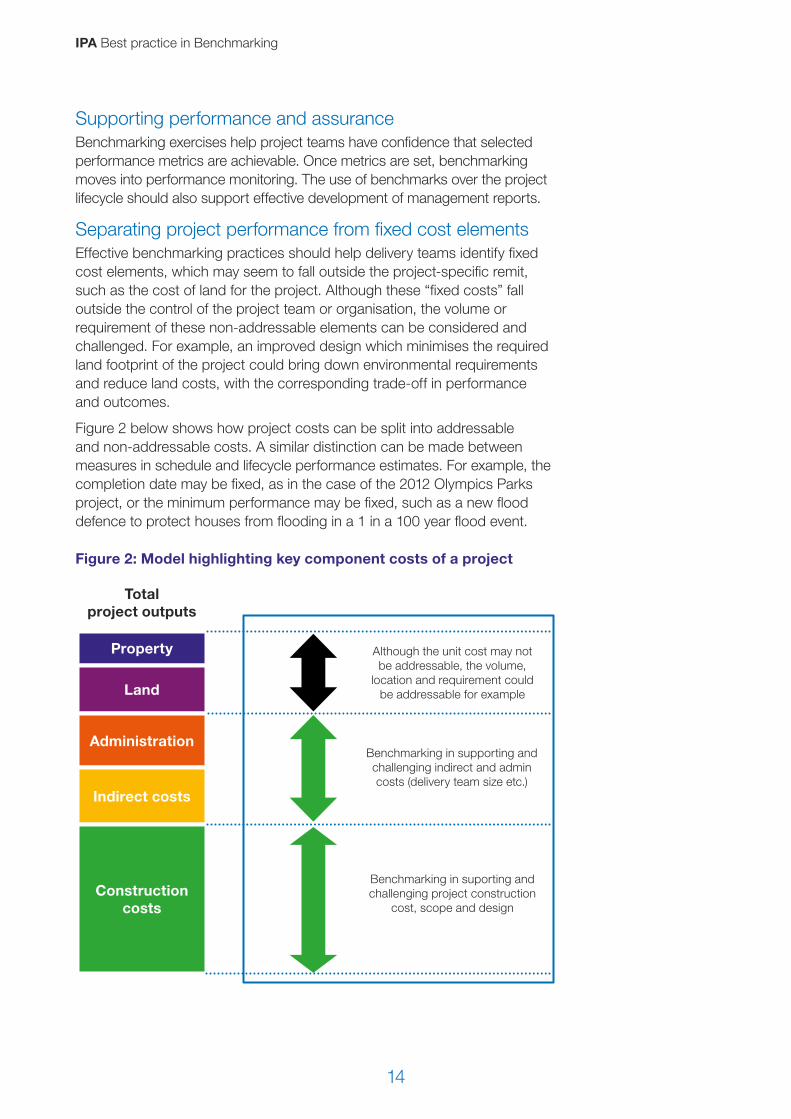
Supporting performance and assuranceBenchmarking exercises help project teams have confidence that selected performance metrics are achievable. Once metrics are set, benchmarking moves into performance monitoring. The use of benchmarks over the project lifecycle should also support effective development of management reports.
Separating project performance from fixed cost elementsEffective benchmarking practices should help delivery teams identify fixed cost elements, which may seem to fall outside the project-specific remit, such as the cost of land for the project. Although these “fixed costs” fall outside the control of the project team or organisation, the volume or requirement of these non-addressable elements can be considered and challenged. For example, an improved design which minimises the required land footprint of the project could bring down environmental requirements and reduce land costs, with the corresponding trade-off in performance and outcomes.
Figure 2 below shows how project costs can be split into addressable and non-addressable costs. A similar distinction can be made between measures in schedule and lifecycle performance estimates. For example, the completion date may be fixed, as in the case of the 2012 Olympics Parks project, or the minimum performance may be fixed, such as a new flood defence to protect houses from flooding in a 1 in a 100 year flood event.
Figure 2: Model highlighting key component costs of a project
Total project outputs
Property Although the unit cost may not be addressable, the volume,
location and requirement could be addressable for exampleLand
Administration
Indirect costs
Benchmarking in supporting and challenging indirect and admin costs (delivery team size etc.)
Construction costs
Benchmarking in suporting and challenging project construction
cost, scope and design
IPA Best Practice in Benchmarking
15
Who should benchmark?This methodology is a recommended approach to benchmarking for the attention of decision makers, project sponsors and delivery teams across the private and public sector, along with third party providers who provide benchmarking services for delivery organisations. The IPA will work to promote this methodology across government.
In 2019, the IPA will look to develop a benchmarking maturity tool. The maturity tool will allow infrastructure organisations to identify and score their benchmarking capability and maturity using an IPA developed framework.
When to benchmark?
Supporting business cases with benchmarkingTop-down benchmarking during the early development of a business case is crucial in enabling SROs and project teams to understand the cost, schedule, performance and outcomes at the outset of the project initiation stage. Providing robust evidence and confidence about project deliverables allows government and industry to select the best projects and programmes to deliver the best outcomes.
The application of effective benchmarking practices should support and underpin a project or programme’s business case and drive for efficiencies, by:
• Bringing additional focus on good design and planning to the decision-making process, with enhanced understanding of cost implications when making decisions.
• Demonstrating that the proposed project sits within agreed ranges (cost, benefits, outputs) for similar completed projects.
“The benchmarking study shows how collaboration in the transport sector can help projects such as the Lower Thames Crossing make better strategic choices and find efficiency in delivery.
Tim JonesCEO, Lower Thames Crossing
IPA Best practice in Benchmarking
16
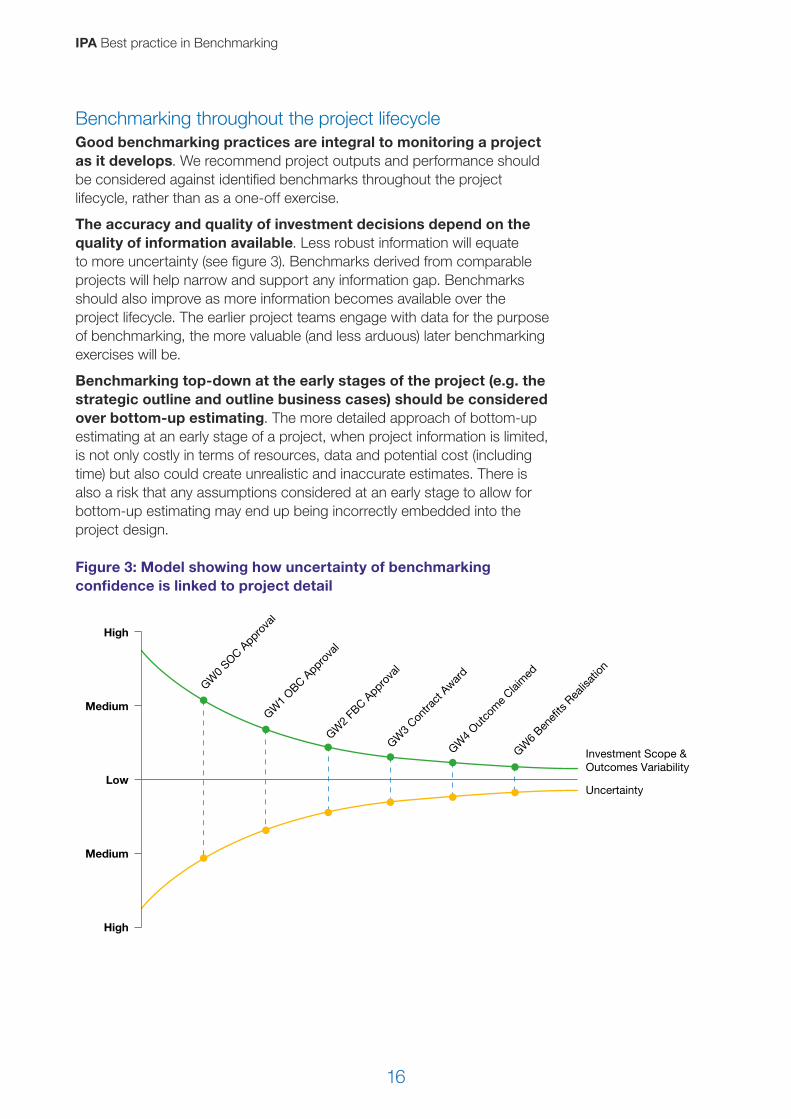
Benchmarking throughout the project lifecycleGood benchmarking practices are integral to monitoring a project as it develops. We recommend project outputs and performance should be considered against identified benchmarks throughout the project lifecycle, rather than as a one-off exercise.
The accuracy and quality of investment decisions depend on the quality of information available. Less robust information will equate to more uncertainty (see figure 3). Benchmarks derived from comparable projects will help narrow and support any information gap. Benchmarks should also improve as more information becomes available over the project lifecycle. The earlier project teams engage with data for the purpose of benchmarking, the more valuable (and less arduous) later benchmarking exercises will be.
Benchmarking top-down at the early stages of the project (e.g. the strategic outline and outline business cases) should be considered over bottom-up estimating. The more detailed approach of bottom-up estimating at an early stage of a project, when project information is limited, is not only costly in terms of resources, data and potential cost (including time) but also could create unrealistic and inaccurate estimates. There is also a risk that any assumptions considered at an early stage to allow for bottom-up estimating may end up being incorrectly embedded into the project design.
Figure 3: Model showing how uncertainty of benchmarking confidence is linked to project detail
GW0
SOC Appro
val
Low
Medium
Medium
Uncertainty
Investment Scope &Outcomes Variability
High
High
GW1
OBC Appro
val
GW2
FBC A
pprova
l
GW3
Contra
ct A
ward
GW4
Outco
me C
laim
ed
GW6
Benefi
ts Rea
lisat
ion
Figure 3: Model showing investment and uncertainity benchmarking across project lifecycle
IPA Best Practice in Benchmarking
17
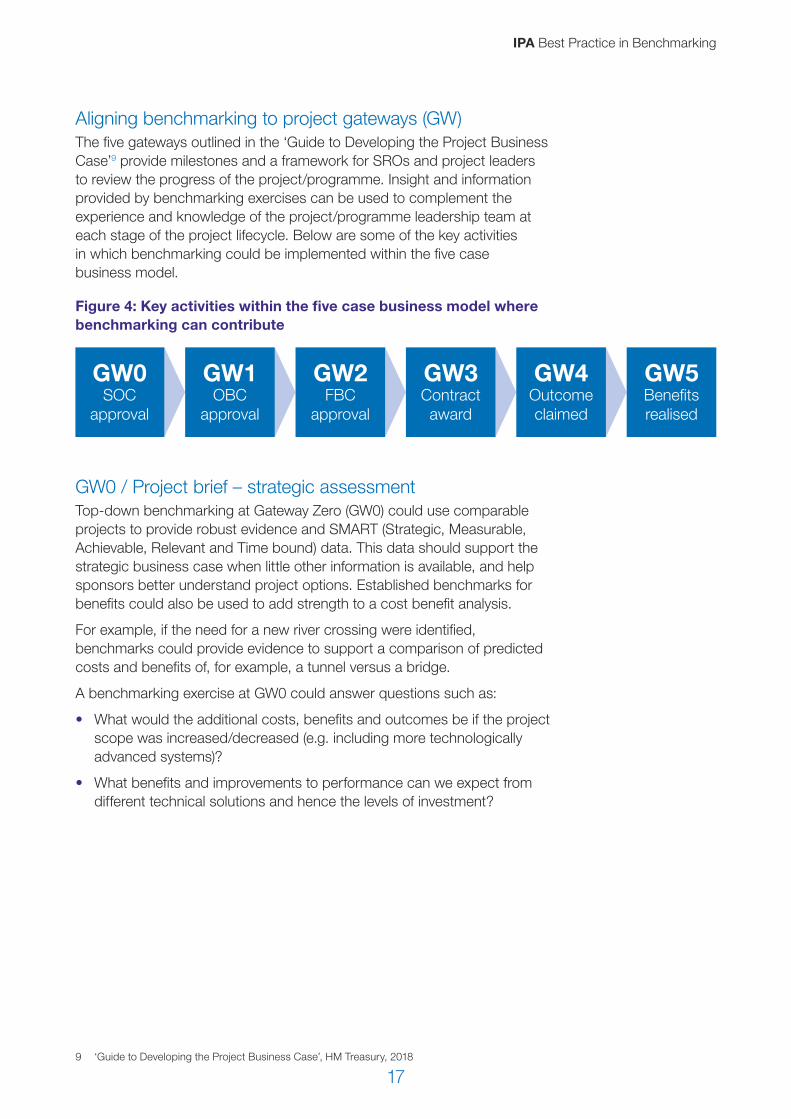
Aligning benchmarking to project gateways (GW)The five gateways outlined in the ‘Guide to Developing the Project Business Case’9 provide milestones and a framework for SROs and project leaders to review the progress of the project/programme. Insight and information provided by benchmarking exercises can be used to complement the experience and knowledge of the project/programme leadership team at each stage of the project lifecycle. Below are some of the key activities in which benchmarking could be implemented within the five case business model.
Figure 4: Key activities within the five case business model where benchmarking can contribute
GW5Benefitsrealised
GW0SOC
approval
GW1OBC
approval
GW4Outcomeclaimed
GW2FBC
approval
GW3Contractaward
GW0 / Project brief – strategic assessmentTop-down benchmarking at Gateway Zero (GW0) could use comparable projects to provide robust evidence and SMART (Strategic, Measurable, Achievable, Relevant and Time bound) data. This data should support the strategic business case when little other information is available, and help sponsors better understand project options. Established benchmarks for benefits could also be used to add strength to a cost benefit analysis.
For example, if the need for a new river crossing were identified, benchmarks could provide evidence to support a comparison of predicted costs and benefits of, for example, a tunnel versus a bridge.
A benchmarking exercise at GW0 could answer questions such as:
• What would the additional costs, benefits and outcomes be if the project scope was increased/decreased (e.g. including more technologically advanced systems)?
• What benefits and improvements to performance can we expect from different technical solutions and hence the levels of investment?
9 ‘Guide to Developing the Project Business Case’, HM Treasury, 2018
IPA Best practice in Benchmarking
18
GW1 / Strategic outline case – business justificationAt Gateway 1 (GW1) benchmarking could be used to analyse the ‘preferred option’ and client requirements, and in turn provide assurances the project is deliverable within the funding envelope or not.
A benchmarking exercise at this stage could measure the variability and differences between options raised and determine whether the preferred option delivers optimal value for money and remains in line with the objectives of the project/programme. For example, benchmarking at this stage will highlight whether value engineering or innovative techniques have the potential to yield benefits.
Any benchmarking activities undertaken at this stage, in terms of data and information capture, should prove valuable in the later stages of the project.
A benchmarking exercise at GW1 could support questions such as:
• What are the additional costs, benefits and outcomes in having a smart motorway opposed to a traditional motorway?
• What are the additional costs and benefits if we wanted to raise the protection level of the flood embankment from a ‘1 in 50 years’ to a ‘1 in 100 years’ event?
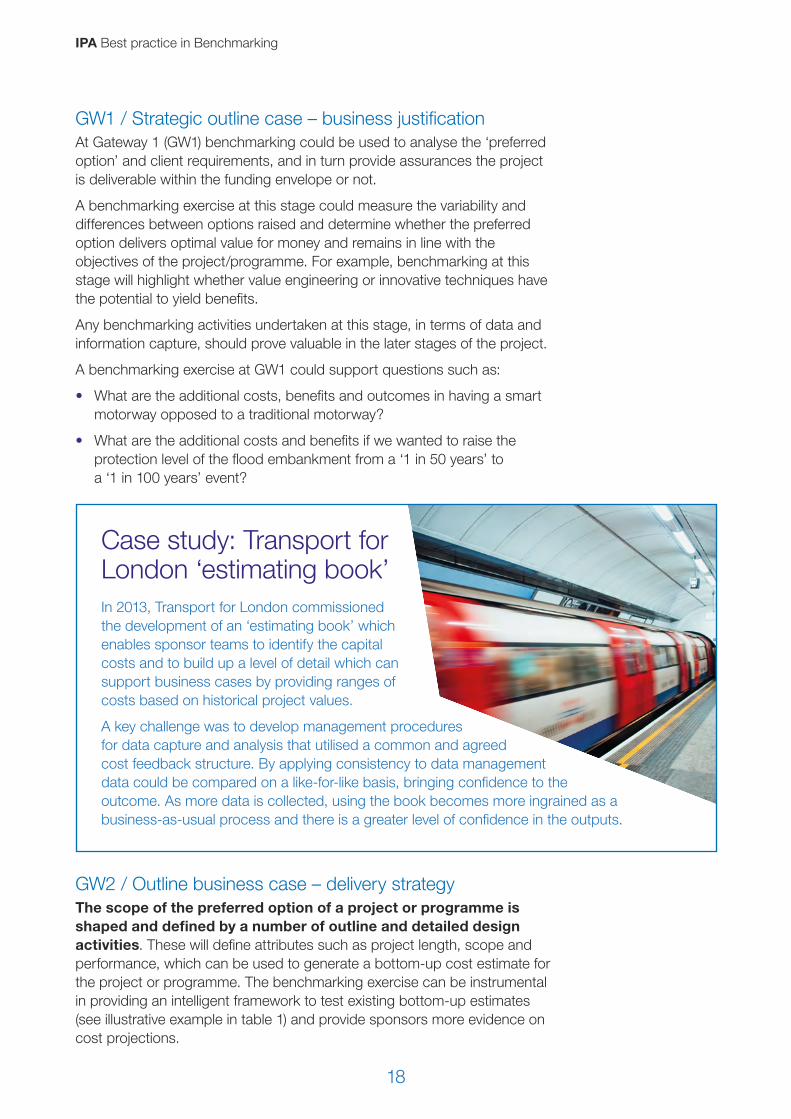
Case study: Transport for London ‘estimating book’In 2013, Transport for London commissioned the development of an ‘estimating book’ which enables sponsor teams to identify the capital costs and to build up a level of detail which can support business cases by providing ranges of costs based on historical project values.
A key challenge was to develop management procedures for data capture and analysis that utilised a common and agreed cost feedback structure. By applying consistency to data management data could be compared on a like-for-like basis, bringing confidence to the outcome. As more data is collected, using the book becomes more ingrained as a business-as-usual process and there is a greater level of confidence in the outputs.
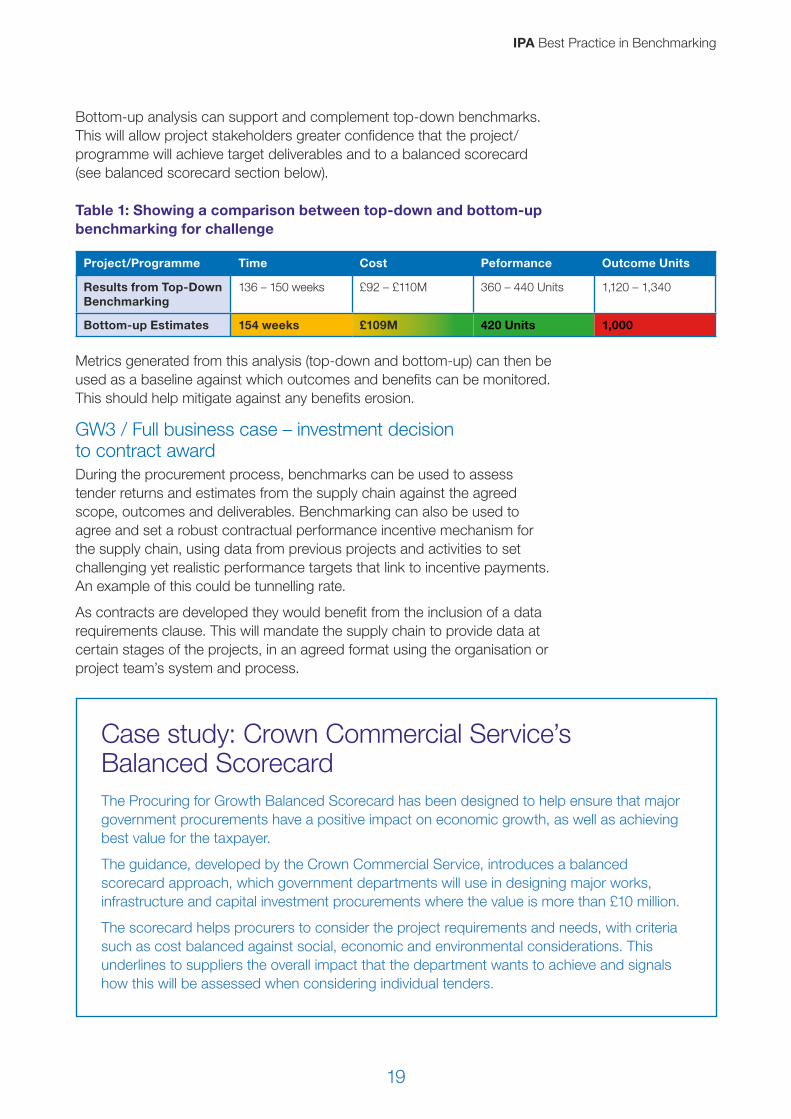
GW2 / Outline business case – delivery strategyThe scope of the preferred option of a project or programme is shaped and defined by a number of outline and detailed design activities. These will define attributes such as project length, scope and performance, which can be used to generate a bottom-up cost estimate for the project or programme. The benchmarking exercise can be instrumental in providing an intelligent framework to test existing bottom-up estimates (see illustrative example in table 1) and provide sponsors more evidence on cost projections.
IPA Best Practice in Benchmarking
19
Bottom-up analysis can support and complement top-down benchmarks. This will allow project stakeholders greater confidence that the project/programme will achieve target deliverables and to a balanced scorecard (see balanced scorecard section below).
Table 1: Showing a comparison between top-down and bottom-up benchmarking for challenge
Project/Programme Time Cost Peformance Outcome Units
Results from Top-Down Benchmarking
136 – 150 weeks £92 – £110M 360 – 440 Units 1,120 – 1,340
Bottom-up Estimates 154 weeks £109M 420 Units 1,000
Metrics generated from this analysis (top-down and bottom-up) can then be used as a baseline against which outcomes and benefits can be monitored. This should help mitigate against any benefits erosion.
GW3 / Full business case – investment decision to contract award During the procurement process, benchmarks can be used to assess tender returns and estimates from the supply chain against the agreed scope, outcomes and deliverables. Benchmarking can also be used to agree and set a robust contractual performance incentive mechanism for the supply chain, using data from previous projects and activities to set challenging yet realistic performance targets that link to incentive payments. An example of this could be tunnelling rate.
As contracts are developed they would benefit from the inclusion of a data requirements clause. This will mandate the supply chain to provide data at certain stages of the projects, in an agreed format using the organisation or project team’s system and process.
Case study: Crown Commercial Service’s Balanced ScorecardThe Procuring for Growth Balanced Scorecard has been designed to help ensure that major government procurements have a positive impact on economic growth, as well as achieving best value for the taxpayer.
The guidance, developed by the Crown Commercial Service, introduces a balanced scorecard approach, which government departments will use in designing major works, infrastructure and capital investment procurements where the value is more than £10 million.
The scorecard helps procurers to consider the project requirements and needs, with criteria such as cost balanced against social, economic and environmental considerations. This underlines to suppliers the overall impact that the department wants to achieve and signals how this will be assessed when considering individual tenders.
IPA Best practice in Benchmarking
20
GW4 / Readiness for service and GW5 / Benefits realisationAt this stage, although the project and programme is complete, there is still an opportunity to make use of the balanced scorecard and established benchmarks. These can be used to demonstrate project performance against the business case and will also provide valuable data and lessons learned for future projects.
It is important to capture and store all data generated by the project and programme to improve existing and future benchmarking models. This data can be used to benchmark future projects.
Challenges to benchmarkingBenchmarking exercises also present challenges. The most critical challenges lie in the sourcing, validation and management of robust and complete data.Data is a valuable asset, but the IPA has demonstrated through the tunnelling case study that there is appetite for the development of more open access to data. Effective information sharing across sectors, and internationally, has great potential to ensure that lessons from benchmarking exercises are maximised. We recognise that cross-sector and cross-border information sharing presents challenges such as commercial sensitivities. The IPA has demonstrated that this can be mitigated and reduced (see tunnelling case study) by establishing forums with clear terms of references and Non-Disclosure Agreements (NDAs) in place.
Benchmarking requires time and resources for data collection and validation. While this may present a new challenge to project stakeholders in first instance, the benefits in supporting informed and intelligent decision making should outweigh the costs in developing your benchmarking service offering.
IPA Best Practice in Benchmarking
21
IPA benchmarking methodologyIntroductionWith the development of a consistent methodological approach to benchmarking, our aim is to support greater transparency and collaboration between project managers, sponsors and sector experts across government and industry. It will also allow teams to have a shared approach to benchmarking, which project teams can build on. The IPA has worked extensively with UK Government Departments, infrastructure delivery organisations and consultancies in developing and testing a top-down benchmarking methodology. We have demonstrated, through the tunnelling case study, that the methodology allows organisations to compare like for like assets across and within sector.
Top-down benchmarking Infrastructure projects are complex, often bespoke and rarely repeated. While it is difficult to benchmark a project in its entirety using a top-down approach and a universally accepted single metric, it is possible to do this once the project is broken up into components. Breaking down a large infrastructure project into components also helps ensure costs are not double counted.
The IPA recommends a top-down approach to benchmarking, initially establishing a range of performance metrics to reflect the project objectives. The approach breaks the total project down into components, or asset groups, comparable across a range of other projects. For example, a rail project is made up of stations, viaducts, tracks, drainage and tunnels etc. which can be compared to components in other sectors. A tunnel from a railway project can be compared to a tunnel from e.g. a road, metro or a utility project.
Benchmarks for each component are sourced from these projects, using a structured and disciplined data process that sets the cost in the context of the chosen metrics and desired performance and project objectives. An appropriate cost benchmark for each component is established and these are aggregated to form a composite benchmark total design cost. This “Should Cost” is set within an appropriate range that can be used to support decision makers and aid transparency throughout the various stages of the project life cycle.
The IPA recommends that benchmarks be used to measure not only project cost and other inputs, but also overall project performance during both construction and operation (i.e. over the whole life of a project) in terms of outputs (such as schedule), operational performance and outcomes (such as economic, environmental and social benefits).

22
Step 1: Confirm the project objectives and set the metrics
IPA Best Practice in Benchmarking
23
Project deliverables and performance metrics should be inextricably linked. Metrics should be based on project deliverables, and also help drive behaviour, and in turn performance, in the project’s delivery.
We set out here methods which may assist SROs and project teams with the development of project deliverables and setting metrics accordingly.
In 2019 the IPA and the DfT TIES programme, working in collaboration with the sector, will be undertaking a number of initiatives. These will look at the development of new sector-wide outcomes and benefit metrics that can be incorporated as part of the project/programme business case and benefits realisation management strategy.
Setting out and agreeing consistent metrics A government-endorsed set of unified asset definitions, standard units of measurement for performance and outcome metrics (such as embodied carbon, quality and resilience) and methods of data collection will significantly ease a consistent approach to benchmarking across industry by enabling the interoperability of data and information between organisations and project teams in and outside their sector or operation.
For example, by agreeing metrics and units of measurement, there will be no need to convert a metric from when data and benchmarks are shared to make direct comparisons between organisations. This is a particular issue for new metrics such as carbon, where one organisation may measure CO2
associated with transporting materials (see below), while another will not.
Case study: Environment Agency’s carbon calculatorThe Environment Agency carbon calculator measures the greenhouse gas impacts of construction activities in terms of carbon dioxide equivalency (CO2e). It does this by calculating the embodied CO2e of materials plus the CO2e associated with their transportation providing a CO2e tonnage (t) value.
Having a readily available library of sector agreed performance and outcome metrics can support a ‘plug & play’ approach in creating a consistent and aligned balanced scorecard for projects and programmes, where specific outputs and outcomes might be required as per project/funding approval. This library could also incorporate sector or organisation specific metrics that support project stakeholder preferences or remits (i.e. improving reliability of service, habitat creation, reducing waste to landfill).
Models for agreeing metricsThe IPA recommends projects choose a consistent approach to agreeing metrics. Three approaches are outlined below.
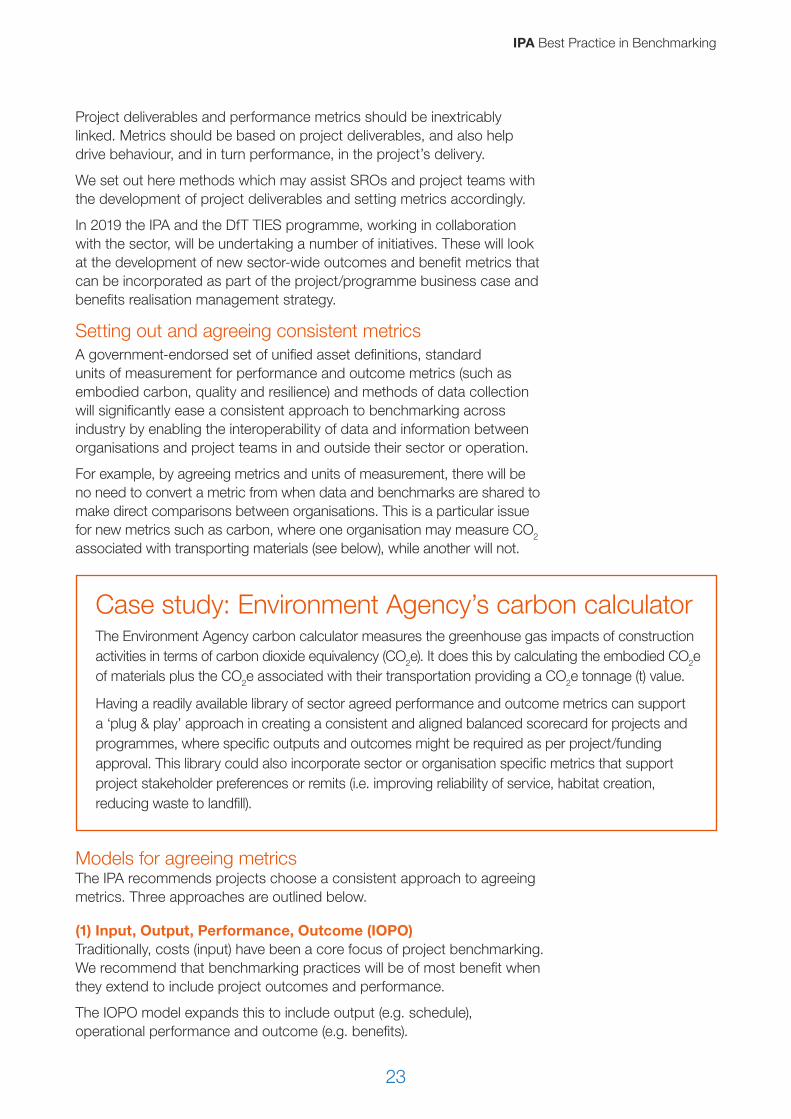
(1) Input, Output, Performance, Outcome (IOPO)Traditionally, costs (input) have been a core focus of project benchmarking. We recommend that benchmarking practices will be of most benefit when they extend to include project outcomes and performance.
The IOPO model expands this to include output (e.g. schedule), operational performance and outcome (e.g. benefits).
IPA Best practice in Benchmarking
24
Figure 5: Example of an IOPO model for a smart motorway project
Input Output Performace Outcomes
£/time10km of Smart
motorwayCapacity
Reduced congestion and
journey times and land unlocked for
development
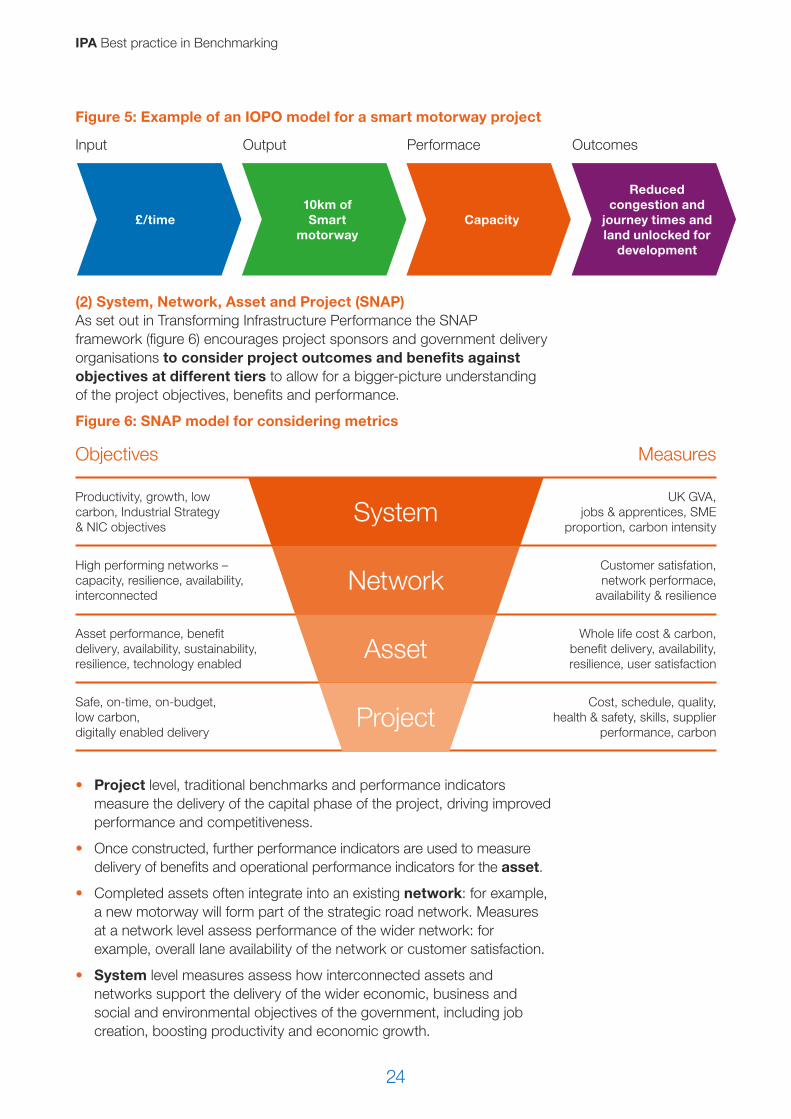
(2) System, Network, Asset and Project (SNAP) As set out in Transforming Infrastructure Performance the SNAP framework (figure 6) encourages project sponsors and government delivery organisations to consider project outcomes and benefits against objectives at different tiers to allow for a bigger-picture understanding of the project objectives, benefits and performance.
Figure 6: SNAP model for considering metrics
MeasuresObjectives
Productivity, growth, low carbon, Industrial Strategy & NIC objectives
UK GVA, jobs & apprentices, SME
proportion, carbon intensity
High performing networks – capacity, resilience, availability, interconnected
Customer satisfation, network performace,
availability & resilience
Asset performance, benefit delivery, availability, sustainability, resilience, technology enabled
Whole life cost & carbon, benefit delivery, availability, resilience, user satisfaction
Safe, on-time, on-budget, low carbon, digitally enabled delivery
Cost, schedule, quality, health & safety, skills, supplier
performance, carbon
System
Network
Asset
Project
• Project level, traditional benchmarks and performance indicators measure the delivery of the capital phase of the project, driving improved performance and competitiveness.
• Once constructed, further performance indicators are used to measure delivery of benefits and operational performance indicators for the asset.
• Completed assets often integrate into an existing network: for example, a new motorway will form part of the strategic road network. Measures at a network level assess performance of the wider network: for example, overall lane availability of the network or customer satisfaction.
• System level measures assess how interconnected assets and networks support the delivery of the wider economic, business and social and environmental objectives of the government, including job creation, boosting productivity and economic growth.
IPA Best Practice in Benchmarking
25
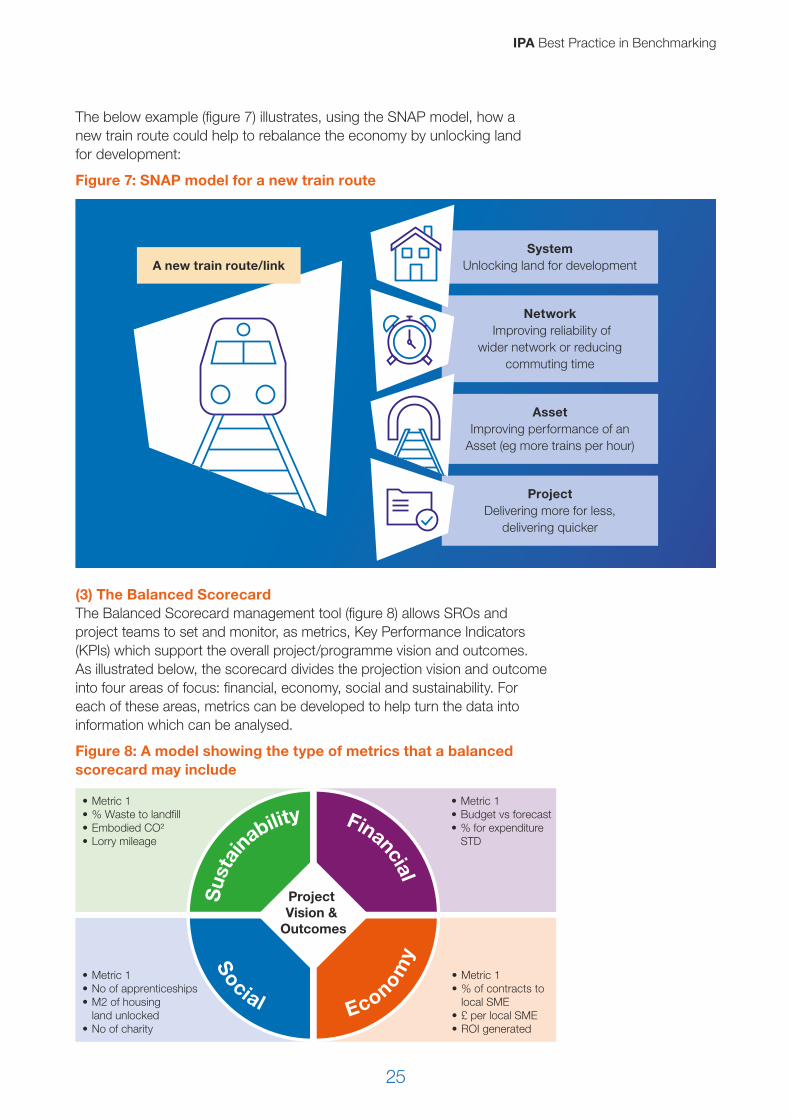
The below example (figure 7) illustrates, using the SNAP model, how a new train route could help to rebalance the economy by unlocking land for development:
Figure 7: SNAP model for a new train route
A new train route/linkSystem
Unlocking land for development
Network Improving reliability of
wider network or reducing commuting time
Asset Improving performance of an
Asset (eg more trains per hour)
Project Delivering more for less,
delivering quicker
(3) The Balanced Scorecard The Balanced Scorecard management tool (figure 8) allows SROs and project teams to set and monitor, as metrics, Key Performance Indicators (KPIs) which support the overall project/programme vision and outcomes. As illustrated below, the scorecard divides the projection vision and outcome into four areas of focus: financial, economy, social and sustainability. For each of these areas, metrics can be developed to help turn the data into information which can be analysed.
Figure 8: A model showing the type of metrics that a balanced scorecard may include
Sus
tainability
Social Econom
y
Financial
Project Vision &
Outcomes
• Metric 1• % Waste to landfill• Embodied CO² • Lorry mileage
• Metric 1• Budget vs forecast• % for expenditure STD
• Metric 1• No of apprenticeships• M2 of housing land unlocked• No of charity
• Metric 1• % of contracts to local SME• £ per local SME• ROI generated
Step 2: Break the project into major components for benchmarking
IPA Best Practice in Benchmarking
27
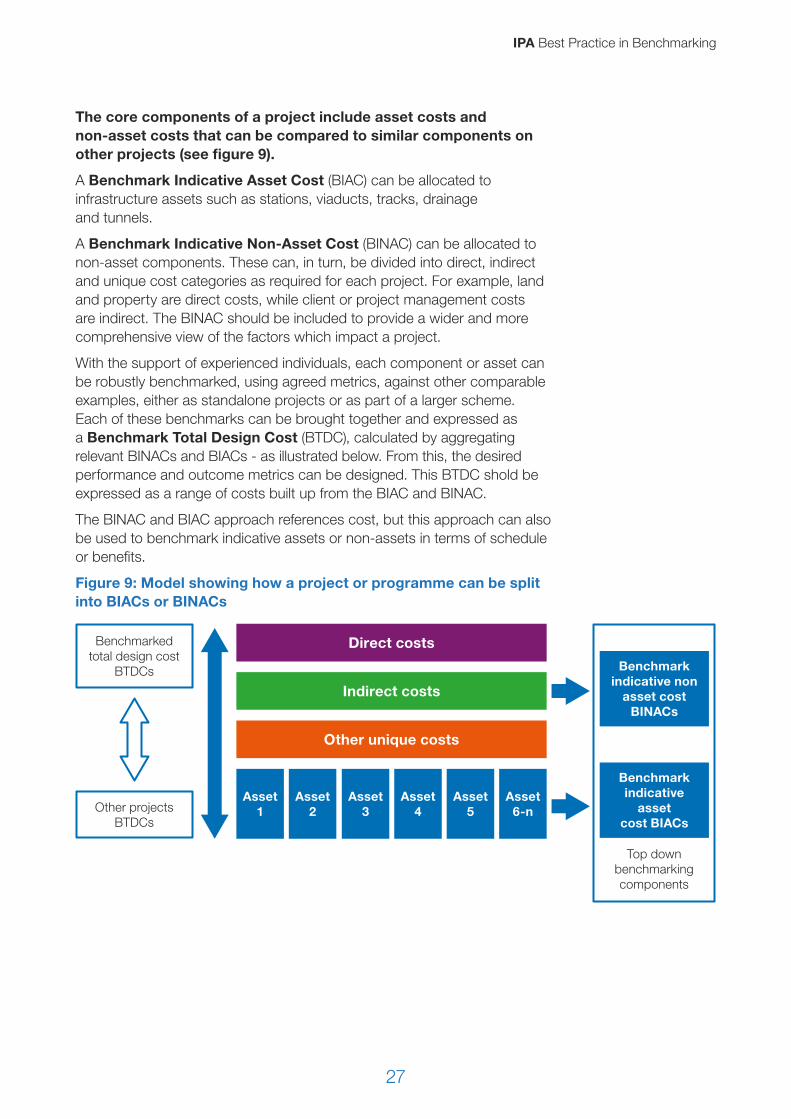
The core components of a project include asset costs and non-asset costs that can be compared to similar components on other projects (see figure 9).
A Benchmark Indicative Asset Cost (BIAC) can be allocated to infrastructure assets such as stations, viaducts, tracks, drainage and tunnels.
A Benchmark Indicative Non-Asset Cost (BINAC) can be allocated to non-asset components. These can, in turn, be divided into direct, indirect and unique cost categories as required for each project. For example, land and property are direct costs, while client or project management costs are indirect. The BINAC should be included to provide a wider and more comprehensive view of the factors which impact a project.
With the support of experienced individuals, each component or asset can be robustly benchmarked, using agreed metrics, against other comparable examples, either as standalone projects or as part of a larger scheme. Each of these benchmarks can be brought together and expressed as a Benchmark Total Design Cost (BTDC), calculated by aggregating relevant BINACs and BIACs - as illustrated below. From this, the desired performance and outcome metrics can be designed. This BTDC shold be expressed as a range of costs built up from the BIAC and BINAC.
The BINAC and BIAC approach references cost, but this approach can also be used to benchmark indicative assets or non-assets in terms of schedule or benefits.
Figure 9: Model showing how a project or programme can be split into BIACs or BINACs
Benchmarked total design cost
BTDCs
Direct costs
Indirect costs
Other unique costs
Asset 1
Asset 2
Asset 3
Asset 4
Asset 5
Asset 6-nOther projects
BTDCs
Benchmark indicative non
asset cost BINACs
Benchmark indicative
asset cost BIACs
Top down benchmarking components

Step 3: Develop templates for data gathering
IPA Best Practice in Benchmarking
29
To aggregate, manage and validate data for benchmarking quickly and efficiently, it is important to have a robust data structure which outlines protocols for the measurement and inclusion of information alongside data templates. This should help when procuring or sourcing data from third parties.
By clearly setting out standards, requirements and expectations, at the start of the collection process, benchmarking practitioners will help to ensure that any data procured is high quality, high value, handled securely, and can be acted on quickly.
Developing data templatesTemplates should include the drivers of key project outcomes and benefits, as developed in Step 1. For example, if a railway project’s objective is to improve the reliability and speed of a line, the benchmark across multiple assets (tunnel, tracks, station) should include performance benefit metric (e.g. speed and capacity of the track).
Subject matter experts can provide valuable insight in developing a suitable template. For example, during the development of the Tunnelling BIAC, IPA brought together members of the British Tunnelling Society and client organisations to add expertise and ensure that the key cost and performance drivers were included.
Templates should be reviewed at each gateway of the project lifecycle, as the data becomes more detailed and matures as the project progresses.
When developing a template for your project/programme, it is worth considering:
• The metrics which form the basis of the benchmark, and the underlying information required to build an informative benchmark.
• Whether a suitable template already exists from another source (e.g. through a chartered body or the relevant supply chain), which could be used or amended.
• Testing the template with subject matter experts.
• Ensuring there is a balanced level of detail to the data request.
• Storing the data as it could be reused for similar projects.
• Setting up a benchmarking community to include other organisations who might have an interest in collaborating or sharing BIAC & BINAC data they have already developed.
• Ensuring a shared understanding of requirements and data definitions when procuring data from a third-party source.
IPA Best practice in Benchmarking
30
Case study: Benchmarking tunnelling costs and production rates in the UKIn September 2018, the IPA Benchmarking team, in collaboration with the British Tunnelling Society (BTS), hosted a pilot tunnelling forum to help formulate a best practice in benchmarking methodology.
Tunnels were chosen as they have been successfully benchmarked in the past and allow effective testing of the methodology. Industry stakeholders from multiple sectors came together to share information on tunnelling costs, with additional data provided directly from HM Government departments, sponsors and programmes involved in tunnelling activities.
As part of a data gathering process, the IPA team initially asked participating client organisations to submit their own tunnelling data for analysis. This data was unstructured, unformatted and lacked critical information. This impacted the team’s ability to generate robust and accurate benchmarks. It was also clear that the key cost and performance drivers (cost and performance being the key metric needed by the participants) for tunnels and tunnelling projects were unknown to the IPA team.
Due to these issues the IPA team set up a tunnelling forum which brought together client organisations (those that provided raw data) as well as subject matter experts (members of BTS). The expertise and experience from this group was used to develop a template (BIAC) for capturing key tunnelling information, which included the key attributes for cost and performance drivers. Since the template was developed with the forum’s participation, all parties understood the definitions and what the data requirements were.
The exercise demonstrated that, when done in an appropriate format, there is considerable appetite for collaboration and data sharing in a non-commercial environment between public and private organisations for the purpose of robust benchmarking. The methodology was well received and accepted as a recognisable standard and best practice.
It also demonstrated the applications of this process. Each participant contributed to this exercise with their own data. The resulting collated, cleaned and analysed data has helped to enhance their own benchmarking and decision-making capabilities by complementing and enriching their own individual insights.
Sharing and re-using of templatesThe IPA encourages the sharing of BIAC and BINAC data templates across organisations and project/programme teams. This will reduce the need for individual teams to create new templates, and for data providers to interpret them.
The IPA will look to hold a library of BIAC and BINAC benchmark information on behalf of the sector and provide the sector with updates when new information is added.
IPA Best Practice in Benchmarking
31
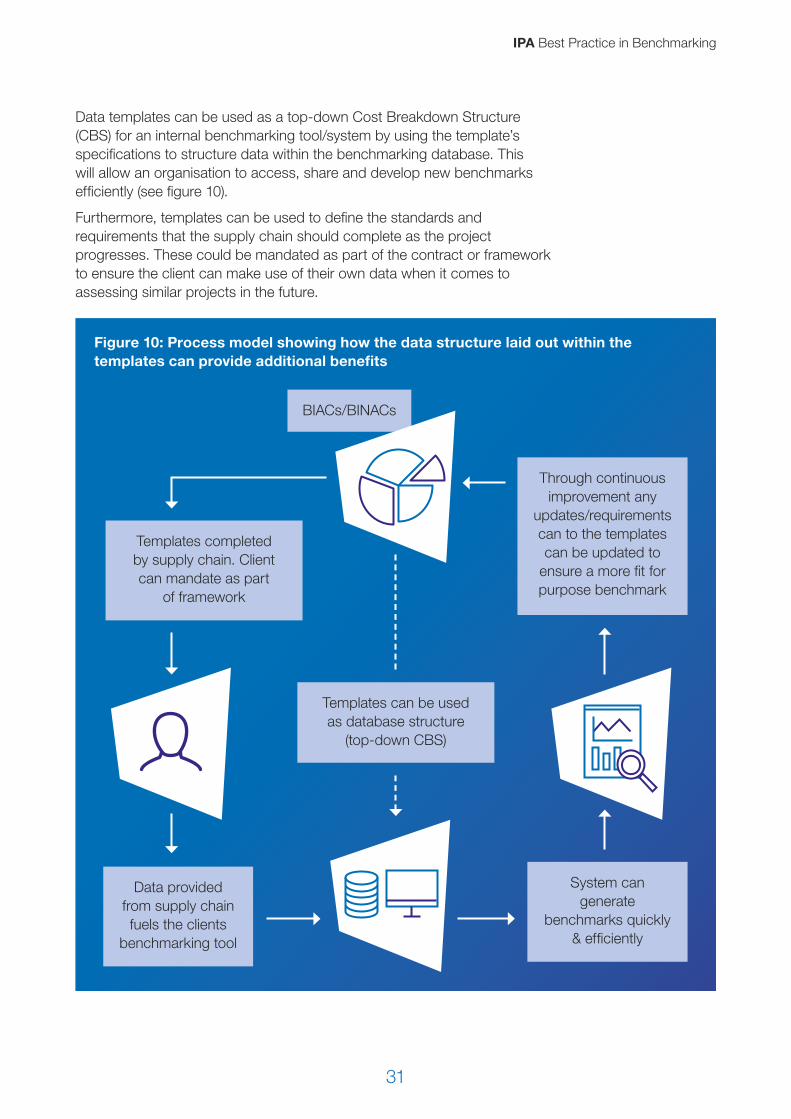
Data templates can be used as a top-down Cost Breakdown Structure (CBS) for an internal benchmarking tool/system by using the template’s specifications to structure data within the benchmarking database. This will allow an organisation to access, share and develop new benchmarks efficiently (see figure 10).
Furthermore, templates can be used to define the standards and requirements that the supply chain should complete as the project progresses. These could be mandated as part of the contract or framework to ensure the client can make use of their own data when it comes to assessing similar projects in the future.
Figure 10: Process model showing how the data structure laid out within the templates can provide additional benefits
BIACs/BINACs
Templates can be used as database structure
(top-down CBS)
Templates completed by supply chain. Client can mandate as part
of framework
Data provided from supply chain fuels the clients
benchmarking tool
System can generate
benchmarks quickly & efficiently
Through continuous improvement any
updates/requirements can to the templates can be updated to
ensure a more fit for purpose benchmark

Step 4: Scope sources and gather data
IPA Best Practice in Benchmarking
33
Reliable data is integral to good benchmarking. As demonstrated by the IPA tunnelling case study,10 there is a strong appetite in the sector to work together as part of a benchmarking community and use data to mutual advantage, under proper management. This section explains how and where infrastructure organisations and project teams can find reliable data.
As a premium asset, procuring or exchanging data from third parties can be subject to a number of issues and constraints. Firstly, the quality and value of the data may be poor due to age, low levels of detail or attributes and lacking performance metrics. Secondly, acquiring, validating and formatting the data can be time and resource intensive.
Consideration should be given to the safe and secure handling of information. For example, information should be properly redacted to ensure the sources are unidentifiable and organisations should be made aware of the intended uses of the information they provide. See ‘The economic value of data: discussion paper’11 for further details.
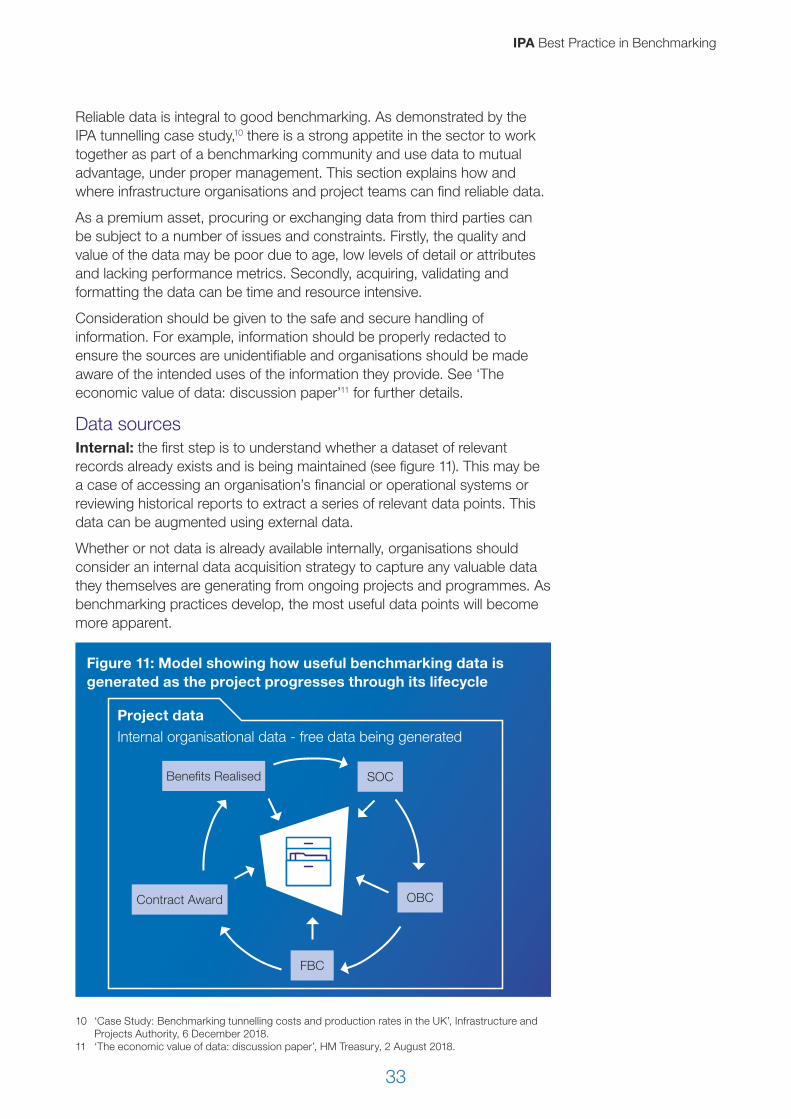
Data sourcesInternal: the first step is to understand whether a dataset of relevant records already exists and is being maintained (see figure 11). This may be a case of accessing an organisation’s financial or operational systems or reviewing historical reports to extract a series of relevant data points. This data can be augmented using external data.
Whether or not data is already available internally, organisations should consider an internal data acquisition strategy to capture any valuable data they themselves are generating from ongoing projects and programmes. As benchmarking practices develop, the most useful data points will become more apparent.
Figure 11: Model showing how useful benchmarking data is generated as the project progresses through its lifecycle
Project dataInternal organisational data - free data being generated
Benefits Realised
Contract Award
FBC
OBC
SOC
10 ‘Case Study: Benchmarking tunnelling costs and production rates in the UK’, Infrastructure and Projects Authority, 6 December 2018.
11 ‘The economic value of data: discussion paper’, HM Treasury, 2 August 2018.
IPA Best practice in Benchmarking
34
External: In some cases, the projects and assets delivered by government and industry are relatively bespoke or unique. It may therefore be difficult to find component relevant historical data from which to construct a benchmark. In these situations, it might be possible to:
• Find relevant benchmarks from comparable ALBs across government and organisations in the private sector.
• Build component benchmarks based on the performance in other countries (bearing in mind differences due to exchange rates, safety standards and other factors that could affect comparability).
• Share benchmarking data across sectors, e.g. support activities and indirect costs, procurement and project management may be similar enough across sectors to provide a useful, generalised benchmark.
• Use the BI(N)AC methods to break down the project into components which are capable of being benchmarked. For eample, a unique ship-building project may have no relevant comparators, but the more generic components of design, construction, fit-out and commissioning may be capable of being benchmarked against (bearing in mind important components that, due to their uniqueness, are responsible for significant project risk and uncertainty and therefore difficult to benchmark).
It should be noted than an extra level of scrutiny could be necessary when sourcing information from and sharing it with external partners to ensure that it is fully anonymised and there is mutual understanding on the appropriate use of the information between third parties. To this end, a mutually agreed Memorandum of Understanding (MOU) or Non-Disclosure Agreement (NDA) may be required.
International: International projects can provide additional data to the benchmarking exercise. Clients that use benchmarking data from beyond their own country will broaden the range of comparisons, thereby receiving a far more detailed perspective of best practice.
Benchmarking on an international level can provide data when little or no historic comparison in the home country is available, for example with unique projects, projects undertaken within a regulated industry or in sectors which are not traditionally international (e.g. house building). A high-speed rail proposal in the UK would be a good example of a unique project where international project information (for example from Japan, France or South Korea) will help develop a robust benchmark.
For components specific to high-speed rail, any benchmarking would therefore rely heavily on international comparisons to establish optioneering and funding envelopes before sufficient design maturity is achieved to facilitate bottom-up estimate completion. However, for components which are not particular to high speed rail, such as embankments, international comparison would not be as critical.
IPA Best Practice in Benchmarking
35
Once estimates are developed, continued benchmarking exercises which compare international projects to domestic may even prove robust enough to reveal location-specific market trends and/or macro-economic differences such as supply/demand variations, differing work practices or the effects of varying legislative constraints.
It should be noted that there are a number of considerations to bear in mind when collecting data internationally. These are outlined in step 6.
Data managementThe IPA has facilitated collaboration between infrastructure organisations to enable data sharing. Critical to success is establishing an appropriate forum or community for benchmarking which sets the ground rules in terms of data sharing and commitments of the participating organisations and supporting consultants. The IPA’s tunnelling case study is an example of how such a community can be established (see page 30).
The IPA and the Transport Infrastructure Efficiency Strategy (TIES) will offer support to those looking to form new benchmarking working groups and consortiums for the sharing of benchmarking data, information and processes. Where possible, the IPA is also taking the opportunity to engage with the international community in supporting and facilitating international benchmarking for large infrastructure projects.
Case study: Department for Transport’s benchmarking databaseAn organisation’s capability to cost plan and estimate infrastructure investment through benchmarking is key in driving efficiency savings, informing early business case decisions, demonstrating value for money and setting stakeholder expectations. A key enabler to improved cost estimation capability is an industry-wide use of standard language and nomenclature to structure cost data in support of cost models and benchmarking.
The TIES benchmarking forum aims to help build this shared capability. The forum is open in pilot mode, and will refine its operations over the coming year, before gradually scaling up its activities and expanding its capabilities to use the evidence it collates to improve decision-making on major UK infrastructure programmes. DfT will extend invitations to client infrastructure organisations with the full support of IPA.
Partners will develop and harmonise benchmarking practice, processes and procedures to ensure that relevant data is high quality and shareable.
By defining the parameters for collaboration, the TIES benchmarking forum will provide the necessary detail to encourage the widespread uptake of best practice in benchmarking as recommended by the IPA.

Step 5: Validate and re-base the data
IPA Best Practice in Benchmarking
37
Poor data which leads to inaccurate benchmarks can be more detrimental than having no data at all. Project sponsors with inaccurate information could misinterpret expectations on project performance or allow projects and programmes to continue when a review may be required. Data therefore needs to be carefully validated, cleansed, and re-based.
Validating dataA robust data validation process and system for governance will be needed. This activity should be refreshed regularly to ensure the integrity and quality of any benchmarks being used for decision making. While a well-formulated and clear data template will help reduce the need for data validation, there is always the potential for human error, particularly when it comes to large datasets. A quality assurance process should help mitigate these risks.
Items for consideration include:
• Data validation rules and processes (e.g. ensure all data points are in the same currency).
• The rules for quickly identifying data exceptions for review (i.e. identifying missing key information/attributes quickly).
• Processes for reviewing, investigating and fixing data issues (if issues are not resolvable, then it might be advisable to remove or quarantine certain data points).
In some instances, when data is procured or shared, it is important to undertake a data validation and quality review prior to incorporating the data into your existing database. This will prevent contamination of your data set, which could be time consuming to resolve.
Re-basing dataHaving selected your dataset you may need to re-base data points (which may have been collected using different measurement techniques) to make all records in the dataset comparable and consistent. Particular factors to consider when rebasing data include risk, international data and inflation.
It is important that data used in each exercise is re-based consistently, with each provider having a clear understanding of the re-basing requirements.
Re-basing for risk, uncertainty and project contingencyThe inclusion of risk and uncertainty in completed project information, and contingency in predicted project information, needs to be appreciated and accounted for when benchmarking to ensure accurate comparisons can be completed. Without adjusting for risk and uncertainty and project contingency, the validity of any benchmark analysis could be compromised.
Outturn cost information is likely to include crystalised project risks and uncertainty (for example poor ground conditions that require deeper piling) being transferred from a contingency fund to outturn costs.
IPA Best practice in Benchmarking
38
Best practice in identifying and adjusting for risk and uncertainty in benchmarking is to firstly identify whether the benchmark information is an estimate, tender return or outturn project cost, and whether risk and uncertainty and project contingency was captured separately or is incorporated within the information.
When significant risk and uncertainty is identified in the benchmark information, a transparent adjustment may need to be applied to show the costs including and excluding the contingency used to deal with the risk and uncertainty. For example, unforeseen ground conditions requiring remediation.
To achieve this options exist depending on the information available:
• If a range of project information from the same source, client or programme of works is available, then an analysis of risk and uncertainty in each project can be completed by tracking the risks identified in the risk register to the range of estimated costs incurred on the project. This can form a probabilistic estimate and a benchmarking lens based on the range of cost between a P50 and P9012 forecast. This may also be used to support a level of project contingency which can also be benchmarked.
• If the project under review is a standalone project, or a project whereby the risk allowance embedded in the cost information is unknown, then an industry or sector risk average could be applied to normalise the data. This is less accurate and therefore specialist advice could be required from a third-party cost consultancy to provide industry risk adjustments.
Re-basing international dataThe ability to normalise international cost information can be particularly challenging as a number of variables may exist which affect the cost of a project, and typically when sourcing data from international projects the underlying project detail that can potentially explain those variables will be less visible than for UK-based projects for a variety of reasons.
Variables could include foreign exchange rates, regulatory design standards, labour productivity, environmental regulations and accessibility. Many of these may not be detailed in the benchmark information available and in such instances augmenting the benchmark data with other information sources about the general market environment may be enough to bridge the gap.
Aside from project-specific variables, several methods are utilised to normalise for international locations. Most cost consultancies provide location factors which can be applied to normalise project costs based on costs collated from countries they operate in. Eurostat, World Bank and the IMF also produce Purchasing Power Parities (PPPs) which indicate price level differences between countries.
12 P50 and P90 relates to probability distribution of costs in a project.
IPA Best Practice in Benchmarking
39
Re-basing for inflationData should be normalised for inflation as accurately as possible. Projects will generally have different start and end dates, meaning the costs recorded will vary with fluctuations in inflation. To adjust for inflation, indices are utilised to normalise project costs at different price time bases.
Two types of inflation indices are used to normalise projects:
1. Tender price indices track the price of work activities as priced by contractors for clients. Tender prices include the cost of labour, plant and materials and also the contractor’s overhead and profit. Tender price indices should be used to normalise projects and sub-contractor works.
2. Cost indices track the cost of the material/asset/activity for the contractor exclusive of overheads and margins. Cost indices are generally used to reimburse contractors for inflationary pressures during a project whereby the risk of inflation sits with a client.
A range of consultancy organisations produce tender price and cost indices for various sectors and work activities. A consideration of the most appropriate index should be undertaken, for example a civil engineering tender price index is more appropriate than a general building price index for normalising infrastructure projects as the data informing the tender price index are more directly relevant to the work being assessed.
There should also be a consideration of whether a bespoke index is more appropriate. This could be the case if there are limited projects to benchmark and therefore the accuracy of the benchmark comparison is more essential. The use of Price Adjustment Formulae Indices (PAFI or previously known as Baxter Indices) can be combined and weighted to reflect the resources utilised on a project.
Applying inflation indices to multiyear projects should either be applied to the project mid-point or to the point of maximum expenditure to ensure the adjustment to the project is applied accurately.
Location should also be considered especially for international projects. Applying a UK inflation index to a Middle Eastern project for example would not be appropriate, since the rate of inflation differs from country to country. Projects should be normalised using an inflation index applicable to the country of origin and then further adjusted using a location factor.

Step 6: Produce and test the benchmark figure
IPA Best Practice in Benchmarking
41
The production of reliable analysis and insight should be the core goal for any organisation looking to make use of benchmarking. This section looks to provide more detail on how to review the analytical output and use benchmarks to inform decisions.
Calculating a benchmark figure and rangeWe expect project teams will be best placed to define the metrics for benchmarking. It is therefore not the intention of this guidance to provide a detailed introduction to the statistics that may be appropriate for calculating benchmarks. There are nonetheless a few considerations to bear in mind when calculating benchmark figures.
Typically, a benchmark will comprise the mean average of a sample dataset. Having been validated and re-based this sample dataset will contain historical observations that are sufficiently similar that variance around their average can provide a useful range for comparison.
More widely however, a benchmark could be any kind of reference point. It could be a type of average other than the mean, such as median or mode, or a more complicated model such as an econometric model. In each case, it is important to ask whether the benchmark is an appropriate and useful reference point to compare the particular project in question.
How appropriate is your benchmark figure?Comparing predicted figures against a benchmark only works if the benchmark is a valid figure itself. Stating the robustness and quality of your benchmark, and the data from which it is derived, is therefore good practice.
At this point, it will likely become apparent if the data provided on a project-by-project level was of sufficient quality, with the correct attributes. The team should consider a benchmarking maturity review (see Step 7 for further details) if the benchmark figure is shown to be unfit for purpose.
Teams should use properties such as range and standard deviation, or goodness-of-fit measurements such as the coefficient of determination (R2) to express this validity objectively. It may also be useful to express visual confidence in the benchmark subjectively, using tools such as bar charts, waterfall diagrams and visual markers or ‘heat maps’.
Those responsible for calculating and communicating benchmarks should be suitably experienced in relevant statistical techniques.
Removing or including outliersAn outlier is an observation that lies an abnormal distance from other values. Outliers provide an opportunity for analysts to question data and potentially identify poor measurement, poor recording or simple inaccuracies.
Outliers can also reveal unintended and truthful insight, since the outlier could result from a particular reason or issue with the project or asset which is worth capturing or considering. For example, the project cost derived from an outlier might have been higher if construction had taken place in a secure site (such as an airport) and was therefore constrained by security requirements. Only if a new project were not taking place on a secure site should this outlier be removed.
Step 7: Review and repeat, if necessary, before using data for benchmarking
IPA Best Practice in Benchmarking
43
The IPA aims to support continuous improvement of benchmarking practices which make use of better-quality data and metrics. Each review is an opportunity to identify areas for improvement and development (in particular data governance and the data acquisition strategy), as well as to ensure that the benchmarking exercise is meeting the organisation’s or sponsor’s requirements. It is worth noting that each exercise may require a number of reviews before being ready for publication. If the initial benchmark figure proves inadequate, teams should return to Step 1 and consider undertaking a benchmarking maturity exercise (outlined below).
Organisations and project teams should also make use of reviews to consolidate, adapt and evolve their benchmarking practices to suit a changing infrastructure landscape. These should reflect new pressures which could emerge from factors such as population growth, sustainability challenges, changes to regulations and policies, or new technology and data techniques (such as big data, APIs13 and open data).
Benchmarking maturityAn organisation’s or project team’s ability to benchmark should be compared against similar and different organisations using a defined set of core competencies and a scoring system. Assessing and publishing benchmarking maturity information will help organisations develop best practice and promote the continuous improvement of any benchmarking exercises, as well as encourage the sharing of benchmarking information. The IPA Benchmarking team can provide support and will look to develop the core competencies and scoring system required as a part of a benchmarking maturity index going forward.
13 Application Programming Interface
IPA Best practice in Benchmarking
44
SummaryA consistent approach to benchmarking across government and industry has the potential to significantly improve project delivery and performance, doing away with the prevailing assumption that projects consistently fail to meet their performance targets.
While benchmarking is an exercise requiring expertise, it can be used to make an impact at every level of an organisation – from the most senior levels of management to people on the ground. It should be emphasised that reliable information and knowledgeable subject matter experts are critical to the success of benchmarking.
The final point to note is that benchmarking, by providing a platform for transparent communication, is mutually beneficial to all parties. Project sponsors and senior management can make use of the data to question progress and targets in a productive manner, while delivery professions can use the same data to justify and explain their decisions. This point should be emphasised when it comes to sharing the data, which is critical to robust benchmarking.
There is demonstrable appetite for a more consistent approach to benchmarking and for the sharing of data within a secure environment, especially when that data is being used to support the delivery of projects. The IPA benchmarking team look forward to supporting organisations to make use of best practices and develop structures for sharing information and data.

IPA Best Practice in Benchmarking
45
Contact
Infrastructure and Projects Authority
Web: www.gov.uk/ipa
Email: [email protected]
Cabinet Office
Correspondence team
70 Whitehall
London
SW1A 2AS
Email: [email protected]
General enquiries: 020 7276 1234
Twitter: @cabinetofficeuk
HM Treasury
Correspondence team
1 Horse Guards Road
London
SW1A 2HQ
Email: [email protected]
General enquiries: 020 7270 5000

IPA Best practice in Benchmarking
46
Acknowledgements:AECOM, Dundee University, Environment Agency, Faithful+Gould, Gardiner & Theobald, Bill Grose Consulting, Infrastructure Client Group, National Infrastructure Commission, Mott MacDonald, Transport Infrastructure Efficiency Strategy (TIES) partners (Crossrail, Department for Transport, Highways England, HS2 Ltd., Network Rail, Transport for London), Phoenix Consulting, Tim Podesta Consulting, PwC, Turner & Townsend, Keith Waller

IPA Best practice in Benchmarking
48