benton county solid waste planning region · obion county solid waste planning region solid waste...
TRANSCRIPT
OBION COUNTY SOLID WASTE PLANNING REGION
Solid Waste Needs Assessment
June, 2011
As required by The Solid Waste Management Act (T.C.A. §68-211-811).
TENNESSEE DEPARTMENT OF ENVIRONMENT AND CONSERVATION
Division of Solid Waste Management
401 Church Street, 8th Floor
Nashville, TN 37243-1533
Prepared by:
The Northwest Tennessee Development District
INTRODUCTION
In an effort to coordinate and plan for safe, efficient solid waste disposal in the state, the
Tennessee General Assembly enacted several pieces of legislation, which are compiled in
Title 68, Chapter 211 of the Tennessee Code Annotated. To comply with the
requirements of this chapter, all local governments must engage in specified planning and
organizational activities (See the Solid Waste Management Act of 1991, T.C.A. §§ 68-
211-801 through 68-211-874).
Regional Solid Waste Management Planning
To begin implementation of the Solid Waste Management Act, counties were instructed
to form solid waste regions (single or multi-county) and establish a solid waste board.
Each region was required to formulate a 10-year plan for collection and disposal of solid
waste in the area and submit this plan to the Tennessee Department of Environment and
Conservation. Each municipal solid waste region must submit an annual progress report
and 5-Year Plan Update (T.C.A. § 68-211-814). The plan, and any revised plan,
submitted by each region must be consistent with the state solid waste plan and with all
relevant state laws and regulations.
At a minimum, each plan must contain the following items:
Demographic information and projections;
Analysis of economic activity in the Region;
Characterization of the waste stream;
Projection of solid waste generation;
Evaluation of collection systems within the Region;
Current system analysis of waste streams, collection capability, disposal
capability, costs, and revenues;
Description of waste reduction activities designed to attain the required 25 percent
reduction in solid waste;
Description of education initiatives designed to achieve the goals stated in the
statute; and
Any other information the commissioner of the Department of Environment and
Conservation deems relevant.
In order that the regional planning effort is implemented on a solid foundation of relevant
and objective knowledge of local conditions, the Act requires the Development Districts
to coordinate, conduct and maintain a Needs Assessment for each solid waste region.
This Assessment shall be revised every five years.
SECTION 1:
DEMOGRAPHIC INFORMATION AND PROJECTION Provide a table and chart showing the region’s population for the last ten (10) years with a projection for
the next five (5) years. Provide a breakdown by sub- table and sub-chart, or some similar method to detail
all county and municipality populations. Discuss projected trends and how it will affect solid waste
infrastructure needs over the next five (5) years.
Population Trends in Obion County
Obion County’s population decreased by 2.1% from figures taken from the 2000 Census
and the 2010 Census. As shown on Table 1.1 on the next page, the population in 2000
was 32,487, and the population in 2010 was 31,516. Much of this decline was due to the
loss of manufacturing jobs. Many of smaller communities in Obion County had several
small plants to close. This population decline can result in a declining property tax base
and loss of sales tax revenue.
Unfortunately, the U.S. Census Bureau is projecting that Obion County’s population will
decrease by 7.9% during the next five years. Since the largest manufacturer will be
closing its doors at the end of 2011, this projection may be accurate. Many families will
have to leave the area to find employment.
Based on the latest U.S. Census Bureau’s statistics, 17.68% of Obion County’s
population is 65 years of age and older and 24.1% is under the age of 18. These figures
account for 41.78% of Obion County’s total population. More than 50% of the total
population is between the ages of 19 – 64.
Since Obion County’s population is projected to decrease greatly in the next five years,
the solid waste disposal should decrease as well. Obion County is well equipped to
handle solid waste in the county. There are two private landfills located within the
county. The Northwest Tennessee Disposal Corp. Class I Landfill has twenty-five plus
years of life left. Alan’s Industrial Waste Class I Landfill also has twenty-five plus years
of life left.
The Obion County Solid Waste Director provides extensive educational programs and
events to educate the public about waste diversion and recycling. Currently, the
Director only utilizes four part-time staff members. The current staff has reached its
maximum level and does not have the manpower to increase the number of pickups. As
the recycling efforts increase, an additional person will need to be employed. This person
will need to be a full-time employee.
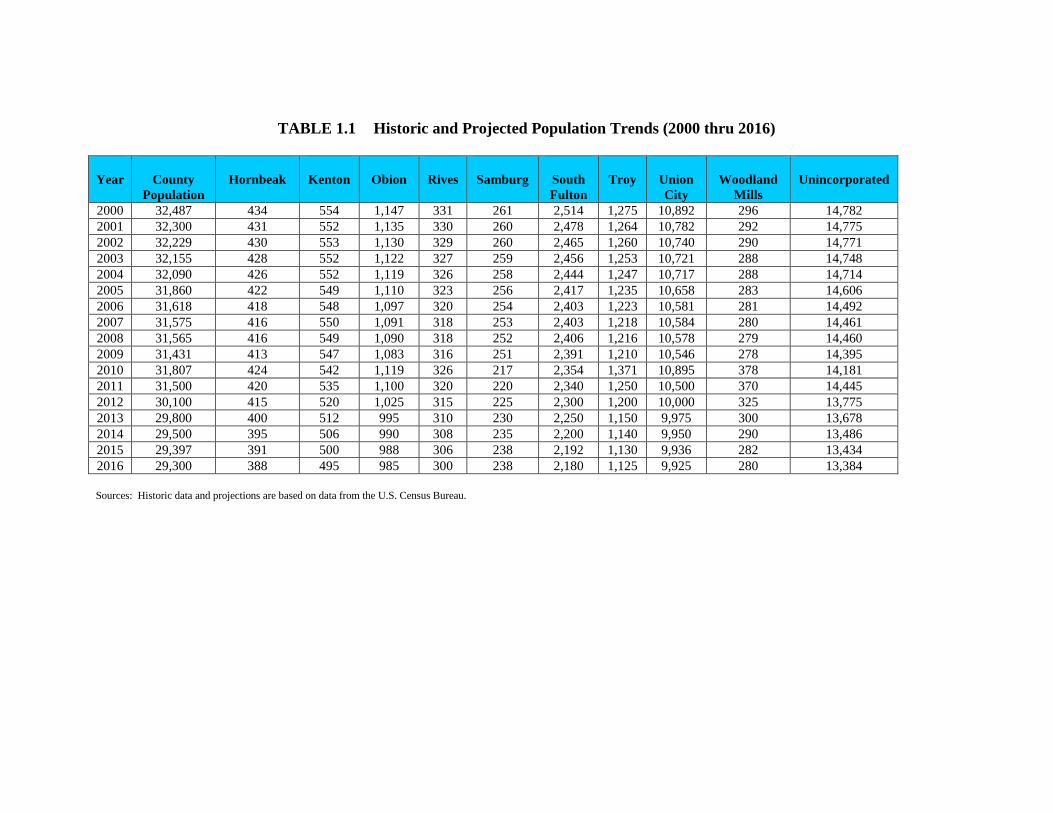
TABLE 1.1 Historic and Projected Population Trends (2000 thru 2016)
Year
County
Population
Hornbeak
Kenton
Obion
Rives
Samburg
South
Fulton
Troy
Union
City
Woodland
Mills
Unincorporated
2000 32,487 434 554 1,147 331 261 2,514 1,275 10,892 296 14,782
2001 32,300 431 552 1,135 330 260 2,478 1,264 10,782 292 14,775
2002 32,229 430 553 1,130 329 260 2,465 1,260 10,740 290 14,771
2003 32,155 428 552 1,122 327 259 2,456 1,253 10,721 288 14,748
2004 32,090 426 552 1,119 326 258 2,444 1,247 10,717 288 14,714
2005 31,860 422 549 1,110 323 256 2,417 1,235 10,658 283 14,606
2006 31,618 418 548 1,097 320 254 2,403 1,223 10,581 281 14,492
2007 31,575 416 550 1,091 318 253 2,403 1,218 10,584 280 14,461
2008 31,565 416 549 1,090 318 252 2,406 1,216 10,578 279 14,460
2009 31,431 413 547 1,083 316 251 2,391 1,210 10,546 278 14,395
2010 31,807 424 542 1,119 326 217 2,354 1,371 10,895 378 14,181
2011 31,500 420 535 1,100 320 220 2,340 1,250 10,500 370 14,445
2012 30,100 415 520 1,025 315 225 2,300 1,200 10,000 325 13,775
2013 29,800 400 512 995 310 230 2,250 1,150 9,975 300 13,678
2014 29,500 395 506 990 308 235 2,200 1,140 9,950 290 13,486
2015 29,397 391 500 988 306 238 2,192 1,130 9,936 282 13,434
2016 29,300 388 495 985 300 238 2,180 1,125 9,925 280 13,384
Sources: Historic data and projections are based on data from the U.S. Census Bureau.
SECTION 2:
ECONOMIC ACTIVITY WITHIN THE REGION Provide a table and chart showing the region’s economic profile for all county and municipalities for the
last ten (10) years with a projection for the next five (5) years. This can be accomplished by using the
following economic indicators:
Taxable sales, property tax generation, and per capita income
Evaluation by break down of each economic sector
County or municipal budgeting information
Other commonly accepted economic indicators
Economic Profile of Obion County
As shown on Table 2.2 on the following page, Obion County is trying to recover from a
weak economy. Unemployment rates have ranged from a low of 4.3% in 2001 to a high
of 10.4% in 2009. As of March 2011, the unemployment rate in Obion County was
9.9%.
The future does not look bright for Obion County at this time. Goodyear Tire and
Rubber Company announced in January, 2011, that they were closing by the end of the
year. This industry is the largest employer and approximately 1,900 jobs will be lost.
Some of these employees will transfer to other plants, but the majority will have to find
other employment. With the impending closure of this industry, unemployment rates are
expected to increase, and the population is expected to decrease.
Obion County is actively pursuing industries to come to the area. There are several
industrial sites with infrastructure available as well as a fully equipped airport. The
average total wages in all industries in Obion County was $35,681, which is lower than
the state average of $36,146 and the national average of $40,259.
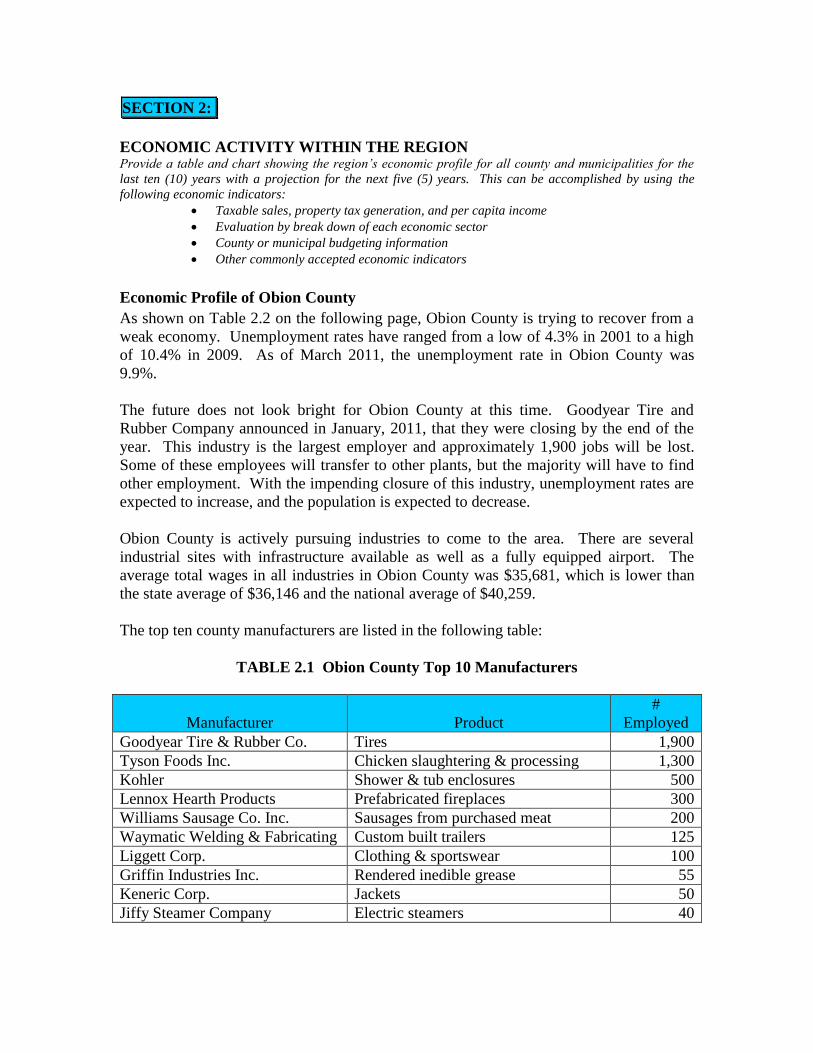
The top ten county manufacturers are listed in the following table:
TABLE 2.1 Obion County Top 10 Manufacturers
Manufacturer
Product
#
Employed
Goodyear Tire & Rubber Co. Tires 1,900
Tyson Foods Inc. Chicken slaughtering & processing 1,300
Kohler Shower & tub enclosures 500
Lennox Hearth Products Prefabricated fireplaces 300
Williams Sausage Co. Inc. Sausages from purchased meat 200
Waymatic Welding & Fabricating Custom built trailers 125
Liggett Corp. Clothing & sportswear 100
Griffin Industries Inc. Rendered inedible grease 55
Keneric Corp. Jackets 50
Jiffy Steamer Company Electric steamers 40

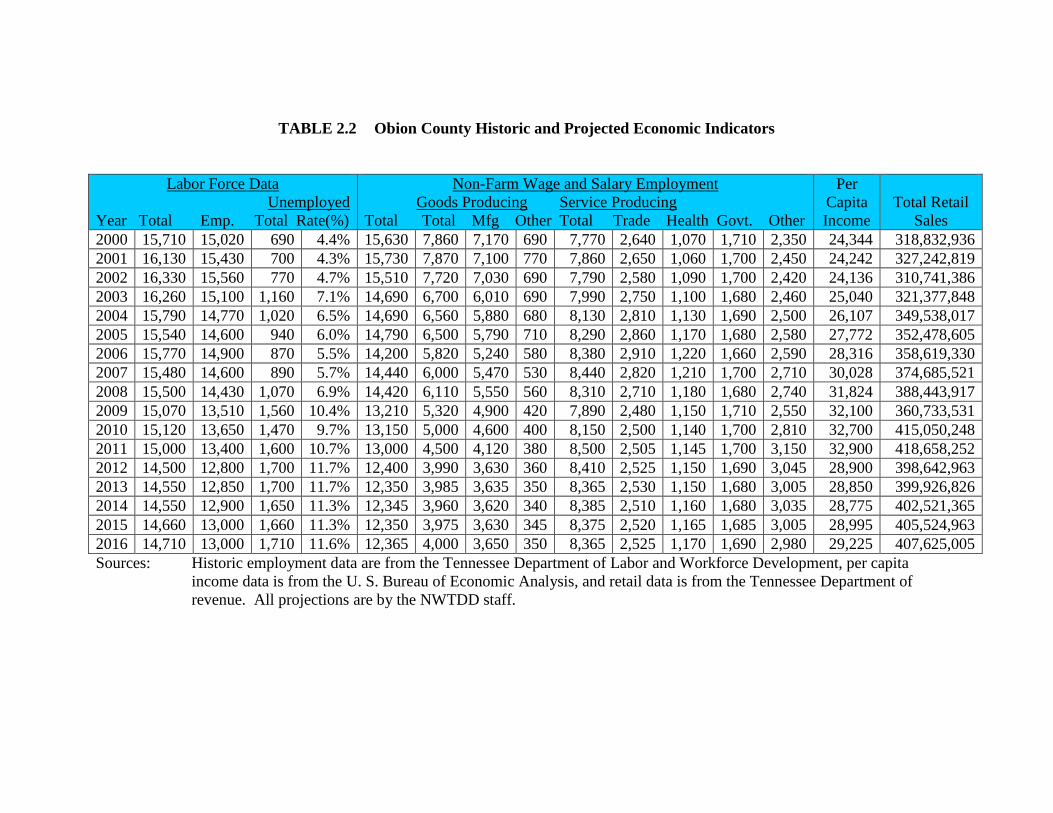
TABLE 2.2 Obion County Historic and Projected Economic Indicators
Labor Force Data
Unemployed
Year Total Emp. Total Rate(%)
Non-Farm Wage and Salary Employment
Goods Producing Service Producing
Total Total Mfg Other Total Trade Health Govt. Other
Per
Capita
Income
Total Retail
Sales
2000 15,710 15,020 690 4.4% 15,630 7,860 7,170 690 7,770 2,640 1,070 1,710 2,350 24,344 318,832,936
2001 16,130 15,430 700 4.3% 15,730 7,870 7,100 770 7,860 2,650 1,060 1,700 2,450 24,242 327,242,819
2002 16,330 15,560 770 4.7% 15,510 7,720 7,030 690 7,790 2,580 1,090 1,700 2,420 24,136 310,741,386
2003 16,260 15,100 1,160 7.1% 14,690 6,700 6,010 690 7,990 2,750 1,100 1,680 2,460 25,040 321,377,848
2004 15,790 14,770 1,020 6.5% 14,690 6,560 5,880 680 8,130 2,810 1,130 1,690 2,500 26,107 349,538,017
2005 15,540 14,600 940 6.0% 14,790 6,500 5,790 710 8,290 2,860 1,170 1,680 2,580 27,772 352,478,605
2006 15,770 14,900 870 5.5% 14,200 5,820 5,240 580 8,380 2,910 1,220 1,660 2,590 28,316 358,619,330
2007 15,480 14,600 890 5.7% 14,440 6,000 5,470 530 8,440 2,820 1,210 1,700 2,710 30,028 374,685,521
2008 15,500 14,430 1,070 6.9% 14,420 6,110 5,550 560 8,310 2,710 1,180 1,680 2,740 31,824 388,443,917
2009 15,070 13,510 1,560 10.4% 13,210 5,320 4,900 420 7,890 2,480 1,150 1,710 2,550 32,100 360,733,531
2010 15,120 13,650 1,470 9.7% 13,150 5,000 4,600 400 8,150 2,500 1,140 1,700 2,810 32,700 415,050,248
2011 15,000 13,400 1,600 10.7% 13,000 4,500 4,120 380 8,500 2,505 1,145 1,700 3,150 32,900 418,658,252
2012 14,500 12,800 1,700 11.7% 12,400 3,990 3,630 360 8,410 2,525 1,150 1,690 3,045 28,900 398,642,963
2013 14,550 12,850 1,700 11.7% 12,350 3,985 3,635 350 8,365 2,530 1,150 1,680 3,005 28,850 399,926,826
2014 14,550 12,900 1,650 11.3% 12,345 3,960 3,620 340 8,385 2,510 1,160 1,680 3,035 28,775 402,521,365
2015 14,660 13,000 1,660 11.3% 12,350 3,975 3,630 345 8,375 2,520 1,165 1,685 3,005 28,995 405,524,963
2016 14,710 13,000 1,710 11.6% 12,365 4,000 3,650 350 8,365 2,525 1,170 1,690 2,980 29,225 407,625,005
Sources: Historic employment data are from the Tennessee Department of Labor and Workforce Development, per capita
income data is from the U. S. Bureau of Economic Analysis, and retail data is from the Tennessee Department of
revenue. All projections are by the NWTDD staff.

SECTION 3:
SOLID WASTE STREAM CHARACTERIZATION Elaborate on the entire region’s solid waste stream. Compare today’s waste stream with anticipated waste
stream over the next five (5) years, and discuss how this new total will be handled. Include in this
discussion how problem wastes like waste tires, used oil, latex paint, electronics and other problem wastes
are currently handled and are projected to be handled in the next five (5) years. What other waste types
generated in this region require special attention? Discuss disposal options and management of these
waste streams as well as how these waste streams will be handled in the future. Include in this discussion
how commercial or industrial wastes are managed. Also provide an analysis noting source and amounts of
any wastes entering or leaving out of the region.
Current MSW Stream
In the most recent Obion County Solid Waste Annual Progress Report (2010), the total
MSW stream was reported as 79,071 tons. This amount consisted of 27,276 tons being
disposed in Class I landfills, and 51,795 tons being recycled.
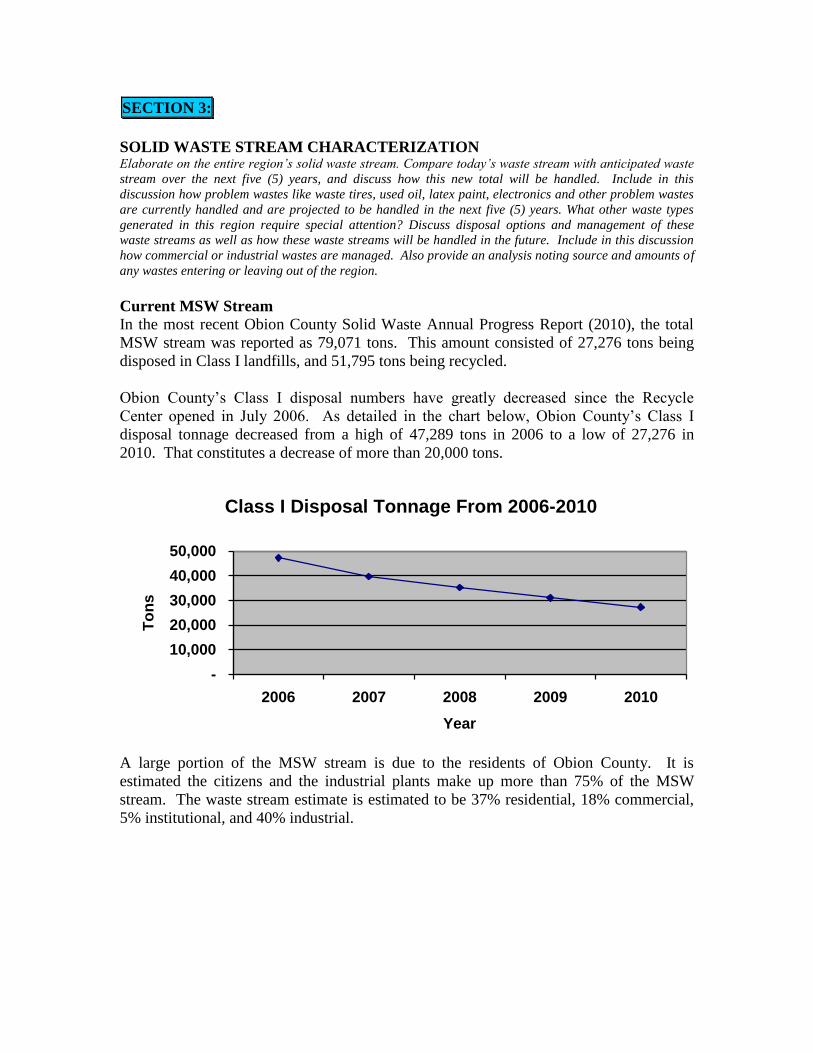
Obion County’s Class I disposal numbers have greatly decreased since the Recycle
Center opened in July 2006. As detailed in the chart below, Obion County’s Class I
disposal tonnage decreased from a high of 47,289 tons in 2006 to a low of 27,276 in
2010. That constitutes a decrease of more than 20,000 tons.
Class I Disposal Tonnage From 2006-2010
-
10,000
20,000
30,000
40,000
50,000
2006 2007 2008 2009 2010
Year
To
ns
A large portion of the MSW stream is due to the residents of Obion County. It is
estimated the citizens and the industrial plants make up more than 75% of the MSW
stream. The waste stream estimate is estimated to be 37% residential, 18% commercial,
5% institutional, and 40% industrial.
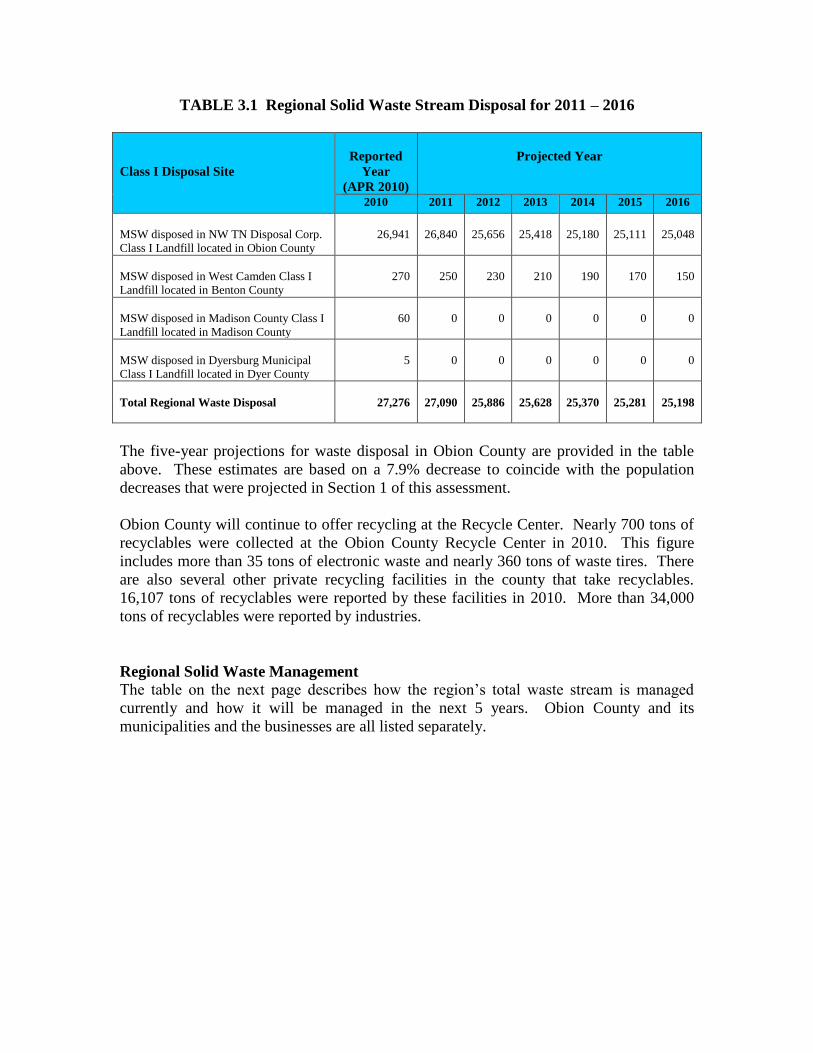
TABLE 3.1 Regional Solid Waste Stream Disposal for 2011 – 2016
Class I Disposal Site
Reported
Year
(APR 2010)
Projected Year
2010 2011 2012 2013 2014 2015 2016
MSW disposed in NW TN Disposal Corp.
Class I Landfill located in Obion County
26,941
26,840
25,656
25,418
25,180
25,111
25,048
MSW disposed in West Camden Class I
Landfill located in Benton County
270
250
230
210
190
170
150
MSW disposed in Madison County Class I
Landfill located in Madison County
60
0
0
0
0
0
0
MSW disposed in Dyersburg Municipal
Class I Landfill located in Dyer County
5
0
0
0
0
0
0
Total Regional Waste Disposal
27,276
27,090
25,886
25,628
25,370
25,281
25,198
The five-year projections for waste disposal in Obion County are provided in the table
above. These estimates are based on a 7.9% decrease to coincide with the population
decreases that were projected in Section 1 of this assessment.
Obion County will continue to offer recycling at the Recycle Center. Nearly 700 tons of
recyclables were collected at the Obion County Recycle Center in 2010. This figure
includes more than 35 tons of electronic waste and nearly 360 tons of waste tires. There
are also several other private recycling facilities in the county that take recyclables.
16,107 tons of recyclables were reported by these facilities in 2010. More than 34,000
tons of recyclables were reported by industries.
Regional Solid Waste Management
The table on the next page describes how the region’s total waste stream is managed
currently and how it will be managed in the next 5 years. Obion County and its
municipalities and the businesses are all listed separately.
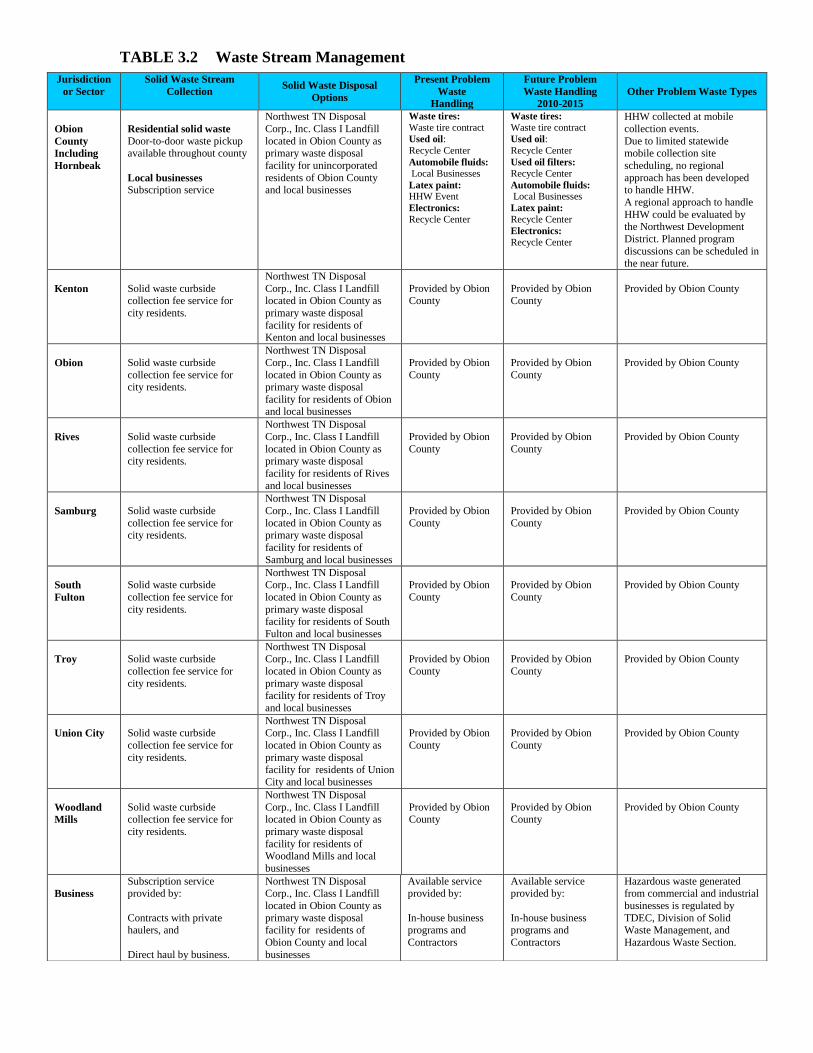
TABLE 3.2 Waste Stream Management
Jurisdiction
or Sector
Solid Waste Stream
Collection
Solid Waste Disposal
Options
Present Problem
Waste
Handling
Future Problem
Waste Handling
2010-2015
Other Problem Waste Types
Obion
County
Including
Hornbeak
Residential solid waste Door-to-door waste pickup available throughout county
Local businesses Subscription service
Northwest TN Disposal
Corp., Inc. Class I Landfill
located in Obion County as primary waste disposal
facility for unincorporated
residents of Obion County and local businesses
Waste tires:
Waste tire contract
Used oil:
Recycle Center
Automobile fluids:
Local Businesses
Latex paint: HHW Event
Electronics:
Recycle Center
Waste tires:
Waste tire contract
Used oil:
Recycle Center
Used oil filters:
Recycle Center
Automobile fluids: Local Businesses
Latex paint:
Recycle Center
Electronics:
Recycle Center
HHW collected at mobile
collection events.
Due to limited statewide mobile collection site
scheduling, no regional
approach has been developed to handle HHW.
A regional approach to handle
HHW could be evaluated by the Northwest Development
District. Planned program
discussions can be scheduled in the near future.
Kenton
Solid waste curbside collection fee service for
city residents.
Northwest TN Disposal
Corp., Inc. Class I Landfill located in Obion County as
primary waste disposal
facility for residents of Kenton and local businesses
Provided by Obion County
Provided by Obion County
Provided by Obion County
Obion
Solid waste curbside
collection fee service for city residents.
Northwest TN Disposal
Corp., Inc. Class I Landfill
located in Obion County as primary waste disposal
facility for residents of Obion and local businesses
Provided by Obion
County
Provided by Obion
County
Provided by Obion County
Rives
Solid waste curbside
collection fee service for city residents.
Northwest TN Disposal
Corp., Inc. Class I Landfill
located in Obion County as primary waste disposal
facility for residents of Rives
and local businesses
Provided by Obion
County
Provided by Obion
County
Provided by Obion County
Samburg
Solid waste curbside
collection fee service for city residents.
Northwest TN Disposal
Corp., Inc. Class I Landfill
located in Obion County as primary waste disposal
facility for residents of
Samburg and local businesses
Provided by Obion
County
Provided by Obion
County
Provided by Obion County
South
Fulton
Solid waste curbside
collection fee service for
city residents.
Northwest TN Disposal Corp., Inc. Class I Landfill
located in Obion County as
primary waste disposal facility for residents of South
Fulton and local businesses
Provided by Obion
County
Provided by Obion
County
Provided by Obion County
Troy
Solid waste curbside
collection fee service for
city residents.
Northwest TN Disposal Corp., Inc. Class I Landfill
located in Obion County as
primary waste disposal facility for residents of Troy
and local businesses
Provided by Obion
County
Provided by Obion
County
Provided by Obion County
Union City
Solid waste curbside
collection fee service for
city residents.
Northwest TN Disposal Corp., Inc. Class I Landfill
located in Obion County as
primary waste disposal
facility for residents of Union
City and local businesses
Provided by Obion
County
Provided by Obion
County
Provided by Obion County
Woodland
Mills
Solid waste curbside collection fee service for
city residents.
Northwest TN Disposal
Corp., Inc. Class I Landfill located in Obion County as
primary waste disposal
facility for residents of Woodland Mills and local
businesses
Provided by Obion County
Provided by Obion County
Provided by Obion County
Business
Subscription service provided by:
Contracts with private haulers, and
Direct haul by business.
Northwest TN Disposal Corp., Inc. Class I Landfill
located in Obion County as
primary waste disposal facility for residents of
Obion County and local
businesses
Available service provided by:
In-house business programs and
Contractors
Available service provided by:
In-house business programs and
Contractors
Hazardous waste generated from commercial and industrial
businesses is regulated by
TDEC, Division of Solid Waste Management, and
Hazardous Waste Section.
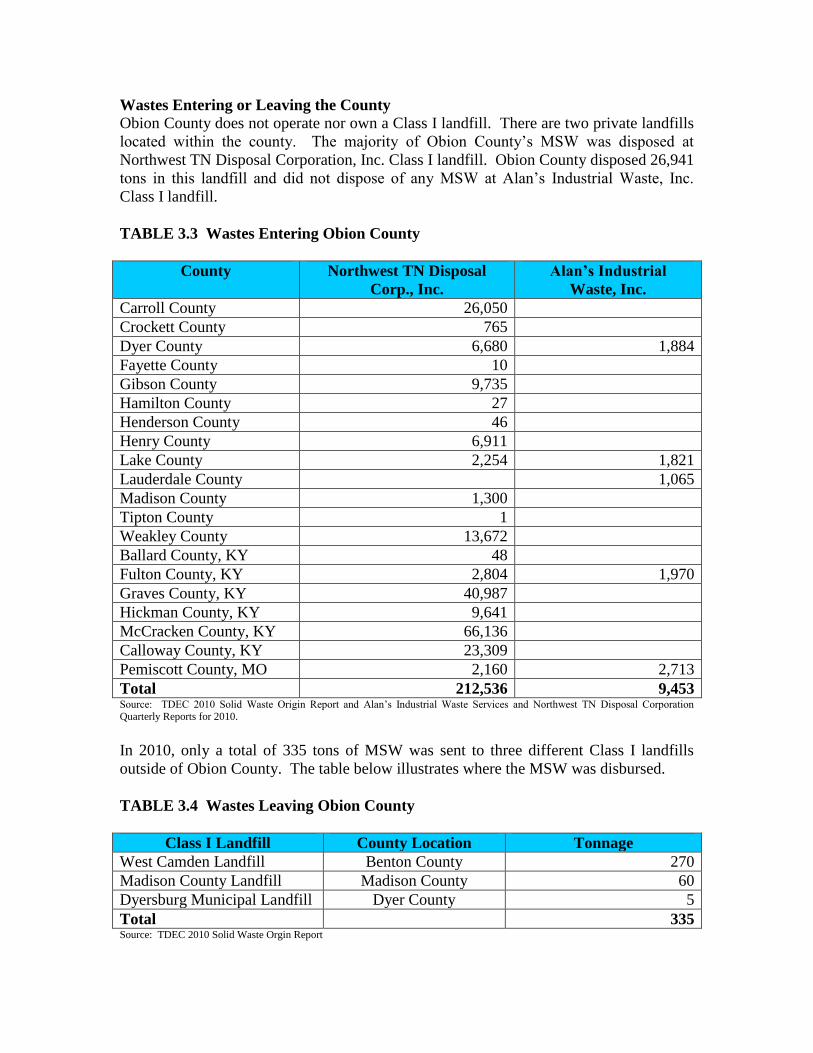
Wastes Entering or Leaving the County
Obion County does not operate nor own a Class I landfill. There are two private landfills
located within the county. The majority of Obion County’s MSW was disposed at
Northwest TN Disposal Corporation, Inc. Class I landfill. Obion County disposed 26,941
tons in this landfill and did not dispose of any MSW at Alan’s Industrial Waste, Inc.
Class I landfill.
TABLE 3.3 Wastes Entering Obion County
County Northwest TN Disposal
Corp., Inc.
Alan’s Industrial
Waste, Inc.
Carroll County 26,050
Crockett County 765
Dyer County 6,680 1,884
Fayette County 10
Gibson County 9,735
Hamilton County 27
Henderson County 46
Henry County 6,911
Lake County 2,254 1,821
Lauderdale County 1,065
Madison County 1,300
Tipton County 1
Weakley County 13,672
Ballard County, KY 48
Fulton County, KY 2,804 1,970
Graves County, KY 40,987
Hickman County, KY 9,641
McCracken County, KY 66,136
Calloway County, KY 23,309
Pemiscott County, MO 2,160 2,713
Total 212,536 9,453 Source: TDEC 2010 Solid Waste Origin Report and Alan’s Industrial Waste Services and Northwest TN Disposal Corporation Quarterly Reports for 2010.
In 2010, only a total of 335 tons of MSW was sent to three different Class I landfills
outside of Obion County. The table below illustrates where the MSW was disbursed.
TABLE 3.4 Wastes Leaving Obion County
Class I Landfill County Location Tonnage
West Camden Landfill Benton County 270
Madison County Landfill Madison County 60
Dyersburg Municipal Landfill Dyer County 5
Total 335 Source: TDEC 2010 Solid Waste Orgin Report
SECTION 4:
REGIONAL COLLECTION SYSTEMS Provide a detailed description of the waste collection system in the county and every municipality,
including a narrative of the life cycle of solid waste from the moment it becomes waste (loses value) until it
ceases to be a waste by becoming a useful product, residual landfill material or an emission to air or
water. Label all major steps in this cycle noting all locations where wastes are collected, stored or
processed along with the name of operators and transporters for these sites.
County and city government throughout the United States are struggling to develop
efficient and cost-effective plans for managing their MSW. Obion County has an
excellent system in place and plans to continue this system into the future.
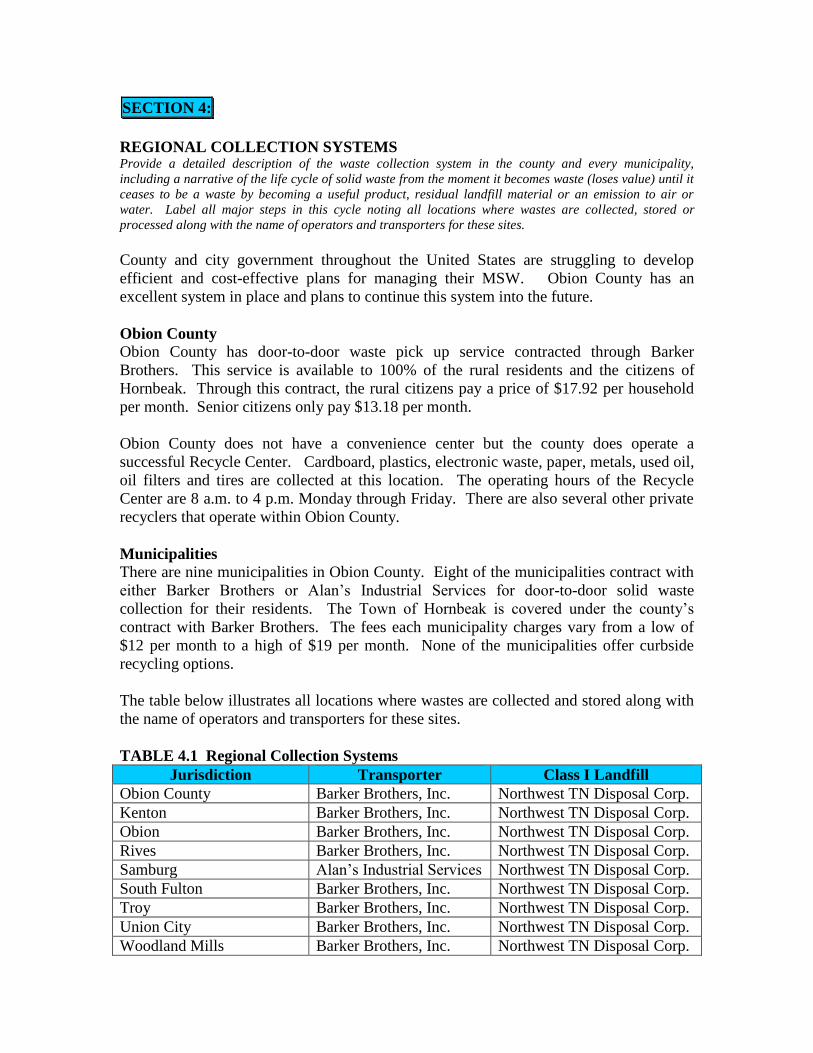
Obion County
Obion County has door-to-door waste pick up service contracted through Barker
Brothers. This service is available to 100% of the rural residents and the citizens of
Hornbeak. Through this contract, the rural citizens pay a price of $17.92 per household
per month. Senior citizens only pay $13.18 per month.
Obion County does not have a convenience center but the county does operate a
successful Recycle Center. Cardboard, plastics, electronic waste, paper, metals, used oil,
oil filters and tires are collected at this location. The operating hours of the Recycle
Center are 8 a.m. to 4 p.m. Monday through Friday. There are also several other private
recyclers that operate within Obion County.
Municipalities
There are nine municipalities in Obion County. Eight of the municipalities contract with
either Barker Brothers or Alan’s Industrial Services for door-to-door solid waste
collection for their residents. The Town of Hornbeak is covered under the county’s
contract with Barker Brothers. The fees each municipality charges vary from a low of
$12 per month to a high of $19 per month. None of the municipalities offer curbside
recycling options.
The table below illustrates all locations where wastes are collected and stored along with
the name of operators and transporters for these sites.
TABLE 4.1 Regional Collection Systems
Jurisdiction Transporter Class I Landfill
Obion County Barker Brothers, Inc. Northwest TN Disposal Corp.
Kenton Barker Brothers, Inc. Northwest TN Disposal Corp.
Obion Barker Brothers, Inc. Northwest TN Disposal Corp.
Rives Barker Brothers, Inc. Northwest TN Disposal Corp.
Samburg Alan’s Industrial Services Northwest TN Disposal Corp.
South Fulton Barker Brothers, Inc. Northwest TN Disposal Corp.
Troy Barker Brothers, Inc. Northwest TN Disposal Corp.
Union City Barker Brothers, Inc. Northwest TN Disposal Corp.
Woodland Mills Barker Brothers, Inc. Northwest TN Disposal Corp.
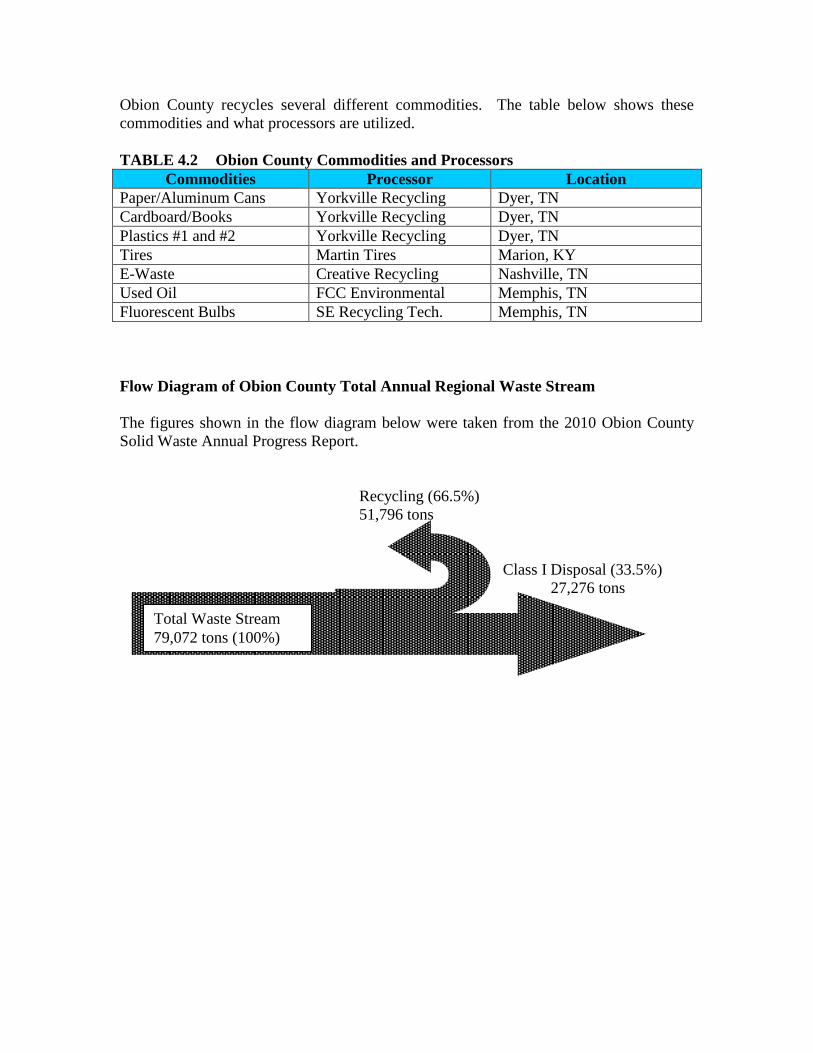
Obion County recycles several different commodities. The table below shows these
commodities and what processors are utilized.
TABLE 4.2 Obion County Commodities and Processors
Commodities Processor Location
Paper/Aluminum Cans Yorkville Recycling Dyer, TN
Cardboard/Books Yorkville Recycling Dyer, TN
Plastics #1 and #2 Yorkville Recycling Dyer, TN
Tires Martin Tires Marion, KY
E-Waste Creative Recycling Nashville, TN
Used Oil FCC Environmental Memphis, TN
Fluorescent Bulbs SE Recycling Tech. Memphis, TN
Flow Diagram of Obion County Total Annual Regional Waste Stream
The figures shown in the flow diagram below were taken from the 2010 Obion County
Solid Waste Annual Progress Report.
Recycling (66.5%)
51,796 tons
Class I Disposal (33.5%)
27,276 tons
Total Waste Stream
79,072 tons (100%)
SECTION 5:
SOLID WASTE MANAGEMENT INFRASTRUCTURE
Provide organizational charts of each county and municipality’s solid waste program and staff
arrangement. Identify needed positions, facilities, and equipment that a fully integrated solid waste system
would have to provide at a full level of service. Provide a scale county level map indicating location of all
facilities including convenience centers, transfer stations, recycling centers, waste tire drop-off sites, used
oil collection sites, paint recycling centers, all landfills, etc. Identify any shortcomings in service and note
what might be needed to fill this need.
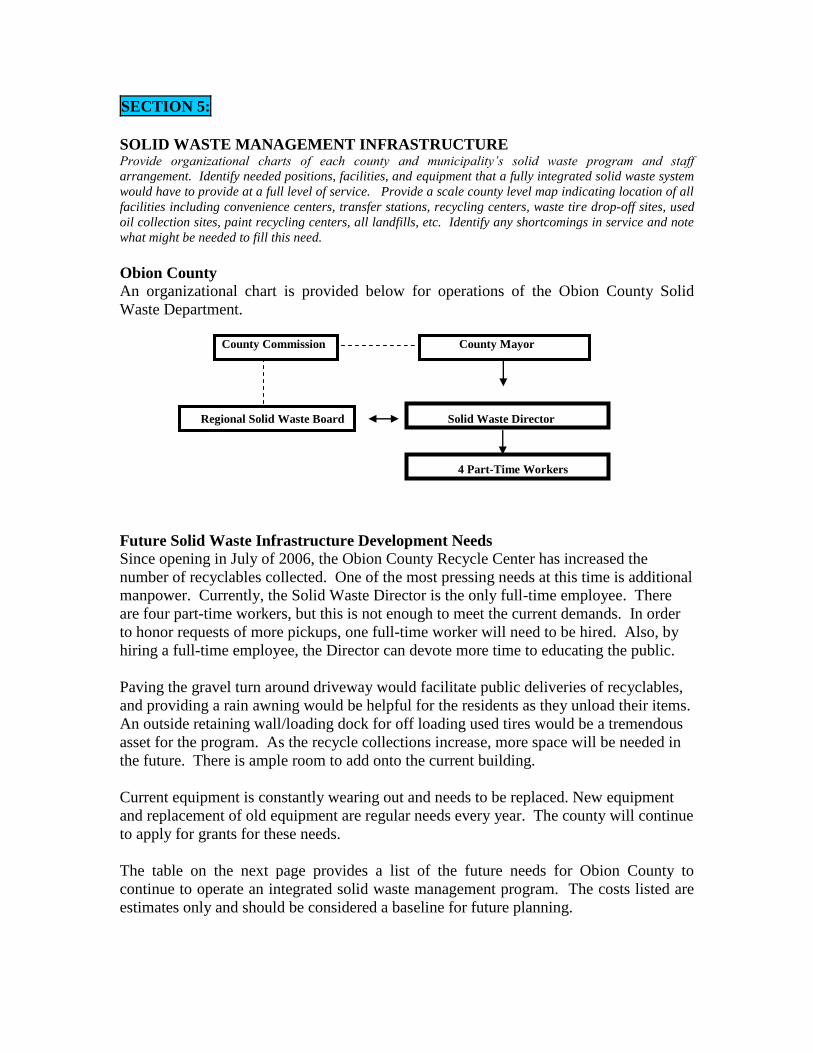
Obion County
An organizational chart is provided below for operations of the Obion County Solid
Waste Department.
County Commission County Mayor
Regional Solid Waste Board Solid Waste Director
4 Part-Time Workers
Future Solid Waste Infrastructure Development Needs
Since opening in July of 2006, the Obion County Recycle Center has increased the
number of recyclables collected. One of the most pressing needs at this time is additional
manpower. Currently, the Solid Waste Director is the only full-time employee. There
are four part-time workers, but this is not enough to meet the current demands. In order
to honor requests of more pickups, one full-time worker will need to be hired. Also, by
hiring a full-time employee, the Director can devote more time to educating the public.
Paving the gravel turn around driveway would facilitate public deliveries of recyclables,
and providing a rain awning would be helpful for the residents as they unload their items.
An outside retaining wall/loading dock for off loading used tires would be a tremendous
asset for the program. As the recycle collections increase, more space will be needed in
the future. There is ample room to add onto the current building.
Current equipment is constantly wearing out and needs to be replaced. New equipment
and replacement of old equipment are regular needs every year. The county will continue
to apply for grants for these needs.
The table on the next page provides a list of the future needs for Obion County to
continue to operate an integrated solid waste management program. The costs listed are
estimates only and should be considered a baseline for future planning.
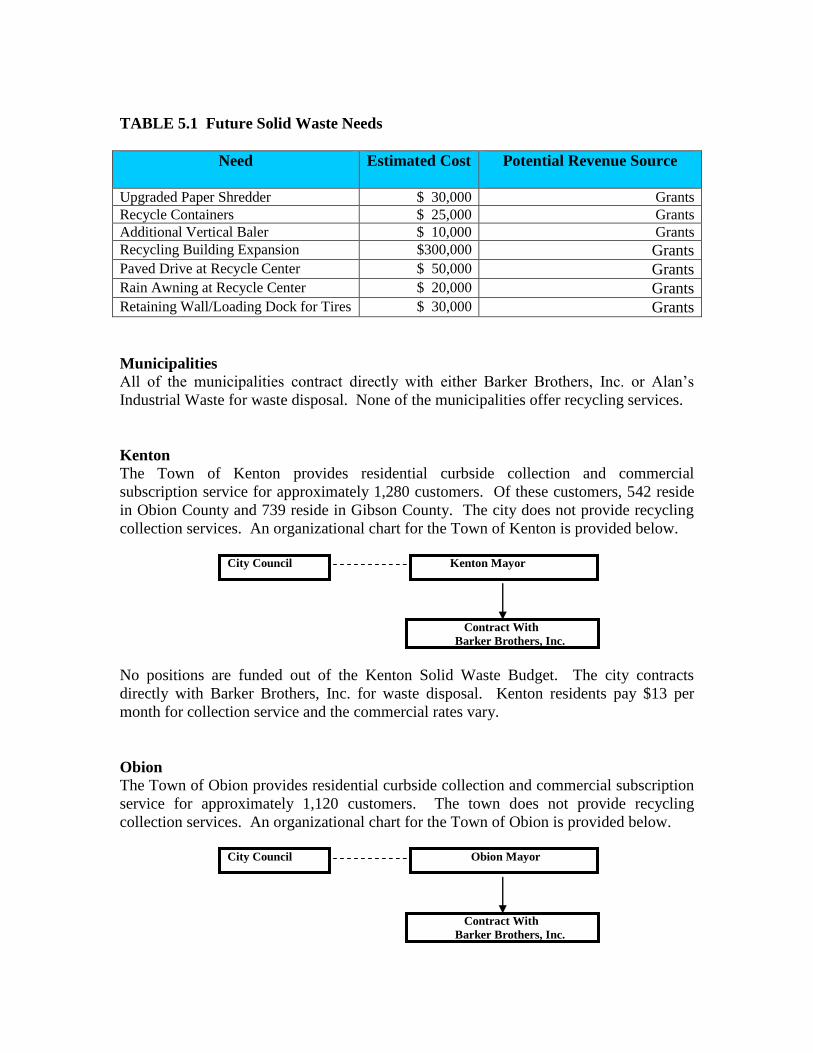
TABLE 5.1 Future Solid Waste Needs
Need Estimated Cost Potential Revenue Source
Upgraded Paper Shredder $ 30,000 Grants
Recycle Containers $ 25,000 Grants
Additional Vertical Baler $ 10,000 Grants
Recycling Building Expansion $300,000 Grants Paved Drive at Recycle Center $ 50,000 Grants Rain Awning at Recycle Center $ 20,000 Grants Retaining Wall/Loading Dock for Tires $ 30,000 Grants
Municipalities
All of the municipalities contract directly with either Barker Brothers, Inc. or Alan’s
Industrial Waste for waste disposal. None of the municipalities offer recycling services.
Kenton
The Town of Kenton provides residential curbside collection and commercial
subscription service for approximately 1,280 customers. Of these customers, 542 reside
in Obion County and 739 reside in Gibson County. The city does not provide recycling
collection services. An organizational chart for the Town of Kenton is provided below.
City Council Kenton Mayor
Contract With
Barker Brothers, Inc.
No positions are funded out of the Kenton Solid Waste Budget. The city contracts
directly with Barker Brothers, Inc. for waste disposal. Kenton residents pay $13 per
month for collection service and the commercial rates vary.
Obion
The Town of Obion provides residential curbside collection and commercial subscription
service for approximately 1,120 customers. The town does not provide recycling
collection services. An organizational chart for the Town of Obion is provided below.
City Council Obion Mayor
Contract With
Barker Brothers, Inc.
No positions are funded out of the Obion Solid Waste Budget. The city contracts directly
with Barker Brothers, Inc. for waste disposal. Obion residents pay $14.82 per month for
collection service and the commercial rates vary.
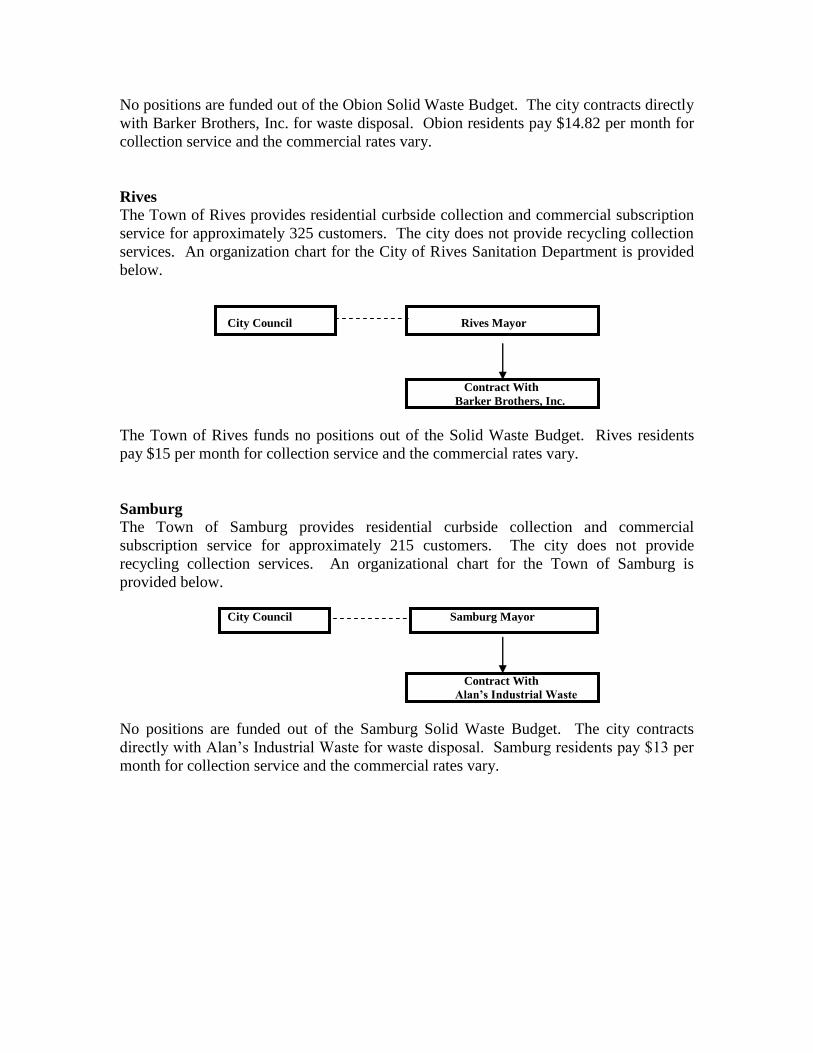
Rives
The Town of Rives provides residential curbside collection and commercial subscription
service for approximately 325 customers. The city does not provide recycling collection
services. An organization chart for the City of Rives Sanitation Department is provided
below.
City Council Rives Mayor
Contract With
Barker Brothers, Inc.
The Town of Rives funds no positions out of the Solid Waste Budget. Rives residents
pay $15 per month for collection service and the commercial rates vary.
Samburg
The Town of Samburg provides residential curbside collection and commercial
subscription service for approximately 215 customers. The city does not provide
recycling collection services. An organizational chart for the Town of Samburg is
provided below.
City Council Samburg Mayor
Contract With
Alan’s Industrial Waste
No positions are funded out of the Samburg Solid Waste Budget. The city contracts
directly with Alan’s Industrial Waste for waste disposal. Samburg residents pay $13 per
month for collection service and the commercial rates vary.
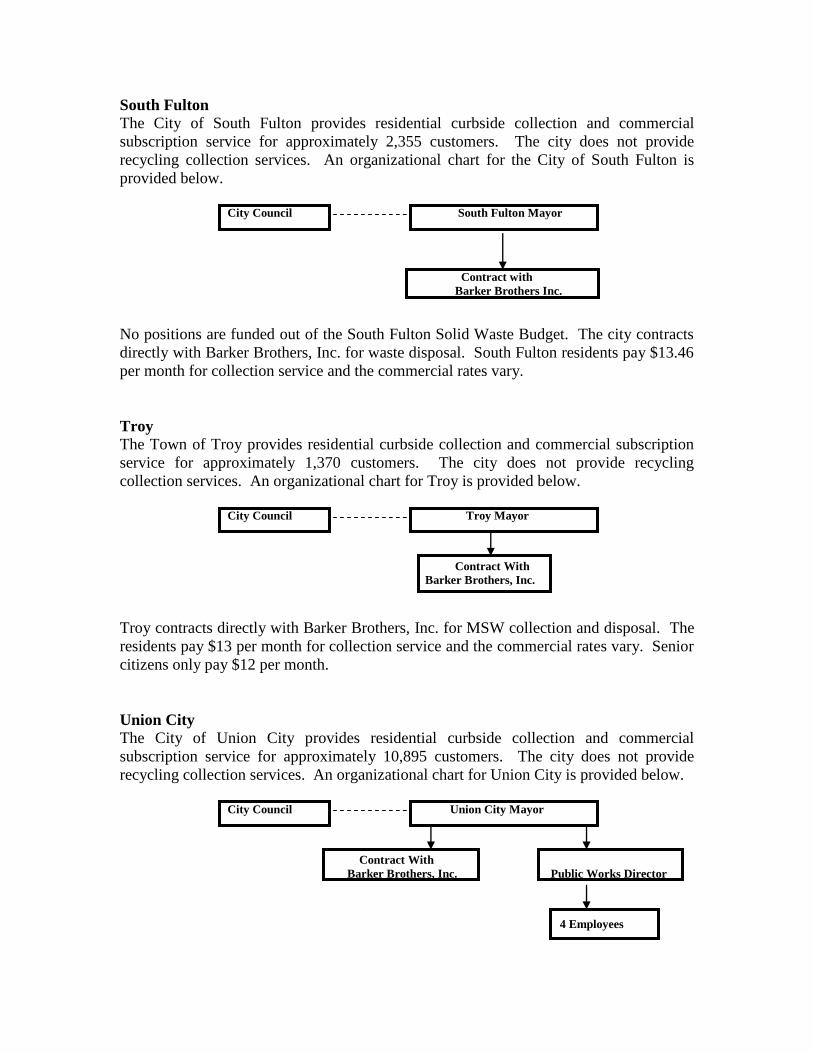
South Fulton
The City of South Fulton provides residential curbside collection and commercial
subscription service for approximately 2,355 customers. The city does not provide
recycling collection services. An organizational chart for the City of South Fulton is
provided below.
City Council South Fulton Mayor
Contract with
Barker Brothers Inc.
No positions are funded out of the South Fulton Solid Waste Budget. The city contracts
directly with Barker Brothers, Inc. for waste disposal. South Fulton residents pay $13.46
per month for collection service and the commercial rates vary.
Troy
The Town of Troy provides residential curbside collection and commercial subscription
service for approximately 1,370 customers. The city does not provide recycling
collection services. An organizational chart for Troy is provided below.
City Council Troy Mayor
Contract With
Barker Brothers, Inc.
Troy contracts directly with Barker Brothers, Inc. for MSW collection and disposal. The
residents pay $13 per month for collection service and the commercial rates vary. Senior
citizens only pay $12 per month.
Union City
The City of Union City provides residential curbside collection and commercial
subscription service for approximately 10,895 customers. The city does not provide
recycling collection services. An organizational chart for Union City is provided below.
City Council Union City Mayor
Contract With
Barker Brothers, Inc. Public Works Director
4 Employees
The city contracts directly with Barker Brothers, Inc. for waste disposal. Union City
residents pay $19 per month for collection service and the commercial rates vary. This
amount per month includes not only trash pickup, but also includes the removal of bulky
items, limb debris, and other items. The cost of the street sweeper is also included.
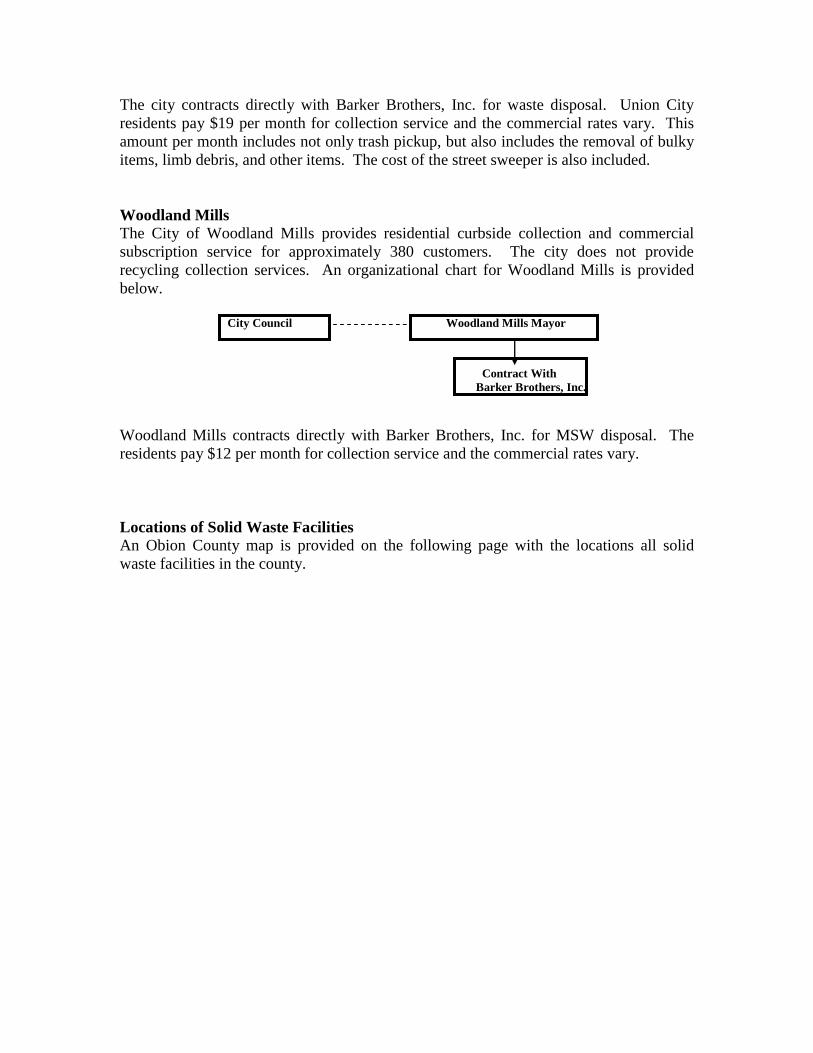
Woodland Mills
The City of Woodland Mills provides residential curbside collection and commercial
subscription service for approximately 380 customers. The city does not provide
recycling collection services. An organizational chart for Woodland Mills is provided
below.
City Council Woodland Mills Mayor
Contract With
Barker Brothers, Inc.
Woodland Mills contracts directly with Barker Brothers, Inc. for MSW disposal. The
residents pay $12 per month for collection service and the commercial rates vary.
Locations of Solid Waste Facilities
An Obion County map is provided on the following page with the locations all solid
waste facilities in the county.
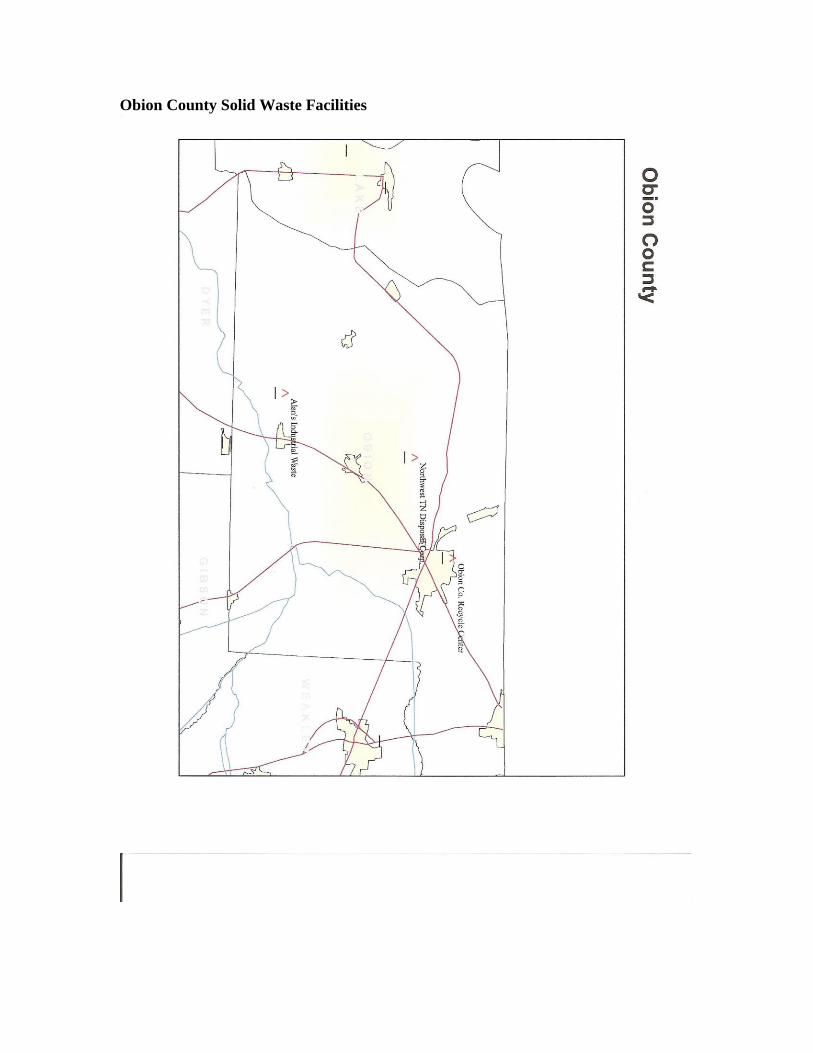
Obion County Solid Waste Facilities
SECTION 6:
PUBLIC PARTICIPATION Describe current attitudes of the region and its citizens towards recycling, waste diversion, and waste
disposal in general. Where recycling is provided, discuss participation within the region. Indicate current
and ongoing education measures to curb apathy or negative attitude towards waste reduction. Are
additional measures needed to change citizen’s behaviors? If so, what specific behaviors need to be
targeted and by what means?
Current Attitudes Concerning Recycling, Waste Diversion, and Waste Disposal
Trends are continuing to improve through education on solid waste, recycling, and
environmental issues. Industries are finding recycling a viable tool to reduce
expenditures while meeting State and Federal environmental mandates. The Obion
County Solid Waste Director has been instrumental in keeping the public apprised on
current issues.
Since 2006, the amount of MSW disposed in Class I landfills has significantly decreased.
In 2006, the amount of MSW disposed in Class I landfills was 47,289 tons. This figure
dropped to 35,292 in 2008. In the most recent Annual Progress Report (2010), the
amount of MSW disposed in Class I landfills was only 27,276 tons. These reductions
reflect how peoples’ attitudes about recycling, waste diversion, and waste disposal have
changed for the better.
Since opening in 2006, the Obion County Recycle Center has seen significant increases
in the amount of recyclables it handles each year. Each year, the Recycle Center adds
new commodities. In 2010, paint, #1 and #2 plastics, and fluorescent bulbs were added.
Directional signs were recently placed so people will have an easier time finding the
Recycle Center. Also, a large sign with the name of the Recycle Center will be placed on
the building in the very near future. Both of these measures will help bring in more
recyclables.
Education Measures
Tours are conducted at the Recycle Center to promote the program. Many student groups
and civic organizations partake of these tours. Numerous presentations are made to
various groups throughout the year. The Solid Waste Director utilizes the radio stations,
newspaper, and cable TV from time to time to help promote recycling, waste diversion
and special events like the HHW event. Handouts are also utilized to promote the HHW
event.
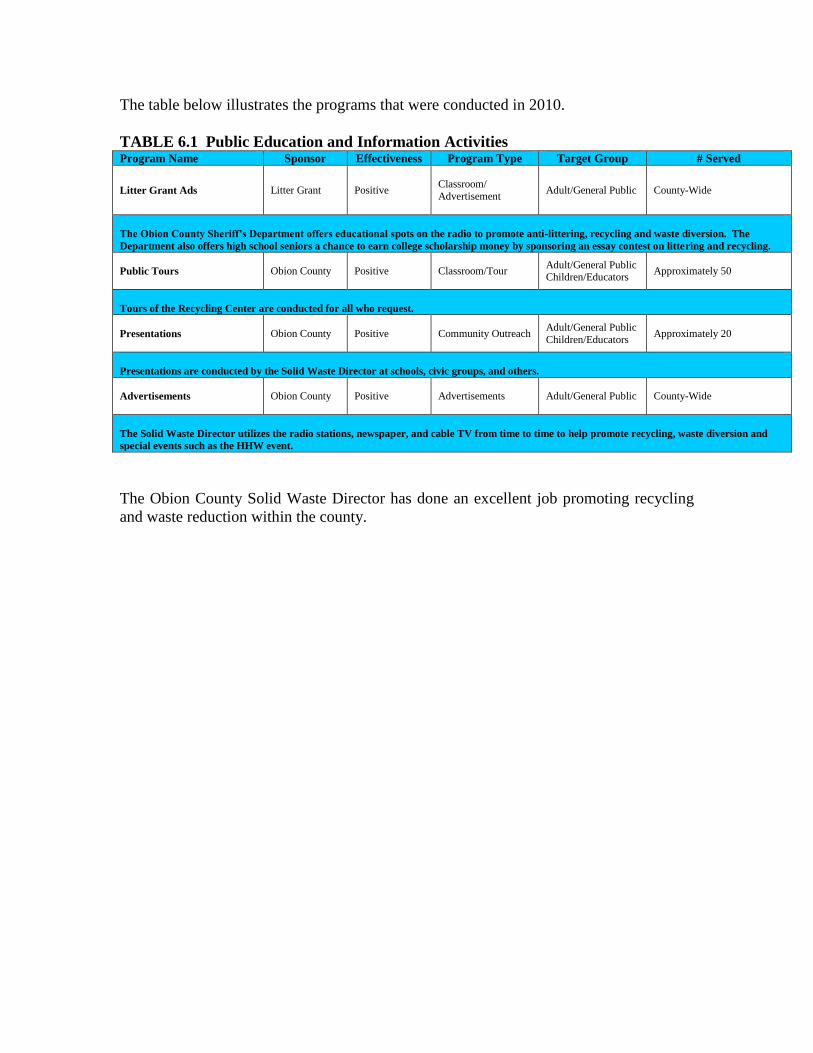
The table below illustrates the programs that were conducted in 2010.
TABLE 6.1 Public Education and Information Activities Program Name Sponsor Effectiveness Program Type Target Group # Served
Litter Grant Ads
Litter Grant Positive
Classroom/
Advertisement
Adult/General Public County-Wide
The Obion County Sheriff’s Department offers educational spots on the radio to promote anti-littering, recycling and waste diversion. The
Department also offers high school seniors a chance to earn college scholarship money by sponsoring an essay contest on littering and recycling.
Public Tours
Obion County Positive Classroom/Tour Adult/General Public Children/Educators
Approximately 50
Tours of the Recycling Center are conducted for all who request.
Presentations
Obion County Positive Community Outreach Adult/General Public
Children/Educators Approximately 20
Presentations are conducted by the Solid Waste Director at schools, civic groups, and others.
Advertisements
Obion County Positive Advertisements Adult/General Public County-Wide
The Solid Waste Director utilizes the radio stations, newspaper, and cable TV from time to time to help promote recycling, waste diversion and
special events such as the HHW event.
The Obion County Solid Waste Director has done an excellent job promoting recycling
and waste reduction within the county.
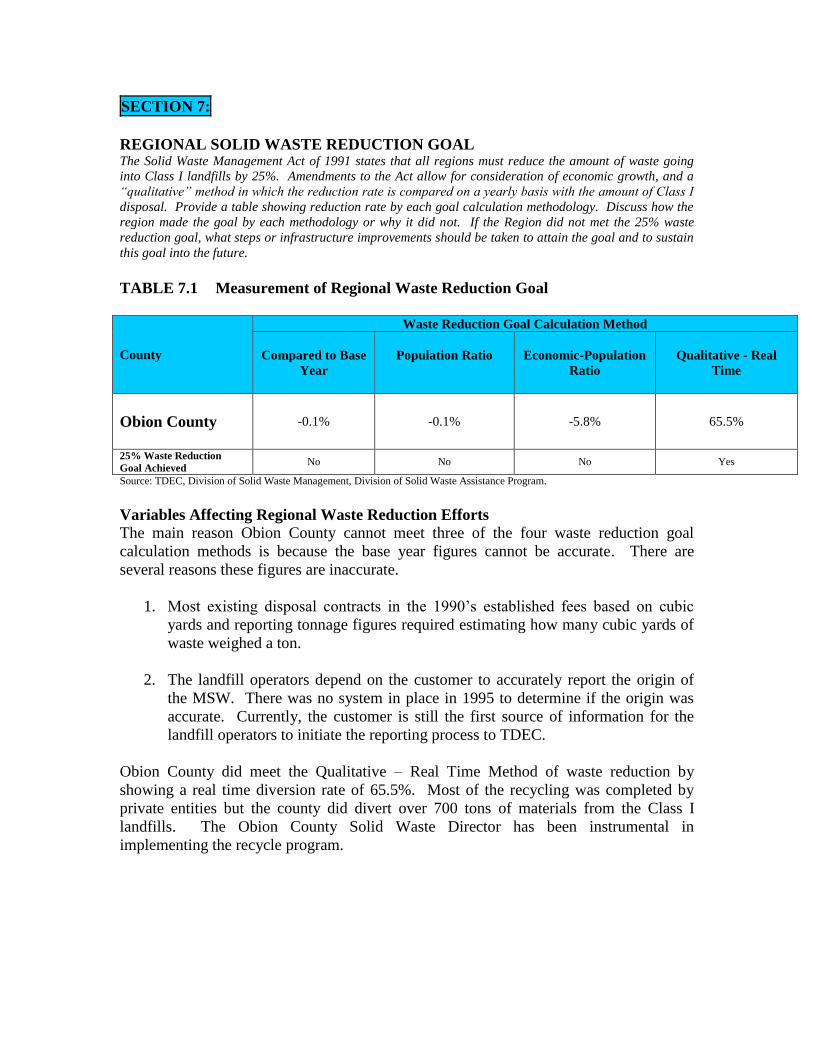
SECTION 7:
REGIONAL SOLID WASTE REDUCTION GOAL The Solid Waste Management Act of 1991 states that all regions must reduce the amount of waste going
into Class I landfills by 25%. Amendments to the Act allow for consideration of economic growth, and a
“qualitative” method in which the reduction rate is compared on a yearly basis with the amount of Class I
disposal. Provide a table showing reduction rate by each goal calculation methodology. Discuss how the
region made the goal by each methodology or why it did not. If the Region did not met the 25% waste
reduction goal, what steps or infrastructure improvements should be taken to attain the goal and to sustain
this goal into the future.
TABLE 7.1 Measurement of Regional Waste Reduction Goal
County
Waste Reduction Goal Calculation Method
Compared to Base
Year
Population Ratio
Economic-Population
Ratio
Qualitative - Real
Time
Obion County
-0.1% -0.1% -5.8% 65.5%
25% Waste Reduction
Goal Achieved No No No Yes
Source: TDEC, Division of Solid Waste Management, Division of Solid Waste Assistance Program.
Variables Affecting Regional Waste Reduction Efforts
The main reason Obion County cannot meet three of the four waste reduction goal
calculation methods is because the base year figures cannot be accurate. There are
several reasons these figures are inaccurate.
1. Most existing disposal contracts in the 1990’s established fees based on cubic
yards and reporting tonnage figures required estimating how many cubic yards of
waste weighed a ton.
2. The landfill operators depend on the customer to accurately report the origin of
the MSW. There was no system in place in 1995 to determine if the origin was
accurate. Currently, the customer is still the first source of information for the
landfill operators to initiate the reporting process to TDEC.
Obion County did meet the Qualitative – Real Time Method of waste reduction by
showing a real time diversion rate of 65.5%. Most of the recycling was completed by
private entities but the county did divert over 700 tons of materials from the Class I
landfills. The Obion County Solid Waste Director has been instrumental in
implementing the recycle program.
Future Regional Waste Reduction Program
No major changes need to be made to this successful program. One of the most pressing
needs at this time is additional manpower. Currently, the Solid Waste Director is the
only full-time employee. There are four part-time workers, but this is not enough to meet
the current demands. In order to honor requests of more pickups, one full-time worker
will need to be hired. Also, by hiring a full-time employee, the Director can devote more
time to educating the public.
Paving the gravel turn around driveway would facilitate public deliveries of recyclables,
and providing a rain awning would be helpful for the residents as they unload their items.
An outside retaining wall/loading dock for off loading used tires would be a tremendous
asset for the program. As the recycle collections increase, more space will be needed in
the future. There is ample room to add onto the current building.
Current equipment is constantly wearing out and needs to be replaced. New equipment
and replacement of old equipment are regular needs every year. The county will continue
to apply for grants for these needs.
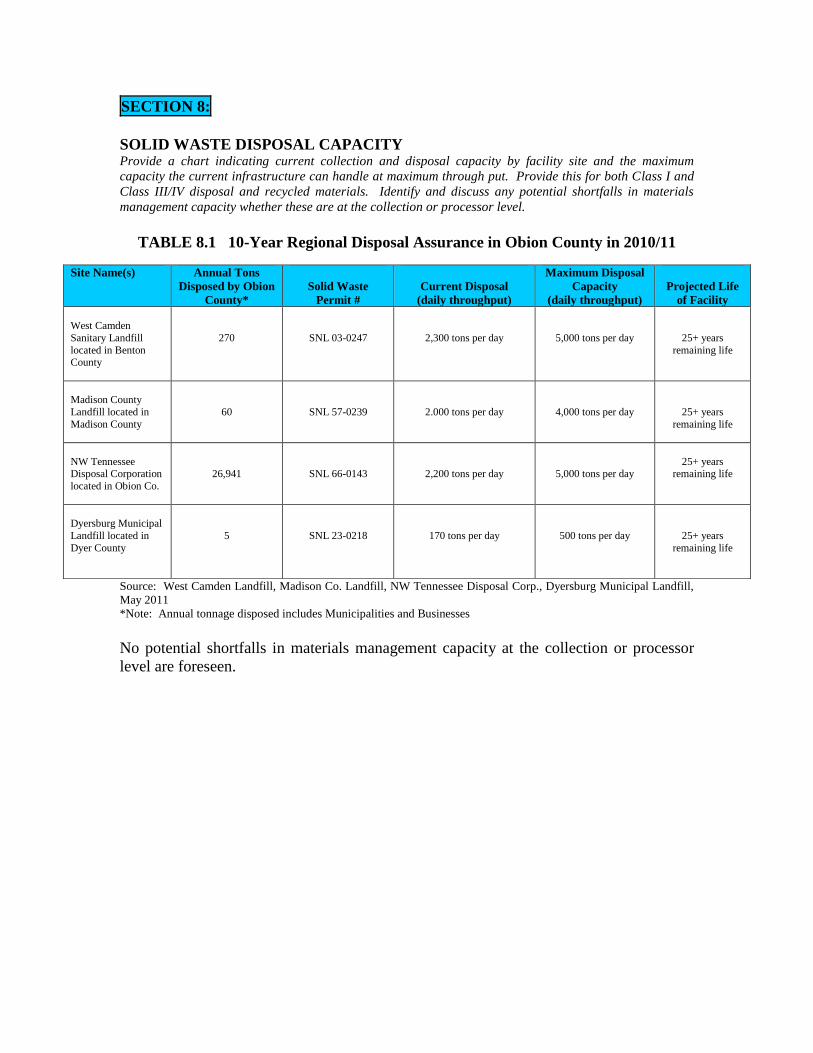
SECTION 8:
SOLID WASTE DISPOSAL CAPACITY Provide a chart indicating current collection and disposal capacity by facility site and the maximum
capacity the current infrastructure can handle at maximum through put. Provide this for both Class I and
Class III/IV disposal and recycled materials. Identify and discuss any potential shortfalls in materials
management capacity whether these are at the collection or processor level.
TABLE 8.1 10-Year Regional Disposal Assurance in Obion County in 2010/11
Source: West Camden Landfill, Madison Co. Landfill, NW Tennessee Disposal Corp., Dyersburg Municipal Landfill,
May 2011
*Note: Annual tonnage disposed includes Municipalities and Businesses
No potential shortfalls in materials management capacity at the collection or processor
level are foreseen.
Site Name(s) Annual Tons
Disposed by Obion
County*
Solid Waste
Permit #
Current Disposal
(daily throughput)
Maximum Disposal
Capacity
(daily throughput)
Projected Life
of Facility
West Camden
Sanitary Landfill
located in Benton County
270
SNL 03-0247
2,300 tons per day
5,000 tons per day
25+ years
remaining life
Madison County
Landfill located in
Madison County
60
SNL 57-0239
2.000 tons per day
4,000 tons per day
25+ years
remaining life
NW Tennessee Disposal Corporation
located in Obion Co.
26,941
SNL 66-0143
2,200 tons per day
5,000 tons per day
25+ years remaining life
Dyersburg Municipal
Landfill located in
Dyer County
5
SNL 23-0218
170 tons per day
500 tons per day
25+ years
remaining life
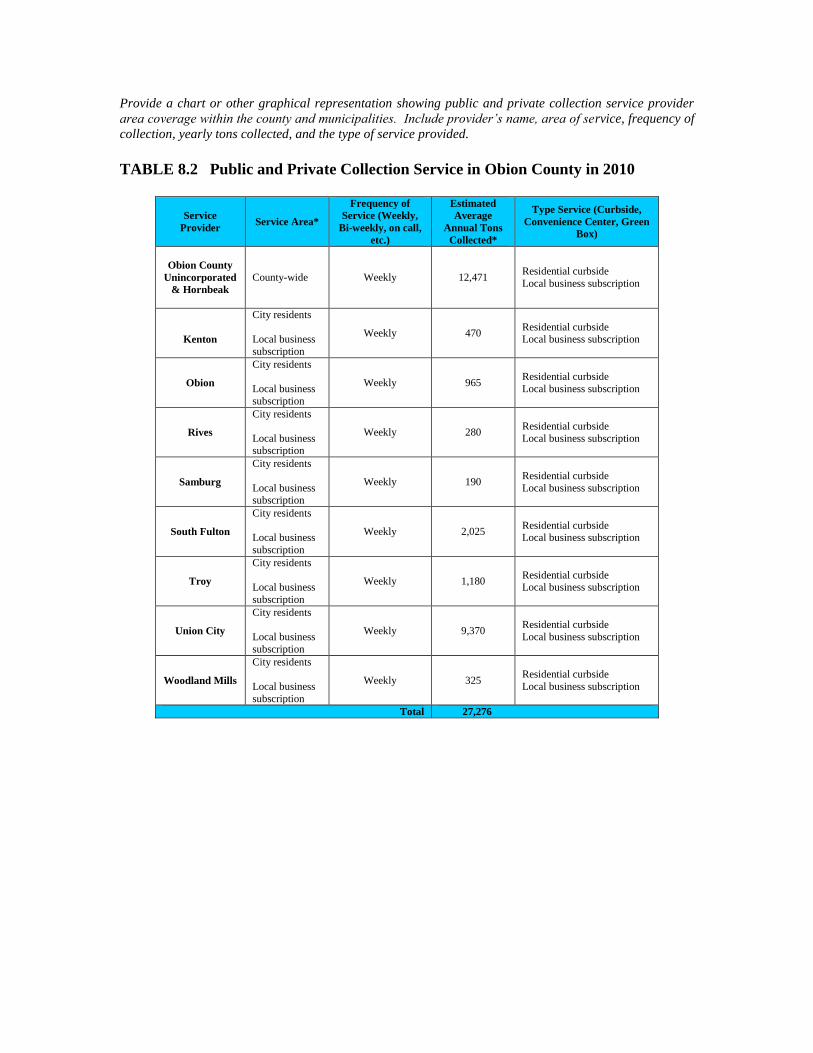
Provide a chart or other graphical representation showing public and private collection service provider
area coverage within the county and municipalities. Include provider’s name, area of service, frequency of
collection, yearly tons collected, and the type of service provided.
TABLE 8.2 Public and Private Collection Service in Obion County in 2010
Service
Provider Service Area*
Frequency of
Service (Weekly,
Bi-weekly, on call,
etc.)
Estimated
Average
Annual Tons
Collected*
Type Service (Curbside,
Convenience Center, Green
Box)
Obion County
Unincorporated
& Hornbeak
County-wide Weekly 12,471 Residential curbside
Local business subscription
Kenton
City residents
Local business
subscription
Weekly 470 Residential curbside Local business subscription
Obion
City residents
Local business
subscription
Weekly 965 Residential curbside
Local business subscription
Rives
City residents
Local business subscription
Weekly 280 Residential curbside
Local business subscription
Samburg
City residents
Local business subscription
Weekly 190 Residential curbside
Local business subscription
South Fulton
City residents
Local business
subscription
Weekly 2,025 Residential curbside Local business subscription
Troy
City residents
Local business
subscription
Weekly 1,180 Residential curbside Local business subscription
Union City
City residents
Local business
subscription
Weekly 9,370 Residential curbside
Local business subscription
Woodland Mills
City residents
Local business
subscription
Weekly 325 Residential curbside
Local business subscription
Total 27,276
SECTION 9:
UNMET FINANCIAL NEEDS Complete the chart below and discuss unmet financial needs to maintain current level of service. Provide a
cost summary for current year expenditures and projected increased costs for unmet needs.
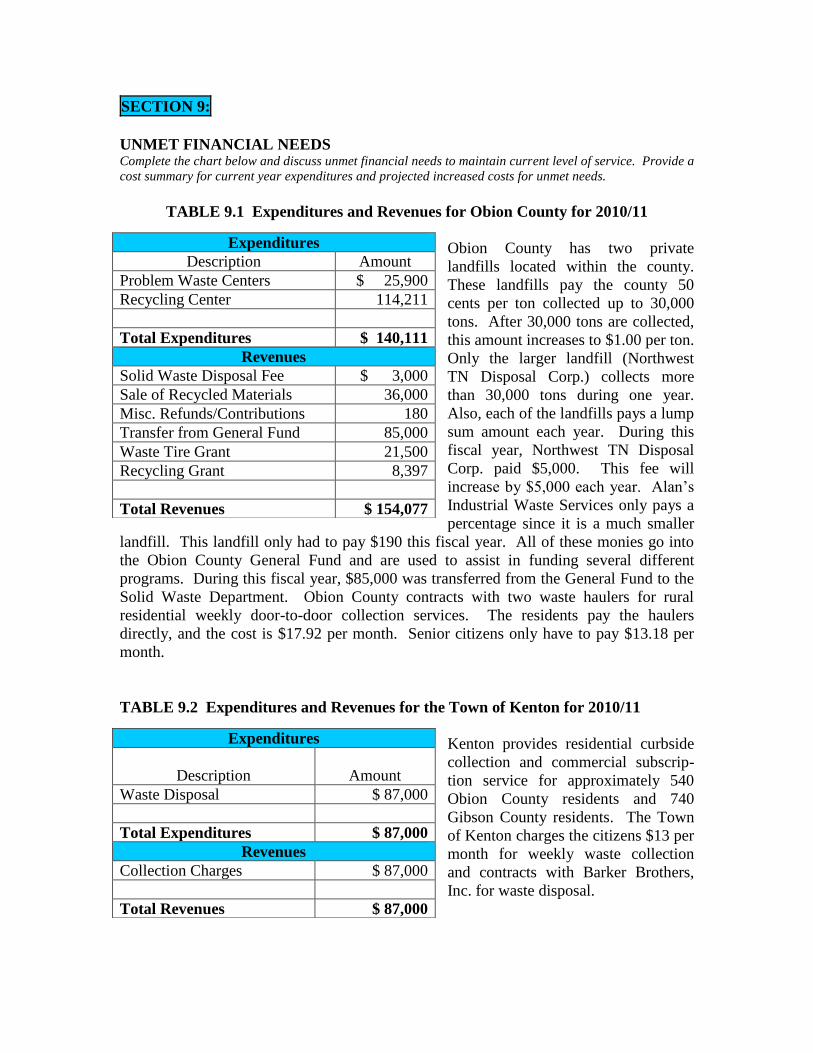
TABLE 9.1 Expenditures and Revenues for Obion County for 2010/11
Obion County has two private
landfills located within the county.
These landfills pay the county 50
cents per ton collected up to 30,000
tons. After 30,000 tons are collected,
this amount increases to $1.00 per ton.
Only the larger landfill (Northwest
TN Disposal Corp.) collects more
than 30,000 tons during one year.
Also, each of the landfills pays a lump
sum amount each year. During this
fiscal year, Northwest TN Disposal
Corp. paid $5,000. This fee will
increase by $5,000 each year. Alan’s
Industrial Waste Services only pays a
percentage since it is a much smaller
landfill. This landfill only had to pay $190 this fiscal year. All of these monies go into
the Obion County General Fund and are used to assist in funding several different
programs. During this fiscal year, $85,000 was transferred from the General Fund to the
Solid Waste Department. Obion County contracts with two waste haulers for rural
residential weekly door-to-door collection services. The residents pay the haulers
directly, and the cost is $17.92 per month. Senior citizens only have to pay $13.18 per
month.
TABLE 9.2 Expenditures and Revenues for the Town of Kenton for 2010/11
Kenton provides residential curbside
collection and commercial subscrip-
tion service for approximately 540
Obion County residents and 740
Gibson County residents. The Town
of Kenton charges the citizens $13 per
month for weekly waste collection
and contracts with Barker Brothers,
Inc. for waste disposal.
Expenditures
Description Amount
Problem Waste Centers $ 25,900
Recycling Center 114,211
Total Expenditures $ 140,111
Revenues
Solid Waste Disposal Fee $ 3,000
Sale of Recycled Materials 36,000
Misc. Refunds/Contributions 180
Transfer from General Fund 85,000
Waste Tire Grant 21,500
Recycling Grant 8,397
Total Revenues $ 154,077
Expenditures
Description
Amount
Waste Disposal $ 87,000
Total Expenditures $ 87,000
Revenues
Collection Charges $ 87,000
Total Revenues $ 87,000
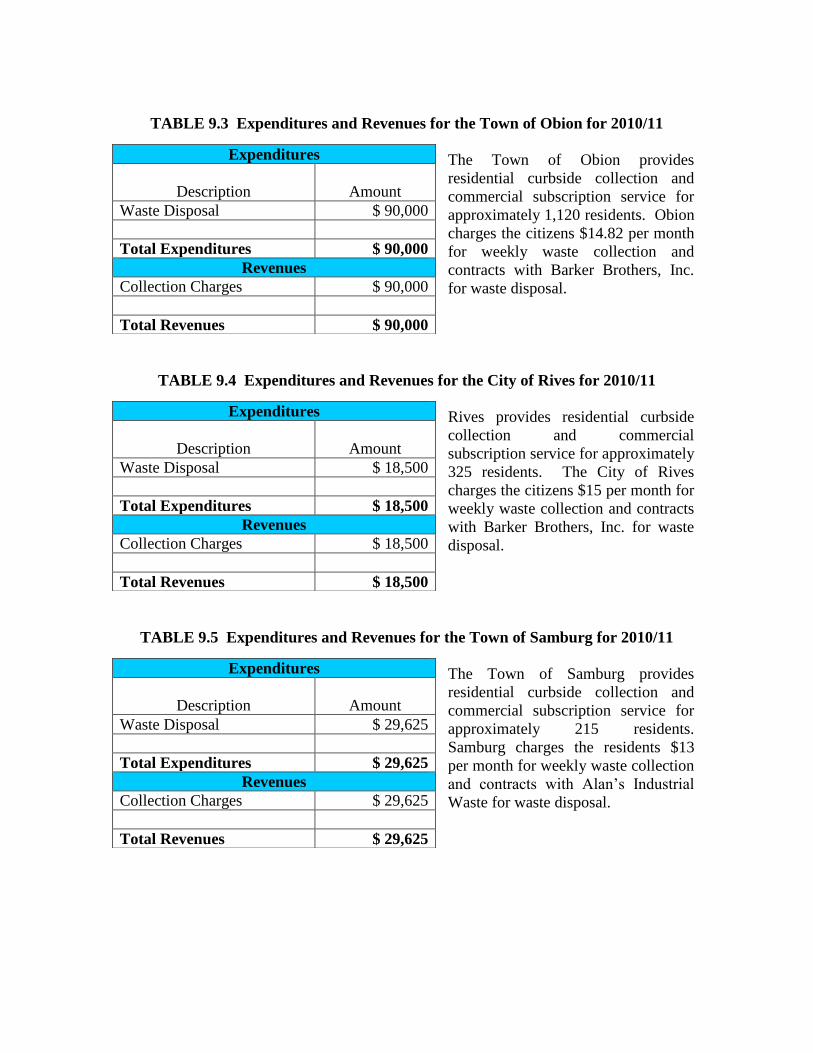
TABLE 9.3 Expenditures and Revenues for the Town of Obion for 2010/11
The Town of Obion provides
residential curbside collection and
commercial subscription service for
approximately 1,120 residents. Obion
charges the citizens $14.82 per month
for weekly waste collection and
contracts with Barker Brothers, Inc.
for waste disposal.
TABLE 9.4 Expenditures and Revenues for the City of Rives for 2010/11
Rives provides residential curbside
collection and commercial
subscription service for approximately
325 residents. The City of Rives
charges the citizens $15 per month for
weekly waste collection and contracts
with Barker Brothers, Inc. for waste
disposal.
TABLE 9.5 Expenditures and Revenues for the Town of Samburg for 2010/11
The Town of Samburg provides
residential curbside collection and
commercial subscription service for
approximately 215 residents.
Samburg charges the residents $13
per month for weekly waste collection
and contracts with Alan’s Industrial
Waste for waste disposal.
Expenditures
Description
Amount
Waste Disposal $ 90,000
Total Expenditures $ 90,000
Revenues
Collection Charges $ 90,000
Total Revenues $ 90,000
Expenditures
Description
Amount
Waste Disposal $ 18,500
Total Expenditures $ 18,500
Revenues
Collection Charges $ 18,500
Total Revenues $ 18,500
Expenditures
Description
Amount
Waste Disposal $ 29,625
Total Expenditures $ 29,625
Revenues
Collection Charges $ 29,625
Total Revenues $ 29,625
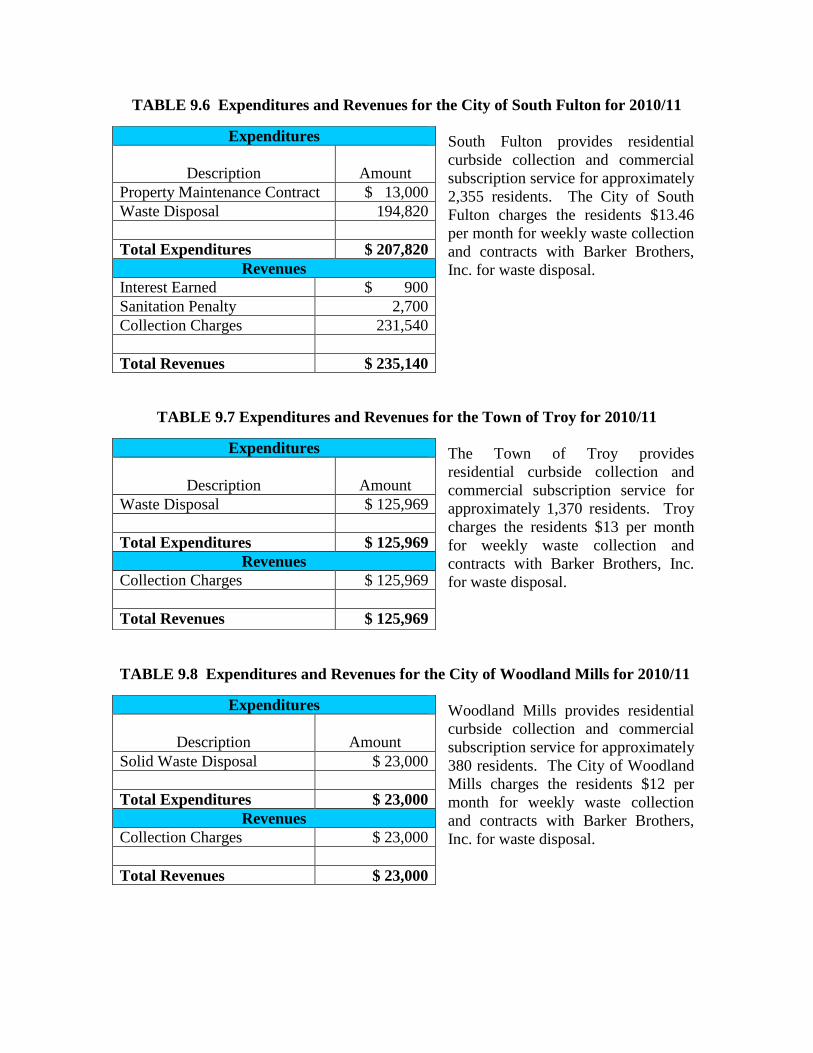
TABLE 9.6 Expenditures and Revenues for the City of South Fulton for 2010/11
South Fulton provides residential
curbside collection and commercial
subscription service for approximately
2,355 residents. The City of South
Fulton charges the residents $13.46
per month for weekly waste collection
and contracts with Barker Brothers,
Inc. for waste disposal.
TABLE 9.7 Expenditures and Revenues for the Town of Troy for 2010/11
The Town of Troy provides
residential curbside collection and
commercial subscription service for
approximately 1,370 residents. Troy
charges the residents $13 per month
for weekly waste collection and
contracts with Barker Brothers, Inc.
for waste disposal.
TABLE 9.8 Expenditures and Revenues for the City of Woodland Mills for 2010/11
Woodland Mills provides residential
curbside collection and commercial
subscription service for approximately
380 residents. The City of Woodland
Mills charges the residents $12 per
month for weekly waste collection
and contracts with Barker Brothers,
Inc. for waste disposal.
Expenditures
Description
Amount
Property Maintenance Contract $ 13,000
Waste Disposal 194,820
Total Expenditures $ 207,820
Revenues
Interest Earned $ 900
Sanitation Penalty 2,700
Collection Charges 231,540
Total Revenues $ 235,140
Expenditures
Description
Amount
Waste Disposal $ 125,969
Total Expenditures $ 125,969
Revenues
Collection Charges $ 125,969
Total Revenues $ 125,969
Expenditures
Description
Amount
Solid Waste Disposal $ 23,000
Total Expenditures $ 23,000
Revenues
Collection Charges $ 23,000
Total Revenues $ 23,000
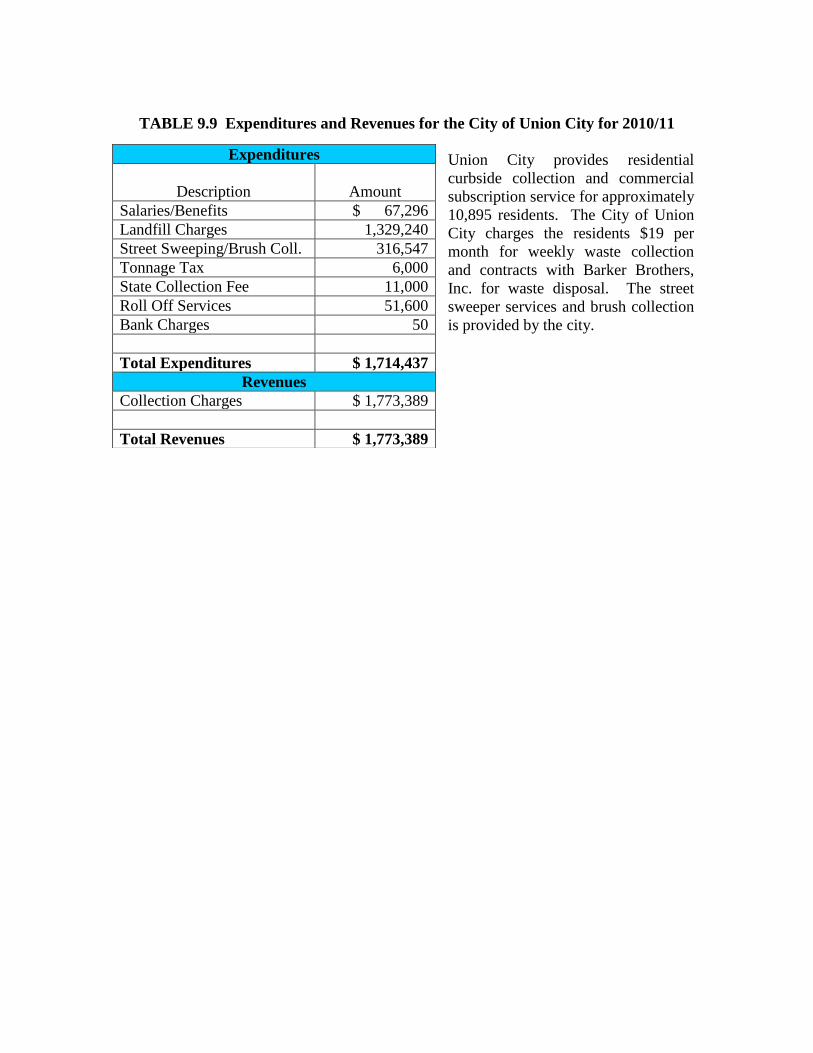
TABLE 9.9 Expenditures and Revenues for the City of Union City for 2010/11
Union City provides residential
curbside collection and commercial
subscription service for approximately
10,895 residents. The City of Union
City charges the residents $19 per
month for weekly waste collection
and contracts with Barker Brothers,
Inc. for waste disposal. The street
sweeper services and brush collection
is provided by the city.
Expenditures
Description
Amount
Salaries/Benefits $ 67,296
Landfill Charges 1,329,240
Street Sweeping/Brush Coll. 316,547
Tonnage Tax 6,000
State Collection Fee 11,000
Roll Off Services 51,600
Bank Charges 50
Total Expenditures $ 1,714,437
Revenues
Collection Charges $ 1,773,389
Total Revenues $ 1,773,389
SECTION 10:
CURRENT REVENUE SOURCES Identify all current revenue sources by county and municipality that are used for materials and solid waste
management. Project future revenue needs from these categories and discuss how this need will be met in
the future.
Obion County
The current Obion County Solid Waste budget is funded through disposal fees, sale of
recycled materials, and solid waste grants. The remaining funds are transferred from the
General Fund, which is the county’s primary operating fund. It accounts for all financial
resources of the general government, except those that are required to be accounted for in
another fund. The monies received from the two private landfills go into the General
Fund.
The 2010 Obion County property tax rate is $1.9500. Each municipality has its own tax
rate, and these rates range from a low of $0.6500 to a high of $2.1100. The local option
sales tax is at the maximum rate of 2.75%.
Due to the current recession, unemployment rates are expected to increase and local
option sales tax to decrease. Monies are very tight within the county at the present time.
The only revenue sources for the county to utilize in these hard economic times are grants
for solid waste management and/or waste diversion. Hopefully, if these grants are
offered, Obion County will be able to continue to fund a fully integrated solid waste
program.
The Waste Tire Grant is sufficient to fund the county’s waste tires if the county could
receive the entire amount of the budgeted grant. When manifests are reduced or changed,
the county has to make up the difference with county funds.
Kenton
Kenton provides residential curbside collection and commercial subscription service for
approximately 540 Obion County residents and 740 Gibson County residents. Kenton
charges the citizens $13 per month for weekly waste collection and contracts with Barker
Brothers, Inc. for waste disposal. The only revenue sources are the fees the city collects
from the residents.
Obion
The Town of Obion provides residential curbside collection and commercial subscription
service for approximately 1,120 residents. Obion charges the citizens $14.82 per month
for weekly waste collection and contracts with Barker Brothers, Inc. for waste disposal.
The only revenue sources are the fees the city collects from the residents.
Rives
Rives provides residential curbside collection and commercial subscription service for
approximately 325 residents. Rives charges the citizens $15 per month for weekly waste
collection and contracts with Barker Brothers, Inc. for waste disposal. The only revenue
sources are the fees the city collects from the residents.
Samburg
Samburg provides residential curbside collection and commercial subscription service for
approximately 215 residents. Samburg charges the residents $13 per month for weekly
waste collection and contracts with Alan’s Industrial Waste Services for waste disposal.
The only revenue sources are the fees the city collects from the residents.
South Fulton
South Fulton provides residential curbside collection and commercial subscription
service for approximately 2,355 residents. South Fulton charges the residents $13.46 per
month for weekly waste collection and contracts with Barker Brothers, Inc. for waste
disposal. The collection fees that the city collects from the residents are the bulk of the
revenue sources for the Solid Waste/Sanitation Department.
Troy
Troy provides residential curbside collection and commercial subscription service for
approximately 1,370 residents. Troy charges the residents $13 per month for weekly
waste collection and contracts with Barker Brothers, Inc. for waste disposal. The only
revenue sources are the fees the city collects from the residents.
Union City
Union City provides residential curbside collection and commercial subscription service
for approximately 10,895 residents. Union City charges the residents $19 per month for
weekly waste collection and contracts with Barker Brothers, Inc. for waste disposal.
These fees also provide street sweeper services and curbside brush pickup. The only
revenue sources are the fees the city collects from the residents.
Woodland Mills
Woodland Mills provides residential curbside collection and commercial subscription
service for approximately 380 residents. Woodland Mills charges the residents $12 for
weekly waste collection and recyclables collection. The city contracts with Barker
Brothers, Inc. for solid waste disposal.
FUTURE REVENUE NEEDS
No additional funds from the county budget are expected to be allocated for solid waste
or recycling purposes due to the economic conditions of the county. Solid waste grants
will be necessary for the future success of the program.
The municipalities will continue to adjust their collection fees in proportion to the
increases of the private hauler fees and other costs.
SECTION 11:
REGIONAL SOLID WASTE PLAN Discuss this region’s plan for managing their solid waste management system for the next five (5) years.
Identify any deficiencies and suggest recommendations to eliminate deficiencies and provide sustainability
of the system for the next five (5) years. Show how the region’s plan supports the Statewide Solid Waste
Management Plan.
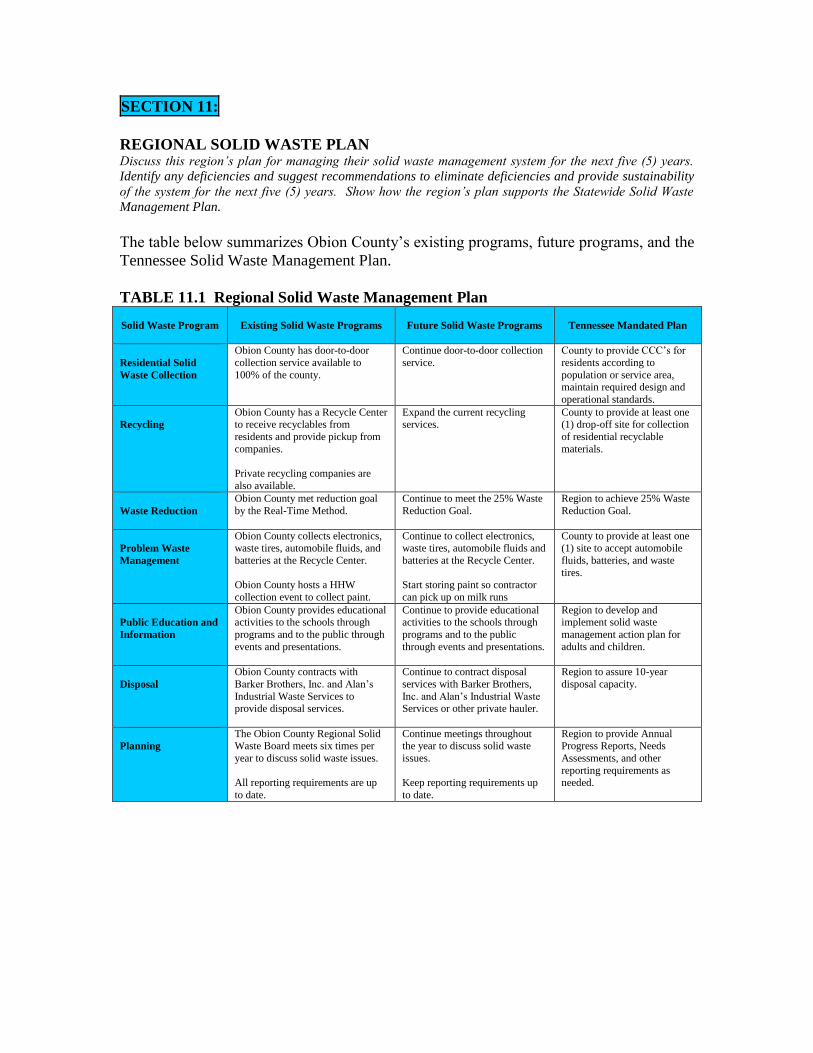
The table below summarizes Obion County’s existing programs, future programs, and the
Tennessee Solid Waste Management Plan.
TABLE 11.1 Regional Solid Waste Management Plan
Solid Waste Program
Existing Solid Waste Programs
Future Solid Waste Programs
Tennessee Mandated Plan
Residential Solid
Waste Collection
Obion County has door-to-door
collection service available to
100% of the county.
Continue door-to-door collection
service.
County to provide CCC’s for
residents according to
population or service area, maintain required design and
operational standards.
Recycling
Obion County has a Recycle Center to receive recyclables from
residents and provide pickup from
companies.
Private recycling companies are
also available.
Expand the current recycling services.
County to provide at least one (1) drop-off site for collection
of residential recyclable
materials.
Waste Reduction
Obion County met reduction goal
by the Real-Time Method.
Continue to meet the 25% Waste
Reduction Goal.
Region to achieve 25% Waste
Reduction Goal.
Problem Waste
Management
Obion County collects electronics,
waste tires, automobile fluids, and
batteries at the Recycle Center.
Obion County hosts a HHW
collection event to collect paint.
Continue to collect electronics,
waste tires, automobile fluids and
batteries at the Recycle Center.
Start storing paint so contractor
can pick up on milk runs
County to provide at least one
(1) site to accept automobile
fluids, batteries, and waste
tires.
Public Education and
Information
Obion County provides educational activities to the schools through
programs and to the public through
events and presentations.
Continue to provide educational activities to the schools through
programs and to the public
through events and presentations.
Region to develop and implement solid waste
management action plan for
adults and children.
Disposal
Obion County contracts with
Barker Brothers, Inc. and Alan’s
Industrial Waste Services to provide disposal services.
Continue to contract disposal
services with Barker Brothers,
Inc. and Alan’s Industrial Waste Services or other private hauler.
Region to assure 10-year
disposal capacity.
Planning
The Obion County Regional Solid Waste Board meets six times per
year to discuss solid waste issues.
All reporting requirements are up
to date.
Continue meetings throughout the year to discuss solid waste
issues.
Keep reporting requirements up
to date.
Region to provide Annual Progress Reports, Needs
Assessments, and other
reporting requirements as needed.
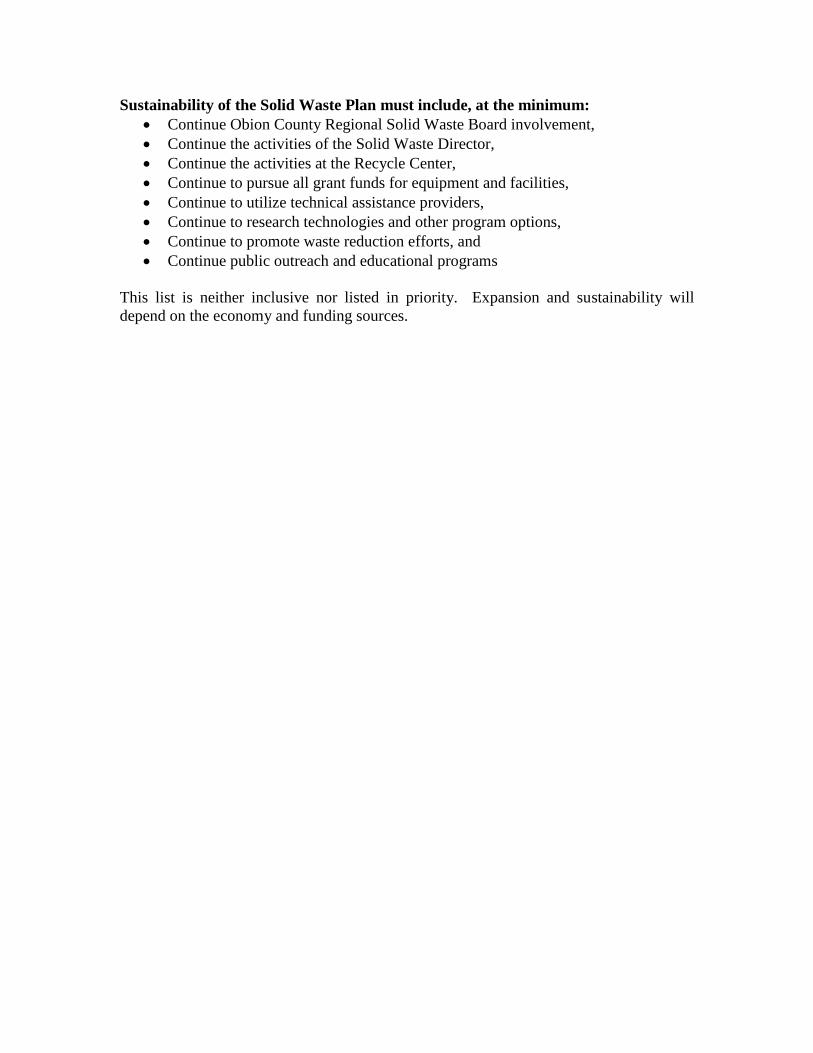
Sustainability of the Solid Waste Plan must include, at the minimum:
Continue Obion County Regional Solid Waste Board involvement,
Continue the activities of the Solid Waste Director,
Continue the activities at the Recycle Center,
Continue to pursue all grant funds for equipment and facilities,
Continue to utilize technical assistance providers,
Continue to research technologies and other program options,
Continue to promote waste reduction efforts, and
Continue public outreach and educational programs
This list is neither inclusive nor listed in priority. Expansion and sustainability will
depend on the economy and funding sources.
SOURCES
U. S. Census Bureau
Tennessee Department of Labor and Workforce Development
U. S. Bureau of Economic Analysis
Tennessee Department of Revenue
2010 Obion County Annual Progress Report
Mike Cary, Obion County Solid Waste Director
Obion County Budget Document
Kenton Budget Document
Obion Budget Document
Rives Budget Document
Samburg Budget Document
South Fulton Budget Document
Troy Budget Document
Union City Budget Document
Woodland Mills Budget Document