benthic denitrification and nitrogen cycling at the slope and rise of the n.w. european continental...
TRANSCRIPT

Progress in Oceanography 42 (1998) 111–126
Benthic denitrification and nitrogen cycling atthe slope and rise of the N.W. European
Continental Margin (Goban Spur)
W. Balzera,*, W. Helderb, E. Eppingb, L. Lohseb, S. Ottoa
aFB2-Marine Chemistry, University of Bremen, PF 330440, 28334 Bremen, GermanybNetherlands Institute of Sea Research (NIOZ), 1790 Ab Den Burg, Texel, The Netherlands
Abstract
The rate of benthic denitrification in slope and rise sediments of a transect across the N.W.European Continental Margin (Goban Spur) was evaluated from 31 pore water nitrate profilesobtained during six cruises between May and October. All profiles had well separated zonesof nitrification and denitrification. High near-surface nitrate concentrations prevented the influxof nitrate from the bottom water. The denitrification rates obtained from steady-state-modellingranged from 0.13 to 2.56mmol N cm−2 y−1 and showed an exponential increase both withdecreasing water depth and with increasing rate of organic carbon degradation. Denitrificationrates in a nearby canyon, which did not follow these relationships, were estimated to be muchhigher as a result of erosion and redistribution of organic matter. Denitrification at the GobanSpur slope and rise is much lower than previously reported for similar environments in thePacific resulting predominantly from the different oxygen and nitrate concentrations in thebottom water. A weighted average for the whole slope and rise sediment system shows that17% of the particulate organic nitrogen input (8.93mmol N cm−2 y−1) is denitrified and only1% is buried, the rest being released as nitrate. Although being ten times higher comparedwith basin sediments, denitrification on the slope and rise is several times lower than on theadjacent shelf. 1998 Elsevier Science Ltd. All rights reserved.
1. Introduction
Reactive nitrogen, thereby excluding nitrogen gas, is a key element of many bio-geochemical processes and can be a limiting element of aquatic ecosystem processes
* Corresponding author.
0079-6611/98/$ - see front matter 1998 Published by Elsevier Science Ltd. All rights reserved.PII: S0079 -6611(98)00030-5

112 W. Balzer et al. /Progress in Oceanography 42 (1998) 111–126
(Schlesinger, 1991; Wollast, 1991). The present-day oceanic nitrogen budget seemsto be out of balance because the rates of removal greatly exceed the supply of nitro-gen to the ocean (Christensen, 1994; Middelburg, Soetaert, Herman, & Heip, 1996;Galloway, Howarth, Michaels, Nixon, Prospero, & Dentener, 1996). Oceanic sinksof nitrogen include burial in the sediments and denitrification both in the water col-umn and in the sediments. A recent study (Middelburg, Soetaert, & Herman, 1997;see also for a review of oceanic nitrogen budgets), suggests that sedimentary denitri-fication may remove reactive nitrogen globally at rates of 203 1012 mol y−1 withabout 73 1012 mol y−1 occurring on the shelf. Gross budgets of the North Atlanticand its watershed suggest that shelf denitrification removes not only most of thetremendous anthropogenic load but even requires an equally high across-shelf supplyof nitrate from the open ocean (Galloway et al., 1996). Although sediments arecommonly thought of as sources of inorganic nitrogen to the overlying water throughremineralization, they also serve as sinks for both externally supplied and regeneratednitrogen via denitrification (Seitzinger, 1988; Seitzinger & Giblin, 1996).
Sediments becoming suboxic close to the interface, remove reactive nitrogen bydenitrification from the biogenically available pool (e.g. Froelich, Klinkhammer,Bender, Luedtke, Heath, Cullen, Dauphin, Hammond, Hartmann, & Maynard, 1979).The intensity of denitrification depends on the prevalence of slightly reducing con-ditions for denitrifying bacteria to become active. The nitrate can be supplied to thesediments either directly from the overlying water or through previous nitrificationin the sediments of ammonia released during the degradation of organic matter. Thelatter process of coupled nitrification/denitrification requires a certain supply of oxy-gen to adjacent sediment layers. The nearby presence of oxygen may stimulate deni-trification because it furnishes nitrate to sediment layers where denitrification occurs(Jenkins & Kemp, 1984; Seitzinger, 1988; Devol & Christensen, 1993). On the otherhand, if the oxygen supply is low and the organic matter supply is very high, oxygenconsumption might be so rapid that the sediments turn anoxic close to the surfaceand partly cause organic nitrogen remineralization to stop after ammonification, con-ditions that were encountered in organic-rich, coastal sediments of Kiel Bight(Kaehler, 1990). Thus, high rates of denitrification require conditions that may bemet preferably by continental margin sediments which have redox conditions lyingbetween highly reducing coastal sediments and largely oxic pelagic sediments.
In contrast to the determination of denitrification rates on the shelf (for a reviewsee: Seitzinger & Giblin, 1996), very few rates were reported for the continentalslope and rise. The denitrification rates from only about 25 stations of this part ofthe ocean were obtained by employing very different methods, including pore watermodelling (Christensen, Murray, Devol, & Codispoti, 1987b; Christensen, Sme-thie, & Devol, 1987a), lander nitrate influx measurements as a rate minimum (Jahnke,Reimers, & Craven, 1990; Berelson, Hammond, & Johnson, 1987), lander N2-releasemeasurements (Devol, 1991; Devol & Christensen, 1993) and by evaluation of thedifference between measured benthic fluxes of nitrate and the expected rate of nitrateregeneration (Anderson, Rowe, Kemp, Trumbore, & Biscaye, 1994). Regionally,these determinations were made at the US-continental margin, predominantly at thePacific side where shelf and slope sediments are overlain by highly productive sur-

113W. Balzer et al. /Progress in Oceanography 42 (1998) 111–126
face waters. With respect to the benthic cycling of reactive nitrogen, the latter classof stations is characterized by a general uptake of nitrate by the sediment as a conse-quence of high benthic denitrification rates and the high nitrate and low oxygenconcentrations typical for the Northeast Pacific.
Here, we report denitrification rates from 31 stations occupied at the N.W. Euro-pean continental margin ranging in depth between 660 m (close to the shelf breakset at 200 m for the purpose of this study) and the adjacent deep sea basin (4800m). All sediments have a subsurface nitrate maximum suggesting nitrate release tothe overlying water rather than nitrate influx to the sediment. In addition, we presentsome minimum estimates of denitrification from a nearby canyon, because a majorgap exists in our general understanding of the significance of canyon environmentswhich have different dynamics and properties compared to gentle slopes.
2. Materials and methods
Two transects (Fig. 1; sta. 1–10 and 11–13) of the continental slope and rise atGoban Spur were sampled which ran nearly northeast–southwest perpendicular tothe shelf break from about 200 m out to 4800 m in the adjacent basin. Along thetransect depth increased more or less uniformly from the shelf break to about 1450m and again more or less uniformly but at a much greater rate to the margin rise atabout 4500 m. Station 14 to station 18 in the nearby Whittard canyon were all located
Fig. 1. Station locations on the Celtic margin. Pore water nitrate profiles were obtained from threetransects: Goban Spur (sta.1–10), a parallel transect (sta.11–13,j) and the Whittard Canyon (sta.14–18).

114 W. Balzer et al. /Progress in Oceanography 42 (1998) 111–126
at the deepest part of the canyon axis. During six cruises (R.V.Pelagia: PE93, PE95;R.V. Meteor: M30, M36; R.R.S.Charles Darwin: D086, D216) between late springand early fall of the years 1993–1996, pore water profiles were obtained from 36positions (Table 1) which were grouped into 18 stations. The sampling locations(Fig. 1) were chosen to agree with the positions of the sediment traps deployedduring the OMEX-project (see Antia, von Bodungen, & Peinert, 1998).
Pore water sampling: To collect undisturbed samples near the sediment–waterinterface we mostly used a multi-corer (eight subcores) except cruise PE93 duringwhich a box-corer was employed. All samples to be discussed here were judged atthe time of recovery to have a well-preserved sediment–water interface. The overly-ing water was clear and sometimes intact biological structures were observed at thesediment surface. Acrylic subcores were transferred immediately after retrieval to arefrigerated laboratory on board R.V.Meteoror R.R.S.Charles Darwinor broughtto in situ temperature in the laboratory of R.V.Pelagia. The sediments were thenextruded, packed in centrifuge tubes and centrifuged under refrigeration at 5000 rpmfor 25 min to extract the pore water. At several stations a separate subcore of themulticorer was squeezed in a refrigerated laboratory to collect pore water. The sedi-ments were sampled at 0.25 or 0.5 cm intervals from 0 to 2 cm, at 1 cm intervalsfrom 2 to 5 cm and at 2 cm intervals below 5 cm. The nitrate concentration of theoverlying water was mostly close to the deepest water column sample which wasused as the boundary condition at zero sediment depth. From all sediment sectionssamples were taken for porosity that was determined from weight loss upon drying.During the D216 and M36 cruise the sediment cores were sub-sampled under anargon atmosphere, but differences to the sediment treatment during the other cruiseswere not found. Pore water nitrate was partly analyzed by continuous flow methodson board ship and partly frozen and analyzed in the home laboratory employing thestandard manual method (Grasshoff, Ehrhardt, & Kremling, 1983).
3. Results and discussion
3.1. Rate determination by modelling the pore water nitrate profile
The pore water nitrate profiles at the transect across the Goban Spur area are shownin Fig. 2. The stations are depicted according to ascending water depth including thestations of the second transect (sta.11–14), because there were no significant differ-ences at a given water depth between the two transects (see below). A consistentfeature of all profiles was the maximum well below the surface which separates thezones of nitrification and denitrification. The gradients from the sediment to theoverlying water suggest that all sediments release nitrate rather than receive nitrateby influx. When moving from the basin up-slope to the margin, the pore water max-ima, relative to the bottom water, became larger, while there was a concomitantshoaling of the depth where nitrate was exhausted. Both features suggest an increas-ing intensity of denitrification and of organic matter degradation (see also Lohse,Helder, Epping, & Balzer, 1998).
115W. Balzer et al. /Progress in Oceanography 42 (1998) 111–126
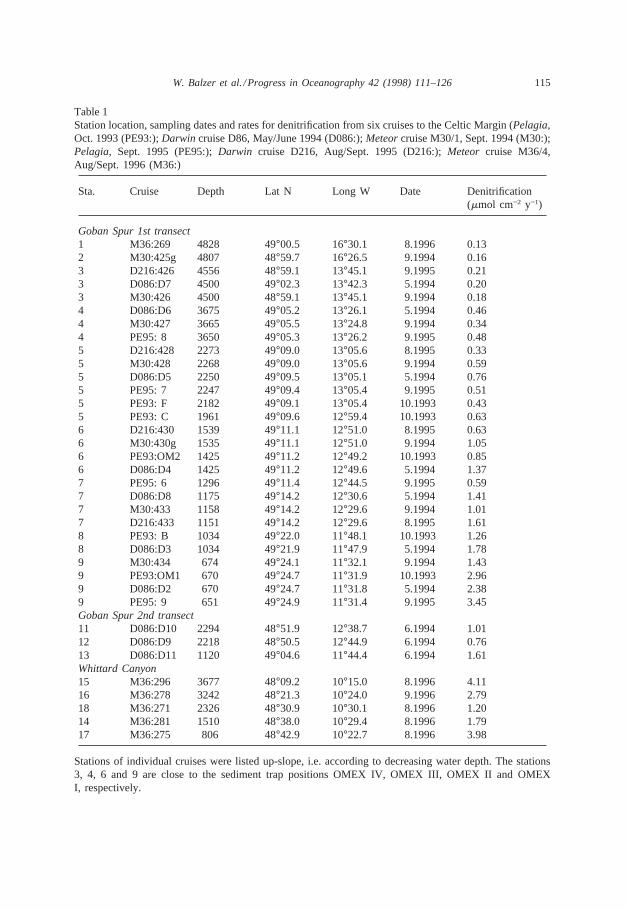
Table 1Station location, sampling dates and rates for denitrification from six cruises to the Celtic Margin (Pelagia,Oct. 1993 (PE93:);Darwin cruise D86, May/June 1994 (D086:);Meteorcruise M30/1, Sept. 1994 (M30:);Pelagia, Sept. 1995 (PE95:);Darwin cruise D216, Aug/Sept. 1995 (D216:);Meteor cruise M36/4,Aug/Sept. 1996 (M36:)
Sta. Cruise Depth Lat N Long W Date Denitrification(mmol cm−2 y−1)
Goban Spur 1st transect1 M36:269 4828 49°00.5 16°30.1 8.1996 0.132 M30:425g 4807 48°59.7 16°26.5 9.1994 0.163 D216:426 4556 48°59.1 13°45.1 9.1995 0.213 D086:D7 4500 49°02.3 13°42.3 5.1994 0.203 M30:426 4500 48°59.1 13°45.1 9.1994 0.184 D086:D6 3675 49°05.2 13°26.1 5.1994 0.464 M30:427 3665 49°05.5 13°24.8 9.1994 0.344 PE95: 8 3650 49°05.3 13°26.2 9.1995 0.485 D216:428 2273 49°09.0 13°05.6 8.1995 0.335 M30:428 2268 49°09.0 13°05.6 9.1994 0.595 D086:D5 2250 49°09.5 13°05.1 5.1994 0.765 PE95: 7 2247 49°09.4 13°05.4 9.1995 0.515 PE93: F 2182 49°09.1 13°05.4 10.1993 0.435 PE93: C 1961 49°09.6 12°59.4 10.1993 0.636 D216:430 1539 49°11.1 12°51.0 8.1995 0.636 M30:430g 1535 49°11.1 12°51.0 9.1994 1.056 PE93:OM2 1425 49°11.2 12°49.2 10.1993 0.856 D086:D4 1425 49°11.2 12°49.6 5.1994 1.377 PE95: 6 1296 49°11.4 12°44.5 9.1995 0.597 D086:D8 1175 49°14.2 12°30.6 5.1994 1.417 M30:433 1158 49°14.2 12°29.6 9.1994 1.017 D216:433 1151 49°14.2 12°29.6 8.1995 1.618 PE93: B 1034 49°22.0 11°48.1 10.1993 1.268 D086:D3 1034 49°21.9 11°47.9 5.1994 1.789 M30:434 674 49°24.1 11°32.1 9.1994 1.439 PE93:OM1 670 49°24.7 11°31.9 10.1993 2.969 D086:D2 670 49°24.7 11°31.8 5.1994 2.389 PE95: 9 651 49°24.9 11°31.4 9.1995 3.45Goban Spur 2nd transect11 D086:D10 2294 48°51.9 12°38.7 6.1994 1.0112 D086:D9 2218 48°50.5 12°44.9 6.1994 0.7613 D086:D11 1120 49°04.6 11°44.4 6.1994 1.61Whittard Canyon15 M36:296 3677 48°09.2 10°15.0 8.1996 4.1116 M36:278 3242 48°21.3 10°24.0 9.1996 2.7918 M36:271 2326 48°30.9 10°30.1 8.1996 1.2014 M36:281 1510 48°38.0 10°29.4 8.1996 1.7917 M36:275 806 48°42.9 10°22.7 8.1996 3.98
Stations of individual cruises were listed up-slope, i.e. according to decreasing water depth. The stations3, 4, 6 and 9 are close to the sediment trap positions OMEX IV, OMEX III, OMEX II and OMEXI, respectively.

116 W. Balzer et al. /Progress in Oceanography 42 (1998) 111–126
Fig. 2. Concentration profiles and fitted curves of pore water nitrate distribution at the Celtic margindepicted from the basin up-slope. A small horizontal bar denotes the boundary between the zones ofnitrification and denitrification, respectively.
Pore water nitrate profiles can be used to derive simultaneously the rates of organiccarbon oxidation by oxygen and the rates for denitrification by steady-state-modelling(Jahnke, Emerson, & Murray, 1982; Goloway & Bender, 1982; Bender & Heggie,1984; Heggie, Maris, Hudson, Dymond, Beach, & Cullen, 1987). Because the porewater nitrate concentrations generally rose to a maximum and then decreased asymp-totically with depth in all cores, the ‘two-layer nitrification–denitrification model’ of

117W. Balzer et al. /Progress in Oceanography 42 (1998) 111–126
Fig. 2. Continued.
Goloway & Bender (1982) was used. Although in the present study only the ratesof denitrification have been evaluated (i.e. the depth range below the nitratemaximum), nitrate data from the zone of nitrification were included to model thedenitrification rate from a larger data base.
In brief, the model is a steady-state diffusion–reaction model of the nitrate distri-bution and rests on the following general assumptions: (i) oxidation of organic matterby oxygen and nitrate follows the Redfield scheme with no build-up of intermediatereaction products, (ii) the diffusivities of solutes are constant with depth and (iii)

118 W. Balzer et al. /Progress in Oceanography 42 (1998) 111–126
advection is negligible (Berner, 1980). The model separates a nitrification zone inthe depth rangez , z from an underlying denitrification zone (z > z). In the nitrifi-cation zone nitrate is produced assuming that the rate of this process is proportionalto the O2 concentration in the pore water while the O2 reduction is assumed to befirst order (rate constant:kO2) with respect to the O2 concentration.
In the underlying denitrification zone (z > z) nitrate consumption is assumed tobe first order (rate constant:kNO3) with respect to [NO3]. Taking a2 5 (kNO3/Ds
NO3)1/2
the nitrate distribution as a function of depth in the denitrification zone is
[NO3] 5 [NO3] z·e−a2(z 2 z)
The solutions as described by Bender & Heggie (1984) contain the unknownskO2, kNO3, z, and g (as the stoichiometric ratio between nitrate production and O2
consumption). They can be determined by numeric fitting to the nitrate data whenappropriate constants are provided. For the fitting procedure of profiles from differentdepths, individual sediment diffusion coefficients were used including correctionsfor in situ temperature and tortuosity (Li & Gregory, 1974; Himmelblau, 1964; Ull-man & Aller, 1982). The bottom water concentrations were based on actual measure-ments either of the bottom water or the overlying water in the cores.
Related to the number of variables, the simplifying assumptions and the limitednumber of data points, often the multiplicity of numeric results is not constrainedsufficiently. One possibility is to fixz by visual inspection and solve only forg, a1
and a2 (Goloway & Bender, 1982; Bender & Heggie, 1984). It is also often betterto fix the ratiog between produced nitrate and consumed O2 being related to theC/N ratio of the organic matter. At the deeper stationsg was fixed according tomeasured ratios of Corg and Norg in deep-sea sediments; for the shallow stations avalue of 0.133 was adopted being slightly higher than the corresponding Redfieldnumber. The model contains a small technical inconsistency (Goloway & Bender,1982) because the O2 concentration decreases exponentially with depth and is verysmall but non-zero atz, while z should be controlled by the oxygen consumption ofthe upper layer (Lancelot & Billen, 1985). When applying the fitting procedure itwas observed that the data points in the first 1.5 cm were mostly above a reasonabledata fit thus producing strong bias or even provoking unreasonable results. Becausecontinuity in the near surface gradients must be postulated, we consider these elev-ated concentrations in the upper sediment centimetre to be unreliable and treat themlike outliers (open circles in Fig. 2). The pressure drop and/or the warming of thesediment during recovery of the core often result in concentration increases of porewater constituents within the first 1–1.5 cm (e.g. nitrate: Balzer, 1989; or ammonia:e.g. Aller, Hall, & Rude, 1987; Glud, Gundersen, Joergensen, Revsbech, & Schulz,1994; cf. Otto & Balzer, 1998). Up to now such elevated pore water concentrationin the top sediment layer were observed only for nitrogen bearing components, butnever for phosphate or silicate (Balzer, 1989). Although there is no sound explanationfor such artefacts, a relation to labile organic matter appears likely, because suchartifacts seem to be confined to the top 1–1.5 cm, which contain much more livingand non-living organic material than deeper layers. Omission of near-surface data

119W. Balzer et al. /Progress in Oceanography 42 (1998) 111–126
points in some cases results in a change of gradients and—as a consequence—couldenhance the estimated remineralization rate. A further underestimation of the near-surface degradation rate might arise from confining the solute transport to moleculardiffusion thereby neglecting possible bioirrigation. Both simplifications might entailan underestimation of the remineralization rate by a factor of 2–3. The rates obtainedby modelling during this study, however, were close to results from other methodsat the same stations (Lohse et al., 1998); thus, simplifying assumptions made duringthis study do not seem to have effects as large as expected at the investigated margin.In any case, these near surface artifacts do not affect the nitrate distribution in thedenitrification zone and could be relevant only for the estimation of the rates ofoxygen consumption in the nitrification zone.
The applicability of the two-layer-model ends where the zones of nitrification anddenitrification are no longer vertically separated and both processes are likely to takeplace simultaneously in the same depth interval. This happens when, as a result ofhigh rates of organic carbon input, the depth range of nitrification is compressed intothe first centimetre or less of the sediment column. This case is observed especially inshelf and shallow water sediments. Another limit for the applicability of those modelsin shelf sediments may be presented by possible non-local solute exchange betweenbottom and pore water resulting from bioirrigation by abundant benthic organisms(Christensen et al., 1987a). Thus, no attempts were made to model the pore waternitrate of shelf sediments.
3.2. Model results of denitrification rates
Generally, the modelled profiles (Fig. 2) fit the data rather well, except for a fewoutlyers and the near-surface concentrations (see above). The model boundarybetween the two zones of nitrification and denitrification, respectively, is indicatedas a small horizontal bar. The depth of the bar reflects the expected tendency of thedenitrification zone to become shallower in the sediment when moving up-slope.The integrated rates of denitrification are compiled in Table 2 and plotted vs waterdepth in Fig. 3.
Denitrification at the Goban Spur transect slowly increased from the basin to thecontinental rise but became much more intensive when the region up-slope of sta.7 (1500 m) was approached (Fig. 3). The rates of the parallel transect (Fig. 3, opencircles) are not outside the general trend of the major transect, suggesting that theobserved rates are typical for a gentle slope in the Celtic Sea. The exponentialincrease in the rates of nitrate reduction by denitrification reached 2.566 0.87mmolN cm−2 y−1 at 666 m, but was still considerably less than the average rate (16mmolN cm−2 y−1) for the Atlantic shelf north of 45°N (Seitzinger & Giblin, 1996). Therates of denitrification of individual stations revealed no seasonal signal when relatedto the month of the cruises (May to October). Benthic denitrification or carbon degra-dation rates appear to vary less in time than do water column particle fluxes becauseof the dampening influence of slowly degrading organic fractions and the decompo-sition occurring deep in the sediments (Martin & Bender, 1988).
Although being mostly higher than at Goban Spur, the model results for the Whit-

120 W. Balzer et al. /Progress in Oceanography 42 (1998) 111–126
Table 2Average rates for denitrification for organic carbon degradation by nitrate (CoxNO3) and by oxygen(CoxO2), respectively, at the stations of the Goban Spur transect
Sta. Depth (m) Denitrification CoxNO3 CoxO2
(mmol cm−2 y−1) (mmol cm−2 y−1) (mmol cm−2 y−1)
1 4828 0.13 0.15 9.02 4807 0.16 0.19 12.53 4519 0.20 0.23 19.94 3663 0.43 0.48 31.15 2197 0.54 0.61 48.86 1481 0.98 1.07 46.27 1195 1.16 1.27 67.08 1034 1.52 1.67 51.39 666 2.56 2.81 76.510 200 21.0a 23.5a 138.5
a Rate calculated from relation of denitrification to CoxO2 on the shelf (see text).
Fig. 3. Scatter plot of denitrification rates modelled from individual profiles as a function of water depth.Note that the rates in the Whittard Canyon fall outside the general depth dependence at Goban Spur andits parallel transect.
tard Canyon sediments (Fig. 3, asterisks) represent minimum estimates, because thezone of nitrification and also of denitrification were so compressed in these sedimentsthat nitrification and denitrification was likely to occur simultaneously within the topcentimetre. Since these conditions are not adequately covered by the model, the truerates will be somewhat higher. Nevertheless, the depth distribution of these rates inthe Whittard Canyon is highly variable in itself and largely outside the general trendfollowed by the denitrification rates at Goban Spur (Fig. 3). The relatively high ratesin Whittard Canyon sediments at greater water depths and the lack of clear depen-

121W. Balzer et al. /Progress in Oceanography 42 (1998) 111–126
dence on water depth are probably a result of erosion and down-slope transport oforganic matter, not only orthogonal to the shelf break but also laterally from precipi-tous canyon slopes. Denitrification in the canyon will be excluded from further dis-cussions, because the calculated rates are uncertain and the redistribution of freshlysedimented materials resulting in an inhomogeneous depth dependence of benthicactivity cannot be resolved in this study (cf. Otto & Balzer, 1998).
3.3. Comparison with other regions
The rates obtained for the Celtic margin (Fig. 3 and Table 2) are lower than mostrates reported from other rise and slope environments. Based predominantly on theinflux of nitrate (85%), the Northeast Pacific off Washington is characterized by highrates of denitrification: 6.3mmol N cm−2 y−1 at the mid slope (1800 m: Christensenet al., 1987b) and 47.9mmol N cm−2 y−1 for five stations at the upper slope (225–630 m: Devol & Christensen, 1993). In the Californian borderlands, too, influx ofnitrate provides more than half of similarly high rates (Berelson et al., 1987; Bender,Jahnke, Weiss, Martin, Heggie, Orchardo, & Sowers, 1989; Jahnke et al., 1990).
In contrast, from the rise and slope at the Atlantic side of North America ratessimilar to those observed at the N.W. European margin were reported. On average,denitrification rates of 2.5mmol N cm−2 y−1 are typical for the Hatteras continentalslope, which further decrease to 1.15 and 0.35mmol N cm−2 y−1 at the Hatteras andBermuda rise, respectively (Heggie et al., 1987). Outside the depth range of thecarbon depocentre [located at the slope between 790 and 1090 m, Walsh et al. (1985)]Anderson et al. (1994) found similar rates based on the difference between the meas-ured efflux of nitrate and its expected production. Both the sediments of the N.W.European margin and the N.W. Atlantic are characterized by an efflux of nitratefrom the sediment reflecting a well developed zone of nitrification in the sedimen-tary column.
Compared to the Atlantic slopes (Table 2; Anderson et al., 1994), high denitrifi-cation rates over the Pacific slope can be related to higher oxygen consumption ratesdue to enhanced productivity off Washington (Devol & Christensen, 1993), but notin the Californian borderlands (Berelson et al., 1987; Bender et al., 1989). The maindifferences between the two benthic environments with respect to denitrification arethe low oxygen and high nitrate concentration in the bottom water of the NortheastPacific. Both environmental conditions tend to foster denitrification in the Pacific,as discussed by Middelburg et al. (1997) during a model sensitivity analysis. Lowbottom water concentrations of oxygen entail an onset of denitrification close to thesediment surface thus offering more labile organic matter for nitrate to react withand reducing the diffusive path between nitrification and denitrification. Under con-ditions of high oxygen levels in the bottom water labile organic carbon may besupplied to the denitrification zone only by deep-reaching bioturbation (Balzer,1996). High bottom water nitrate concentrations stimulate denitrification by generallyreducing the diffusive efflux of nitrate and by increasing the influx of nitrate, whenthe zone of denitrification is close to the sediment surface. Thus, slope sediments ofthe North Pacific are sinks of nitrate. The nitrate gradients of this study, however,

122 W. Balzer et al. /Progress in Oceanography 42 (1998) 111–126
and similar results from several transects over the Norwegian slope and rise (Balzer,unpublished data) consistently indicate nitrate efflux. Thus, rise and slope sedimentsof the North Atlantic act as a source of nitrate because of the well developed nitrifi-cation zone and a relatively deep denitrification zone.
3.4. Relation to carbon oxidation by oxygen
The rates of denitrification obtained during different cruises were averaged for thestations along the Goban Spur transect (Table 2) and plotted (Fig. 4) as a functionof the rates for carbon oxidation by oxygen (CoxO2). For the latter rates, three seriesof determinations along the Goban Spur transect are available: lander oxygen uptake,evaluation of O2-electrode profiles and results from the modelling of pore waternitrate (Lohse et al., 1998). Since all three sets yielded similar results, we use themean value at the individual stations (Table 2). The rates of carbon oxidation byoxygen rise nearly continuously when moving from the basin up-slope to the shelfbreak.
The denitrification rates follow the general trend of the rates of carbon oxidation(Fig. 4), but not proportionally. To stress the non-linear dependence of denitrificationon the carbon input to the sediments, an additional point at the shelf break (138.5mmol C cm−2 y−1, 21.0 mmol N cm−2 y−1) was included for the exponential fit. Itmay serve as a link to the adjacent shelf and was obtained by applying the generalrelation between denitrification and oxygen consumption in shelf sediments (as com-piled by Seitzinger & Giblin, 1996) to the carbon oxidation rate determined at theshelf break (Table 2, sta.10). According to the exponential fit [inmmol cm−2 y−1:Denit 5 2 0.06851 0.169·exp(0.03485·CoxO2)] the slope between denitrification
Fig. 4. Rates of denitrification as a function of the rate of carbon oxidation by oxygen. Denitrificationrates at the nine stations were averaged from individual profiles according to Table 1. The curve is anexponential fit to the data including an additional value at the shelf break.

123W. Balzer et al. /Progress in Oceanography 42 (1998) 111–126
and carbon oxidation by oxygen increases from about 0.014 at the continental riseto over 0.033 at the upper slope, and to 0.151 on the shelf (Seitzinger & Giblin,1996). The latter relation for the shelf is equal to the Redfield ratio between nitrateproduction and the oxic consumption of particulate organic carbon. If nitrate influxto the sediment is absent, such a high ratio implies that the particulate organic nitro-gen input to shelf sediment is completely denitrified after conversion to nitrate. Thus,in relation to oxygen consumption, these shelf sediments would be neither a sinknor a source of nitrate for the water column. In contrast, all sediments from the riseto the upper slope of the N.W. European margin are nitrate sources to the watercolumn and release 70–90% of the particulate nitrogen input as nitrate.
One consequence of the non-linear relation between denitrification and benthiccarbon oxidation is, that margin environments such as canyons may behave differ-ently compared to gentle slopes, because erosion and redistribution of organic matterhave different importance. Equal rain rates of organic matter to a large benthic regionmay have the same area-integrated rate of carbon degradation, when post-depo-sitional redistribution occurs and the organic matter is concentrated into a narrowerarea. However, this scenario, which is likely to occur in canyons, provokes a muchgreater area-integrated rate of denitrification because of the strong increase in thesignificance of denitrification when the rate of organic matter degradation increases.Thus, margins having many canyons may have to be treated differently in globalbudgets than more usual slopes and continental rises.
The corresponding rate of organic carbon oxidation by nitrate, applying Redfieldratio conversion, ranged from 0.15mmol C cm−2 y−1 at station 1 to 2.8mmol C cm−2
y−1 at station 9 (Table 2). The organic carbon oxidation by denitrification is between30 and 80 times lower than the respective carbon oxidation rate by oxygen, thusshowing the relatively low significance of denitrification for the benthic carbonbudget at this margin. As compared to the overall remineralization rate of organicnitrogen, however, denitrification is a significant process converting between 8 and30% of the total organic nitrogen mineralization product to molecular species beingunavailable for new production.
3.5. Carbon and nitrogen budget for the whole transect
In order to make the Goban Spur comparable to other slopes of different mor-phology, a rough budget is constructed for the whole transect across the Goban Spur(250 km) from the shelf edge, set at 200 m water depth, to the lower end of thecontinental rise at 4600 m (Fig. 5). The benthic degradation rates of organic nitrogenderived during this study cannot be balanced against the particulate organic nitrogen(PON) flux to the sea floor in a strictly vertical sense, because the vertical flux ofabout 3mmol N cm−2 y−1 through the 600 m horizon of the water column (at OMEXII and III; see Antia et al., 1998) is much less than the benthic regeneration rate ofreactive nitrogen. Obviously, Celtic margin sediments receive additional inputs bylateral transport. The nitrogen budget for the 250 km long ‘slope and rise system’ wasconstructed by multiplying the relevant individual rates with the horizontal extent forwhich they are considered typical. Rates of benthic remineralization of reactive nitro-

124 W. Balzer et al. /Progress in Oceanography 42 (1998) 111–126
Fig. 5. Benthic nitrogen budget of the oxic and suboxic zones based on weighted averages of the stationsfrom the 250 km long transect of the Celtic slope and rise (4600–200 m). Source terms for reactivenitrogen are the nitrate remineralized by oxygen (N-remin-O2) and by nitrate (N-remin-NO3), respectively;sink terms for nitrogen are nitrogen burial and denitrification. The difference between sources and denitri-fication is released as nitrate to the bottom water.
gen by oxygen and by nitrate, respectively, as well as the rate of denitrification weretaken from Table 2. Station 9 was considered representative for the region up to200 m.
The slope and rise system Goban Spur (Fig. 5) as defined before converts onaverage 8.6mmol N cm−2 y−1 of PON to nitrate during oxygen consumption. Duringdenitrification another 0.25mmol N cm−2 y−1 of PON are remineralized. While nitro-gen burial amounts to only 0.1mmol N cm−2 y−1 calculated from data of van Weering,Hall, McCave, de Stigter, & Thomson (1998), denitrification removes 1.5mmol Ncm−2 y−1. Even lower mean denitrification rates of 0.29, 0.23 and 0.46mmol N cm−2
y−1 were obtained at three slope and rise transects between 68° and 71°N off Norwaycomprising 4–13 stations per transect (Balzer, unpublished data). Although muchlower than on the shelf, the average Goban Spur denitrification rate is still ten timeshigher than at the basin stations 1 and 2 proving the significance of slope and risefor denitrification in deep ocean sediments. The average weighted nitrogen input ofPON to the slope and rise sediments corresponds to 8.93mmol N cm−2 y−1, of whichabout 99% are recycled and only 1% is buried. From the supply 17% are denitrified,i.e. converted to nitrogen species unavailable for primary productivity. For theremoval of anthropogenic nitrogen, however, the benthic denitrification at GobanSpur has only secondary significance due to the low overall rate as compared toshelf sediments.
4. Acknowledgements
We appreciate the help of the Captains and the crews of the R.V.Meteor, R.R.S.Charles Darwinand R.V.Pelagia. We are particularly grateful to A. Deeken for hisskilful shipboard assistance and C. Maess for providing additional nitrate data. Thiswork was supported by the European Union in the framework of the MAST pro-gramme, contract no. MAS2-CT93-0069 and MAS3-CT96-0056 (Ocean MarginExchange—OMEX) to W. Helder and W.Balzer. We acknowledge the helpfulsuggestions of two anonymous reviewers.

125W. Balzer et al. /Progress in Oceanography 42 (1998) 111–126
5. References
Aller, R.C., Hall, P.O.J., & Rude, P.D. (1987). Solute distributions and flux estimates in bioturbatedsediments of the Panama Basin.EOS, 68, 1749.
Anderson, R.F., Rowe, G.T., Kemp, P.F., Trumbore, S., & Biscaye, P.E. (1994). Carbon budget for themid-slope depocenter of the Middle Atlantic Bight.Deep-Sea Research, II41, 669–703.
Antia, N.A., von Bodungen, B., & Peinert, R. (1998). Particle flux across the mid-European continentalmargin.Deep-Sea Research(in press).
Balzer, W. (1989).Chemical reactions and transport processes in near surface sediments of boreal andpolar sea areas. Habilitationsschrift (in German), University of Kiel.
Balzer, W. (1996). Particle mixing processes of Chernobyl fallout in deep Norwegian Sea sediments:evidence for seasonal effects.Geochimica et Cosmochimica Acta, 60, 3425–3433.
Bender, M.L., & Heggie, D.T. (1984). Fate of organic carbon reaching the deep sea floor: a status report.Geochimica et Cosmochimica Acta, 48, 977–986.
Bender, M.L., Jahnke, R., Weiss, R., Martin, W., Heggie, D.T., Orchardo, J., & Sowers, T. (1989). Organiccarbon oxidation and benthic nitrogen and silica dynamics in San Clemente Basin, a continental border-land site.Geochimica et Cosmochimica Acta, 53, 685–697.
Berner, R.A. (1980).Early diagenesis: a theoretical approach. Princeton, NJ: Princeton University Press.Berelson, W.M., Hammond, D.E., & Johnson, K.S. (1987). Benthic fluxes and the cycling of biogenic
silica and carbon in two southern California borderland basins.Geochimica et Cosmochimica Acta,51, 1345–1363.
Christensen, J.P. (1994). Carbon export from continental shelves, denitrification and atmosphere carbondioxide. Continental Shelf Research, 14, 547–576.
Christensen, J.P., Smethie, W.M., & Devol, A.H. (1987a). Benthic nutrient regeneration and denitrificationon the Washington continental shelf.Deep-Sea Research, 34, 1027–1048.
Christensen, J.P., Murray, J.W., Devol, A.H., & Codispoti, L.A. (1987b). Denitrification in continentalshelf sediments has major impact on the oceanic nitrogen cycle.Global Biogeochemical Cycles, 1,97–116.
Devol, A.H. (1991). Direct measurement of nitrogen gas fluxes from continental shelf sediments.Nature,London, 349, 319–321.
Devol, A.H., & Christensen, J.P. (1993). Benthic fluxes and nitrogen cycling in sediments of the continen-tal margin of the eastern North Pacific.Journal of Marine Research, 51, 345–372.
Froelich, P.N., Klinkhammer, G.P., Bender, M.L., Luedtke, N.A., Heath, G.R., Cullen, D., Dauphin, P.,Hammond, D., Hartmann, B., & Maynard, V. (1979). Early oxidation of organic matter in pelagicsediments of the eastern equatorial Atlantic: suboxic diagenesis.Geochimica et Cosmochimica Acta,43, 1075–1090.
Galloway, J.N., Howarth, R.W., Michaels, A.F., Nixon, S.W., Prospero, J.M., & Dentener, F.J. (1996).Nitrogen and phosporus budgets of the North Atlantic Ocean and its watershed.Biogeochemistry, 35,3–25.
Glud, R.N., Gundersen, J.K., Joergensen, B.B., Revsbech, N.P., & Schulz, H.-D. (1994). Diffusive andtotal oxygen uptake of deep-sea sediments in the eastern South Atlantic Ocean: in situ and laboratorymeasurements.Deep-Sea Research, 41, 1767–1788.
Goloway, F., & Bender, M. (1982). Diagenetic models of interstitial nitrate profiles in deep sea suboxicsediments.Limnology and Oceanography, 27, 624–638.
Grasshoff, K., Ehrhardt, M., & Kremling, K. (1983).Methods of seawater analysis. Berlin: Verlag Chem-ie.
Heggie, D., Maris, C., Hudson, A., Dymond, J., Beach, R., & Cullen, J. (1987). Organic carbon oxidationand preservation in NW Atlantic continental margin sediments. InGeology and geochemistry of abys-sal plains, Geological Society Special Publications No. 31 (pp. 215–236). Oxford: Blackwell Scientific.
Himmelblau, D.M. (1964). Diffusion of dissolved gases in liquids.Chemical Review, 64, 527–550.Jahnke, R.A., Emerson, S.R., & Murray, J.W. (1982). A model of oxygen reduction, denitrification and
organic matter mineralization in marine sediments.Limnology and Oceanography, 27, 610–623.Jahnke, R.A., Reimers, C.E., & Craven, D.B. (1990). Intensification of recycling of organic matter at the
sea floor near ocean margins.Nature, London, 348, 50–54.

126 W. Balzer et al. /Progress in Oceanography 42 (1998) 111–126
Jenkins, M.C., & Kemp, M.W. (1984). The coupling of nitrification and denitrification in two estuarinesediments.Limnology and Oceanography, 29, 609–619.
Kaehler, P. (1990).Denitrifikation in marinen Kuestensedimenten (Kieler Bucht, Ostsee). Ph.D., Univ.Kiel, Berichte au¨s dem Institu¨t fuer Meeresku¨nde, No.199.
Lancelot, C., & Billen, G. (1985) Carbon–nitrogen relationship in nutrient metabolism of coastal marineecosystems. InAdvances in aquatic microbiology(Vol. 3, pp. 263–321).
Li, Y.-H., & Gregory, S. (1974). Diffusion of ions in sea water and in deep-sea sediments.Geochimicaet Cosmochimica Acta, 38, 703–714.
Lohse, L., Helder, W., Epping, E., & Balzer, W. (1998). Recycling of organic matter along a shelf-slope transect across the N.W. European continental margin (Goban Spur).Progress in Oceanography,(this issue).
Martin, W.R., & Bender, M.L. (1988). The variabitity of benthic fluxes and sedimentary remineralizationrates in response to the seasonally variable organic carbon rain rates in the deep sea: a modelingstudy.American Journal of Science, 288, 561–574.
Middelburg, J.J., Soetaert, K., & Herman, P.M.J. (1997). Empirical relationships for the use in globaldiagenetic models.Deep-Sea Research, 32, 853–883.
Middelburg, J.J., Soetaert, K., Herman, P.M.J., & Heip, C.H.R. (1996). Denitrification in marine sedi-ments.Global Biogeochemical Cycles, 10, 661–673.
Otto, S., & Balzer, W. (1998). Release of dissolved organic carbon (DOC) from sediments of the N.W.European Continental Margin (Goban Spur) and its significance for benthic carbon cycling.Progressin Oceanography, (this issue).
Schlesinger, W.H. (1991).Biogeochemistry: an analysis of global change. New York: Academic Press.Seitzinger, S.P. (1988). Denitrification in freshwater and coastal marine ecosystems: ecological and geo-
chemical importance.Limnology and Oceanography, 33, 702–724.Seitzinger, S.P., & Giblin, A.E. (1996). Estimating denitrification in North Atlantic continental shelf
sediments.Biogeochemistry, 35, 235–260.Ullman, W.J., & Aller, R.C. (1982). Diffusion coefficients in nearshore marine sediments.Limnology and
Oceanography, 27, 552–556.Walsh, J.J., Premuzic, E.T., Gaffney, J.S., Rowe, G.T., Harbottle, G., Stoenner, R.W., Balsam, W.L.,
Betzer, P.R., & Macko, S.A. (1985). Organic storage of CO2 on the continental slope off the mid-Atlantic bight, the southeastern Bering Sea, and the Peru coast.Deep-Sea Research, 32, 853–883.
van Weering, T.C.E., Hall, I.R., McCave, I.N., de Stigter, H., & Thomson, L. (1998). Recent sediments,sediment accumulation and carbon burial at Goban Spur, N.W. European continental margin, 47°–50°N. Progress in Oceanography, (this issue).
Wollast, R. (1991). The coastal carbon cycle: fluxes, sources and sinks. InOcean margin processes inglobal change(pp. 365–381). New York: Wiley.