benefits of using astm building economics standards for ...€¦ · benefits of using astm building...
TRANSCRIPT

Benefits of Using ASTM Building Economics Standards for the Design, Construction, and Operation of Constructed Facilities
Muthiah Kasi and Robert E. Chapman
U.S. Department of CommerceNational Institute of Standards and Technology
Applied Economics OfficeEngineering Laboratory Gaithersburg, Maryland 20899-8603
NIST Special Publication 1098


U.S. Department of CommerceNational Institute of Standards and Technology
Benefits of Using ASTM Building Economics Standards for the Design, Construction, and Operation of Constructed Facilities Muthiah Kasi and Robert E. Chapman
Sponsored by:
National Institute of Standards and Technology Engineering Laboratory
March 2012
U.S. DEPARTMENT OF COMMERCE
John E. Bryson, Secretary
NATIONAL INSTITUTE OF STANDARDS AND TECHNOLOGY
Patrick D. Gallagher, Undersecretary of Commerce for Standards and Technology and Director
NIST Special Publication 1098
Applied Economics OfficeEngineering Laboratory Gaithersburg, Maryland 20899-8603


iii
Abstract This report provides an overview of the 26 standards developed within the ASTM Subcommittee on Building Economics, E06.81, along with a description of how these standards are being used to promote more cost-effective decisions for the design, construction, operation, and disposal of constructed facilities. The report includes descriptions of a terminology standard, seven standard classifications, five standard guides, and 13 standard practices. The standard classifications, standard guides, and standard practices are organized around four topic areas: (1) cost data presentation and analysis; (2) value analysis; (3) risk management; and (4) economic evaluation. The report contains a detailed case study illustrating how many of the subcommittee’s standards can be applied to a complex transportation project. The case illustration uses the design and construction of the Gateway Arch Bridge in Taylor, MI. The Gateway Arch Bridge was part of the reconstruction of Interstate 94 for Super Bowl XL held in 2006. The case illustration discusses the bridge’s innovative design and engineering features, the extensive use of prefabricated components as cost and schedule control measures, and the use of ASTM standards to achieve a balance between performance and life-cycle economy. The Gateway Arch Bridge won six awards, including two national awards. A major criterion in its selection as an award recipient was its cost effectiveness. Keywords: Bridges; buildings; construction; cost data; economic evaluation; functional elements; infrastructure; risk management; standards; UNIFORMAT II; value analysis

iv

v
Preface This study was conducted by the Applied Economics Office in the Engineering Laboratory at the National Institute of Standards and Technology. This report provides an overview of the 26 standards developed within the ASTM Subcommittee on Building Economics. The report also contains a detailed case study illustrating how many of the subcommittee’s standards can be applied to a complex transportation project. The intended audience is the National Institute of Standards and Technology, standards and codes developers, architects, engineers, constructors, facility managers, and other construction industry stakeholders interested in reducing the costs of designing, constructing, and maintaining the Nation’s building stock and physical infrastructure.
Disclaimer Certain trade names and company products are mentioned in the text in order to adequately specify the technical procedures and equipment used. In no case does such identification imply recommendation or endorsement by the National Institute of Standards and Technology, nor does it imply that the products are necessarily the best available for the purpose.
Disclaimer Regarding Non-Metrics Units
The policy of the National Institute of Standards and Technology is to use metric units in all of its published materials. Because this report is intended for the U.S. construction industry that uses U.S. customary units, it is more practical and less confusing to include U.S. customary units as well as metric units. Measurement values in this report are therefore stated in metric units first, followed by the corresponding values in U.S. customary units within parentheses.
Cover Photographs Credits Foreground: Cover image of ASTM Standards on Building Economics, 7th Edition, provided by ASTM International. Background: Ghosting of the Gateway Arch Bridge superstructure provided by Alfred Benesch & Company.

vi
Author Affiliations Muthiah Kasi, PE SE CVS, serves as Chairman of the Board at Alfred Benesch & Company. Mr. Kasi joined Alfred Benesch & Company in 1969. His experience at Benesch includes design and management of high rise and low rise buildings, long span river bridges and short span bridges, and urban and rural highways. Mr. Kasi is the Chairman of the ASTM Subcommittee on Building Economics, where for nearly 20 years he has been active in developing standards covering the design, construction, and operation of constructed facilities. Robert E. Chapman, Ph.D., is the Chief of the Applied Economics Office in the Engineering Laboratory at the National Institute of Standards and Technology (NIST). Dr. Chapman joined NIST, formerly the National Bureau of Standards, in 1975. As Chief of the Applied Economics Office, he leads a group of economists that evaluate new technologies, processes, government programs, legislation, and codes and standards to determine efficient alternatives and measure their economic impacts. Since 1998, Dr. Chapman has chaired the Task Group on Techniques within the ASTM Subcommittee on Building Economics.

vii
Acknowledgements The authors wish to thank all those who contributed so many excellent ideas and suggestions for this report. They include: Dr. S. Shyam Sunder, Director of the Engineering Laboratory (EL) at the National Institute of Standards and Technology (NIST); Dr. William Grosshandler, EL Deputy Director for Building and Fire Research; and Mr. Simon P. Frechette, EL’s Systems Integration for Manufacturing and Construction Applications Program Manager, for their technical guidance, suggestions, and support. Special appreciation is extended to Dr. Ihab Darwish, Mr. Robert Tipton, Mr. Kenneth Holt, and Ms. Jayne Hill of Alfred Benesch & Company, for their technical contributions during the drafting and production of this manuscript. Special appreciation is extended to Mr. Mark E. Palmer and Dr. Christopher U. Brown of the EL’s Systems Integration Division for their guidance and insights. Special appreciation is extended to Dr. David T. Butry of the EL’s Applied Economics Office for his thorough review and many insights and to Ms. Carmen L. Pardo for her assistance in preparing the manuscript for review and publication. Special appreciation is also extended to Ms. Barbara Balboni, Senior Engineer RS Means; Mr. Robert P. Charette, Adjunct Professor Concordia University; Mr. Anthony L. Huxley, Construction Consultant; and Mr. Stephen Mawn, Manager Committee E06 on Performance of Buildings ASTM International, for their comments on an earlier draft of this report. The report has also benefitted from the review and technical comments provided by Dr. Nicos S. Martys of the EL’s Materials and Structural Systems Division.

viii
ix
Table of Contents Abstract ............................................................................................................................. iii Preface ................................................................................................................................ v Acknowledgements ......................................................................................................... vii 1 Introduction ................................................................................................................ 1
1.1 Background ......................................................................................................... 1 1.2 Purpose ................................................................................................................ 3 1.3 Scope and Approach ........................................................................................... 3 1.4 A Note on Key Cross-Cutting Themes ............................................................... 4
2 Applications of ASTM Building Economics Standards ......................................... 7 2.1 Cost Data Presentation and Analysis .................................................................. 7 2.2 Value Analysis .................................................................................................. 13 2.3 Risk Management ............................................................................................. 15 2.4 Economic Evaluation ........................................................................................ 19
3 A Case Study of the Gateway Arch Bridge: How Innovative Design and Economics Come Together ..................................................................................... 27
3.1 Summary of Key Characteristics and Innovative Design Features .................. 27 3.2 Cost Accounting Framework ............................................................................ 37 3.3 Cost Analysis of the Gateway Arch Bridge Using the UNIFORMAT II Elemental Classification and Example Sub Classification ........................................... 39 3.4 Risk Management ............................................................................................. 42
4 Summary and Recommendations for Further Research ..................................... 51 4.1 Summary ........................................................................................................... 51 4.2 Recommendations for Further Research ........................................................... 51
References ........................................................................................................................ 53

x
List of Figures Figure 3.1 Overhead View of the Gateway Arch Bridge ................................................. 27 Figure 3.2 Gateway Arch Bridge as Seen from Telegraph Road .................................... 28 Figure 3.3 Gateway Arch Bridge as Seen from I-94 ....................................................... 28 Figure 3.4 Value/Mismatch Graph .................................................................................. 29 Figure 3.5 Analysis of Arch Types .................................................................................. 30 Figure 3.6 Gateway Arch Bridge Foundation System ..................................................... 30 Figure 3.7 Analysis of Arch Rib Geometry ..................................................................... 31 Figure 3.8 Longitudinal View of the Arch Ribs .............................................................. 32 Figure 3.9 Transverse View of the Arch Ribs Illustrates Unequal Lengths .................... 32 Figure 3.10 Maintenance of Arch Ribs ............................................................................ 33 Figure 3.11 Access Opening to the Arch Rib .................................................................. 34 Figure 3.12 Redundancy of Hanger Assembly ................................................................ 34 Figure 3.13 Hanger Assembly and Neoprene Transition Boots ...................................... 35 Figure 3.14 Analysis of Floor System and Transverse Girders ....................................... 36 Figure 3.15 Optimization of Floor System ...................................................................... 36 Figure 3.16 Configuration of Transverse Girders ............................................................ 37 Figure 3.17 Cost Distribution of Selected Group Elements and Individual Elements for
the Gateway Arch Bridge .......................................................................................... 41 Figure 3.18 Benefits of Prefabrication: Full Lay-Down Assembly ................................. 46 Figure 3.19 Benefits of Prefabrication: Drilling Splice Connection ................................ 47 Figure 3.20 Comparison of the Two Methods for Pouring and Curing the Concrete
Bridge Deck .............................................................................................................. 49 List of Tables Table 2.1 Building Economics Standards Focused on Compiling, Analyzing,
Reporting, and Summarizing Cost Data ..................................................................... 8 Table 2.2 Building Economics Standard Practices for Measuring the Value of
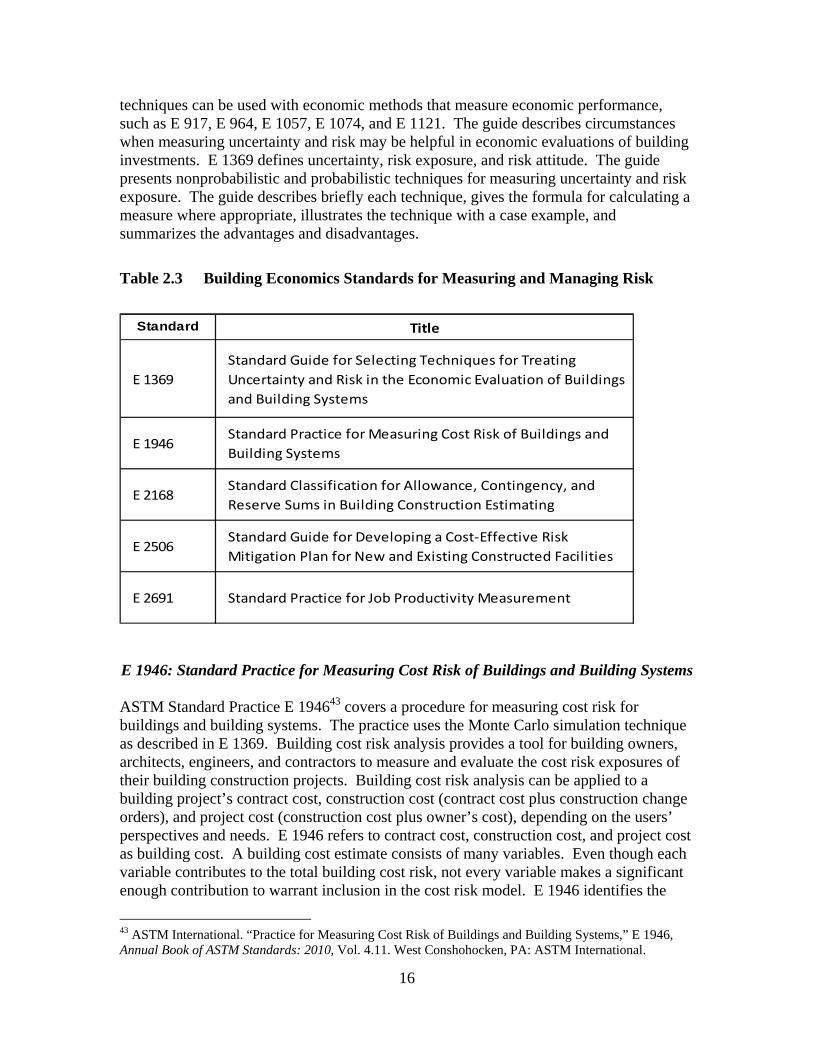
Construction-Related Systems and Attributes .......................................................... 14 Table 2.3 Building Economics Standards for Measuring and Managing Risk ............. 16 Table 2.4 Building Economics Standards for Measuring Economic Performance and
Reporting the Results of an Economic Evaluation ................................................... 20 Table 2.5 Summary of Appropriateness of Each Standardized Evaluation Method for
Each Decision Type .................................................................................................. 24 Table 3.1 Classification Hierarchy for Program Management-Related Costs ................. 38 Table 3.2 Classification Hierarchy for Risk Management-Related Costs ....................... 38 Table 3.3 Cost Analysis of the Gateway Arch Bridge Using the UNIFORMAT II
Elemental Classification and Example Sub Classification ....................................... 40 Table 3.4 Changes in Cost by Phase Due to Design Changes Resulting from Application
of ASTM E06.81 Standards ...................................................................................... 44 Table 3.5 Risk Comparisons from the Designer’s/Owner’s Perspective ......................... 48 Table 3.6 Risk Comparisons from the Contractor’s Perspective ..................................... 50

1
1 Introduction 1.1 Background Organized in 1898, ASTM International is a developer and publisher of technical information designed to promote understanding and advancement of technology and to ensure the quality of commodities and services and the safety of products. ASTM’s primary mission is to develop voluntary industry consensus standards for materials, products, systems, and services. It provides a forum for producers, users, ultimate customers, and those having a general interest, such as representatives of government and academia, to meet on common ground to write standards that best meet their needs. The Building Economics Subcommittee was established in 1979; it is one of several technical subcommittees within ASTM Committee E06 on the Performance of Buildings. The Building Economics Subcommittee, E06.81, develops standards that serve as guidelines for making building and infrastructure choice, design, construction, operations, clean-up, and disposal decisions based on economic analysis. E06.81 standards include: definitions of economic techniques and terms; practices on methods related to economic evaluation; guides to help in the selection of appropriate economic methods and techniques; classifications of building, construction, and site-related elements or components; and adjuncts of data, software, techniques, and other aids that support use of the standards. The aim is to provide the building and construction community with standard terminology and evaluation practices that will guide economic evaluation of all types of investment over a project’s life cycle—ranging from the planning, programming, and design phases through the construction, operations, decommissioning, and disposal phases. Intended users of the standards and adjuncts are: manufacturers and producers; federal, state, and local government agencies; private building owners; constructors; building code bodies; architectural/engineering firms; consumers’ groups; trade associations; research groups; consulting firms; and universities. The subcommittee’s early efforts focused primarily on the application of economic analysis to energy conservation measures in buildings.1, 2 These efforts resulted in a standard practice for measuring the life-cycle costs of buildings and building systems, E 917.3 E 917 was first issued by ASTM in 1983. Over the ensuing years, E 917 has been revised and expanded to meet new and emerging needs.
1 Ruegg, Rosalie T., Petersen, Stephen R., and Marshall, Harold E. 1980. Recommended Practice for Measuring Life-Cycle Costs of Buildings and Building Systems, NBSIR 80-2040. Gaithersburg, MD: National Bureau of Standards. 2 Ruegg, Rosalie, T., and Petersen, Stephen R. 1987. Comprehensive Guide for Least-Cost Energy Decisions, NBS Special Publication 709. Gaithersburg, MD: National Bureau of Standards. 3 ASTM International. “Practice for Measuring Life-Cycle Costs of Buildings and Building Systems,” E 917, Annual Book of ASTM Standards: 2010, Vol. 4.11. West Conshohocken, PA: ASTM International.

2
The structured approach taken in ASTM Standard Practice E 917 allowed additional measures of economic performance to be derived from the various input factors required to calculate life-cycle costs. The concept of a savings-to-investment ratio, where cost avoidance was of paramount importance, was developed as an alternative to the traditional benefit-to-cost ratio that is frequently used in economic analyses—in some cases inappropriately. Standard Practice E 9644 is especially significant because it both established the savings-to-investment ratio (SIR) methodology and specified a “rule set” for the proper calculation and interpretation of the benefit-to-cost ratio. Three additional practices were then issued by ASTM shortly thereafter; they were concerned with the measurement of: (1) internal rates of return, E 1057;5 (2) net benefits and net savings, E 1074;6 and (3) payback, E 1121.7 In the late 1980s, two standards development efforts were launched that served to broaden the scope of the subcommittee’s activities. These efforts were concerned with the treatment of risk and uncertainty8 and the concept of an elemental classification.9 Although the treatment of risk and uncertainty, as described in ASTM Standard Guide E 1369,10 has important implications for the calculation and interpretation of the measures of economic performance specified in ASTM Standard Practices E 917, E 964, E 1057, E 1074, and E 1121, the guidance provided in E 1369 strengthened the subcommittee’s activities in the discipline of decision science. The application of decision science in the treatment of risk-informed decision making has emerged as a common thread across many of the E06.81 standards. The concept of an elemental classification further opened the subcommittee to new applications of economic analysis in constructed facilities. The development of the UNIFORMAT II elemental classification was both the most challenging and most rewarding effort that the subcommittee had undertaken. It was challenging due to the diverse set of stakeholders that needed to come to consensus on its purpose and its structure. It was rewarding
4 ASTM International. “Practice for Measuring Benefit-to-Cost and Savings-to-Investment Ratios for Buildings and Building Systems,” E 964, Annual Book of ASTM Standards: 2010, Vol. 4.11. West Conshohocken, PA: ASTM International. 5 ASTM International. “Practice for Measuring Internal Rate of Return and Adjusted Internal Rate of Return for Investments in Buildings and Building Systems,” E 1057, Annual Book of ASTM Standards: 2010, Vol. 4.11. West Conshohocken, PA: ASTM International. 6 ASTM International. “Practice for Measuring Net Benefits and Net Savings for Investments in Buildings and Building Systems,” E 1074, Annual Book of ASTM Standards: 2010, Vol. 4.11. West Conshohocken, PA: ASTM International. 7 ASTM International. “Practice for Measuring Payback for Investments in Buildings and Building Systems,” E 1121, Annual Book of ASTM Standards: 2010, Vol. 4.11. West Conshohocken, PA: ASTM International. 8 Marshall, Harold E. 1988. Techniques for Treating Uncertainty and Risk in the Economic Evaluation of Building Investments, NIST Special Publication 757. Gaithersburg, MD: National Institute of Standards and Technology. 9 Bowen, Brian, Charette, Robert P., and Marshall, Harold E. 1992. UNIFORMAT II: A Recommended Classification for Building Elements and Related Sitework, NIST Special Publication 841. Gaithersburg, MD: National Institute of Standards and Technology. 10 ASTM International. “Guide for Selecting Techniques for Treating Uncertainty and Risk in the Economic Evaluation of Buildings and Building Systems,” E 1369, Annual Book of ASTM Standards: 2010, Vol. 4.11. West Conshohocken, PA: ASTM International.

3
because its release as ASTM Standard Classification E 155711 brought new members to the subcommittee, many of whom were interested in other types of constructed facilities as well as buildings. To date, the Building Economics Subcommittee has produced 26 standards, two adjuncts, and two software products.12 These standards cover a wide variety of constructed facilities and serve as decision support tools for a wide range of applications.13 1.2 Purpose The purpose of this report is twofold. First, this report provides an overview of the 26 standards developed within the ASTM Subcommittee on Building Economics along with a description of how these standards are being used to promote more cost-effective decisions for the design, construction, operation, and disposal of constructed facilities. Second, the report contains a detailed case study illustrating how many of the subcommittee’s standards can be applied to a complex transportation project. 1.3 Scope and Approach The report consists of three chapters in addition to the Introduction. The Introduction concludes with a discussion of key cross-cutting themes. These themes include basic economic concepts, project components, and the life-cycle phases of a typical constructed facility. Chapter 2 provides an overview of the 26 standards developed within the ASTM Subcommittee on Building Economics. Chapter 2 contains four sections; the sections group the ASTM E06.81 standards by topic: (1) cost data presentation and analysis; (2) value analysis; (3) risk management; and (4) economic evaluation. Section 2.1 describes the 10 standards focused on compiling, analyzing, reporting, and summarizing cost data. Section 2.2 describes three standard practices for measuring the value of construction-related systems and attributes. Section 2.3 describes five standards for measuring and managing risk. Section 2.4 describes seven standards for measuring economic performance and for reporting the results of an economic evaluation. Chapter 3 contains a detailed case study illustrating how many of the subcommittee’s standards can be applied to a complex transportation project. The case illustration uses the design and construction of the Gateway Arch Bridge in Taylor, MI. The Gateway Arch Bridge was part of the reconstruction of Interstate 94 (I-94) for Super Bowl XL held in 2006. The case illustration discusses the bridge’s innovative design and engineering
11 ASTM International. “Classification for Building Elements and Related Sitework—UNIFORMAT II,” E 1557, Annual Book of ASTM Standards: 2010, Vol. 4.11. West Conshohocken, PA: ASTM International. 12 Readers interested in purchasing copies of individual standards, adjuncts, or software products may obtain them by contacting ASTM Customer Service at [email protected]. 13 Readers interested in the E06.81 compilation of standards (ASTM International. 2012. ASTM Standards on Building Economics. 7th Edition. West Conshohocken, PA: ASTM International.) may obtain copies from ASTM International Headquarters by ordering BLDGECON12, or by contacting ASTM Customer Service at [email protected].

4
features, the extensive use of prefabricated components as cost and schedule control measures, and the use of ASTM standards to achieve a balance between performance and life-cycle economy. The Gateway Arch Bridge won six awards, including two national awards. A major criterion in its selection as an award recipient was its cost effectiveness. Chapter 4 provides a summary and recommendations for further research. Specifically, four additional UNIFORMAT II classifications are proposed for development: (1) tunnels; (2) highways; (3) railroads; and (4) water treatment and distribution. Each of these classifications corresponds to a critical infrastructure need identified in the American Society of Civil Engineers Report Card for America’s Infrastructure.14 1.4 A Note on Key Cross-Cutting Themes Economics deals with the efficient allocation of resources. In the context of constructed facilities, these resources include requirements, plans, labor, materials, equipment, information, and physical components, all of which have dollar values associated with them. Thus, economics helps decision makers choose more cost-effective combinations of resources. Once the need for a new, expanded, or modernized constructed facility has been identified, a “project” to deliver that facility comes into being. The project delivery process begins when the client identifies the need and concludes when the constructed facility is turned over to the client. The project delivery process, which may last anywhere from a few months to a few years, is not the end of the life-cycle of a constructed facility. The life-cycle of a typical constructed facility often spans many decades and is largely concerned with the operation and maintenance activities required to meet the client’s need. Therefore, decisions made during the project delivery process may have significant financial and operational impacts over the course of a constructed facility’s life cycle. These impacts are measured via cash flows, both negative due to increased operational expenses and positive due to increased sales of goods and services. The time-value of money concept is used in order to deal with the different timing of cash flows associated with the constructed facility. Basically, this is done through the use of a discount rate, which equates or discounts dollars occurring in different years to a common time, referred to as the base year. Although the project may be the construction of a new building, bridge, or industrial facility, the focus of the economic evaluation may be the entire facility, a system, a component, or a material. For example, if the client desires a net-zero energy,15 high-performance building, the emphasis might be primarily on the building’s heating ventilating, and air-conditioning (HVAC) system and the integrity of its exterior envelope. If the client is also interested in having a green building, environmental attributes associated with building materials will be of interest. In such cases, software
14 American Society of Civil Engineers (ASCE). 2009. ASCE 2009 Report Card for America’s Infrastructure. Reston, VA: American Society of Civil Engineers. 15 A net-zero energy building is one that produces as much energy as it consumes.

5
tools, such as Building for Environmental and Economic Sustainability (BEES),16 will complement the various standards referenced in Chapter 2. Because the life cycle of a constructed facility may span many decades, it is useful to define the various phases in the life cycle. Commonly used phases in the life cycle of a constructed facility are: (1) planning; (2) programming; (3) design; (4) construction; (5) operations; and (6) disposal. A brief description of each phase follows. Readers interested in a more detailed description of each phase are referred to Charette and Marshall.17 Phase 1—Planning: This is the period during which a need is identified and alternatives are developed and analyzed for satisfying the need. Site requirements are defined and analyzed for each alternative. Preliminary schedules and cost estimates are made. If a decision to proceed is made, necessary authorizations and appropriations are obtained to proceed with the programming phase. Phase 2—Programming: This is the period during which project requirements in terms of scope, quality, cost, and schedule are defined. The programming phase defines user needs and sets objectives and guidelines for design professionals. In addition, owners, users, designers, and project managers use the programming phase to evaluate the suitability of proposed design solutions. Key outputs from the programming phase include: (1) functional requirements for the facility and the site; (2) performance specifications and technical requirements;18 (3) master schedule for design and construction tasks, milestones, and completion dates; and (4) cost estimate.19 Phase 3—Design: This is the period during which the Phase 2 stated needs are translated into plans and specifications. Detailed solutions to technical requirements, updated cost estimates, and revised schedules are submitted for client approval as the design progresses. Funds are appropriated, bids requested, and contracts awarded. The design phase is often subdivided into three sub-phases: schematic design, design development, and construction documents. Schematic design establishes the general scope, conceptual design, and the scale relationships among the parts of the project. The primary goal is to clearly define a feasible concept within the allocated budget in a form that the client understands and approves before proceeding to design development. In design development, all aspects of the design for each discipline are developed and coordinated. Design development ends with approval by the client of the plans, projected cost, and schedule. In the construction documents sub-phase, the design team works on
16 Lippiatt, Barbara C. 2007. BEES 4.0: Building for Environmental and Economic Sustainability Technical Manual and User Guide, NISTIR 7423. Gaithersburg, MD: National Institute of Standards and Technology. 17 Charette, Robert P., and Marshall, Harold E. 1999. UNIFORMAT II: Elemental Classification for Building Specifications, Cost Estimating, and Cost Analysis, NISTIR 6389. Gaithersburg, MD: National Institute of Standards and Technology. 18 Many organizations incorporate technical requirements in their “design standards” documentation. 19 This estimate is also a cost plan for comparing subsequent estimates and monitoring and controlling costs as design progresses.

6
the final material and system selections, details, and dimensions. Final plans and construction specifications are provided to bidders, and contracts are awarded. Phase 4—Construction: This is the period during which plans and specifications are implemented into a finished structure that conforms to the specification requirements, construction schedule, and budget. Following commissioning, or start-up for industrial facilities, the constructed facility is ready for use by the client. Phase 5—Operations: This is the longest phase of a constructed facility’s life cycle, during which it is operated to fulfill the client’s objectives. During this phase, a constructed facility may be retrofitted or recycled for a new function any number of times. Phase 6—Disposal: This phase involves the decommissioning of the constructed facility, which often results in its removal from the site. The phases of a constructed facility’s life cycle are especially important because they often drive the use of specific standards. Decisions made in Phases 1 through 4 may have significant cost impacts in Phase 5, where operations and maintenance costs dominate. For this reason, life-cycle cost analysis and elemental classifications are most effective when used in the early stages of the constructed facility’s life cycle. Using these and other building economics standards in the early life cycle phases both reduces the cost of applying the standards and increases the expected cost savings from better-informed selections of materials, components, and systems. The UNIFORMAT II elemental classification for buildings and related sitework is exceptionally versatile in that it has well-defined applications in all six life-cycle phases. In addition, UNIFORMAT II is the basis for several widely used cost estimating guides, most notably those published by RS Means20 and Whitestone Research.21 As a result of UNIFORMAT II’s broad applicability, the Building Economics Subcommittee has developed a set of guidelines for use in establishing a family of UNIFORMAT II elemental classifications. It is believed that future UNIFORMAT II elemental classifications for bridges and other types of constructed facilities will benefit a wide variety of construction industry stakeholders.
20 RS Means. 2010. Building Construction Cost Data: 68th Annual Edition. Kingston, MA: Reed Construction Data, Inc. 21 Whitestone Research. 2010. Facility Maintenance and Repair Cost Reference 2010-2011: 15th Edition. Santa Barbara, CA: Whitestone Research.

7
2 Applications of ASTM Building Economics Standards This chapter provides an overview of the 26 standards developed within the ASTM Subcommittee on Building Economics along with a description of how these standards are being used to promote more cost-effective decisions for the design, construction, operation, and disposal of constructed facilities. The chapter contains four sections; the sections group the ASTM E06.81 standards by topic: (1) cost data presentation and analysis; (2) value analysis; (3) risk management; and (4) economic evaluation. Terminology is an important part in all of the E06.81 standards. ASTM Standard Terminology of Building Economics, E 833,22 provides definitions of economic techniques and terms used in the 25 standards described in Sections 2.1 through 2.4. The terminology standard, E 833, is constantly evolving as new standards are developed by the subcommittee. 2.1 Cost Data Presentation and Analysis Table 2.1 lists building economics standards focused on compiling, analyzing, reporting, and summarizing cost data. Table 2.1 lists 10 standards—six standard classifications, one standard guide, and three standard practices. Brief descriptions of each standard are given in the text which follows.
E 1557: Standard Classification for Building Elements and Related Sitework—UNIFORMAT II
ASTM Standard Classification E 155723 establishes a classification of building elements and related sitework. Elements, as defined in E 1557, are major components common to most buildings. Elements usually perform a given function, regardless of the design specification, construction method, or materials used. E 1557 serves as a consistent reference for analysis, evaluation, and monitoring during feasibility, planning, and design stages of buildings. Using UNIFORMAT II ensures consistency in economic evaluation of building-related projects over time and from project to project. E 1557 also enhances reporting at all stages in construction—from planning through the preparation of working documents, construction, maintenance, rehabilitation, and disposal. E 1557 excludes specialized process equipment related to a building’s functional use but does include furnishings and equipment. The UNIFORMAT II hierarchy consists of three levels—Level 1, Major Group Elements; Level 2, Group Elements; and Level 3, Individual Elements. Thus, the core concept of an element resides at Level 3. The latest version of E 1557 focuses primarily on buildings but has broad applicability to other types of constructed entities. Current applications of E 1557 include: planning estimates; program estimates; preliminary project descriptions; preliminary construction
22 ASTM International. “Terminology of Building Economics,” E 833, Annual Book of ASTM Standards: 2010, Vol. 4.11. West Conshohocken, PA: ASTM International. 23 ASTM International. “Classification of Building Elements and Related Sitework—UNIFORMAT II,” E 1557, Annual Book of ASTM Standards: 2010, Vol. 4.11. West Conshohocken, PA: ASTM International.

8
schedules and cash flow projections; design phase estimates; CAD layering and building information modeling (BIM); life-cycle cost analysis reporting; checklists for technical design reviews; construction progress reporting and interim payments; construction claims analysis; building condition assessment; organizing design, engineering, and construction cost information for manuals and databases; and organizing maintenance and life-cycle cost data.24 Table 2.1 Building Economics Standards Focused on Compiling, Analyzing,
Reporting, and Summarizing Cost Data
Standard Title
E 1557 Standard Classification for Building Elements and Related Sitework‐UNIFORMAT II
E 1804Standard Practice for Performing and Reporting Cost Analysis During the Design
Phase of a Project
E 2083Standard Classification for Building Construction Field Requirements and Office
Overhead and Profit
E 2103 Standard Classification for Bridge Elements and Related Approach Work
E 2150Standard Classification for Life‐Cycle Environmental Work Elements‐
Environmental Cost Element Structure
E 2166 Standard Practice for Organizing and Managing Building Data
E 2514Standard Practice for Presentation Format of Elemental Cost Estimates,
Summaries, and Analyses
E 2516 Standard Classification for Cost Estimate Classification System
E 2620 Standard Classification for Program and Project Estimate Summaries
E 2637Standard Guide for Utilizing the Environmental Cost Element Structure Presented
by Classification E 2150
The widespread use of E 1557 sparked interest in standard classifications for other types of constructed entities. Several ASTM standard classifications were subsequently
24 Charette, Robert P., and Marshall, Harold E. 1999. UNIFORMAT II: Elemental Classification for Building Specifications, Cost Estimating, and Cost Analysis, NISTIR 6389. Gaithersburg, MD: National Institute of Standards and Technology.

9
developed, most notably a bridge-related classification, E 2103.25 However, standard classification E 2103 differed from the underlying “elemental” concept that was at the heart of E 1557. To address the need for a more rigorous “family” of classification standards based on the UNIFORMAT II elemental concept, the Building Economics Subcommittee, ASTM E06.81, formed a task group charged with the development of a set of “Guidelines for Developing UNIFORMAT II Standard Classifications.”26 The UNIFORMAT II Guidelines were first approved by the Building Economics Subcommittee in April 2009.
E 1804: Standard Practice for Performing and Reporting Cost Analysis During the Design Phase of a Project
ASTM Standard Practice E 180427 provides an organized approach for cost analysis during the design phase of a construction project. The practice presents the necessary information for the design professional and owners to make decisions. E 1804 establishes a procedure for formatting the final project information for its use in forecasting the cost of future projects. The practice increases the level of communication, provides an organized approach to cost control during the design of a project, and also provides a means of identifying extraordinary cost items and changes in assumptions between estimates. Users of E 1804 include owners, developers, contractors, cost professionals, estimators, architects, engineers, specification writers, quantity surveyors, and anyone charged with the responsibility of successfully managing the design of a building within a specified budget. Use of the E 1804 reporting format is recommended when: (1) contracting for design cost analysis services; (2) comparing the current design costs to a previous estimate; and (3) responding to each design phase. This practice provides a tool for analyzing design options and examining strategies to maintain the building budget.
E 2083: Standard Classification for Building Construction Field Requirements and Office Overhead and Profit
ASTM Standard Classification E 208328 covers field requirements, office overhead, and profit for use in construction estimating. E 2083 is common to all forms of construction, and its components are an integral part of any construction cost estimate. Thus, this classification defines an integral part of any construction estimate and cost record. E 2083 classifies the non-permanent portion of the construction activity that is essential to allow physical implementation of the required work to take place. The classification
25 ASTM International. “Classification for Bridge Elements and Related Approach Work,” E 2103, Annual Book of ASTM Standards: 2010, Vol. 4.11. West Conshohocken, PA: ASTM International. 26 ASTM International. “Guidelines for Developing UNIFORMAT II Standard Classifications,” Working Paper. West Conshohocken, PA: ASTM International. 27 ASTM International. “Practice for Performing and Reporting Cost Analysis During the Design Phase of a Project,” E 1804, Annual Book of ASTM Standards: 2010, Vol. 4.11. West Conshohocken, PA: ASTM International. 28 ASTM International. “Classification for Building Construction Field Requirements and Office Overhead and Profit,” E 2083, Annual Book of ASTM Standards: 2010, Vol. 4.11. West Conshohocken, PA: ASTM International.

10
serves as a consistent reference for analysis, evaluation, and monitoring during the planning, programming, design, and construction phases of building. Used in conjunction with UNIFORMAT II, E 1557, and other elemental classifications, including ASTM Standard Classification E 2168, it also ensures consistency in the economic evaluation of construction work across time and from project to project. Through consistency in estimating and cost recording, E 2083 enhances reporting at all stages in construction—from planning and programming through the preparation of working documents, construction, maintenance, rehabilitation, and disposal—and is a necessary part of the reporting process described in ASTM Standard Practice E 1804. This classification is sufficiently generic to allow its use in estimating all forms of construction work and through all stages of planning, design, use, and disposal. Additionally, it is appropriate for use in both elemental estimates and trade estimates.
E 2103: Standard Classification for Bridge Elements and Related Approach Work ASTM Standard Classification E 2103 applies to bridges and related approach work. It excludes specialized structures related to general highway use, but it does include bridge parapets, medians, drainage, and barriers needed to lessen vehicular impact. Although it follows the UNIFORMAT II hierarchy which consists of three levels—Level 1, Major Group Elements; Level 2, Group Elements; and Level 3, Individual Elements—it differs from the UNIFORMAT II elemental classification hierarchy in several ways that limits its applicability. Consequently, a major revision of E 2103 was initiated early in 2011. The proposed major revision of E 2103 is presented in a companion report;29 the proposed major revision is fully consistent with the UNIFORMAT II Guidelines document established by the ASTM E06.81 Subcommittee on Building Economics. The major revision of E 2103 was approved and reissued by ASTM in November 2011; it will promote its relevance, understanding, and acceptance in the bridge industry. The major revision, retitled Standard Classification of Bridge Elements—UNIFORMAT II, E 2103-11, will provide the basis for a comprehensive data set of bridge-related costs that will enable public and private decision makers to choose more cost-effective solutions for the design and construction of new bridges and the maintenance and repair of existing bridges across the Nation.
E 2150: Standard Classification for Life-Cycle Environmental Work Elements—Environmental Cost Element Structure
ASTM Standard Classification E 215030 provides a comprehensive hierarchy of elements for life-cycle environmental work. The classification is based on the Environmental Cost Element Structure (ECES) developed by the Interagency Environmental Cost Engineering Committee to increase the effectiveness of cost management for federal
29 Muthiah Kasi and Robert E. Chapman. 2011. Proposed UNIFORMAT II Classification of Bridge Elements, NIST Special Publication 1122. Gaithersburg, MD: National Institute of Standards and Technology. 30 ASTM International. “Classification for Life-Cycle Environmental Work Elements—Environmental Cost Element Structure,” E 2150, Annual Book of ASTM Standards: 2010, Vol. 4.12. West Conshohocken, PA: ASTM International.

11
environmental remediation projects.31 Elements, as defined in E 2150, are major components common to environmental remediation projects. The elements represent the life-cycle activities for environmental remediation projects regardless of the project design specification, construction method, technology type, or materials used. The classification serves as a consistent reference for cost estimating, analysis, and monitoring during the various phases of the project life cycle. Using E 2150 ensures consistency, both over time and from project to project, in the cost management and performance measurement of environmental projects. It also enhances reporting at all phases of an environmental remediation project, from assessment and studies through design, construction, operations and maintenance, and surveillance and long-term monitoring. E 2150 applies to all environmental work, including environmental restoration, waste management, decontamination and decommissioning, surveillance and long-term monitoring, and technology development. The use of E 2150 increases the level of standardization, uniformity, and consistency of collected environmental project costs. Such uniformity and standardization allows for ease of understanding project costs, provides a common cost language for sharing and comparing cost information, and allows for easier analysis and calibration of cost data. E 2150 can also be used as a checklist of activities to be completed in environmental remediation projects. The E 2150 standard is limited to two levels. Level 1 depicts the life-cycle phases or time-frame of environmental work. Level 2 of the classification represents the major work elements that need to be performed in an environmental project. The Environmental Cost Element Structure Adjunct32 supports the application of the E 2150 standard. The Adjunct provides three additional, complementary ECES levels (Levels 3, 4, and 5) to the E 2150 standard’s Levels 1 and 2. The lower levels of the ECES are essential for a complete description of environmental projects, and they provide the supporting detail to the classification standard.
E 2166: Standard Practice for Organizing and Managing Building Data ASTM Standard Practice E 216633 covers the organization of building information to support informed decision making. The kinds of data considered in this practice include text, numeric, and graphic data. The system of organization is applicable to a wide range of data collection and organization from routine in-depth analysis of a single building, to situations where many buildings must be evaluated and prioritized in a short time frame. The organizational structure is based on UNIFORMAT II, E 1557, a system which groups building elements according to the way buildings are constructed and function. Use this practice to organize information that describes new or existing buildings of any size. The UNIFORMAT II hierarchy enables the user to focus on building elements in functionally consistent groups. It can be applied by an administrator initiating a data
31 U.S. Department of Energy. 2002. Environmental Cost Element Structure. Washington, DC: Interagency Environmental Cost Engineering Committee. 32 Available from ASTM International Headquarters by ordering Adjunct No. ADJE2150, or by contacting ASTM Customer Service at [email protected]. 33 ASTM International. “Practice for Organizing and Managing Building Data,” E 2166, Annual Book of ASTM Standards: 2010, Vol. 4.12. West Conshohocken, PA: ASTM International.

12
system as a facility standard, as well as a consultant reporting on building conditions. A consistent method of arrangement for subject matter expedites the preparation and use of source documents, and simplifies the process of comparing information from several sources. This practice is suitable for arranging the content of individual reports, managing physical files, as well as automated data applications. E 2166 provides a consistent and comprehensive outline suitable to track the evolution of specific building conditions in one or many buildings. This practice can be applied to historical building data as well as new information.
E 2514: Standard Practice for Presentation Format of Elemental Cost Estimates, Summaries, and Analyses
ASTM Standard Practice E 251434 covers the concurrent use of relevant ASTM standards for the preparation of elemental cost estimates, summaries, and analyses and specifically their presentation in a concise, consistent, and logical manner. E 2514 provides a framework for elemental cost presentation, especially when used for design stage construction cost estimating of buildings. The standard also: (1) identifies three arrangements—estimate, summary, and analysis—of an elemental cost presentation; (2) provides conventions for use in completing these presentations; and (3) provides suggestions for some typical uses, including reporting, error checking, change tracking, and comparison, through the planning, design, construction and final archival record stages common to all building projects. E 2514 is about arrangement, format, and presentation only; it is not an estimating manual.
E 2516: Standard Classification for Cost Estimate Classification System ASTM Standard Classification E 251635 provides a generic classification system for cost estimates and provides guidelines for applying the classification to cost estimates. This classification maps the phases and stages of cost estimating to a generic maturity and quality matrix, keyed to a level of project definition, that can be applied across a wide variety of industries. E 2516 has been developed in a way that: (1) provides a common understanding of the concepts involved with classifying cost estimates; (2) defines and correlates the major characteristics used in classifying cost estimates; and (3) uses the degree of project definition as the primary characteristic used to characterize estimate classes. Use of this classification will improve communication among all stakeholders involved in preparing, evaluating, and using cost estimates. Estimate classifications provide valuable additional reporting information when used as an adjunct to ASTM Standard Practice E 1804.
34 ASTM International. “Practice for Presentation Format of Elemental Cost Estimates, Summaries, and Analyses,” E 2514, Annual Book of ASTM Standards: 2010, Vol. 4.12. West Conshohocken, PA: ASTM International. 35 ASTM International. “Classification for Cost Estimate Classification System,” E 2516, Annual Book of ASTM Standards: 2010, Vol. 4.12. West Conshohocken, PA: ASTM International.

13
E 2620: Standard Classification for Program and Project Estimate Summaries ASTM Standard Classification E 262036 establishes a classification of cost summaries for use when estimating program and project costs. Program and project estimates are a necessary part of planning and implementing any program of work. These estimates are used by persons involved in the planning and management of programs and projects. They are an essential part of establishing initial budgets and provide a framework for continuing updates, permitting cost control through the life of a program and its various projects. Users include owners, developers, facilities programmers, financial managers, company controllers, executives, program managers, project managers, and specialist cost planners, including life-cycle cost analysts.
E 2637: Standard Guide for Utilizing the Environmental Cost Element Structure Presented by Classification E 2150
The Environmental Cost Element Structure (ECES) covered by the E 2150 standard and the Adjunct to E 2150 provides a consistent and comprehensive structure across all phases of environmental remediation projects and is a tool to improve cost management of those projects. ASTM Standard Guide E 263737 facilitates the application of the E 2150 standard to any environmental remediation project, without regard to project size. The E 2150 standard establishes the broad, top-level framework for environmental remediation projects by providing a hierarchical list of project elements to two levels of detail. Its associated Adjunct supports the top-level structure by providing more detailed elements and definitions of the ECES to three additional levels of detail. Although it is assumed that the user is familiar with ASTM Standard Classification E 2150, much of the content of the classification is contained in this guide to relieve the user of the burden of back-and-forth referencing during use. 2.2 Value Analysis Table 2.2 lists three standard practices for measuring the value of construction-related systems and attributes. Brief descriptions of each standard are given in the text which follows.
E 1699: Standard Practice for Performing Value Analysis (VA) of Buildings and Building Systems and Other Constructed Projects
ASTM Standard Practice E 169938 covers a procedure for defining and satisfying the requirements of the user’s/owner’s project. A multidisciplinary team uses the procedure
36 ASTM International. “Classification for Program and Project Estimate Summaries,” E 2620, Annual Book of ASTM Standards: 2010, Vol. 4.12. West Conshohocken, PA: ASTM International. 37 ASTM International. “Guide for Utilizing the Environmental Cost Element Structure Presented by Classification E 2150,” E 2637, Annual Book of ASTM Standards: 2010, Vol. 4.12. West Conshohocken, PA: ASTM International. 38 ASTM International. “Practice for Performing Value Analysis (VA) of Buildings and Building Systems and Other Constructed Projects,” E 1699, Annual Book of ASTM Standards: 2010, Vol. 4.11. West Conshohocken, PA: ASTM International.

14
to convert design criteria and specifications into descriptions of project functions and then relates these functions to revenues and costs. This is a procedure to develop alternatives that meet the constructed facility’s required functions. Estimate the costs for each alternative. Provide the user/owner with specific, technically accurate alternatives, appropriate to the stage of project development, which can be implemented. The user/ owner selects the alternative(s) that best satisfies their needs and requirements. Apply this practice to an entire project or to any subsystem. The user/owner can utilize the value analysis procedure to select the element or scope of the project to be studied. Perform value analysis during the planning, design, and construction phases of a project. The most effective application of value analysis is early in the design phase of a project. Changes or redirection in the design can be accommodated without extensive redesign at this point, thereby saving the user/owner time and money.
Table 2.2 Building Economics Standard Practices for Measuring the Value of Construction-Related Systems and Attributes
Standard Title
E 1699Standard Practice for Performing Value Analysis (VA) of Buildings and
Building Systems and Other Constructed Projects
E 1765
Standard Practice for Applying Analytical Hierarchy Process (AHP) to
Multiattribute Decision Analysis of Investments Related to Buildings
and Building Systems
E 2013Standard Practice for Constructing FAST Diagrams and Performing
Function Analysis During Value Analysis Study
E 1765: Standard Practice for Applying Analytical Hierarchy Process (AHP) to Multiattribute Decision Analysis of Investments Related to Buildings and Building
Systems ASTM Standard Practice E 176539 presents a procedure for calculating and interpreting analytical hierarchy process (AHP) scores of a project’s total overall desirability when making building-related capital investment decisions. The AHP is one of a set of multiattribute decision analysis methods that considers nonmonetary attributes (qualitative and quantitative) in addition to common economic evaluation measures (such as life-cycle costing) when evaluating project alternatives. Building-related decisions depend in part on how competing options perform with respect to nonmonetary attributes. E 1765 complements existing ASTM standards on building economics by incorporating the existing economic/monetary measures of worth described in those standards into a
39 ASTM International. “Practice for Applying Analytical Hierarchy Process (AHP) to Multiattribute Decision Analysis of Investments Related to Buildings and Building Systems,” E 1765, Annual Book of ASTM Standards: 2010, Vol. 4.11. West Conshohocken, PA: ASTM International.

15
more comprehensive standard method of evaluation that includes nonmonetary (qualitative and quantitative) benefits and costs. The AHP has three significant strengths: (1) an efficient attribute weighting process of pairwise comparisons; (2) hierarchical descriptions of attributes, which keep the number of pairwise comparisons manageable; and (3) available software to facilitate its use. E 1765 presents a stand-alone procedure for performing an AHP analysis. In addition, an ASTM software product for performing AHP analyses has been developed to support and facilitate the use of this practice.40
E 2013: Standard Practice for Constructing FAST Diagrams and Performing Function Analysis During Value Analysis Study
The function analysis systems technique (FAST) helps the user identify the alternatives that are highly valued with respect to their cost. ASTM Standard Practice E 201341 establishes a communication format through which all owners/users/stakeholders can understand, analyze, revise, and agree on the purposes of the project. E 2013 presents a method by which owners’/users’/stakeholders’ needs and desires are compared to the cost of satisfying those needs and desires. This is done by identifying low performance/high cost functions and high performance/low cost functions. These data will be used in the value analysis study as a basis to create alternative solutions. This practice helps developers, owners, users, stakeholders, planners, contractors, architects, engineers, value analysts, cost professionals, and anyone who is responsible for the budget, construction, maintenance, or operation of the project. Function analysis is performed after the collection of relevant information and prior to the identification of alternatives. 2.3 Risk Management Table 2.3 lists two standard guides, two standard practices, and one standard classification for measuring and managing risk. Brief descriptions of each standard are given in the text which follows. E 1369: Standard Guide for Selecting Techniques for Treating Uncertainty and Risk in
the Economic Evaluation of Buildings and Building Systems ASTM Standard Guide E 136942 covers techniques for treating uncertainty in input values to an economic analysis of a building investment project. The guide also recommends techniques for evaluating the risk that a project will have a less favorable economic outcome than what is desired or expected. The techniques covered in E 1369 include breakeven analysis, sensitivity analysis, risk-adjusted discounting, the mean-variance criterion and coefficient of variation, decision analysis, and simulation. The
40 ASTM International. 1998. User’s Guide to AHP/Expert Choice for Building Evaluation, MNL 29. West Conshohocken, PA: ASTM International. 41 ASTM International. “Practice for Constructing FAST Diagrams and Performing Function Analysis During Value Analysis Study,” E 2013, Annual Book of ASTM Standards: 2010, Vol. 4.11. West Conshohocken, PA: ASTM International. 42 ASTM International. “Guide for Selecting Techniques for Treating Uncertainty and Risk in the Economic Evaluation of Buildings and Building Systems,” E 1369, Annual Book of ASTM Standards: 2010, Vol. 4.11. West Conshohocken, PA: ASTM International.
16
techniques can be used with economic methods that measure economic performance, such as E 917, E 964, E 1057, E 1074, and E 1121. The guide describes circumstances when measuring uncertainty and risk may be helpful in economic evaluations of building investments. E 1369 defines uncertainty, risk exposure, and risk attitude. The guide presents nonprobabilistic and probabilistic techniques for measuring uncertainty and risk exposure. The guide describes briefly each technique, gives the formula for calculating a measure where appropriate, illustrates the technique with a case example, and summarizes the advantages and disadvantages.
Table 2.3 Building Economics Standards for Measuring and Managing Risk
Standard Title
E 1369
Standard Guide for Selecting Techniques for Treating
Uncertainty and Risk in the Economic Evaluation of Buildings
and Building Systems
E 1946Standard Practice for Measuring Cost Risk of Buildings and
Building Systems
E 2168Standard Classification for Allowance, Contingency, and
Reserve Sums in Building Construction Estimating
E 2506Standard Guide for Developing a Cost‐Effective Risk
Mitigation Plan for New and Existing Constructed Facilities
E 2691 Standard Practice for Job Productivity Measurement
E 1946: Standard Practice for Measuring Cost Risk of Buildings and Building Systems ASTM Standard Practice E 194643 covers a procedure for measuring cost risk for buildings and building systems. The practice uses the Monte Carlo simulation technique as described in E 1369. Building cost risk analysis provides a tool for building owners, architects, engineers, and contractors to measure and evaluate the cost risk exposures of their building construction projects. Building cost risk analysis can be applied to a building project’s contract cost, construction cost (contract cost plus construction change orders), and project cost (construction cost plus owner’s cost), depending on the users’ perspectives and needs. E 1946 refers to contract cost, construction cost, and project cost as building cost. A building cost estimate consists of many variables. Even though each variable contributes to the total building cost risk, not every variable makes a significant enough contribution to warrant inclusion in the cost risk model. E 1946 identifies the
43 ASTM International. “Practice for Measuring Cost Risk of Buildings and Building Systems,” E 1946, Annual Book of ASTM Standards: 2010, Vol. 4.11. West Conshohocken, PA: ASTM International.

17
critical elements in order to simplify the cost risk model. The practice shows how to: (1) quantify risks in critical elements; (2) create a cost risk model; (3) conduct a Monte Carlo simulation once the risks in the critical elements are quantified and the cost risk model is set up; (4) interpret the results of the simulation; and (5) conduct a sensitivity analysis to determine the relative contribution of each critical element to the total building cost risk.
E 2168: Standard Classification for Allowance, Contingency, and Reserve Sums in Building Construction Estimating
In building construction estimating the terms allowance, contingency, and reserve are often used almost interchangeably and are assumed to be universally understood, yet they often mean different things to different people. Consequently, they can be ambiguous in meaning and intent. Applying these terms according to ASTM Standard Classification E 216844 adds a needed precision and rigor in their use as each term is held to be specific in its meaning, intent, and use. E 2168 establishes a classification for allowance, contingency, and reserve sums used in construction, project, and program estimating. This classification applies to all construction work. E 2168 is not based on permanent physical elements of construction, as defined and classified in UNIFORMAT II, E 1557. Rather, the classification items are cost components common to construction, project, and program estimates. When preparing construction, project, and program cost estimates, it is often necessary to make monetary provision for change and/or risk or other exigencies where information is incomplete. Such allowance, contingency, or reserve sums are employed by many persons engaged in the planning, delivery, and financing of construction work. These users include owners, developers, facilities programmers, cost planners, estimators, schedulers, architects and engineers, specification writers, operating and maintenance staff, manufacturers, educators, and financial managers. These sums are especially appropriate when performing the following activities: cost budgeting; planning, design, and construction cost estimating; and controlling cost during planning, design, and construction. In any of these activities a needed requirement, or component, of the planned construction can be known while the defined solution, design, or specification, for providing it may not be known. The usual, and appropriate, response in these situations is the inclusion of a monetary sum, within an estimate, to provide for this (these) requirement(s). E 2168 defines allowance, contingency, and reserve sums as items common to construction, project, and program estimates. The terms are sufficiently generic to be applied in all forms of construction work. Allowance is defined as a sum of money that is intended to be spent on the planned scope of work; it is used in the absence of precise knowledge, and estimated, to the best of one’s abilities, to ensure a full and complete estimate. Allowances cover events and activities that are normally internal and so are directly controllable within the project plan. Contingency is defined as a sum of money that is provided to cover the occurrence of unintended departures from the planned scope of work; they are used in the absence of precise knowledge, and estimated, to the best of one’s knowledge to ensure that a financial buffer is available within a budget. Contingencies assist in mitigating the effects of unplanned events and
44 ASTM International. “Classification for Allowance, Contingency, and Reserve Sums in Building Construction Estimating,” E 2168, Annual Book of ASTM Standards: 2010, Vol. 4.12. West Conshohocken, PA: ASTM International.

18
other risks that are external to, and are not directly controllable within, a project plan. A reserve sum is a sum of money, usually held by management (client), to be disbursed only when project requirements are changed. A reserve sum is used to provide insurance against a project or program failing to complete on budget or for the revision of a budget in the case of changed management or program direction and requirement. E 2506: Standard Guide for Developing a Cost-Effective Risk Mitigation Plan for New
and Existing Constructed Facilities Protecting constructed facilities from extreme events—fires, floods, earthquakes, and other natural and man-made hazards—is a constant challenge for facility owners and managers. Choosing among alternative protection strategies is complicated by the fact that such strategies frequently have significant up-front investment costs, result in operations and maintenance costs that are spread over many years, and impact key stakeholders in different ways. A methodology is needed to insure that all relevant costs are captured and analyzed via well-defined metrics. To address this need, ASTM Standard Guide E 250645 presents a three-step protocol that establishes a methodology for dealing with extreme events. The three-step protocol has the following essential components: (1) risk assessment; (2) identification of potential mitigation strategies; and (3) economic evaluation. Risk assessment is used to identify the risks confronting a facility. It includes development of possible damage scenarios, probability assessments for these scenarios, and identification of the facility’s vulnerabilities and critical areas. Identification of mitigation strategies—engineering alternatives, management practices, and financial mechanisms—provides performance and cost data for the possible combinations of risk mitigation strategies. Combinations of risk mitigation strategies are used to create a candidate set of alternatives for in-depth economic evaluation. The third component, economic evaluation, enables facility owners and managers to evaluate each alternative combination of risk mitigation strategies and the sequence of cash flows associated with their implementation. Implementing the three-step protocol requires both guidance and data. Guidance is needed to help owners and managers to assess the risks facing their facility. Data about the frequency and consequences of natural and man-made hazards are needed when assessing the risks that a particular facility faces from these hazards. Estimates of the costs of protection are needed to insure that safeguarding personnel and physical assets and satisfying financial constraints are kept in balance. Finally, guidance on the use of economic evaluation methods is needed to insure that the correct method, or combination of methods, is used. Although there is a great deal of high-quality information available on risk assessment and risk management, natural and man-made hazards, and economic tools, until recently there was no central source of data and tools to which the owners and managers of constructed facilities and other key decision makers can turn for help in
45 ASTM International. “Guide for Developing a Cost-Effective Risk Mitigation Plan for New and Existing Constructed Facilities,” E 2506, Annual Book of ASTM Standards: 2010. Vol. 04.12. West Conshohocken, PA: ASTM International.

19
developing a cost-effective risk mitigation plan. NIST Special Publication 1082 serves as such a central source.46
E 2691: Standard Practice for Job Productivity Measurement ASTM Standard Practice E 269147 measures both a construction productivity differential on an ongoing and periodic basis and average productivity over the life of a construction project. Job productivity measurement (JPM) calculates the ratio of output per unit of input: how much work—construction put in place—was produced by how many labor hours. Additionally, JPM provides an early warning signal for construction performance. It measures ongoing productivity changes, trends and anomalies resulting from changes on a construction jobsite. Thus, JPM enables contractors, project managers, supervisors, and foremen to react and improve productivity as the construction project unfolds. By comparing labor hours used against construction put in place, JPM allows for a unified measurement of established building elements based on the UNIFORMAT II elemental classification, E 1557. JPM establishes a process for measuring construction job productivity by comparing labor usage to construction put in place. E 2691 measures labor productivity of the installation processes on a construction job. Construction put in place is measured with input from the labor performing the installation, using elements of statistical process control and industrial engineering. E 2691 takes into account the difficulty of installation at any given point on a job. JPM evaluates relative productivity changes using trend monitoring. JPM, as implemented in E 2691, is a five step process: (1) establish a baseline labor hour budget for the scope of the construction job being measured using a work breakdown structure and reference to the UNIFORMAT II elemental classification; (2) evaluate the baseline labor hour budget for appropriate level of detail; (3) establish the labor productivity reference point; (4) track JPM measurements as soon as any labor hours are expended on the job—even before installation commences, with activities such as planning, layout, and pre-assembly; and (5) report the JPM productivity differential and review the results for signals of special causes impacting job productivity. 2.4 Economic Evaluation Investment decisions associated with alternative facility designs or systems are frequently project-related, where a project could be the construction of a new building, the renovation of an existing constructed facility (e.g., a bridge), or the modernization of an existing system (e.g., a heating, ventilation, air-conditioning system (HVAC) upgrade). For a given project, the decision maker has to choose among a number of competing alternatives, all of which satisfy the same functional requirements. If the project is to upgrade a building’s HVAC system, then each of the alternatives being considered will satisfy the functional requirements specified by the building’s owner/manager or some
46 Thomas, Douglas S., and Chapman, Robert E. 2008. A Guide to Printed and Electronic Resources for Developing a Cost-Effective Risk Mitigation Plan for New and Existing Constructed Facilities, NIST Special Publication 1082. Gaithersburg, MD: National Institute of Standards and Technology. 47 ASTM International. “Practice for Job Productivity Measurement,” E 2691, Annual Book of ASTM Standards: 2010. Vol. 04.12. West Conshohocken, PA: ASTM International.

20
other designated decision maker. At a higher level of aggregation, construction-related investment decisions often involve collections of projects. Table 2.4 lists seven building economics standards for measuring economic performance and for reporting the results of an economic evaluation. The five standard practices are all focused on how to use that practice to measure economic performance and how to interpret the results of the economic evaluation based on the application of that practice. The two guides serve two distinct purposes—namely how to choose among the five practices and how to report the results of the economic evaluation. Brief descriptions of each standard are given in the text which follows.
Table 2.4 Building Economics Standards for Measuring Economic Performance and Reporting the Results of an Economic Evaluation
Standard Title
E 917Standard Practice for Measuring Life‐Cycle Costs of Buildings and
Building Systems
E 964Standard Practice for Measuring Benefit‐to‐Cost and Savings‐to‐
Investment Ratios for Buildings and Building Systems
E 1057
Standard Practice for Measuring Internal Rate of Return and Adjusted
Internal Rate of Return for Investments in Buildings and Building
Systems
E 1074Standard Practice for Measuring Net Benefits and Net Savings for
Investments in Buildings and Building Systems
E 1121Standard Practice for Measuring Payback for Investments in Buildings
and Building Systems
E 1185Standard Guide for Selecting Economic Methods for Evaluating
Investments in Buildings and Building Systems
E 2204Standard Guide for Summarizing the Economic Impacts of Building‐
Related Projects
E 917: Standard Practice for Measuring Life-Cycle Costs of Buildings and Building Systems
ASTM Standard Practice E 917,48 the life-cycle cost (LCC) method, measures, in present-value or annual-value terms, the sum of all relevant costs associated with owning
48 ASTM International. “Practice for Measuring Life-Cycle Costs of Buildings and Building Systems,” E 917, Annual Book of ASTM Standards: 2010. Vol. 04.11. West Conshohocken, PA: ASTM International.

21
and operating a constructed facility over a specified period of time. The LCC method is reliable, straightforward, and widely applicable for finding the economically efficient choice among investment alternatives. The basic premise of the LCC method is that all costs arising from an investment decision are potentially important to that decision maker, including future as well as present costs. Applied to constructed facilities, the LCC method encompasses all relevant costs over a designated study period, including the costs of designing, purchasing/leasing, constructing/installing, operating, maintaining, repairing, replacing, and disposing of a particular design or system. Should any pure benefits result (e.g., increased rental income due to improvements), include them in the calculation of LCC. The LCC method is particularly suitable for determining whether the higher initial cost of a constructed facility or system specification is economically justified by lower future costs (e.g., reduced energy expenditures) when compared to an alternative with a lower initial cost but higher future costs. If a design or system specification has both a lower initial cost and lower future costs relative to an alternative, an LCC analysis is not needed to show that the former is economically preferable. The alternative with the lowest initial investment cost (i.e., first cost) is designated as the base case. The LCC method compares alternative, mutually exclusive, designs or system specifications that satisfy a given functional requirement on the basis of their life-cycle costs to determine which is the least-cost means (i.e., minimizes life-cycle cost) of satisfying that requirement over a specified study period. With respect to the base case, an alternative is economically preferred if, and only if, it results in lower life-cycle costs. The alternative that results in the lowest life-cycle cost is designated as the most cost-effective alternative.
E 964: Standard Practice for Measuring Benefit-to-Cost and Savings-to-Investment Ratios for Buildings and Building Systems
ASTM Standard Practice E 96449 covers the benefit-to-cost ratio (BCR) and the savings-to-investment ratio (SIR) methods. The BCR and SIR methods are reliable, straightforward, and widely applicable for finding the economically efficient choice among investment alternatives. These methods are numerical ratios whose value indicates the economic performance of a given alternative instead of investing in the foregone opportunity (e.g., some other alternative or the base case). The BCR equals benefits less non-investment costs divided by investment costs. The SIR equals savings divided by investment costs. The LCC method provides all of the necessary information to calculate both the BCR and the SIR. The BCR or the SIR for a given alternative is calculated vis-à-vis the base case. The numerator equals the difference in the present value of benefits (BCR) or cost savings (SIR) between the base case and the given alternative. The denominator equals the difference in the present value of investment costs for the given alternative and the base case. A ratio less than 1.0 indicates that the given alternative is an uneconomic investment relative to the base case; a ratio of 1.0 indicates an investment whose benefits or savings just equal its costs; and a ratio greater
49 ASTM International. “Practice for Measuring Benefit-to-Cost and Savings-to-Investment Ratios for Investments in Buildings and Building Systems,” E 964, Annual Book of ASTM Standards: 2010. Vol. 04.11. West Conshohocken, PA: ASTM International.

22
than 1.0 indicates an economic project. Any alternative that results in a BCR or an SIR greater than 1.0 is designated as cost effective.
E 1057: Standard Practice for Measuring Internal Rate of Return and Adjusted Internal Rate of Return for Investments in Buildings and Building Systems
ASTM Standard Practice E 105750 covers the internal rate of return (IRR) and adjusted internal rate of return (AIRR) methods. The IRR and AIRR methods are reliable, straightforward, and widely applicable for finding the economically efficient choice among investment alternatives. The IRR is the compound rate of interest that, when applied as a discount rate to a project’s stream of dollar benefits and costs, will equate them. The AIRR is the average annual yield from a project over the study period, taking into account reinvestment of interim receipts. The reinvestment rate in the AIRR calculation is equal to the minimum acceptable rate of return (MARR), which is assumed to equal the discount rate. When the reinvestment rate is made explicit, all investment costs are easily expressible as a time equivalent initial outlay (i.e., a value at the beginning of the study period) and all non-investment cash flows as a time equivalent terminal amount. This allows a straightforward comparison of the amount of money that comes out of the investment (i.e., the terminal value) with the amount of money put into the investment (i.e., the time equivalent initial outlay). The AIRR is defined as the interest rate applied to the terminal value, which equates (i.e., discounts) it to the time equivalent value of the initial outlay of investment costs. It is important to note that all investment costs are discounted to a time equivalent initial outlay using the discount rate. With regard to the base case, if the AIRR is greater than the discount rate (also referred to as the hurdle rate), then investment in the given alternative is economic; if the AIRR equals the discount rate, the investment is as good as the base case; if AIRR is less than the discount rate, the investment is uneconomical. Any alternative that results in an IRR or an AIRR greater than the discount rate is designated as cost effective.
E 1074: Standard Practice for Measuring Net Benefits and Net Savings for Investments in Buildings and Building Systems
ASTM Standard Practice E 107451 covers the present value of net benefits (PVNB) and present value of net savings (PVNS) methods. The PVNB and PVNS methods are reliable, straightforward, and widely applicable for finding the economically efficient choice among investment alternatives. The PVNB method calculates the difference between discounted benefits and discounted costs from investing in a given alternative instead of investing in the foregone opportunity (e.g., some other alternative or the base case) as a measure of the cost-effectiveness of a project. The PVNS method measures the net savings from investing in a given alternative instead of investing in the foregone
50 ASTM International. “Standard Practice for Measuring Internal Rate of Return and Adjusted Internal Rate of Return for Investments in Buildings and Building Systems,” E 1057, Annual Book of ASTM Standards: 2010. Vol. 04.11. West Conshohocken, PA: ASTM International. 51 ASTM International. “Standard Practice for Measuring Net Benefits and Net Savings for Investments in Buildings and Building Systems,” E 1074, Annual Book of ASTM Standards: 2010. Vol. 04.11. West Conshohocken, PA: ASTM International.

23
opportunity. The PVNS for a given alternative, vis-à-vis the base case, equals their difference in life-cycle costs. Any pure benefits that result (e.g., increased rental income due to improvements) are included in the calculation of PVNS, since they are included in the LCC calculation. With respect to the base case, if PVNB or PVNS is positive for a given alternative the investment is economic; if it is zero, the investment is as good as the base case; if it is negative, the investment is uneconomical. Any alternative that results in a PVNB or a PVNS greater than zero is designated as cost effective.
E 1121: Standard Practice for Measuring Payback for Investments in Buildings and Building Systems
Standard Practice E 112152 provides a recommended procedure for calculating and applying the payback method in evaluating building designs and building systems. The payback method accounts for all monetary values associated with an investment up to the time at which cumulative net benefits, discounted to present value, just pay off initial investment costs. The payback method is used to find if a project recovers its investment cost and other accrued costs within its service life or within a specified maximum acceptable payback period less than its service life. It is important to note that the decision to use the payback method should be made with care. A major limitation of the payback method is that it ignores benefits and costs over the remaining service life of the project beyond the payback year. Another limitation is that the payback computed on total project investment does not indicate the economically efficient design or size of a project. Therefore, to make economically efficient choices among competing projects and among alternative designs/sizes for a single project, payback as an evaluation method is appropriate only when used as a supplementary method with other economic evaluation methods. E 1185: Standard Guide for Selecting Economic Methods for Evaluating Investments
in Buildings and Building Systems There are four basic types of investment decisions for which an economic analysis is appropriate: (1) deciding whether to accept or reject a given alternative/project; (2) identifying the most efficient alternative/project size/level, system, or design; (3) identifying the optimal combination of interdependent projects (i.e., the right mix of sizes/levels, systems, and designs for a group of interdependent projects); and (4) deciding how to prioritize or rank independent projects when the available budget cannot fund them all. Each type of investment decision is important. First and foremost, decision makers need to know whether or not a particular alternative/project or program should be undertaken in the first place. Second, how should a particular project/program be configured? The third type of decision builds on the second and introduces an important concept, interdependence. Consequently, for a given set of candidate projects and implied interdependencies, the problem becomes how to choose the best combination
52 ASTM International. “Practice for Measuring Payback for Investments in Buildings and Building Systems,” E 1121, Annual Book of ASTM Standards: 2010. Vol. 04.11. West Conshohocken, PA: ASTM International.

24
of projects. The fourth type of decision introduces a budget constraint. The aim is how to get the most impact for the given budget. Numerous methods are available for measuring the economic performance of investments in buildings and building systems. Use ASTM Standard Guide E 118553 to identify types of building design and system decisions that require economic evaluation and to match the technically appropriate economic methods with the decisions. Five economic evaluation methods are addressed in ASTM Standard Guide E 1185: (1) life-cycle costs, LCC, ASTM Standard Practice E 917; (2) benefit-to-cost ratio, BCR, and savings-to-investment ratio, SIR, ASTM Standard Practice E 964; (3) internal rate of return, IRR, and adjusted internal rate of return, AIRR, ASTM Standard Practice E 1057; (4) present value net benefits, PVNB, and present value net savings, PVNS, ASTM Standard Practice E 1074; and (5) payback, ASTM Standard Practice E 1121. Table 2.5 provides a summary of when it is appropriate to use the first four evaluation methods—E 917, E 964, E 1057, E 1074—described earlier. The payback method, E 1121, is not included in Table 2.5, since it is not a viable “stand alone” economic evaluation method. Note that the LCC and the PVNB or PVNS methods are appropriate in three of the four cases. Only in the presence of a budget constraint is the use of LCC, PVNB, or PVNS inappropriate and even in that case it plays an important role in computing the aggregate measure of performance.
Table 2.5 Summary of Appropriateness of Each Standardized Evaluation Method for Each Decision Type
Decision Type LCC PVNB
PVNS BCR SIR
IRR AIRR
Accept/Reject Yes Yes Yes Yes
Design/Size Yes Yes No No
Combination (Interdependent) Yes Yes No No
Priority/Ranking (Independent) No No Yes Yes
More than one method can be technically appropriate for many design and system decisions. If more than one method is technically appropriate, use all that apply, since many decision makers need information on measures of magnitude (life-cycle costs and present value net benefits or present value net savings) and of return (benefit-to-cost ratio or savings-to-investment ratio and internal rate of return or adjusted internal rate of return) to assess economic performance.
53 ASTM International. “Guide for Selecting Economic Methods for Evaluating Investments in Buildings and Building Systems,” E 1185, Annual Book of ASTM Standards: 2010. Vol. 04.11. West Conshohocken, PA: ASTM International.

25
In summary, no single evaluation method works for every decision type. First and foremost, managers want to know if a particular project is economic. Reference to Table 2.5 shows that all of the evaluation methods address this type of decision. Second, as issues of design, sizing, and packaging combinations of projects become the focus of attention—as often occurs in conjunction with budget reviews—the LCC and PVNB or PVNS methods emerge as the principle means for evaluating a project’s or program’s merits.54 Finally, the tightening budget picture involves setting priorities. Consequently, decision makers need both measures of magnitude, provided by LCC and PVNB or PVNS, and of return, provided by either the BCR or SIR and the IRR or AIRR, to assess economic performance. Multiple measures, when used appropriately, ensure consistency in both setting priorities and selecting projects for funding.
E2204: Standard Guide for Summarizing the Economic Impacts of Building-Related Projects
The presentation and analysis of the results of an economic analysis are central to understanding and accepting its findings. If the presentation is clear and concise, and if the analysis strategy is logical, complete, and carefully spelled out, then the results will stand up under close scrutiny. ASTM Standard Guide E 220455 meets the two previously cited conditions; it provides a summary format that consists of three sections: (1) the significance of the study effort; (2) the analysis strategy; and (3) the calculation of key benefit and cost measures.16F The significance of the study effort section describes: (1) why the study is important and how the organization conducting it became involved; and (2) why some or all of the changes brought about were due to the study organization’s contribution. The analysis strategy section focuses on documenting the steps taken to ensure that the analysis strategy is logical and complete. Particular emphasis is placed on summarizing the key assumptions, including any constraints that limited the scope of the analysis. Responses are provided for key assumptions concerning: (a) the base year for the analysis; (b) the length of the study period; and (c) the discount rate or minimum acceptable rate of return (MARR) used. Special emphasis is placed on documenting the sources and validity of any data used to make estimates or projections of key benefit and cost measures. The analysis strategy section establishes an audit trail from the raw data, through data manipulations (e.g., represented by equations and formulae), to the results. The third and final section focuses on reporting the calculated values of the key benefit and cost measures, as well as any additional measures that are deemed appropriate, and establishing traceability to standardized practices or, where appropriate, to statutory documents or procedures. It consists of three subsections, designated as 3.a, 3.b, and 3.c. Subsection 3.a includes descriptive information as well as calculated values. Subsection 3.b reports calculated values for key measures of economic performance. Subsection 3.c is included to ensure traceability to appropriate national standards, codes, or regulations.
54 If incremental values of the BCR or SIR and IRR or AIRR are computed, they can be used to make design/size and packaging decisions. 55 ASTM International. “Guide for Summarizing Economic Impacts of Building-Related Projects,” E 2204, Annual Book of ASTM Standards: 2010, Vol. 04.12. West Conshohocken, PA: ASTM International.

26
Discount Factor Tables The Discount Factor Tables serves as an Adjunct to ASTM Standard Practices E 917, E 964, E 1057, E 1074, and E 1121.56 Three sets of discount factor tables are presented in the Adjunct. The first includes single-payment and uniform-series discount factors. The second presents uniform present value factors for a series of payments increasing from period-to-period at a given rate, rather than remaining constant over the entire study period. The third presents single present value factors for determining the present value of a single payment occurring at a future point of time, to be used when that payment is specified in base-time prices but is expected to increase in value over time at a specified periodic rate. The factors for all three tables have been calculated to four significant digits. The tables cover discount rates from 1 % to 25 %, and time periods from 1 year to 40 years.
56 Available from ASTM International Headquarters by ordering Adjunct No. ADJE091703, or by contacting ASTM Customer Service at [email protected].

27
3 A Case Study of the Gateway Arch Bridge: How Innovative Design and Economics Come Together 3.1 Summary of Key Characteristics and Innovative Design Features The Gateway Arch Bridge is a dual single-span, modified tied-arch carrying six lanes of Interstate 94 (I-94) traffic (three eastbound and three westbound) over Telegraph Road in Taylor, Michigan. Figure 3.1 provides an overhead view of the two bridge structures. This bridge was part of the reconstruction of I-94 for Super Bowl XL held in 2006. Figures 3.2 and 3.3 provide different perspectives of the bridge as seen from Telegraph Road (Figure 3.2) and from I-94 (Figure 3.3). Figure 3.1 Overhead View of the Gateway Arch Bridge
Source: Alfred Benesch & Company Many modern bridges are either true arches or tied arches. The modified tied-arch bridge in Taylor, Michigan combined the two concepts for aesthetic and safety reasons. Tied arches, where the tie is exposed, might be hit by trucks and are not desirable for grade separation structures. True arches, where the thrust must be taken by the foundation elements, are exposed to risk when the soil conditions are poor. The Gateway Arch Bridge is a signature structure modified to look like a true arch with a tied foundation. The thrust blocks are connected below the roadway by a rectangular concrete tie beam. The arch ribs are geometrically unequal to keep the two bridges closer together. The stiffness of the ribs is varied to keep deflection constant. To allow for inspections without disturbing the heavy traffic on I-94, the ribs were sealed and pressurized. Pressure gauges were added to detect any leaks.

28
Figure 3.2 Gateway Arch Bridge as Seen from Telegraph Road
Source: Alfred Benesch & Company Figure 3.3 Gateway Arch Bridge as Seen from I-94
Source: Alfred Benesch & Company

29
The project team was challenged with two major criteria: cost and structural integrity. The team approached the design by analyzing its functions and its worth. The team value engineered the conventional design of elements using ASTM Standard Practice E 169957 and identified the function, cost, and performance of each element using ASTM Standard Practice E 2013.58 If the function need/performance is high and cost is low, it has value; see Figure 3.4. If the function need/performance is low and cost is high, it becomes a mismatch; see Figure 3.4. When mismatches of the conventional design were identified, the team developed innovative solutions to create value of the elements that has a higher need/performance at a comparable or lower cost. Through repeated use of ASTM Standard Practice E 2013, the project team was able to develop and implement six key design innovations that balanced safety and aesthetics with life-cycle cost considerations. Figure 3.4 Value/Mismatch Graph
Source: Alfred Benesch & Company
Unique Foundation System In true arches, the thrust is taken by the foundation supports, such as piles. A true arch is aesthetically pleasing. However, soil conditions at the job site were found to be very poor. This raised concerns about the long-term foundation stability due to soil creep. With a high cost of a true arch and low foundation performance, it proved to be a mismatch; see Figure 3.5. In tied arches, the thrust is taken internally by tie beams. There is no redundancy in case of a failure of the thrust resistance. A tied arch over a heavily traveled roadway is vulnerable to being hit. Its performance is low and it is a mismatch; see Figure 3.5. With the two conventional designs that have mismatches, the team developed the concept of a longitudinal tie under the roadway. The design included
57 ASTM International. “Practice for Performing Value Analysis (VA) of Buildings and Building Systems and Other Constructed Projects,” E 1699, op cit. 58 ASTM International. “Practice for Constructing FAST Diagrams and Performing Function Analysis During Value Analysis Study,” E 2013, op cit.

30
multiple redundancies. The cost of the foundation was dramatically reduced by reducing deep foundations required to resist arch thrust. The concerns of poor soil and protection of the tie were resolved. The solution had the highest value; see Figure 3.5. For this modified tied-arch, the longitudinal arch thrust is resisted by multiple foundation elements as shown in Figure 3.6: the longitudinal foundation ties, the transverse foundation ties, and battered piles. The concrete foundation ties, buried beneath Telegraph Road (see the photograph on the right-hand side of Figure 3.6), are sized so that the tensile strength of the concrete is sufficient to carry the arch thrust. However, should the concrete crack, there is adequate reinforcement in the tie. There are also 10 cm (4 in) diameter open ducts cast in concrete ties. At present, these are capped but the tie can be post-tensioned if deemed necessary. Figure 3.5 Analysis of Arch Types
Source: Alfred Benesch & Company Figure 3.6 Gateway Arch Bridge Foundation System
Source: Alfred Benesch & Company
Longitudinal Foundation Tie
Transverse Foundation Tie
Longitudinal Foundation
Tie

31
Arch Rib Geometry The basic principle of arch design is that the ribs will be subjected to pure compression. Ribs under pure compression are the most economical. However, they may not result in a pleasing geometry. When the geometry of the arch is altered to improve aesthetics, the ribs will be subjected to bending in addition to compression. The performance of the arch rib geometry is measured using two attributes: structural integrity and aesthetics. Based on these attributes, the design team analyzed three alternative arch rib geometries: (1) Original Arch Rib Geometry; (2) Optimized Arch Rib Geometry; and (3) Balanced Arch Rib Geometry. The Original Arch Rib Geometry is based on aesthetics. This design resulted in more bending than desired. Hence this design is considered low performance. In addition, its cost is higher, which results in a mismatch; see Figure 3.7. Finite element analysis was used to create the Optimized Arch Rib Geometry, which results in arch ribs that are in pure compression. Hence structural performance is high and cost is low. However, this design is not aesthetically pleasing. Thus, the Need/Performance metric is given an average rating. Even so, the Optimized Arch Rib Geometry results in a value to the project; see Figure 3.7. Further application of finite element analysis resulted in a Balanced Arch Rib Geometry that maintained a high level of structural performance at a somewhat higher cost than the Optimized Arch Rib Geometry. However, this design is aesthetically pleasing. Therefore, it is given a high Need/Performance rating, which results in a value to the project; see Figure 3.7.
Figure 3.7 Analysis of Arch Rib Geometry
Source: Alfred Benesch & Company Each structure is a single-span inclined through arch. The interior and exterior arch ribs are inclined 25 degrees towards each other. The inclination is limited to 25 degrees to maintain the desirable vertical clearance. The ribs are braced together using five football shaped braces; see Figures 3.8 and 3.9. The bases of the exterior arch ribs are located at the Telegraph Road level, while the bases of the interior ribs are located at the I-94 level.

32
This caused the length of the exterior rib and the interior rib to be different. The length of the exterior and interior arch ribs are 90.2 m (296 ft) and 78.3 m (257 ft), respectively. The span length measured between the east and west abutments is 75.0 m (246 ft). Figure 3.8 Longitudinal View of the Arch Ribs
Source: Alfred Benesch & Company Figure 3.9 Transverse View of the Arch Ribs Illustrates Unequal Lengths
Source: Alfred Benesch & Company The unequal lengths of the arches posed a challenge to the design team. The arch rib deflection due to dead and live loads will be different. By carefully varying the stiffness of the rib while keeping the outside shape and dimensions the same, the desired appearance and structural integrity were achieved. The inner thrust block is at the road level of I-94; the outer thrust block is at the level of Telegraph Road.

33
Maintenance of Arch Ribs Due to the small size of the arch ribs, future inspection and maintenance of the inside portion of the box is virtually impossible. Future manual inspection and maintenance cost would be high since part of the roadway would have to be closed during inspection and maintenance; as noted in Figure 3.10, this would result in a mismatch. Therefore, the arch ribs, arch braces, and the boxed-sections of transverse beams are pressurized with dry air to prevent moist air from entering the boxed-sections to cause corrosion. The pressurization will reduce maintenance costs and simplify the inspection process. Pressurization is categorized as a value to the project; see Figure 3.10. To prevent any air leakage from the pressurized sections, the top flanges of the arch ribs and braces are welded to the webs using a full penetration weld. The bottom flanges are welded to the webs using a double side fillet weld. A trapezoidal shape-sealing diaphragm is located inside the arch box at each hanger location. The portion inside the sealing diaphragm is not pressurized, and an access opening in the web is provided to facilitate inspection of the unsealed portion of the arch. Access openings in the arch ribs are furnished where the air pressure can be checked; see Figure 3.11. At each arch rib field splice location, one pressure valve is attached to the sealing diaphragm. The arch rib segments are sealed and pressurized with air at 55.2 kilopascal (kpa) (8.0 pounds per square inch (psi)). If the pressure inside the sealed chamber drops by more than 10.3 kpa (1.5 psi) from the 55.2 kpa (8 psi) norm, then the reason for the air leak will be investigated. Figure 3.10 Maintenance of Arch Ribs
Source: Alfred Benesch & Company

34
Figure 3.11 Access Opening to the Arch Rib
Source: Alfred Benesch & Company
Redundancy of Hanger Assembly Each arch has 14 hanger assemblies that transfer the loads from the deck to the arch ribs. The design of the hanger assembly posed a number of challenges. First, the hangers were changed from rods to strands to simplify on-site construction and future replacement activities. Because the hangers are a critical element in carrying the load, it was decided to increase the redundancy; see Figure 3.12. Thus, each hanger assembly has a pair of strands, each one capable of carrying the total load (see the photograph on the left-hand side of Figure 3.13). Figure 3.12 Redundancy of Hanger Assembly
Source: Alfred Benesch & Company

35
Figure 3.13 Hanger Assembly and Neoprene Transition Boots
Source: Alfred Benesch & Company Each hanger assembly consists of two 5.4 cm (2.125 in) diameter, ASTM A586 structural strands, spaced 38.1 cm (15 in) center to center. The wires of each strand are galvanized to protect against corrosion. Each strand is attached to the arch ribs using a 4.45 cm (1.75 in) thick hanger support plate and ASTM A148 Grade 105/85 galvanized open type socket. Neoprene transition boots, secured to 25.4 cm (10 in) diameter standard pipe, welded to the transverse beams and to the strands using stainless steel clamps, are used to prevent moisture from entering inside the connections between the transverse beams and the strands and to enhance aesthetics (see the photograph on the right-hand side of Figure 3.13). A hanger separator is installed between the two strands of each hanger assembly for the middle ten hangers. Hanger separators increase in-plane stiffness of the strands by constraining the relative motions between them and increasing the stiffness of the hanger against transverse winds. The bridge was designed to facilitate the replacement of individual strands. Each strand of the pair is capable of supporting the deck and the full live load while the other is replaced.
Optimization of Floor System The floor system is very economical due to optimization of both the connection type and the number of stringer beams. The stringer beams were initially designed to be connected to the transverse girders via a moment-transfer connection. However, a moment-transfer connection is quite expensive and unnecessary for the vertical loads carried by the stringer beams. Changing these connections to simple shear connections provided significant cost savings with only a minor decrease in the capacity of the floor system. See Figure 3.14 for a view of the shear connected stringer beams next to the moment connected stiffening girders. In addition to the connection type, the number of stringer beams was analyzed for eight stringers versus four stringers. The performance of an additional four stringers did not significantly decrease the deflection of the floor system while the cost was doubled. The combination of a four stringer system with simple shear connections and two outer stiffening girders with moment-transfer connections performs well at a lower cost and is a good value; see Figure 3.15.

36
Figure 3.14 Analysis of Floor System and Transverse Girders
Source: Alfred Benesch & Company Figure 3.15 Optimization of Floor System
Source: Alfred Benesch & Company

37
Transverse Girders
The transverse girders are I-beams (plate girders) with a box end section for torsional stiffness and aesthetic reasons; see Figure 3.14. The I-beams are economical and easy to inspect. The end portions are boxed using two additional outer webs. The boxed sections of the girders improve aesthetics and increase the torsional resistance of the transverse girders in case one strand within the hanger assembly is lost or is being replaced. At the end, due to multiple strands, the transverse girders may be subjected to torsion during strand replacement. The performance of the plate girder at the end will be low, since it is weak when subjected to torsion. The transverse girder is designed as a plate girder section in the middle and converted to a box section at the ends. This maximized its needed performance in the middle and at the ends, accomplishing both objectives at a reasonable cost; see Figure 3.16. Figure 3.16 Configuration of Transverse Girders
Source: Alfred Benesch & Company 3.2 Cost Accounting Framework The costs of each element are organized around the UNIFORMAT II classification of bridge elements, a major revision to ASTM Standard Classification E 210359 as described in NIST Special Publication 1122.60 Because these costs have associated with them project management functions and risk management functions, two additional tables are needed to complete the cost accounting framework. Table 3.1 covers program management-related costs and Table 3.2 covers risk management-related costs. Each table is organized as a three-level hierarchy.
59 ASTM International. “Classification of Bridge Elements—UNIFORMAT II,” E 2103-11, op cit. 60 Kasi, Muthiah, and Chapman, Robert E. 2011. Proposed UNIFORMAT II Classification of Bridge Elements. NIST Special Publication 1122. Gaithersburg, MD: National Institute of Standards and Technology.

38
Table 3.1 Classification Hierarchy for Program Management-Related Costs
Level 1 Level 2 Level 3Major Group Classification Group Classification Individual Classification
X Project Management X10 Field Requirements X1005 Bonds, Permits, Fees, and InsuranceX1010 Field/Site Set-Up and AccommodationX1015 Management, Supervision, and Field EngineeringX1020 Personnel Travel and LodgingX1025 Safety and ProtectionX1030 Construction Aids, Equipment, and ToolsX1035 Temporary ConstructionX1040 Climatic and Environmental RequirementsX1045 Quality Control, Inspection, and TestingX1050 Maintenance and HousekeepingX1090 Other Contractural Requirements
X20 Office Overhead and Profit X2010 Home Office OverheadX2020 Profit
Table 3.2 Classification Hierarchy for Risk Management-Related Costs
Level 1 Level 2 Level 3Major Group Classification Group Classification Individual Classification
Y Risk Management Y10 Allowance Y1010 SpecificY1020 Nonspecific
Y20 Contingency Y2010 SpecificY2020 Nonspecific
Y30 Reserve Sums Y3010 SpecificY3020 Nonspecific

39
The prefix in Table 3.1 is X indicating its relationship to Table 1 in ASTM E 2083, Standard Classification for Building Construction Field Requirements and Office Overhead and Profit.61 Level 1 in the hierarchy contains the single entry X Project Management. Level 2 in the hierarchy contains two entries: X10 Field Requirements and X20 Office Overhead and Profit. Level 3 entries under X10 Field Requirements include such cost items as X1030 Construction Aids, Equipment, and Tools (e.g., cranes and scaffolding) and X1035 Temporary Construction (e.g., coffer dams). The prefix in Table 3.2 is Y indicating its relationship to ASTM E 2168, Standard Classification for Allowance, Contingency, and Reserve Sums in Building Construction Estimating.62 Due to the unique characteristics of the Gateway Arch Bridge, ASTM E 2168 was of particular importance. Level 1 in the hierarchy contains the single entry Y Risk Management. Level 2 in the hierarchy contains three entries: Y10 Allowance, Y20 Contingency, and Y30 Reserve Sums. The two Level 3 entries under Y10 Allowance are: Y1010 Specific and Y1020 Nonspecific. There are similar breakdowns for Y20 Contingency and Y30 Reserve Sums. For example, under Y20 Contingency, Y2010 Specific covers planning contingency, design contingency, and construction contingency, whereas Y2020 Nonspecific covers overall unexpected events or items. 3.3 Cost Analysis of the Gateway Arch Bridge Using the UNIFORMAT II Elemental Classification and Example Sub Classification The total contract award cost for one of the two bridge structures making up the Gateway Arch Bridge is $6.67 million. Since the two bridge structures are identical, their total cost is $13.34 million. The cost analysis of the Gateway Arch Bridge, using the UNIFORMAT II elemental classification (ASTM E 2103-11) and example sub classification described in NIST Special Publication 1122, is presented in Table 3.3 and summarized in Figure 3.17. Table 3.3 records information for each of the five levels in the UNIFORMAT II bridge classification and example sub classification.63 Table 3.3 includes alphanumeric designations and element/sub element names, dollar values, percent of total cost associated with those dollar values, and unit costs. Figure 3.17 records the cost distribution of selected Group Elements and Individual Elements. The costs summarized in Figure 3.17 are the major Substructure and Superstructure Group Elements and Individual Elements; they account for approximately 85 % of the Gateway Arch Bridge’s total cost.
61 ASTM International. “Classification for Building Construction Field Requirements, and Office Overhead & Profit,” E 2083, op cit. 62 ASTM International. “Classification for Allowance, Contingency, and Reserve Sums in Building Construction Estimating,” E 2168, op cit. 63 The current version, ASTM E 2103-11, includes only the first three levels: Level 1, Major Group Elements; Level 2, Group Elements; and Level 3, Individual Elements.

40
Table 3.3 Cost Analysis of the Gateway Arch Bridge Using the UNIFORMAT II Elemental Classification and Example Sub Classification
Level 5
A30102010 Test Piles 1 Each $16,575.00 $16,575
$1,369,210 20.5% $823,485 12.3% A30102020 Piles 7060 ft $30.00 $211,800
Cost/ Sq.Ft $74.51 Cost/ Sq.Ft $44.82 A10102030 Pile Cap 90 yd3 $450.00 $40,500
A30201010 Reinforcement 94200 lb $0.75 $70,650
A30201020 Placement 785 yd3 $600.00 $471,000
A30301010 Reinforcement 3200 lb $0.80 $2,560
A30301010 Placement 16 yd3 $650.00 $10,400
A40101010 Reinforcement 63175 lb $1.00 $63,175
$545,725 8.2% A40101020 Placement 361 yd3 $750.00 $270,750
Cost/ Sq.Ft $29.70 A401020 Foundations 3.17% $211,800 A40102020 Piles 7060 ft $30.00 $211,800
B10103010 Fabrication 852749 lb $1.00 $852,749
$4,493,274 67.3% $1,772,355 26.6%
Cost/ Sq.Ft $244.53 Cost/ Sq.Ft $96.45
B10202010 Fabrication 42000 lb $1.00 $42,000
B10202020 Erection 42000 lb $0.75 $31,500
B10301010 Fabrication 66611 lb $1.20 $79,933
B10301020 Erection 66611 lb $1.00 $66,611
B1040 Bearings 0.90% $60,000 B104020 Sliding 0.90% $60,000 12 Each $5,000.00 $60,000
B20103010 Fabrication 664639 lb $1.20 $797,567
$2,063,325 30.9% B20103020 Erection 664639 lb $1.00 $664,639
Cost/ Sq.Ft $112.29 B2030 Hangers 5.25% $350,450 1630 Lin ft $215.00 $350,450
B20501010 Reinforcement 74461.5 lb $0.80 $59,569
B20501020 Placement 294 yd3 $650.00 $191,100
B30101010 Reinforcement 209180 lb $0.80 $167,344
$657,594 9.9% B30101020 Placement 475 yd3 $650.00 $308,750
Cost/ Sq.Ft $35.79 B3020 Wearing Surface 2.72% $181,500 2420 yd2 $75.00 $181,500
$186,440 2.8% $4,000 0.1%
Cost/ Sq.Ft $10.15 Cost/ Sq.Ft $0.22
C2010 Barriers 0.49% $33,000 66 yd3 $500.00 $33,000
$57,440 0.9%
Cost/ Sq.Ft $3.13
$125,000 1.9%
Cost/ Sq.Ft $6.80
D1010 Clearing and Grubbing 0.97% $65,000 1 Each $65,000.00 $65,000
$624,998 9.4% $572,938 8.6% D1020 Demolition and Relocation 7.25% $483,615 1 Each $483,615.00 $483,615
Cost/ Sq.Ft $34.01 Cost/ Sq.Ft $31.18 D1030 Earthwork 0.36% $24,323 D103010 Cut 0.36% $24,323 2115 yd3 $11.50 $24,323
D20 Approach Construction D2010 Approach Slabs 0.72% $48,060 267 yd2
$180.00 $48,060
$52,060 0.8%
Cost/ Sq.Ft $2.83
Total Bridge Cost $6,673,921
245 Ft
75 Ft
18375 Sq.Ft $363.21
4.03% $268,875
8.12% $541,650
0.19% $12,960
22.36% $1,492,311
8.18% $545,725
22.36%
A301020 Piles 4.03% $268,875
7.13% $476,094
A302010 Cast ‐in‐Place
Concrete8.12% $541,650
B10103020 Erection
$4,000
$24,440
1.87% $125,000 1 Each $125,000.00
yd2 $1.000.37% $24,440 24440
$50.00
Bridge Geometry
Sub Elements Quantity
Level 4
Cost % Total Cost
Level 3
% Total Cost
Cost
$125,000
D Sitework D10 Site Preparation
D2020 Sleeper Slabs
Unit Unit Cost Amount
Details
C30 Other Protection
C3010 Lighting
0.06% $4,000 80 ft
C Protection C10 Structure Protection
B Superstructure B10 Short span assemblies
A3020 Stems
$0.75 $639,562
A40 Other Supports
A4010 Thrust BlocksA401010 Cap 5.00% $333,925
B1020 Diaphragms B102020 Steel 1.10% $73,500
B1030 Bracings B103010 Steel 2.20% $146,544
$1,492,311
1.10%
Level 1 Level 2
Major Group Elements
Group Elements Individual Elements Sub Elements
B301010 Cast‐ in‐ Place
Concrete7.13% $476,094
$73,500
2.20% $146,544
B1010 Flexural Members B101030 Steel
A3030 Wing wallsA303010 Cast ‐in‐ Place
Concrete0.19% $12,960
A Substruture A30 Abutments
A3010 Foundation
$4,000
Deck Area of Bridge
B20 Long Span AssembliesB2010 Ribs B201030 Steel 21.91% $1,462,206
B2050 TiesB205010 Cast‐ in‐ Place
Concrete3.76% $250,669
21.91% $1,462,206
3.76% $250,669
C20 Traffic protection
C2020 Protective Shields
Cost/ Sq.Ft
Length of Bridge (Back to Back of Abutments)
Width of Bridge (Back to Back of Barriers)
B30 Deck
lb
C1020 Expansion Joint 0.06% $4,000 80 Lin ft $50.00
B3010 Structural Surface
852749

41
Figure 3.17 Cost Distribution of Selected Group Elements and Individual Elements for the Gateway Arch Bridge

42
Table 3.3 is organized so that the costs from each lower level in the hierarchy can be easily aggregated. The first four columns correspond to Levels 1, 2, and 3 of the E 2103-11 classification and Level 4 of the example sub classification. The fifth column lists any Level 5 Sub Elements of the example sub classification, specifically the alphanumeric designation and name under the Level 5 heading. The last column records the quantities, units of measure, unit costs, and item cost under the Details heading. In several cases, the entries under the Details heading correspond to a Level 4 Sub Element or a Level 3 Individual Element. Two intermediate columns summarize the cost characteristics of each Level 4 Sub Element. The two intermediate columns show the cost of the Level 4 Sub Element, which is obtained by summing over all Level 5 Sub Elements associated with that Level 4 Sub Element, and the per cent of total cost associated with that cost. For example, the Level 4 Sub Element, A301020 Piles, has a cost of $269 000. Since the total cost of the bridge is $6.67 million, this value represents 4.03 % of the total cost. The cost of a Level 3 Individual Element is obtained by summing over all of its Level 4 Sub Elements. In a similar fashion, the cost of a Level 2 Group Element is obtained by summing over all of its Level 3 Individual Elements and the cost of a Level 1 Major Group Element is obtained by summing over all of its Level 2 Group Elements. The cost for each Major Group Element and Group Element, along with its per cent of total cost and unit cost, are recorded in the first two columns of Table 3.3. Note that some Group Elements have a single Level 3 Individual Element. For example, Group Element A40, Other Supports, has a single Individual Element, A4010 Thrust Blocks. In such cases the values recorded under the Level 2 Group Element heading correspond to those associated with the Level 3 Individual Element. The values recorded in Table 3.3 provide the basis for Figure 3.17. Figure 3.17 presents a cost distribution of selected Group Elements and Individual Elements tied to a graphical representation of a longitudinal view of the Gateway Arch Bridge. The figure includes the alphanumeric string, the name of the Group Element or Individual Element, its cost, and its per cent of total cost. Two Group Elements and six Individual Elements are highlighted in Figure 3.17. Reference to Figure 3.17 reveals that the Level 2 Group Element A30 Abutments has a cost of $824 000, which corresponds to 12.3 % of the total cost. The other Level 2 Group Element shown in Figure 3.17, B30 Deck, has a cost of $658 000 or 9.9 % of total cost. Two Individual Elements, B1010 Flexural Members and B2010 Ribs, are of particular importance, since they each represent more than 20 % of the total cost of the bridge. Table 3.3 and Figure 3.17 illustrate how the UNIFORMAT II elemental classification and example sub classification can be used to focus attention on those elements that drive the overall costs of a bridge project, as well as those elements that are associated with special characteristics—in this case the unique foundation system and other design innovations—of a particular bridge. 3.4 Risk Management The innovative design features associated with the Gateway Arch Bridge posed a number of risk management challenges. These challenges centered on both cost and schedule considerations. These challenges were addressed via the extensive use of: (1) ASTM

43
standards to achieve a balance between performance and life-cycle economy and (2) prefabricated components as cost and schedule control measures. To better understand the risk management measures employed in the Gateway Arch Bridge project, it is useful to expand upon the three risk management terms—allowance, contingency, and reserve sums—included in ASTM E 2168, by introducing a fourth term, base cost. Base cost includes all known and quantified costs for the project, including all trade costs and the prime contractor’s field requirements, office overhead and profit reported in Table 3.1. It is instructive to review the relationship between these four cost terms. Understanding this relationship is at the heart of analyzing and managing design and construction costs for complex projects such as the Gateway Arch Bridge. Base cost plus allowance is designated as the minimum cost. Base cost plus allowance and contingency is designated as the expected cost. As the project progresses, some of the planning and design contingencies will be moved into the base cost. Construction contingency will remain until the construction is complete. Base cost plus allowance, contingency, and reserve sums is designated as the maximum cost. The relationship between the four terms includes a time dimension. The time dimension allows us to analyze how costs change both through changes in design considerations as the process unfolds and more project-related information becomes available and through the application of ASTM standards. Thus far, we have discussed ways in which E 1699, E 2013, E 2083, E 2103, and E 2168 have been applied in developing, presenting, and conducting cost analyses. Two additional standards are critical in managing risk and tracking changes, they are: ASTM E 1369, Guide for Selecting Techniques for Treating Uncertainty and Risk in Economic Evaluation of Buildings and Building Systems;64 and ASTM E 1804, Practice for Performing and Reporting Cost Analysis During the Design Phase of a Project.65 ASTM E 1369 recommends techniques for treating uncertainty in input values to an economic analysis of a project. It also recommends techniques for evaluating the risk that elements of a project will have a less favorable outcome than what is desired or expected. ASTM E 1804 sets up the framework in which a project can be estimated properly and establishes a structured method to support decisions. ASTM E 1804 increases communication between the designer, the owner, and the cost estimator. Specifically, it includes information and reasons on how and why the project has changed from the previous cost estimate. The highly innovative design of the Gateway Arch Bridge raised concerns by the Federal and State of Michigan governments due to a significant number of unknowns and unfamiliar conditions. The designers conducted a number of function analysis studies using ASTM E 2013 and identified possible impact elements and functions. These included the concrete deck type, hanger type, foundation type, and the shape of the arch. ASTM E 1804 was used to track design changes and any cost changes associated with them. These changes are summarized in Table 3.4.
64 ASTM International. “Guide for Selecting Techniques for Treating Uncertainty and Risk in Economic Evaluation of Buildings and Building Systems,” E 1369, op cit. 65 ASTM International. “Practice for Performing and Reporting Cost Analysis During the Design Phase of a Project,” E 1804, op cit.
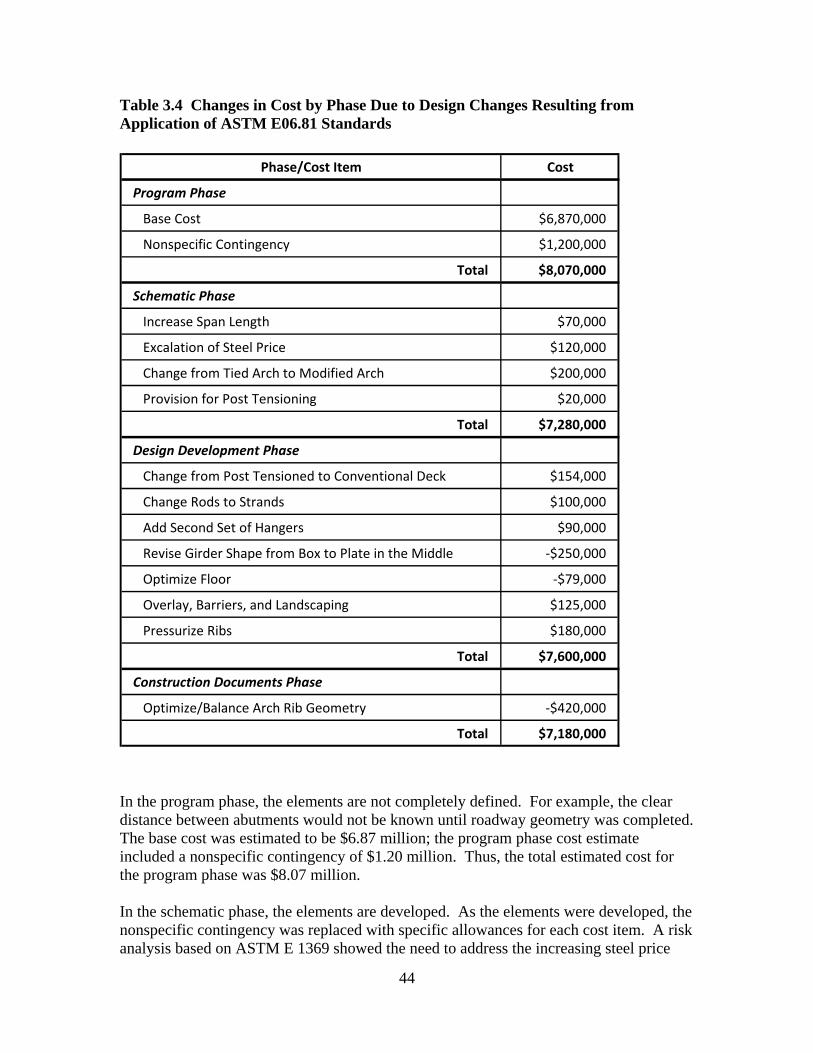
44
Table 3.4 Changes in Cost by Phase Due to Design Changes Resulting from Application of ASTM E06.81 Standards
Phase/Cost Item Cost
Program Phase
Base Cost $6,870,000
Nonspecific Contingency $1,200,000
Total $8,070,000
Schematic Phase
Increase Span Length $70,000
Excalation of Steel Price $120,000
Change from Tied Arch to Modified Arch $200,000
Provision for Post Tensioning $20,000
Total $7,280,000
Design Development Phase
Change from Post Tensioned to Conventional Deck $154,000
Change Rods to Strands $100,000
Add Second Set of Hangers $90,000
Revise Girder Shape from Box to Plate in the Middle ‐$250,000
Optimize Floor ‐$79,000
Overlay, Barriers, and Landscaping $125,000
Pressurize Ribs $180,000
Total $7,600,000
Construction Documents Phase
Optimize/Balance Arch Rib Geometry ‐$420,000
Total $7,180,000 In the program phase, the elements are not completely defined. For example, the clear distance between abutments would not be known until roadway geometry was completed. The base cost was estimated to be $6.87 million; the program phase cost estimate included a nonspecific contingency of $1.20 million. Thus, the total estimated cost for the program phase was $8.07 million. In the schematic phase, the elements are developed. As the elements were developed, the nonspecific contingency was replaced with specific allowances for each cost item. A risk analysis based on ASTM E 1369 showed the need to address the increasing steel price

45
trend at the time. To better manage this risk, the unit prices of structural steel members for the arch ribs and transverse beams were increased. Reference to Table 3.4 records an increase of $120 000. The length of the bridge was increased from 67 m (220 ft) to 75 m (246 ft) to meet the clear site distance required by the Michigan Department of Transportation (MDOT). The resulting cost increase was $70 000. To comply with the Federal Highway Administration’s and MDOT’s requirement on not having a tied arch on grade separation structures, which are vulnerable to damage, the tie was buried under the roadway. This increased cost by $200 000. The foundation tie was assumed to be post-tensioned concrete. To add redundancy, conventional reinforcing to resist the force was added. This increased cost by $20 000. The total estimated cost at the end of the schematic phase was $7.28 million.66 In the design development phase, the deck was changed from post-tensioned concrete to conventional concrete. The cost increase was $154 000. The hanger assembly went through some changes. First, the type was changed from rods to strands. The cost increase was $100 000. Because the hanger assembly is a critical member in carrying the load, it was decided to increase its redundancy. Thus, each hanger assembly has a pair of strands, each of which is capable of carrying the total load. This increased the cost by $90 000. It was also decided to pressurize the arch ribs to monitor the integrity of the ribs and prevent interior corrosion.67 The cost of detail changes and pressurizing was estimated to be $180 000. Additional cost for overlay, barriers, and landscaping added another $125 000. Two cost-saving measures were also put in place: (1) optimize floor framing; and (2) revise transverse girder shape. Analysis showed that there was a low performance difference between the 8 stringer and 4 stringer system (see Figure 3.15); this change saved $79 000. Changing the box girder section to a plate girder system in the middle of the transverse girder, reduced cost by $250 000 (see Figure 3.16). At the end of the design development phase, the total estimated cost was $7.60 million. Due to the uniqueness of this structure, using cost data from past projects did not guarantee effective cost management. Using ASTM E 1804 and ASTM E 2103, cost variation was tracked with proper documentation. By using function analysis (ASTM E 2013), cost was allocated more accurately to each element. In the construction documents phase, when all policy decisions were made and all details were known, the design team developed a detailed cost estimate compatible to design details and specifications. The team at this point optimized and balanced the arch rib geometry using finite element analysis (see Figure 3.7). Changing the arch rib geometry saved $420 000. The total estimated cost at the end of the construction documents phase was $7.18 million.
66 The schematic cost estimate equals the base cost plus the four specific allowances. 67 The decision to pressurize the arch ribs was made to minimize future maintenance and repair costs, along with the associated costs of disrupting traffic during such maintenance and repair activities. While a formal life-cycle cost analysis was not performed during the value analysis study of this design feature, the concepts employed were fully consistent with the methodology outlined in ASTM E 917 (ASTM International. “Practice for Measuring Life-Cycle Costs of Buildings and Building Systems,” E 917, op cit.).

46
Table 3.4 shows the details of validation during design. By using six ASTM standards, cost was managed better, contributing to a final engineering estimate of $7.18 million, which is $890 000 less than the program cost. The extensive use of prefabrication was of critical importance both for cost and schedule control.68 The complex bridge design and use of pressurization required exacting tolerances. To speed on-site erection, complex structural shapes were pre-assembled at the fabricator’s site. Figure 3.18 shows an example of a full lay-down assembly of the arch ribs at the fabricator’s site. Coupling the complex structural shapes in a manner that would facilitate pressurization of the arch ribs, required tight quality control measures. One example of these measures is shown in Figure 3.19, where a splice connection is being drilled at the lay-down yard at the fabricator’s site. Figure 3.18 Benefits of Prefabrication: Full Lay-Down Assembly
Source: Alfred Benesch & Company
68 Readers interested in an in-depth discussion of the pros and cons of prefabrication are referred to a recent McGraw-Hill Construction SmartMarket Report (McGraw-Hill Construction. 2011. Prefabrication and Modularization: Increasing Productivity in the Construction Industry. SmartMarket Report. Bedford, MA: McGraw-Hill Construction.).

47
Figure 3.19 Benefits of Prefabrication: Drilling Splice Connection
Source: Alfred Benesch & Company It is important to note that prefabrication helped to control costs both in the pre-construction and construction phases, whereas its impact on schedule was primarily in the construction phase. Critical prefabrication-related cost saving measures in the pre-construction phase were $250 000 associated with the innovative transverse girder design in the design development phase and $420 000 associated with optimizing and balancing the arch rib geometry in the construction documents phase. Both of these cost saving measures are highlighted in Table 3.4. Thus far, the emphasis has been on risk management in the pre-construction phase. Risk management during the construction phase is also critical to successful project execution. Comparisons between Table 3.3, which records the total contract award cost of the Gateway Arch Bridge, and Table 3.4, which records the expected costs as designed, show a net cost reduction of approximately $500 000. The vast majority of these cost reductions were achieved in the construction phase through use of ASTM Standard Guide E 2506.69 Specifically, the contractor employed an innovative procedure for pouring and curing the concrete bridge deck that allowed them to use the hanger assemblies to carry the load rather than supporting the transfer girders with shoring. To better understand this approach, it is useful to examine both the types of risks and mitigation strategies covered by ASTM Standard Guide E 2506 and how stakeholder perspectives affect risk exposure. ASTM Standard Guide E 2506, also referred to as the 69 ASTM International. “Guide for Developing a Cost-Effective Risk Mitigation Plan for New and Existing Constructed Facilities,” E 2506, op cit.

48
three-step protocol, involves three types of risk: engineering, financial, and management. These risks are quantified and to a certain extent mitigated and/or managed via the three-step protocol: (1) risk assessment; (2) identification of potential mitigation strategies; and (3) economic evaluation. Stakeholder perspective is important because the Designer/ Owner perspective favors the “traditional” method of casting concrete that employs shoring while the Contractor’s innovative method produces a competitive advantage that increases the likelihood of them getting the contract award. Casting of concrete can be done in two ways: (1) support the transfer girders with shoring and adjust the slab formwork for profile and deflections; and (2) cast the concrete deck with the hanger assemblies carrying the load. The design intent was to shore the deck during the concrete pour. After concrete is set, the hangers will be stressed to lift the slab. The contractor chose to support the deck formwork with the transfer girders and the adjustable hanger assemblies. Controlling elevation with method 2 is much more difficult than with shoring as it involves adjusting the tension on the hanger assemblies as the concrete cures. Figure 3.20 provides a comparison of the two alternative methods for pouring and curing the concrete bridge deck. Method 1, where the formwork is supported by shoring, is shown on the left. Method 2, where the formwork is supported by the hangers, is shown on the right. Table 3.5 summarizes the risks from the designer’s/owner’s perspective. For method 1, engineering risk is low since the final deck elevation can be controlled easily. Financial risk is medium since the shoring will cost more and it will also limit traffic capacity. Management risk is low since it is a traditional method of casting concrete. The bid document specified method 1 for casting the concrete bridge deck. For method 2, engineering risk is very high since it is not the typical method of casting concrete. Method 2 requires careful design and supervision during concrete placement and curing. The designer needs to avoid unpredictable financial and engineering risks. Method 1 is a typical and safer method. Deviating from the traditional approach (i.e., method 1) forces the designer to depend on field operations where they do not have much control. Table 3.5 Risk Comparisons from the Designer’s/Owner’s Perspective
Designer and Owner Perspective
Method Engineering Risk Financial Risk Management Risk
1 Low
Medium Potentially higher cost
along with traffic delays
Low
2
High Since they don’t know the
capability of the contractor and they don’t have the control of
field operations
High Contractors tend to bid high on risky
operations
High If something goes
wrong in the field, any non typical method gets questioned.

49
Figure 3.20 Comparison of the Two Methods for Pouring and Curing the Concrete Bridge Deck

50
Table 3.6 summarizes the risks from the contractor’s perspective. For the first method, engineering risk is low since the final deck elevation can be controlled easily. Financial risk is medium for the contractor since the shoring will cost more and it will also limit traffic capacity. Management risk is high since it reduces the likelihood of the contactor getting the contract award if they bid that method of casting the concrete deck. For the second method, engineering risk is very high since it is not the typical method of casting concrete; it requires careful design and supervision during concreting. Financial risk is low since it costs less. Management risk is high since the owner may require that the method specified in the bid document (i.e., method 1) be used. Faced with these challenges, the contractor had to develop mitigation strategies that would reduce both engineering risk and management risk. The contractor took the management risk by assuming that they can convince the owner and designer that they can successfully deliver an acceptable deck by using method 2. This strategy reduced the management risk from high to low (see Table 3.6). The contractor avoided the management risk by controlling the engineering risk and benefited financially. Table 3.6 Risk Comparisons from the Contractor’s Perspective
Contractor Perspective
Method Engineering Risk Financial Risk
Management Risk
1 Low Medium
High If they bid the project based on
method 1, their bid will be higher. Someone may bid the job lower by
choosing method 2.
2
High The contractor has the control of field operations to avoid the undesired outcome. They
reduced the risk to Low
Low
High They convinced the client and the designer that they can deliver a
quality deck. They reduced the risk to Low
The Gateway Arch Bridge won six awards, including two national awards. The two national awards were the 2006 Outstanding Project Award from the National Council of Structural Engineers Association and the 2007 Prize Bridge—Medium Span Award from the National Steel Bridge Alliance. In addition to the two national awards, the Gateway Arch Bridge won the 2006 Best Medium Structure Award from the Structural Engineers Association of Illinois; the 2006 Engineering Honorable Conceptor Award from the Michigan Chapter of the American Council of Engineering Companies; the 2008 Partnering Award from the Michigan Construction Quality Partnership; and the 2008 Making a Difference Gold Award for Partnering from the National Partnership for Highway Quality. A major criterion for its selection as an award recipient was its cost effectiveness.

51
4 Summary and Recommendations for Further Research 4.1 Summary This report provides an overview of the 26 standards developed within the ASTM Subcommittee on Building Economics, E06.81, along with a description of how these standards are being used to promote more cost-effective decisions for the design, construction, operation, and disposal of constructed facilities. The report includes descriptions of a terminology standard, seven standard classifications, five standard guides, and 13 standard practices. The standard classifications, standard guides, and standard practices are organized around four topic areas: (1) cost data presentation and analysis; (2) value analysis; (3) risk management; and (4) economic evaluation. The report contains a detailed case study illustrating how many of the subcommittee’s standards can be applied to a complex transportation project. The case illustration uses the design and construction of the Gateway Arch Bridge in Taylor, MI. The Gateway Arch Bridge was part of the reconstruction of Interstate 94 for Super Bowl XL held in 2006. The case illustration discusses the bridge’s innovative design and engineering features, the extensive use of prefabricated components as cost and schedule control measures, and the use of ASTM standards to achieve a balance between performance and life-cycle economy. The Gateway Arch Bridge won six awards, including two national awards. A major criterion in its selection as an award recipient was its cost effectiveness. 4.2 Recommendations for Further Research The background work for this report uncovered several additional areas of research that would be of value to government agencies, standards development organizations, designers and constructors of physical infrastructure projects, and other stakeholders concerned with the costs of designing and constructing new physical infrastructure and of maintaining and repairing existing physical infrastructure across the Nation. Specifically, four additional UNIFORMAT II classifications are proposed for development: (1) tunnels; (2) highways; (3) railroads; and (4) water treatment and distribution. Each of these proposed UNIFORMAT II classifications corresponds to a critical infrastructure need identified in the American Society of Civil Engineers Report Card for America’s Infrastructure.70
70 ASCE 2009 Report Card for America’s Infrastructure, op cit.

52
53
References American Society of Civil Engineers (ASCE). 2009. ASCE 2009 Report Card for America’s Infrastructure. Reston, VA: American Society of Civil Engineers. ASTM International. 2012. ASTM Standards on Building Economics. 7th Edition. West Conshohocken, PA: ASTM International. ASTM International. “Classification for Allowance, Contingency, and Reserve Sums in Building Construction Estimating,” E 2168, Annual Book of ASTM Standards: 2010, Vol. 4.12. West Conshohocken, PA: ASTM International. ASTM International. “Classification for Bridge Elements and Related Approach Work,” E 2103, Annual Book of ASTM Standards: 2010, Vol. 4.11. West Conshohocken, PA: ASTM International. ASTM International. 2011. “Classification for Bridge Elements—UNIFORMAT II,” E 2103-11. West Conshohocken, PA: ASTM International. ASTM International. “Classification for Building Construction Field Requirements and Office Overhead and Profit,” E 2083, Annual Book of ASTM Standards: 2010, Vol. 4.11. West Conshohocken, PA: ASTM International. ASTM International. “Classification for Building Elements and Related Sitework—UNIFORMAT II,” E 1557, Annual Book of ASTM Standards: 2010, Vol. 4.11. West Conshohocken, PA: ASTM International. ASTM International. “Classification for Cost Estimate Classification System,” E 2516, Annual Book of ASTM Standards: 2010, Vol. 4.12. West Conshohocken, PA: ASTM International. ASTM International. “Classification for Life-Cycle Environmental Work Elements—Environmental Cost Element Structure,” E 2150, Annual Book of ASTM Standards: 2010, Vol. 4.12. West Conshohocken, PA: ASTM International. ASTM International. “Classification for Program and Project Estimate Summaries,” E 2620, Annual Book of ASTM Standards: 2010, Vol. 4.12. West Conshohocken, PA: ASTM International. ASTM International. “Guide for Developing a Cost-Effective Risk Mitigation Plan for New and Existing Constructed Facilities,” E 2506, Annual Book of ASTM Standards: 2010. Vol. 04.12. West Conshohocken, PA: ASTM International.

54
ASTM International. “Guide for Selecting Economic Methods for Evaluating Investments in Buildings and Building Systems,” E 1185, Annual Book of ASTM Standards: 2010. Vol. 04.11. West Conshohocken, PA: ASTM International. ASTM International. “Guide for Selecting Techniques for Treating Uncertainty and Risk in the Economic Evaluation of Buildings and Building Systems,” E 1369, Annual Book of ASTM Standards: 2010, Vol. 4.11. West Conshohocken, PA: ASTM International. ASTM International. “Guide for Summarizing Economic Impacts of Building-Related Projects,” E 2204, Annual Book of ASTM Standards: 2010, Vol. 04.12. West Conshohocken, PA: ASTM International. ASTM International. “Guide for Utilizing the Environmental Cost Element Structure Presented by Classification E 2150,” E 2637, Annual Book of ASTM Standards: 2010, Vol. 4.12. West Conshohocken, PA: ASTM International. ASTM International. “Guidelines for Developing UNIFORMAT II Standard Classifications,” Working Paper. West Conshohocken, PA: ASTM International. ASTM International. “Practice for Applying Analytical Hierarchy Process (AHP) to Multiattribute Decision Analysis of Investments Related to Buildings and Building Systems,” E 1765, Annual Book of ASTM Standards: 2010, Vol. 4.11. West Conshohocken, PA: ASTM International. ASTM International. “Practice for Constructing FAST Diagrams and Performing Function Analysis During Value Analysis Study,” E 2013, Annual Book of ASTM Standards: 2010, Vol. 4.11. West Conshohocken, PA: ASTM International. ASTM International. “Practice for Job Productivity Measurement,” E 2691, Annual Book of ASTM Standards: 2010. Vol. 04.12. West Conshohocken, PA: ASTM International. ASTM International. “Practice for Measuring Benefit-to-Cost and Savings-to-Investment Ratios for Buildings and Building Systems,” E 964, Annual Book of ASTM Standards: 2010, Vol. 4.11. West Conshohocken, PA: ASTM International. ASTM International. “Practice for Measuring Cost Risk of Buildings and Building Systems,” E 1946, Annual Book of ASTM Standards: 2010, Vol. 4.11. West Conshohocken, PA: ASTM International. ASTM International. “Practice for Measuring Internal Rate of Return and Adjusted Internal Rate of Return for Investments in Buildings and Building Systems,” E 1057, Annual Book of ASTM Standards: 2010, Vol. 4.11. West Conshohocken, PA: ASTM International.

55
ASTM International. “Practice for Measuring Life-Cycle Costs of Buildings and Building Systems,” E 917, Annual Book of ASTM Standards: 2010, Vol. 4.11. West Conshohocken, PA: ASTM International. ASTM International. “Practice for Measuring Net Benefits and Net Savings for Investments in Buildings and Building Systems,” E 1074, Annual Book of ASTM Standards: 2010, Vol. 4.11. West Conshohocken, PA: ASTM International. ASTM International. “Practice for Measuring Payback for Investments in Buildings and Building Systems,” E 1121, Annual Book of ASTM Standards: 2010, Vol. 4.11. West Conshohocken, PA: ASTM International. ASTM International. “Practice for Organizing and Managing Building Data,” E 2166, Annual Book of ASTM Standards: 2010, Vol. 4.12. West Conshohocken, PA: ASTM International. ASTM International. “Practice for Performing and Reporting Cost Analysis During the Design Phase of a Project,” E 1804, Annual Book of ASTM Standards: 2010, Vol. 4.11. West Conshohocken, PA: ASTM International. ASTM International. “Practice for Performing Value Analysis (VA) of Buildings and Building Systems and Other Constructed Projects,” E 1699, Annual Book of ASTM Standards: 2010, Vol. 4.11. West Conshohocken, PA: ASTM International. ASTM International. “Practice for Presentation Format of Elemental Cost Estimates, Summaries, and Analyses,” E 2514, Annual Book of ASTM Standards: 2010, Vol. 4.12. West Conshohocken, PA: ASTM International. ASTM International. “Terminology of Building Economics,” E 833, Annual Book of ASTM Standards: 2010, Vol. 4.11. West Conshohocken, PA: ASTM International. ASTM International. 1998. User’s Guide to AHP/Expert Choice for Building Evaluation, MNL 29. West Conshohocken, PA: ASTM International. Bowen, Brian, Charette, Robert P., and Marshall, Harold E. 1992. UNIFORMAT II: A Recommended Classification for Building Elements and Related Sitework, NIST Special Publication 841. Gaithersburg, MD: National Institute of Standards and Technology. Charette, Robert P., and Marshall, Harold E. 1999. UNIFORMAT II: Elemental Classification for Building Specifications, Cost Estimating, and Cost Analysis, NISTIR 6389. Gaithersburg, MD: National Institute of Standards and Technology. Kasi, Muthiah, and Chapman, Robert E. 2011. Proposed UNIFORMAT II Classification of Bridge Elements, NIST Special Publication 1122. Gaithersburg, MD: National Institute of Standards and Technology.

56
Lippiatt, Barbara C. 2007. BEES 4.0: Building for Environmental and Economic Sustainability Technical Manual and User Guide, NISTIR 7423. Gaithersburg, MD: National Institute of Standards and Technology. Marshall, Harold E. 1988. Techniques for Treating Uncertainty and Risk in the Economic Evaluation of Building Investments, NIST Special Publication 757. Gaithersburg, MD: National Institute of Standards and Technology. McGraw-Hill Construction. 2011. Prefabrication and Modularization: Increasing Productivity in the Construction Industry. SmartMarket Report. Bedford, MA: McGraw-Hill Construction. RS Means. 2010. Building Construction Cost Data: 68th Annual Edition. Kingston, MA: Reed Construction Data, Inc. Ruegg, Rosalie, T., and Petersen, Stephen R. 1987. Comprehensive Guide for Least-Cost Energy Decisions, NBS Special Publication 709. Gaithersburg, MD: National Bureau of Standards. Ruegg, Rosalie T., Petersen, Stephen R., and Marshall, Harold E. 1980. Recommended Practice for Measuring Life-Cycle Costs of Buildings and Building Systems, NBSIR 80-2040. Gaithersburg, MD: National Bureau of Standards. Thomas, Douglas S., and Chapman, Robert E. 2008. A Guide to Printed and Electronic Resources for Developing a Cost-Effective Risk Mitigation Plan for New and Existing Constructed Facilities, NIST Special Publication 1082. Gaithersburg, MD: National Institute of Standards and Technology. U.S. Department of Energy. 2002. Environmental Cost Element Structure. Washington, DC: Interagency Environmental Cost Engineering Committee. Whitestone Research. 2010. Facility Maintenance and Repair Cost Reference 2010-2011: 15th Edition. Santa Barbara, CA: Whitestone Research.