benefit of irrigation water transfers in the national ...publications.iwmi.org/pdf/h041804.pdf ·...
TRANSCRIPT

195
Benefit of Irrigation Water Transfers in the National RiverLinking Project: A Case Study of the Ken-Betwa Link
Upali A. Amarasinghe1, Om Prakash Singh2, Tushaar Shah1 andRavindra Singh Chauhan3
1 International Water Management Institute, New Delhi, India2Benaras Hindu University, Varenasi, India
3Chattrasal Seva Sansthan, Jhansi, India
Introduction
Ken-Betwa, a multipurpose water development project, is one of the smallest components ofthe proposed National River Linking Project (NRLP) of India. The NRLP envisages transferring178 km3 of water across 37 rivers, through a proposed network of about 30 river links, 3,000storages and 12,000 km long river links and canals. It is expected to cost about US$123 billion(in year 2000 prices). The NRLP has two main components: 1) the Himalayan component with14 river links; and 2) the peninsular component with 16 river links. The Ken-Betwa Project(KBP) is an independent link in the peninsular component that connects two small north-flowingrivers namely, the Ken and Betwa rivers in the Greater Ganga Basin. The KBP plans to transfer3,245 million m3 of water, which is only 1.8 % of the proposed total water transfers of theNRLP. The cost of the KBP, which is estimated at US$ 442 million is only 0.36 % of the totalNRLP cost.
Although it is a small independent link in the overall NRLP plan, the KBP also has manycritiques. Alagh (2006) pointed out that inadequate attention has been given to croppingpatterns and their suitability to the region. Chopra (2006) commented on the inadequacy ofthe project planning to meet different scenarios of future water resources development needs;Thakkar and Chaturvedi (2006) criticized that: a) the feasibility study has inadequate waterbalance studies; b) there was a lack of participation of local people in the decision-makingprocess of project planning; c) there was a failure to utilize the existing infrastructure to itsoptimum; d) there was a lack of alternative options analysis; and e) subsequently there arenot enough benefits to outweigh the cost. Patkar and Parekh (2006) commented on socialdisplacement, rehabilitation and resettlement and environmental issues, while Mohile (2006)focused on the scope for improvements and the actual feasibility of project when assessingthe feasibility reports of KBP.

196
U. A. Amarasinghe, O. P. Singh, T. Shah and R. S. Chauhan
The irrigation component dominates the KBP. The cost of the project, excluding thehydropower component, is estimated at US$431 million, which is 98 % of the total estimatedcost for the project. The KBP expects to provide irrigation for 0.49 million ha. In the processit expects to recharge groundwater to irrigate a substantial part of the non-command area. Theprimary objective of this paper is to assess the direct and indirect economic benefits of theadditional irrigation water transfers of the KBP. But first, we assess a major contentious issueof the project i.e., the compatibility of the proposed cropping patterns vis-à-vis the past trendsand existing cropping patterns in the KBP area. Next, we assess the direct economic benefitssuch as the increase in the net value added to crop production and livestock output in thecommand area. We also assess, though not in detail, the indirect benefits, such as the benefitsgenerated through groundwater recharge and irrigation in and outside the command area,forward linkages (storage, transport and agro-processing), and backward linkages (agriculturalfarm equipment supplies and services). We assess the net value added benefits of the irrigationwater transfers under different cropping patterns, and also assess the demand for irrigationwater in relation to the envisaged water transfers.
The rest of the paper is organized into six sections. Section two, which follows next,briefly describes the KBP project location, its components and the envisaged benefits. Sectionthree outlines data collection for different analyses, while section four begins the properanalysis. It compares the proposed cropping patterns with past trends and the existing croppingpattern, and discusses the changing pattern of crops in the region. Section five assesses thedirect irrigation benefits of new irrigation water transfers in the command area. We concludethe paper with recommendations for revisiting the project plans in the preparation of detailedproject report of KBP.
Ken-Betwa Project – Location and Proposed Irrigation
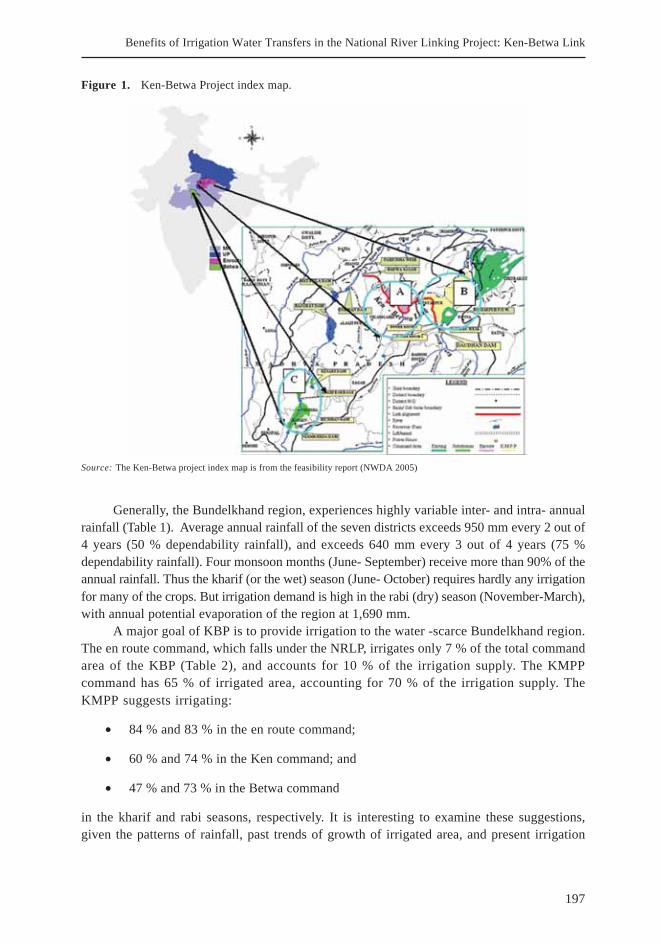
The KBP is located in the Bundelkhand region of Madhaya Pradesh and Uttar Pradesh in India.The KBP envisages the construction of a dam at Daudhan, a location upstream of the PericchaWeir in the Ken River (Figure 1), and then, will divert the Ken River water from this reservoirthrough a canal to the Betwa River. The KBP has three irrigation components. It proposes toprovide irrigation to:
• en route command area of the link canal (A in Figure 1);
• downstream area of the Ken River (B in Figure 1); and
• transfer water to downstream areas of the Betwa River by substituting the irrigationdemand of the upper reaches of the Betwa River (C in Figure 1).
Seven districts in Bundelkhand region cover the KBP command area (Figure 1). The enroute command of the link canal falls inside Tikamgarh and Chhatarpur districts in MadhyaPradesh and Jhansi and Hamirpur in Uttar Prdesh. The Ken Multi-Purpose Project (KMPP),proposed previously by the Government of Madya Pradesh, falls inside Chattarpur and Pannadistricts in Madhya Pradesh. The Betwa command, which consists of four projects namely, Barari,Richhan, Neemkheda and Kesari, is located in the Raisen and Vidisha districts in Madya Pradesh.
197
Benefits of Irrigation Water Transfers in the National River Linking Project: Ken-Betwa Link
Generally, the Bundelkhand region, experiences highly variable inter- and intra- annualrainfall (Table 1). Average annual rainfall of the seven districts exceeds 950 mm every 2 out of4 years (50 % dependability rainfall), and exceeds 640 mm every 3 out of 4 years (75 %dependability rainfall). Four monsoon months (June- September) receive more than 90% of theannual rainfall. Thus the kharif (or the wet) season (June- October) requires hardly any irrigationfor many of the crops. But irrigation demand is high in the rabi (dry) season (November-March),with annual potential evaporation of the region at 1,690 mm.
A major goal of KBP is to provide irrigation to the water -scarce Bundelkhand region.The en route command, which falls under the NRLP, irrigates only 7 % of the total commandarea of the KBP (Table 2), and accounts for 10 % of the irrigation supply. The KMPPcommand has 65 % of irrigated area, accounting for 70 % of the irrigation supply. TheKMPP suggests irrigating:
• 84 % and 83 % in the en route command;
• 60 % and 74 % in the Ken command; and
• 47 % and 73 % in the Betwa command
in the kharif and rabi seasons, respectively. It is interesting to examine these suggestions,given the patterns of rainfall, past trends of growth of irrigated area, and present irrigation
Figure 1. Ken-Betwa Project index map.
Source: The Ken-Betwa project index map is from the feasibility report (NWDA 2005)

198
U. A. Amarasinghe, O. P. Singh, T. Shah and R. S. Chauhan
Table 1. Monthly 50 % and 75 % dependable rainfall and potential evaporation.
Districts Jan Feb Mar Apr May Jun Jul Aug Sep Oct Nov Dec June- AnnualSept.
P501 (mm)
Harmirpur 11 4 3 0 1 61 257 286 144 14 0 1 748 782
Jhansi 10 1 2 0 0 58 269 314 155 10 0 0 795 820
Chhatarpur 13 3 2 0 0 76 315 375 163 12 0 1 930 961
Tikamgarh 12 2 2 0 0 67 301 349 157 11 0 0 874 901
Panna 14 4 3 1 1 92 338 388 173 11 0 1 991 1,026
Raisen 8 2 1 0 1 108 374 442 218 13 1 0 1,143 1,170
Vidisha 10 2 1 0 0 92 319 395 151 8 1 0 957 980
Average 11 2 2 0 1 79 310 364 166 11 1 1 920 949
P751 (mm)
Harmirpur 4 1 1 0 0 28 190 205 94 3 0 0 517 525
Jhansi 3 0 0 0 0 24 180 226 97 2 0 0 527 532
Chhatarpur 4 0 0 0 0 36 227 276 105 2 0 0 644 650
Tikamgarh 4 0 0 0 0 30 203 253 98 2 0 0 585 591
Panna 4 1 0 0 0 46 252 292 114 2 0 0 704 711
Raisen 2 0 0 0 0 66 271 336 135 2 0 0 807 812
Vidisha 3 0 0 0 0 52 225 290 84 1 0 0 651 655
Average 3 0 0 0 0 40 221 268 104 2 0 0 634 639
ETp1 (mm)
Harmirpur 72 95 162 210 247 217 134 127 122 122 84 67 599 1,659
Jhansi 76 99 160 206 247 211 135 122 127 127 88 69 596 1,668
Chhatarpur 79 101 163 205 246 202 126 117 121 125 90 73 567 1,649
Tikamgarh 80 102 163 207 247 206 129 117 124 127 92 73 576 1,669
Panna 79 101 162 205 244 199 122 116 118 122 88 72 555 1,628
Raisen 97 121 183 227 278 202 123 108 124 133 105 88 557 1,788
Vidisha 94 117 180 224 274 207 126 108 126 134 102 85 566 1,778
Average 83 105 168 212 255 206 128 116 123 127 93 75 574 1,691
Source:Climate and Water Atlas (IWMI 1998)
Notes: 1 – P50 and P75 are respectively 50 % and 75 % exceedence probability dependable rainfall. ETp is the potentialevapotranspiration.
land-use patterns in the Bundelkhand region. We examined the compatibility and realistic natureof the proposed irrigation pattern in both the kharif and rabi seasons in the KBP command,which also provided interesting insight in terms of cropping patterns too. The KBP proposespaddy as a major irrigated crop in the kharif season (Table 3), which consists of 18 % of theannual gross irrigated area, but 41 % of the kharif irrigated area. To what extent the past orcurrent cropping patterns in the command area figure in determining cropping patterns for theproject is indeed an intriguing question, and one which we examine in detail in a later section.

199
Benefits of Irrigation Water Transfers in the National River Linking Project: Ken-Betwa Link
The assessment in this paper, on estimating the benefits of the proposed irrigation watertransfers, uses data from many sources. We assess the compatibility of the proposed croppingpatterns in comparison to the past trends using the time series data of land use and croppingpatterns from 1970-1997 in seven districts covering the command area. Data on various aspectsof Indian agriculture at the district level compiled by ICRISAT, and Hyderabad is the sourcefor time series data (ICRISAT 2000). A primary survey conducted en route and in the KMPPcommand areas, assesses the differences of proposed cropping patterns by the NWDAfeasibility report and those found presently on the ground. It also assesses the net value ofbenefits in existing irrigated and unirrigated command areas, and the differences between theseare then used for assessing the benefits of proposed irrigation transfers in the KBP.
The primary survey, stratified according to land-use patterns, consists of a randomsample of 1,000 farmers—20 farmers each from 50 villages. Selected villages for the survey fall
Table 2. Net and gross irrigated area (1,000 ha) and irrigation supply (million m3) in theKBP command.
Component in Net irrigated Gross irrigated area (1,000 ha) Total
KBP command area karif rabi Perennial Total irrigation(1,000 ha) season season crops supply
En-route command 27.0 22.6 22.2 1.9 46.7 312
Ken command 241.3 144.7 178.5 0.0 323.2 2,225
Betwa command 102.0 48.2 74.8 3.8 126.7 659
Total 370.3 215.5 275.5 5.7 496.6 3,196
Source:KBP feasibility report (NWDA 2006)
Table 3. The proposed cropping patterns in the KBP command area.
Season Crop Crop area (percent of gross irrigated area)
En-route Ken Betwa Total
Kharif Paddy 32 15 20 17.8
Jowar/bajra/maize 6 6 4 5.5
Pulses 2 11 5 8.7
Oilseeds 4 9 6 7.7
Vegetables 2 4 2 3.1
Fodder 2 1 0.4
Rabi Wheat 32 34 40 35.1
Pulses 4 12 10 10.7
Oilseeds 4 7 5 6.5
Vegetables 4 4 1.4
Fodder 4 2 0 1.8
Perennial Sugarcane 4 3 1.1
Total 100 100 100 100
Source:KBP feasibility report (NWDA 2006)

200
U. A. Amarasinghe, O. P. Singh, T. Shah and R. S. Chauhan
within the two command areas, a rough indication of locations for which is available in theindex map (Figure 1). Villages were selected to represent head, middle and tail sections, andalso the existing surface and groundwater irrigated areas and the rain-fed area in the KBPcommand (Table 4).
Table 4. Composition of the sample in proposed KBP command.
Land-use patterns Total Distribution among districts
Jhansi Tikamgarh Chhatarpur Harimpur Panna
Canal irrigation 320 40 40 220 0 20
Groundwater irrigation 180 20 20 100 20 20
Rain-fed 500 20 60 360 20 40
Total 1,000 80 120 680 40 80
A questionnaire survey collected socioeconomic data from farmers’ households;information of landholdings and their tenure patterns; details of cropping patterns; inputs andcrop outputs; and irrigation water-use patterns for the largest parcel in the landholdings. Sub-samples in different land-use patterns fairly represent the situation at the district level. Morethan 52 % of the sample consists of small or marginal landholders, and about 16 % of farmershave medium or large landholdings (Table 5).
Table 5. Distribution of parcel sizes between different land-use patterns.
Land use patterns Distribution of sampled parcel sizes (%)
Marginal Small Semi-medium Medium Large Total
0-1 ha 1-2 ha 2-4 ha 4-10 ha >10 ha
Canal irrigation 20 32 29 17 2 100
Groundwater irrigation 19 35 36 8 1 100
Rain-fed 13 39 32 14 2 100
Total sample 16 36 32 14 2 100
Irrigation Trends in the KBP Command
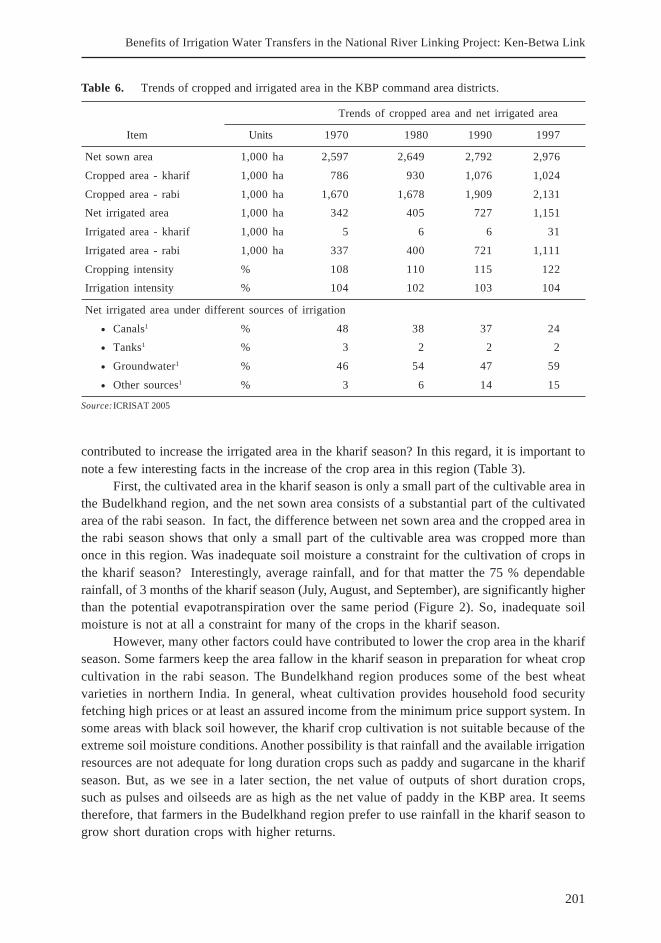
A major increase in the cropped area in the Bundelkhand region in the past was due to increasedirrigation in the rabi (dry) season. We assessed the trends of area expansion using time seriesdata of cropping patterns in seven districts covering the KBP (Table 6). Although growth in theirrigated area in the kharif season was negligible, growth in the crop irrigated area and the netirrigated area were very much similar in the rabi season. In fact, irrigation has contributed tovirtually all the increases in the cropped area in the rabi season since 1970, which is more thanfour times the increase in the cropped area in the kharif season. However, irrigation was not asignificant factor in the increase of the crop area in the kharif season. Why has irrigation not
201
Benefits of Irrigation Water Transfers in the National River Linking Project: Ken-Betwa Link
contributed to increase the irrigated area in the kharif season? In this regard, it is important tonote a few interesting facts in the increase of the crop area in this region (Table 3).
First, the cultivated area in the kharif season is only a small part of the cultivable area inthe Budelkhand region, and the net sown area consists of a substantial part of the cultivatedarea of the rabi season. In fact, the difference between net sown area and the cropped area inthe rabi season shows that only a small part of the cultivable area was cropped more thanonce in this region. Was inadequate soil moisture a constraint for the cultivation of crops inthe kharif season? Interestingly, average rainfall, and for that matter the 75 % dependablerainfall, of 3 months of the kharif season (July, August, and September), are significantly higherthan the potential evapotranspiration over the same period (Figure 2). So, inadequate soilmoisture is not at all a constraint for many of the crops in the kharif season.
However, many other factors could have contributed to lower the crop area in the kharifseason. Some farmers keep the area fallow in the kharif season in preparation for wheat cropcultivation in the rabi season. The Bundelkhand region produces some of the best wheatvarieties in northern India. In general, wheat cultivation provides household food securityfetching high prices or at least an assured income from the minimum price support system. Insome areas with black soil however, the kharif crop cultivation is not suitable because of theextreme soil moisture conditions. Another possibility is that rainfall and the available irrigationresources are not adequate for long duration crops such as paddy and sugarcane in the kharifseason. But, as we see in a later section, the net value of outputs of short duration crops,such as pulses and oilseeds are as high as the net value of paddy in the KBP area. It seemstherefore, that farmers in the Budelkhand region prefer to use rainfall in the kharif season togrow short duration crops with higher returns.
Table 6. Trends of cropped and irrigated area in the KBP command area districts.
Trends of cropped area and net irrigated area
Item Units 1970 1980 1990 1997
Net sown area 1,000 ha 2,597 2,649 2,792 2,976
Cropped area - kharif 1,000 ha 786 930 1,076 1,024
Cropped area - rabi 1,000 ha 1,670 1,678 1,909 2,131
Net irrigated area 1,000 ha 342 405 727 1,151
Irrigated area - kharif 1,000 ha 5 6 6 31
Irrigated area - rabi 1,000 ha 337 400 721 1,111
Cropping intensity % 108 110 115 122
Irrigation intensity % 104 102 103 104
Net irrigated area under different sources of irrigation
• Canals1 % 48 38 37 24
• Tanks1 % 3 2 2 2
• Groundwater1 % 46 54 47 59
• Other sources1 % 3 6 14 15
Source: ICRISAT 2005

202
U. A. Amarasinghe, O. P. Singh, T. Shah and R. S. Chauhan
Second, the irrigation development in the past has only contributed to increase the irrigatedarea of the rabi season. In fact, the growth of the irrigated area in the rabi season has contributedto 96 % of the growth of the total net irrigated area during 1970-1997 (Table 6), and of the totalirrigation in 2006, more than 99 % was during the rabi season (Table 7). Was inadequate accessor control of water the reason for the low irrigated area in the kharif season? Some studies showinadequate availability of water as a key factor for low irrigation intensity in the Bundelkhandregion (Bharatndu et al. 998; NWDA 2006). However, our survey shows that farmers, even in thegroundwater command areas do not use irrigation for any crops in the kharif season. In fact,about 60 % of farmers in the irrigated command area use groundwater. Given the control ofirrigation application, it is reasonable to assume that farmers would have irrigated at least thegroundwater irrigated area in the kharif season, had there been a deficit of soil moisture for theircrops. But the data shows almost all farmers did not irrigate their parcels during the kharif seasonin the proposed KBP command area. This is true even in the parcels in the canal command areas.In the KBP, rainfall adequately meets the water requirements of current cropping patterns. Andas mentioned before, farmers in the KBP seems to prefer oilseeds and pulses in the kharif seasonas they fetch higher net returns, and also require less water.
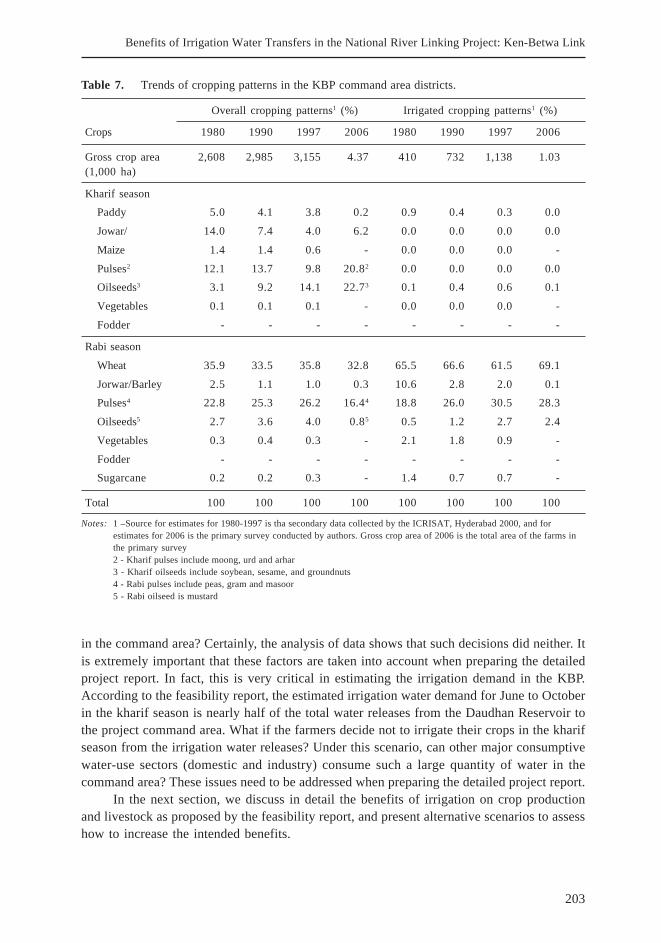
Given these trends, one possibility, and, in fact, a very likely scenario is that farmers wouldnot irrigate their parcels in the command area in the kharif season even with the availability ofmore water from the proposed irrigation transfers. Did the feasibility study of the KBP (NWDA2006) take into account the past trends or the present status of irrigation patterns in the commandarea for designing the cropping patterns, and estimating the subsequent irrigation demand? Itseems, not. In fact, quite contrary to the current cropping patterns, the feasibility report proposes58 % of the KBP command area to be irrigated in the kharif season (see Table 7). Moreover, riceis the predominant crop in the kharif season cropping patterns, covering 41 % of the total area,even though, recent trends suggest that the area of rice, both in absolute number and also relativeto other crops, has been decreasing from 20 % in 1970 to 15 % in 1997.
So, given these trends, under what conditions will the farmers in Bundelkhand regionirrigate more paddy, or irrigate any other crop, in the kharif season? Did the decisions onproposed cropping patterns reflect the current trends on the ground or the farmer’s preferences
Figure 2. Potential evapotranspiration, and 50 % and 75 % exceeding probability rainfall in command area.
Source: IWMI Water and Climate Atlas (IWMI 2000)
203
Benefits of Irrigation Water Transfers in the National River Linking Project: Ken-Betwa Link
Table 7. Trends of cropping patterns in the KBP command area districts.
Overall cropping patterns1 (%) Irrigated cropping patterns1 (%)
Crops 1980 1990 1997 2006 1980 1990 1997 2006
Gross crop area 2,608 2,985 3,155 4.37 410 732 1,138 1.03(1,000 ha)
Kharif season
Paddy 5.0 4.1 3.8 0.2 0.9 0.4 0.3 0.0
Jowar/ 14.0 7.4 4.0 6.2 0.0 0.0 0.0 0.0
Maize 1.4 1.4 0.6 - 0.0 0.0 0.0 -
Pulses2 12.1 13.7 9.8 20.82 0.0 0.0 0.0 0.0
Oilseeds3 3.1 9.2 14.1 22.73 0.1 0.4 0.6 0.1
Vegetables 0.1 0.1 0.1 - 0.0 0.0 0.0 -
Fodder - - - - - - - -
Rabi season
Wheat 35.9 33.5 35.8 32.8 65.5 66.6 61.5 69.1
Jorwar/Barley 2.5 1.1 1.0 0.3 10.6 2.8 2.0 0.1
Pulses4 22.8 25.3 26.2 16.44 18.8 26.0 30.5 28.3
Oilseeds5 2.7 3.6 4.0 0.85 0.5 1.2 2.7 2.4
Vegetables 0.3 0.4 0.3 - 2.1 1.8 0.9 -
Fodder - - - - - - - -
Sugarcane 0.2 0.2 0.3 - 1.4 0.7 0.7 -
Total 100 100 100 100 100 100 100 100
Notes: 1 –Source for estimates for 1980-1997 is tha secondary data collected by the ICRISAT, Hyderabad 2000, and forestimates for 2006 is the primary survey conducted by authors. Gross crop area of 2006 is the total area of the farms inthe primary survey2 - Kharif pulses include moong, urd and arhar3 - Kharif oilseeds include soybean, sesame, and groundnuts4 - Rabi pulses include peas, gram and masoor5 - Rabi oilseed is mustard
in the command area? Certainly, the analysis of data shows that such decisions did neither. Itis extremely important that these factors are taken into account when preparing the detailedproject report. In fact, this is very critical in estimating the irrigation demand in the KBP.According to the feasibility report, the estimated irrigation water demand for June to Octoberin the kharif season is nearly half of the total water releases from the Daudhan Reservoir tothe project command area. What if the farmers decide not to irrigate their crops in the kharifseason from the irrigation water releases? Under this scenario, can other major consumptivewater-use sectors (domestic and industry) consume such a large quantity of water in thecommand area? These issues need to be addressed when preparing the detailed project report.
In the next section, we discuss in detail the benefits of irrigation on crop productionand livestock as proposed by the feasibility report, and present alternative scenarios to assesshow to increase the intended benefits.
204
U. A. Amarasinghe, O. P. Singh, T. Shah and R. S. Chauhan
Net Benefits of Irrigation Water Transfers
Ideally, the economic benefits of irrigation water supply include direct and indirect benefitson: 1) crop production; 2) animal husbandry; 3) farm equipments and input supplies (backwardlinkages); 4) agro-processing (forward linkages); and 5) employment generation. New irrigationtransfers can have indirect positive impact in both inside and outside the project commandarea. The return flows of irrigation in the command area recharges groundwater. This in turncan facilitate conjunctive water use within the command area, and groundwater irrigationoutside the command area. Therefore, the total ‘effective command area’ from the new irrigationsupply includes both the total surface only and conjunctive irrigated area within the command,and the total area outside the command that groundwater (which is recharged from return flowswithin the command) irrigates.
New irrigation water transfers can also entail a benefit loss. This can be a gross benefitloss in the downstream of the reservoir due to the reduced river flow, and also in the upstreamof the reservoir due to submergence of the crop area. Furthermore, such transfers can alsocreate a benefit loss in the command area due to the acquisition of farm lands for the en routecanal command.
We used the data collected from the primary survey for estimating the net economicbenefits in three components. They are:
1. Value-added direct crop production and livestock benefits. The valued-addedproduction is the total value of outputs minus total purchased inputs. The purchaseinputs are the sum of the cost of crop production inputs, land rent, capital costdepreciation and hired and family labor costs. The value-added benefit from livestockproduction is the gross income from livestock production minus the total cost of inputsand labor.
2. Value-added indirect crop and livestock production in the non-command area irrigatedthrough groundwater, which is recharged by the return flows of irrigation in thecommand area.
3. Crop and livestock production loss due to submergence of the crop area in theupstream of the reservoir.
We also estimated the following indirect economic benefits:
1. Value-added through forward linkages, which include the benefits due to agro-basedindustries, transportation and storage facilities, and employment generation.
2. Value-added through backward linkages, which include the benefits due to increasedfarm supplies and services such as fertilizer, pesticide, farm equipment andemployment generation.
However, information available from the primary survey on forward and backwardlinkages for ex ante benefit evaluation is very limited. Therefore, we used the multiplier factor,
205
Benefits of Irrigation Water Transfers in the National River Linking Project: Ken-Betwa Link
which captures the indirect benefits from irrigation in the command area due to increasedforward and backward linkages in the region. Bhatia and Malik (2005) estimated that theirrigation multiplier for the Bakhra irrigation command in the Haryana, which assessed theindirect benefits of backward and forward linkage, is about 1.90 – which means every Rs.100 that the project generates as a direct benefit will yield another Rs. 90 as an indirectbenefit. Malik (2007) also argued that considering the small size of the command area andthe level of diversification that can be expected with new irrigation, the KBP would notgenerate indirect economic benefits as much as those in the Bakhra irrigation command. Heargues that the KBP can be compared with a small check dam in a village in the hill regionsof Shivalik in Haryana. The World Bank (2006) has estimated the regional multiplier for thecheck dam in the Shivalik hills to be in the order of 1.40. Therefore, for this study, we usedthe regional multiplier of 1.4 to estimate the indirect benefits in the Bundelkhand regionsdue to transfers of irrigation water to the KBP. And we also assessed the sensitivity of theestimated irrigation benefits to higher regional multipliers.
Net Value of Crop Production in the Command Area
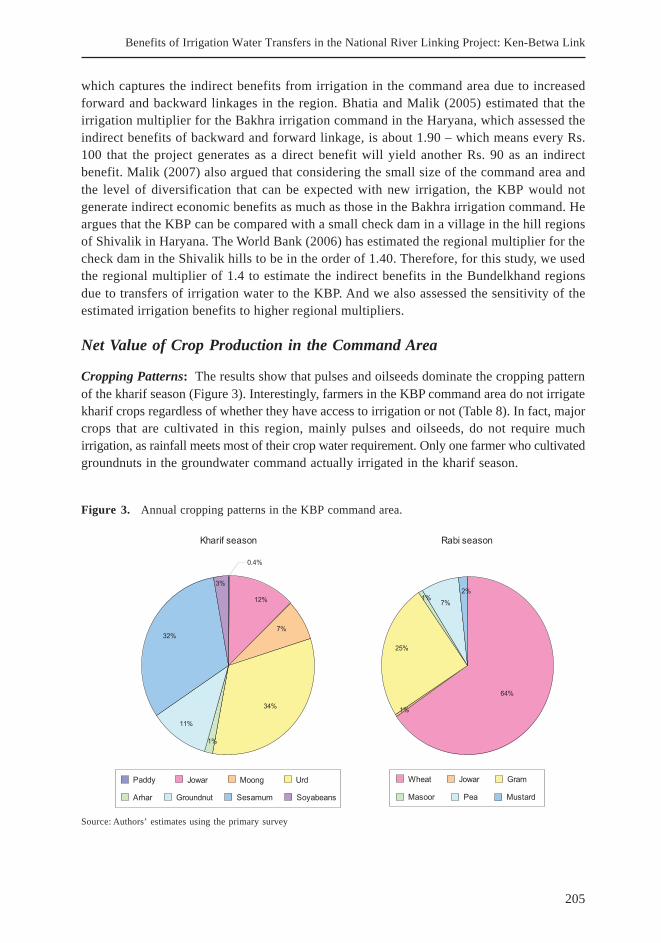
Cropping Patterns: The results show that pulses and oilseeds dominate the cropping patternof the kharif season (Figure 3). Interestingly, farmers in the KBP command area do not irrigatekharif crops regardless of whether they have access to irrigation or not (Table 8). In fact, majorcrops that are cultivated in this region, mainly pulses and oilseeds, do not require muchirrigation, as rainfall meets most of their crop water requirement. Only one farmer who cultivatedgroundnuts in the groundwater command actually irrigated in the kharif season.
Figure 3. Annual cropping patterns in the KBP command area.
Source: Authors’ estimates using the primary survey
206
U. A. Amarasinghe, O. P. Singh, T. Shah and R. S. Chauhan
Wheat and gram dominate the KBP’s cropping pattern of the rabi season. Except forgram however, all other crops in the canal and well irrigated command areas are fully irrigatedin the rabi season. Farmers who have access to irrigation, do irrigate only half of the gramcrop area. Overall, only 45 % and 43 % of the annual crop area was irrigated in the existingcanal and groundwater irrigation command areas. We used this cropping pattern to estimatethe difference between the current net value of benefits of crop production in the KBP commandarea with and without irrigation.
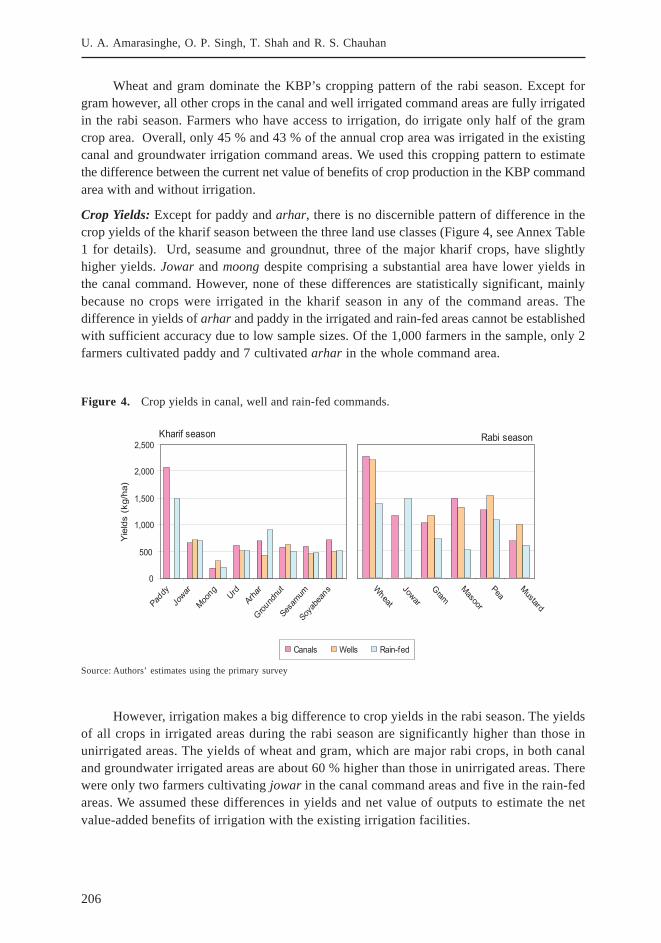
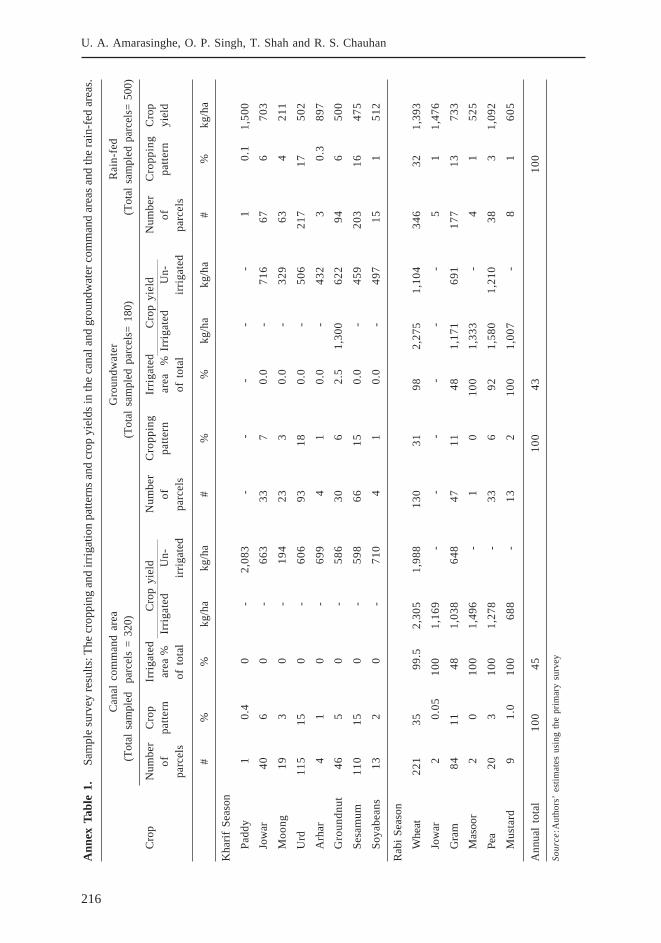
Crop Yields: Except for paddy and arhar, there is no discernible pattern of difference in thecrop yields of the kharif season between the three land use classes (Figure 4, see Annex Table1 for details). Urd, seasume and groundnut, three of the major kharif crops, have slightlyhigher yields. Jowar and moong despite comprising a substantial area have lower yields inthe canal command. However, none of these differences are statistically significant, mainlybecause no crops were irrigated in the kharif season in any of the command areas. Thedifference in yields of arhar and paddy in the irrigated and rain-fed areas cannot be establishedwith sufficient accuracy due to low sample sizes. Of the 1,000 farmers in the sample, only 2farmers cultivated paddy and 7 cultivated arhar in the whole command area.
Source: Authors’ estimates using the primary survey
Figure 4. Crop yields in canal, well and rain-fed commands.
However, irrigation makes a big difference to crop yields in the rabi season. The yieldsof all crops in irrigated areas during the rabi season are significantly higher than those inunirrigated areas. The yields of wheat and gram, which are major rabi crops, in both canaland groundwater irrigated areas are about 60 % higher than those in unirrigated areas. Therewere only two farmers cultivating jowar in the canal command areas and five in the rain-fedareas. We assumed these differences in yields and net value of outputs to estimate the netvalue-added benefits of irrigation with the existing irrigation facilities.

207
Benefits of Irrigation Water Transfers in the National River Linking Project: Ken-Betwa Link
Net Value of Output of Crop Production: The net value of output of crop production issignificantly higher in irrigated parcels than in unirrigated ones (Table 8). Within the canalcommand areas, no crops were irrigated in the kharif season. But the net value of output inthe kharif season is highest in the canal command areas, followed by groundwater irrigatedand rain-fed areas. This may be due to the fact that, although the farmers in the canal commanddo not irrigate their crops in the kharif season, they do mange their input application muchbetter than the farmers in the rain-fed areas.
Table 8. Net value of outputs (NVO) per ha in canal and well irrigation and rain-fed command areas.
Net value of output per ha of cropped area ($/ha)
Season Canal command area Well command area Rain-fed Totalarea
I UI Total I UI Total Total I UI Total
NVO-kharif 0 223 223 156 175 175 173 156 177 177
NVO-rabi 273 194 264 232 212 230 167 242 170 189
NVO-annual 273 219 244 231 179 202 170 241 174 183
Source:Authors’ estimates based on primary survey
Notes: I- Irrigated; UI- Unirrigated
There were significant differences in the net value of outputs across the command areasin the rabi season. Almost all farmers in the canal and well irrigation commands do irrigatetheir crops in the rabi season. The net value of outputs of the rabi season crops in irrigatedcommand areas is about 35 % higher than that of rain-fed crops. It is also interesting to notethat unirrigated lands in the canal and groundwater command areas have a consistently highernet value of output than in the rain-fed lands.
Net Value of Livestock Production
Livestock Population: Livestock production, especially milk, is a major part of the agriculturaleconomy in the Bundelkhand region. Of the surveyed area, 60 % of the households possessmilking cows or buffaloes or goats (Table 9). This is rather high in comparison to the nationaldata. More than 70 %s of the households in each command area have only a single milkinganimal, with groundwater irrigated areas have the highest percentage of single milking animal(81%). More farmers in the canal command areas keep milking cows (56 %), more so thanthose in groundwater (43 %) and rain-fed commands (48 %). More farmers in the groundwaterirrigated (68 %) and rain-fed areas (62 %) keep milking buffaloes than those in the canalirrigated areas (50 %). These differences could be due to the nature of farm work and therequirement of animals for such activities and the availability of feed in the groundwaterirrigated and rain-fed areas.
208
U. A. Amarasinghe, O. P. Singh, T. Shah and R. S. Chauhan
Table 9. Livestock rearing pattern in the Ken-Betwa project command.
Command Householdsarea with milking Pattern of livestock rearing Milk productivity
livestock (% of total milking livestock) (liters/day/animal)
(%) C B G C+B C+G B+G C+B+G C B G
Canal 62 32 28 12 15 6 4 3 2.6 4.0 0.6
Well 56 25 50 6 16 2 2 0 2.4 3.8 0.6
Rain-fed 58 21 39 10 13 7 3 7 2.6 2.9 0.6
Source:Authors’ estimates are based on primary survey
Notes: C- Cows, B-Buffaloes, G-Goats
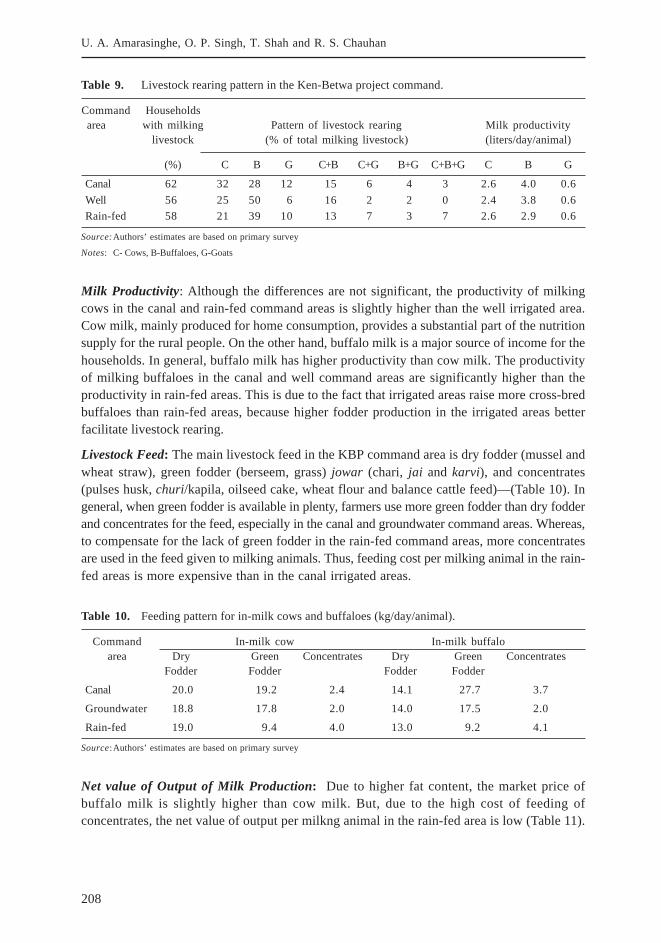
Milk Productivity: Although the differences are not significant, the productivity of milkingcows in the canal and rain-fed command areas is slightly higher than the well irrigated area.Cow milk, mainly produced for home consumption, provides a substantial part of the nutritionsupply for the rural people. On the other hand, buffalo milk is a major source of income for thehouseholds. In general, buffalo milk has higher productivity than cow milk. The productivityof milking buffaloes in the canal and well command areas are significantly higher than theproductivity in rain-fed areas. This is due to the fact that irrigated areas raise more cross-bredbuffaloes than rain-fed areas, because higher fodder production in the irrigated areas betterfacilitate livestock rearing.
Livestock Feed: The main livestock feed in the KBP command area is dry fodder (mussel andwheat straw), green fodder (berseem, grass) jowar (chari, jai and karvi), and concentrates(pulses husk, churi/kapila, oilseed cake, wheat flour and balance cattle feed)—(Table 10). Ingeneral, when green fodder is available in plenty, farmers use more green fodder than dry fodderand concentrates for the feed, especially in the canal and groundwater command areas. Whereas,to compensate for the lack of green fodder in the rain-fed command areas, more concentratesare used in the feed given to milking animals. Thus, feeding cost per milking animal in the rain-fed areas is more expensive than in the canal irrigated areas.
Table 10. Feeding pattern for in-milk cows and buffaloes (kg/day/animal).
Command In-milk cow In-milk buffaloarea Dry Green Concentrates Dry Green Concentrates
Fodder Fodder Fodder Fodder
Canal 20.0 19.2 2.4 14.1 27.7 3.7
Groundwater 18.8 17.8 2.0 14.0 17.5 2.0
Rain-fed 19.0 9.4 4.0 13.0 9.2 4.1
Source:Authors’ estimates are based on primary survey
Net value of Output of Milk Production: Due to higher fat content, the market price ofbuffalo milk is slightly higher than cow milk. But, due to the high cost of feeding ofconcentrates, the net value of output per milkng animal in the rain-fed area is low (Table 11).
209
Benefits of Irrigation Water Transfers in the National River Linking Project: Ken-Betwa Link
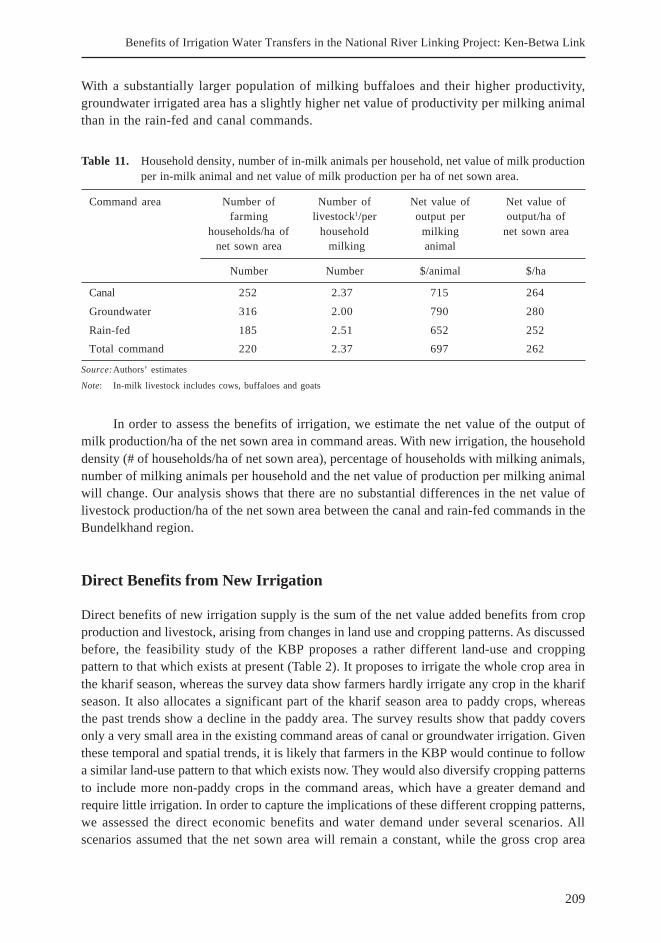
With a substantially larger population of milking buffaloes and their higher productivity,groundwater irrigated area has a slightly higher net value of productivity per milking animalthan in the rain-fed and canal commands.
Table 11. Household density, number of in-milk animals per household, net value of milk productionper in-milk animal and net value of milk production per ha of net sown area.
Command area Number of Number of Net value of Net value offarming livestock1/per output per output/ha of
households/ha of household milking net sown areanet sown area milking animal
Number Number $/animal $/ha
Canal 252 2.37 715 264
Groundwater 316 2.00 790 280
Rain-fed 185 2.51 652 252
Total command 220 2.37 697 262
Source:Authors’ estimates
Note: In-milk livestock includes cows, buffaloes and goats
In order to assess the benefits of irrigation, we estimate the net value of the output ofmilk production/ha of the net sown area in command areas. With new irrigation, the householddensity (# of households/ha of net sown area), percentage of households with milking animals,number of milking animals per household and the net value of production per milking animalwill change. Our analysis shows that there are no substantial differences in the net value oflivestock production/ha of the net sown area between the canal and rain-fed commands in theBundelkhand region.
Direct Benefits from New Irrigation
Direct benefits of new irrigation supply is the sum of the net value added benefits from cropproduction and livestock, arising from changes in land use and cropping patterns. As discussedbefore, the feasibility study of the KBP proposes a rather different land-use and croppingpattern to that which exists at present (Table 2). It proposes to irrigate the whole crop area inthe kharif season, whereas the survey data show farmers hardly irrigate any crop in the kharifseason. It also allocates a significant part of the kharif season area to paddy crops, whereasthe past trends show a decline in the paddy area. The survey results show that paddy coversonly a very small area in the existing command areas of canal or groundwater irrigation. Giventhese temporal and spatial trends, it is likely that farmers in the KBP would continue to followa similar land-use pattern to that which exists now. They would also diversify cropping patternsto include more non-paddy crops in the command areas, which have a greater demand andrequire little irrigation. In order to capture the implications of these different cropping patterns,we assessed the direct economic benefits and water demand under several scenarios. Allscenarios assumed that the net sown area will remain a constant, while the gross crop area
210
U. A. Amarasinghe, O. P. Singh, T. Shah and R. S. Chauhan
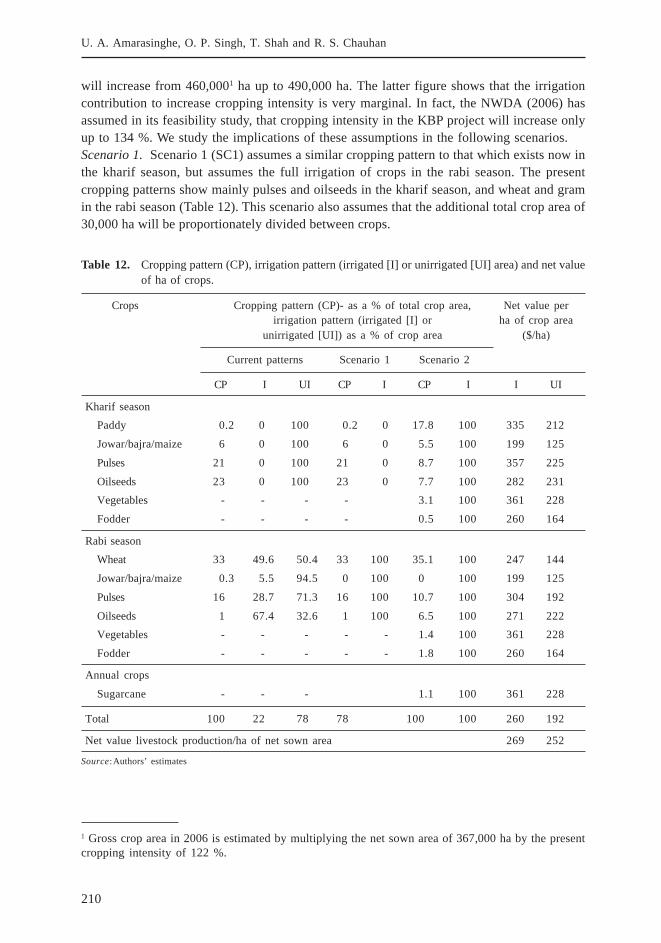
will increase from 460,0001 ha up to 490,000 ha. The latter figure shows that the irrigationcontribution to increase cropping intensity is very marginal. In fact, the NWDA (2006) hasassumed in its feasibility study, that cropping intensity in the KBP project will increase onlyup to 134 %. We study the implications of these assumptions in the following scenarios.Scenario 1. Scenario 1 (SC1) assumes a similar cropping pattern to that which exists now inthe kharif season, but assumes the full irrigation of crops in the rabi season. The presentcropping patterns show mainly pulses and oilseeds in the kharif season, and wheat and gramin the rabi season (Table 12). This scenario also assumes that the additional total crop area of30,000 ha will be proportionately divided between crops.
Table 12. Cropping pattern (CP), irrigation pattern (irrigated [I] or unirrigated [UI] area) and net valueof ha of crops.
Crops Cropping pattern (CP)- as a % of total crop area, Net value perirrigation pattern (irrigated [I] or ha of crop area
unirrigated [UI]) as a % of crop area ($/ha)
Current patterns Scenario 1 Scenario 2
CP I UI CP I CP I I UI
Kharif season
Paddy 0.2 0 100 0.2 0 17.8 100 335 212
Jowar/bajra/maize 6 0 100 6 0 5.5 100 199 125
Pulses 21 0 100 21 0 8.7 100 357 225
Oilseeds 23 0 100 23 0 7.7 100 282 231
Vegetables - - - - 3.1 100 361 228
Fodder - - - - 0.5 100 260 164
Rabi season
Wheat 33 49.6 50.4 33 100 35.1 100 247 144
Jowar/bajra/maize 0.3 5.5 94.5 0 100 0 100 199 125
Pulses 16 28.7 71.3 16 100 10.7 100 304 192
Oilseeds 1 67.4 32.6 1 100 6.5 100 271 222
Vegetables - - - - - 1.4 100 361 228
Fodder - - - - - 1.8 100 260 164
Annual crops
Sugarcane - - - 1.1 100 361 228
Total 100 22 78 78 100 100 260 192
Net value livestock production/ha of net sown area 269 252
Source:Authors’ estimates
1 Gross crop area in 2006 is estimated by multiplying the net sown area of 367,000 ha by the presentcropping intensity of 122 %.
211
Benefits of Irrigation Water Transfers in the National River Linking Project: Ken-Betwa Link
Scenario 2. In scenario 2 (SC2) we assume the same cropping pattern as the one proposedby the feasibility study. In SC2, all crops are irrigated in the kharif and rabi season, and paddyand wheat are the predominant crops in the irrigation plans of both these seasons.Scenario 3. Scenario 3 (SC3) has a similar cropping pattern to scenario 2 (SC2). However, itassumes a different irrigation plan, where farmers irrigate only paddy and vegetable crops inthe kharif season. It is very likely that on average rainfall conditions, the other crops, mainlycoarse cereals, pulses and oilseeds, do not require any irrigation in the kharif season. Thisscenario also assumes all ‘rabi’ crops receive full irrigation.
We assessed the net value of output of each cropping pattern using the estimated netvalues of irrigated and unirrigated crops from the primary survey. However, we also made thefollowing assumptions in estimating the net value of output of all crops:
• The primary survey provided only the net value of output of the kharif crops thatreceived no irrigation. Therefore, we assumed the differences of the net value of outputper ha of all crops in the rabi season (US$260/ha with irrigation and US$164/ha withoutirrigation) between irrigated and rain-fed conditions and used these figures to estimatethe net value of output of paddy, jowar, pulses and oilseeds under irrigationconditions in the kharif season. We multiplied the net value of these crops under un-irrigated conditions by a factor of 1.58 (=260/164-the ratio between net value per hain irrigated to unirrigated area to estimate the net value under irrigated conditions.
• The primary survey did not capture the differences of net value of output ofvegetables and sugarcane. Here too, we assessed the differences of net value ofoutputs of vegetables and sugarcane in irrigated and rain-fed conditions, by usingthe net values of output per ha of pulses and oilseeds in the kharif season. . Thedifferences of net value in the output of all rabi crops is for the fodder crop.
• The indirect benefits of forward and backward linkages are estimated with the irrigationmultiplier of 1.4.
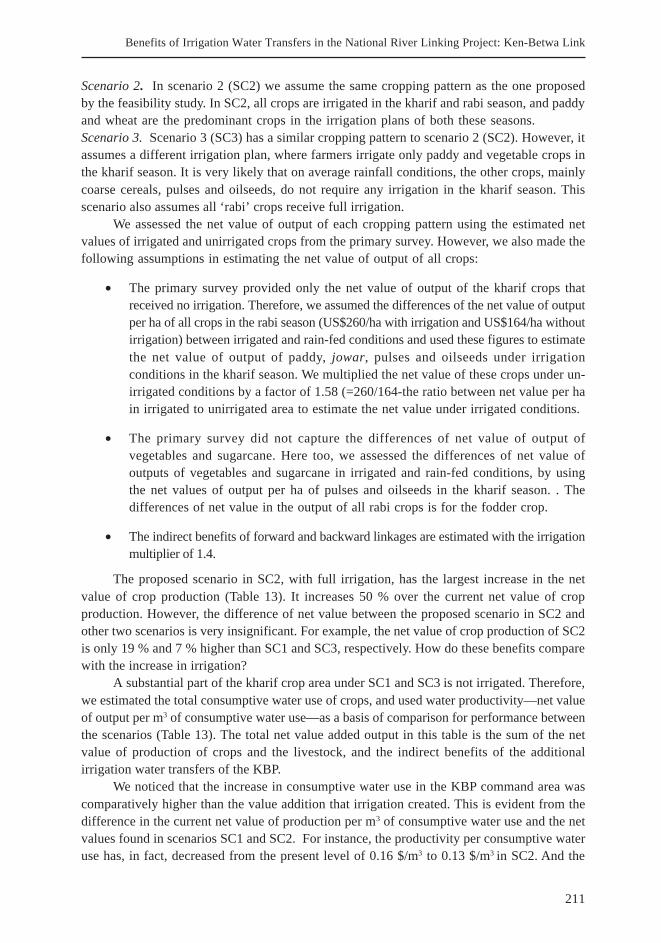
The proposed scenario in SC2, with full irrigation, has the largest increase in the netvalue of crop production (Table 13). It increases 50 % over the current net value of cropproduction. However, the difference of net value between the proposed scenario in SC2 andother two scenarios is very insignificant. For example, the net value of crop production of SC2is only 19 % and 7 % higher than SC1 and SC3, respectively. How do these benefits comparewith the increase in irrigation?
A substantial part of the kharif crop area under SC1 and SC3 is not irrigated. Therefore,we estimated the total consumptive water use of crops, and used water productivity—net valueof output per m3 of consumptive water use—as a basis of comparison for performance betweenthe scenarios (Table 13). The total net value added output in this table is the sum of the netvalue of production of crops and the livestock, and the indirect benefits of the additionalirrigation water transfers of the KBP.
We noticed that the increase in consumptive water use in the KBP command area wascomparatively higher than the value addition that irrigation created. This is evident from thedifference in the current net value of production per m3 of consumptive water use and the netvalues found in scenarios SC1 and SC2. For instance, the productivity per consumptive wateruse has, in fact, decreased from the present level of 0.16 $/m3 to 0.13 $/m3 in SC2. And the
212
U. A. Amarasinghe, O. P. Singh, T. Shah and R. S. Chauhan
Table 13. Net value of production, consumptive water use and the irrigation water requirements underdifferent scenarios.
Factors 2006 Scenario 1 Scenario 2 Scenario 3
1 Net sown area (1,000ha) 370 370 370 370
2 Gross cropped area (1,000ha) 460 490 490 490
3 Gross irrigated area (1,000ha) 140 260 490 387
4 Net value of crop production ($, million) 95 119 142 133
5 Net value of livestock production($,million) 96 96 100 98
6 Total net value of output ($, million) 190 216 242 231
7 Increase in direct benefits ($, million) 24 50 39
8 Increase in indirect benefits ($, million) 22 45 35
9 Total net value added benefits due to 46 96 75additional irrigation ($, million)
10 Total consumptive water use (million, m3) 1,250 1,787 2,004 2,022
11 Net value of output per drop of 0.16 0.14 0.15 0.13consumptive water use ($/m3)
12 Irrigation requirement (million m3) 301 752 1,165 1,095
13 Change in irrigation requirement (million m3) 450 863 794
14 Change in irrigation requirement - % of 14 27 24proposed irrigation supply (3,196 million m3)
Source:Authors’ estimates
productivity estimate, even at 1.9 regional multiplier level will increase only to 0.15$/m3. Thus,given the prevailing differences of crop productivity of irrigated and rain-fed conditions, eventhe proposed cropping patterns will not significantly increase net benefits relative to theincrease in consumptive water use.
Another significant fact to notice in the different scenarios is the differences in the netevaporative requirements. The additional crop irrigation requirement in SC2 is the highest, butit increases only by 867 million m3, which is only 27 % of the proposed irrigation transfers. Ifthe percolation requirement (of about 200 mm) is added to the paddy irrigated area, the additionalirrigation requirement will increase by 1,220 million m3, which is only 38 % of the total watertransfers. This indeed is a very low figure compared to the envisaged irrigation transfers. Itseems that the feasibility study has ignored the prevailing irrigation withdrawals or has takena rather low irrigation efficiency when estimating the additional demand for irrigation.
We estimated the benefit-cost ratio of the irrigation component by assuming 10 years ofthe project construction period, US$431 million of the total cost as estimated by the NWDA,100 years of the project’s life span, and an average annual cost of 5 % of the total cost foroperation and maintenance. At a 10 % discounted rate, the benefit-cost ratio of the irrigationcomponent under the three scenarios is 0.4, 0.8 and 0.6, respectively. If the 1.9 multiplier isused for assessing the indirect benefits, the benefit-cost ratio increases to 0.5, 1.1 and 0.9,respectively for the three scenarios. Indeed, increase in the net benefits when compared tothe cost of irrigation component of the KBP seems to be very insignificant, even under themost optimistic scenarios of the indirect benefits that the project would generate.

213
Benefits of Irrigation Water Transfers in the National River Linking Project: Ken-Betwa Link
Conclusion and Policy Implications
This paper assessed the economic and other implications of the proposed cropping andirrigation patterns in the Ken-Betwa project. Our analysis shows that the proposed croppingand irrigation patterns do not match the changing face of cropping and irrigation patterns inthis region. Although the feasibility study of the project proposes irrigation in the kharif season,neither the past trends nor the present cropping patterns suggest irrigation to be a determinantin agriculture during the kharif season in this region, in that the kharif season almost alwaysreceives adequate rainfall for meeting most of the irrigation requirements in this region. Moreover,the proposed irrigation pattern includes a substantial area under paddy in the kharif season.This is inconsistent with past trends, where the area under paddy has decreased by 10 %during 1980-1997, and is currently only 3.8 % of the total crop area. This clearly shows farmers’preference for paddy in the local area is waning, and the preference for other high-value butless water-intensive crops is increasing. So, then what economic benefits will the proposedirrigation patterns bring in?
Our analysis shows a marginal increase in the net benefits of the proposed irrigationpatterns with respect to increased consumptive water use. The benefit-cost ratio of the irrigationcomponent seems to be very small even under the most optimistic scenarios. We noticed thatthe incremental benefit of the net value of crop production in the KBP area is less than theincrease in the crop consumptive water use. Moreover, according to our estimates, theadditional requirement of irrigation for the proposed cropping pattern, even with full irrigationin the kharif season, is significantly lower than the proposed irrigation diversion from theDaudhan Reservoir to the command area. This situation gets even worse, if farmers decidenot to irrigate in the kharif season.
No irrigation in the kharif season will have significant implications on the proposedirrigation releases to the command area. It is envisaged to release almost half of the annualallocation for irrigation (about 1,563 million m3) to the KBP in the kharif season. If farmerswould not use these releases, on the negative side, this water could create a flood situation inthe low lying areas, waterlogging in the command area or vicinity of the canal and simply flowdown to the river without being used beneficially in the command areas. As most of the rainin the Bundelkhand region falls in the kharif season, it is unlikely that the water transfers canhave additional benefits in recharging the groundwater. In other words, this release is simplya loss to the system. As such, can the irrigation releases envisaged for the kharif season bestored in the reservoir for use in the rabi season? Perhaps a part of the releases can be. Thegross storage capacity of the proposed reservoir at Daudhan is 2,775 Mm3, which is significantlylower than the total 3,245 Mm3 of water transfers envisaged to the KBP command area. Infact, the reservoir acts as a run-of–the river diversion structure for the purposes of watertransfers through the en route command to the Betwa River. However, reservoir storage ismore than adequate to store the full requirement of the rabi season water releases, which isestimated to be at 1,683 Mm3. But the remaining water after the rabi season is concluded willhave to be released before the start of the next season in order to capture the kharif seasonrun-off.
Indeed our analysis also has certain limitations. We have not estimated the impact ofwater releases on the groundwater recharge, and the extent of area that is outside the command,but that can benefit from groundwater irrigation. This analysis has also not assessed the water

214
U. A. Amarasinghe, O. P. Singh, T. Shah and R. S. Chauhan
surpluses of the Ken River to facilitate transfers to the Betwa River basin. Smakhtin et al.(2007), in another study that is related to the overall analyses of the river linking project,showed that the NWDA feasibility report has used annual time series data in estimating thedependable flow at reservoir sites. However, ignoring the monthly variations and using annualdata will almost always result in higher dependable flows, which explain the perception thatrivers indeed have surplus water for transferring to water-scarce basins. The assessment ofbenefit-cost ratio also has certain limitations. In the cost side, it did not consider the cost ofrehabilitation and resettlement of displaced persons, cost of over-runs etc. These are some ofthe highly contentious issues of the discourse of the NRLP, in general, and the KBP, inparticular. In the benefit side, the direct benefits of water use for hydropower and in thedomestic and industrial sectors were also not considered. These would have generatedsignificant benefits to the KBP region, as inadequate electricity and drinking water supply aremajor constraints for economic development in this region. In fact, we observed in our fieldstudies, that in severe drought years, some farmers sell their livestock as they are unable toprovide an adequate drinking water supply for their livestock, let alone fodder and other feed.
Nevertheless, our analysis suggests that during the detailed project report preparationphase, it is necessary to revisit and address the many concerns that perhaps the feasibilitystudies may have missed. They include:
• Evaluating the proposed cropping pattern with respect to the local socioeconomicrequirements and agro-climatological conditions, and proposing a new cropping andirrigation plan that addresses these concerns and will also suit the present cropdiversification trends so that these can be followed in the future.
• Selecting high-value crops that can increase the net value of crop production benefitsat a rate higher than the increase in consumptive water use (or beneficial depletion).Reevaluating the irrigation water requirement for the proposed cropping patterns indifferent months, and assess the water surpluses that can be diverted from the KenRiver to the Betwa River,
• Assessing the reservoir storage that is required to meet the water demand of thedownstream of the Ken River, en route canal, and in the Betwa River basin,
• Assessing the potential for agricultural diversification with more livestock in theregion, and their implications on the total water demand.
References
Alagh, Y.K. 2006. Methodology of Irrigation Planning. The Ken-Betwa Case. In Interlinking of Rivers inIndia. Overview and Ken-betwa Link, eds. respectively Yoginder K Alagh, Ganesh Pangare, and BikshamGujja. New Delhi, India: Academic Foundation.
Alagh, Y.K.; Pangare, G.; Gujja. B. 2006. Interlinking of Rivers in India. Overview and Ken-betwa Link.New Delhi, India: Academic Foundation
Bharatndu, P.; Shaailendra, N.G.; Santosh, S.; Phourasia, L.P. 1998. Problems and Potentials of Bundelkhandwith Special Reference to Water Resource Base. Uttar Pradesh: V.S.K (Banda) publications.

215
Benefits of Irrigation Water Transfers in the National River Linking Project: Ken-Betwa Link
Bhatia, R.; Malik, R.P.S. 2005. Indirect Economic Impacts of Bhakra Multipurpose Dam, India.(Unpublished).
Chopra, K. 2006. The Feasibility Report of Ken-betwa Link Project: An Analysis of Assumptions andMethodology. . In Interlinking of Rivers in India: Overview and Ken-betwa Link, eds.Yoginder K Alagh,Ganesh Pangare, and Biksham Gujja. New Delhi, India: Academic Foundation.
ICRISAT (International Crop Research Institute for Sami Arid Tropics). 2000. Database for IndianAgricultural Statistics. Hyderabad, India: ICRISAT.
IWMI (International Water Management Institute. 1998. Climate and Water Atlas, Colombo, Sri Lanka:International Water Management Institute.
Malik, R.P.S. 2007. Assessing indirect impacts of new irrigation projects (personal communication).
Mohile, A.D. 2006. Facilitating Water Transfers- Preparing and Marketing of Water Transfer Reports. InInterlinking of Rivers in India. Overview and Ken-betwa Link, eds.Yoginder K Alagh, Ganesh Pangare,and Biksham Gujja. New Delhi, India: Academic Foundation.
NWDA (National Water Development Agency). 2005. Feasibility Report of Ken-Betwa Link. India: Ministryof Water Resources, Government of India.
Patkar, M.; Parekh, P. 2006. Critique of Ken-Betwa Feasibility Report: Resettlement, Rhabilitation, andEnvironmental Aspects: In Interlinking of Rivers in India. Overview and Ken-betwa Link, eds.YoginderK Alagh, Ganesh Pangare, and Biksham Gujja. New Delhi, India: Academic Foundation.
Thakka, H.; Chaturvedi, B.C. 2006. Ken-Beta Link: Why it Won’t Click? In Interlinking of Rivers in India.Overview and Ken-betwa Link, eds.Yoginder K Alagh, Ganesh Pangare, and Biksham Gujja. New Delhi,India: Academic Foundation.
216
U. A. Amarasinghe, O. P. Singh, T. Shah and R. S. Chauhan
Ann
ex T
able
1.
Sam
ple
surv
ey r
esul
ts: T
he c
ropp
ing
and
irri
gatio
n pa
ttern
s an
d cr
op y
ield
s in
the
cana
l and
gro
undw
ater
com
man
d ar
eas
and
the
rain
-fed
are
as.
Can
al c
omm
and
area
Gro
undw
ater
Rai
n-fe
d(T
otal
sam
pled
pa
rcel
s =
320
)(T
otal
sam
pled
par
cels
= 1
80)
(Tot
al s
ampl
ed p
arce
ls=
500
)
Cro
pN
umbe
rC
rop
Irri
gate
dC
rop
yiel
dN
umbe
rC
ropp
ing
Irri
gate
dC
rop
yiel
dN
umbe
rC
ropp
ing
Cro
pof
patt
ern
area
%Ir
riga
ted
Un-
ofpa
tter
nar
ea
%Ir
riga
ted
Un-
ofpa
tter
nyi
eld
parc
els
of t
otal
irri
gate
dpa
rcel
sof
tot
alir
riga
ted
parc
els
#%
%kg
/ha
kg/h
a#
%%
kg/h
akg
/ha
#%
kg/h
a
Kha
rif
Sea
son
Pad
dy1
0.4
0-
2,08
3-
--
--
10.
11,
500
Jow
ar40
60
-66
333
70.
0-
716
676
703
Moo
ng19
30
-19
423
30.
0-
329
634
211
Urd
115
150
-60
693
180.
0-
506
217
1750
2
Arh
ar4
10
-69
94
10.
0-
432
30.
389
7
Gro
undn
ut46
50
-58
630
62.
51,
300
622
946
500
Ses
amum
110
150
-59
866
150.
0-
459
203
1647
5
Soy
abea
ns13
20
-71
04
10.
0-
497
151
512
Rab
i S
easo
n
Whe
at22
135
99.5
2,30
51,
988
130
3198
2,27
51,
104
346
321,
393
Jow
ar2
0.05
100
1,16
9-
--
--
-5
11,
476
Gra
m84
1148
1,03
864
847
1148
1,17
169
117
713
733
Mas
oor
20
100
1,49
6-
10
100
1,33
3-
41
525
Pea
203
100
1,27
8-
336
921,
580
1,21
038
31,
092
Mus
tard
91.
010
068
8-
132
100
1,00
7-
81
605
Ann
ual
tota
l10
045
100
4310
0
Sour
ce:A
utho
rs’
esti
mat
es u
sing
the
pri
mar
y su
rvey