benchmarking & · pdf file · 2010-03-11benchmarking & benchmarks 1 how...
TRANSCRIPT
Benchmarking & BenchmarksEffective Practice with Entering Students
If it takes a village to raise a child, it takes a strong network of committed colleagues to launch an initiative like SENSE. From its conception in fall 2006 to the first national administration in fall 2009, the Survey of Entering Student Engagement (SENSE) has been supported by key individuals and groups, without whom there would have been little chance that this idea — to create a national survey focusing on the front door of the community college — could have been achieved.
To date, more than 91,000 students from 197 colleges in 37 states have participated in SENSE, thereby helping to create a wealth of new and actionable data about the entering community college student experience. Already this fresh information is having an impact on the field: Participating colleges are using these data to make significant changes on their campuses to positively affect entering students.
We sincerely acknowledge and profoundly appreciate the contributions of many people. We extend special gratitude to:
Our colleagues at Houston Endowment Inc., Lumina Foundation for Education, and MetLife Foundation for their vision, for understanding the importance of this work, and for providing the support needed to make sure we brought the best possible tool to practitioners.
The members of our Technical Advisory Panel and National Advisory Board for their expertise and guidance through the survey development process.
Our esteemed colleague Dr. John Roueche, director of the Community College Leadership Program at The University of Texas at Austin, whose 40 years of leadership continue to inspire all of us.
Our member colleges, for making systematic collection and analysis of data a priority, which is especially important in tough economic times.
The community college staff members who coordinate the survey administration.
The community college faculty who willingly donate one critical class period early in the fall semester to accommodate survey administration, and who then take seriously the messages students are sharing about their earliest college experiences.
Our staff at the Center for Community College Student Engagement, who all touched some aspect of this project, for being a smart, focused, hard-working, innovative, creative — and just plain nice — group of people.
We dedicate this report to all of these people and to millions of courageous community college students, many of whom defy overwhelming odds to walk through our doors each fall in search of a better life. They deserve from each of us, every day and without exception, that we do everything within our power to help them achieve their academic goals.
Angela Oriano-DarnallAssociate Director, SENSE
Acknowledgments
Published by the Center for Community College Student Engagement.
© 2010 Permission granted for unlimited copying with appropriate citation.
Please cite this report as: Center for Community College Student Engagement. (2009). Benchmarking & Benchmarks: Effective Practice with Entering Students. Austin, TX: The University of Texas at Austin, Community College Leadership Program.
Supported by grants from Houston Endowment Inc. Lumina Foundation for Education MetLife Foundation
Co-sponsored by The Carnegie Foundation for the Advancement of Teaching
“I wanted to know about the Licensed Vocational Nurse (LVN) program, and the
counselor said, ‘Why would you want to do the LVN program when you can be an RN?’ I thought,
‘Well, the RN is a little bit longer, and it’s got harder prerequisites,’ but she said, ‘So?’ She was realistic
about it, and she encouraged me to do it.”
— Female student
Benchmarking & Benchmarks 1
How Good Is Good? Understanding Benchmarking and Benchmarks 2
The SENSE Benchmarks of Effective Practice with Entering Students 4
How to Benchmark: An Ongoing Cycle of Improvement 18
Moving Forward: Challenges and Next Steps 21
Overview of the 2009 SENSE Respondents 23
CCCSE National Advisory Board 24
SENSE Technical Advisory Panel 24
Contents
“I wanted to know about the Licensed Vocational Nurse (LVN) program, and the
counselor said, ‘Why would you want to do the LVN program when you can be an RN?’ I thought,
‘Well, the RN is a little bit longer, and it’s got harder prerequisites,’ but she said, ‘So?’ She was realistic
about it, and she encouraged me to do it.”
— Female student
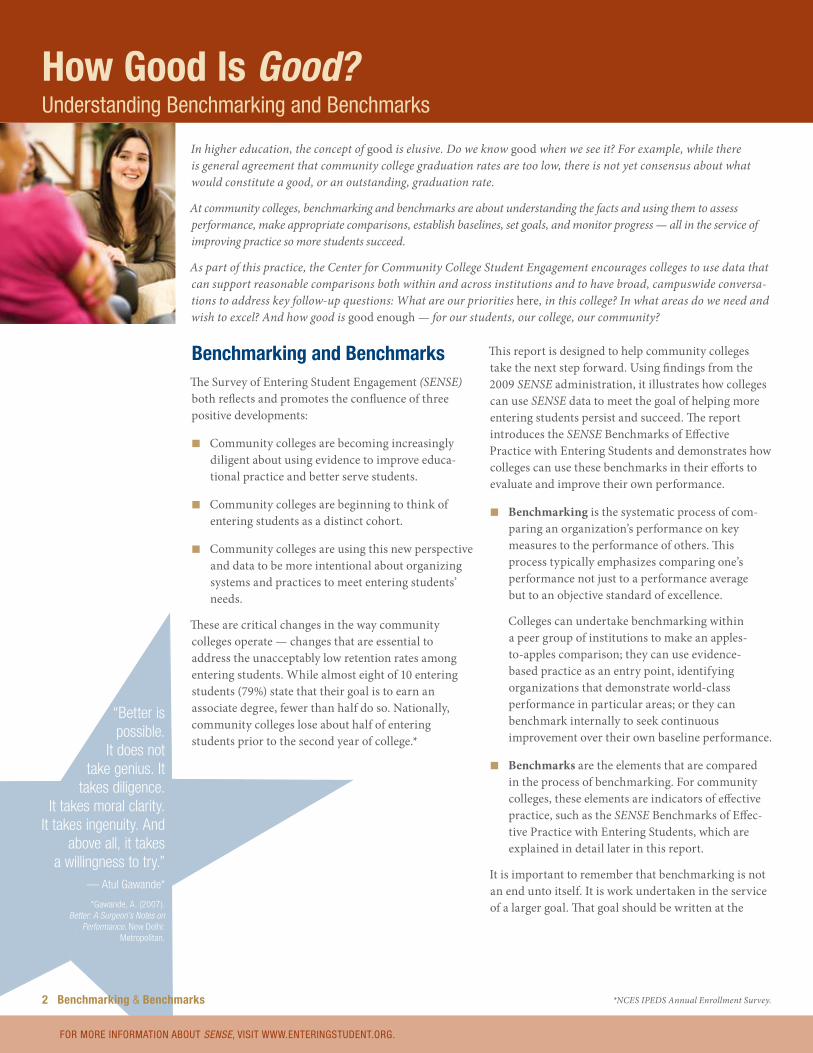
In higher education, the concept of good is elusive. Do we know good when we see it? For example, while there is general agreement that community college graduation rates are too low, there is not yet consensus about what would constitute a good, or an outstanding, graduation rate.
At community colleges, benchmarking and benchmarks are about understanding the facts and using them to assess performance, make appropriate comparisons, establish baselines, set goals, and monitor progress — all in the service of improving practice so more students succeed.
As part of this practice, the Center for Community College Student Engagement encourages colleges to use data that can support reasonable comparisons both within and across institutions and to have broad, campuswide conversa-tions to address key follow-up questions: What are our priorities here, in this college? In what areas do we need and wish to excel? And how good is good enough — for our students, our college, our community?
How Good Is Good?Understanding Benchmarking and Benchmarks
“Better is possible.
It does not take genius. It
takes diligence. It takes moral clarity.
It takes ingenuity. And above all, it takes
a willingness to try.” — Atul Gawande*
*Gawande, A. (2007). Better: A Surgeon’s Notes on
Performance. New Delhi: Metropolitan.
For morE inFormATion ABoUT SENSE, viSiT www.EnTEringSTUdEnT.org.
2 Benchmarking & Benchmarks *NCES IPEDS Annual Enrollment Survey.
This report is designed to help community colleges take the next step forward. Using findings from the 2009 SENSE administration, it illustrates how colleges can use SENSE data to meet the goal of helping more entering students persist and succeed. The report introduces the SENSE Benchmarks of Effective Practice with Entering Students and demonstrates how colleges can use these benchmarks in their efforts to evaluate and improve their own performance.
n Benchmarking is the systematic process of com-paring an organization’s performance on key measures to the performance of others. This process typically emphasizes comparing one’s performance not just to a performance average but to an objective standard of excellence.
Colleges can undertake benchmarking within a peer group of institutions to make an apples-to-apples comparison; they can use evidence-based practice as an entry point, identifying organizations that demonstrate world-class performance in particular areas; or they can benchmark internally to seek continuous improvement over their own baseline performance.
n Benchmarks are the elements that are compared in the process of benchmarking. For community colleges, these elements are indicators of effective practice, such as the SENSE Benchmarks of Effec-tive Practice with Entering Students, which are explained in detail later in this report.
It is important to remember that benchmarking is not an end unto itself. It is work undertaken in the service of a larger goal. That goal should be written at the
Benchmarking and BenchmarksThe Survey of Entering Student Engagement (SENSE) both reflects and promotes the confluence of three positive developments:
n Community colleges are becoming increasingly diligent about using evidence to improve educa-tional practice and better serve students.
n Community colleges are beginning to think of entering students as a distinct cohort.
n Community colleges are using this new perspective and data to be more intentional about organizing systems and practices to meet entering students’ needs.
These are critical changes in the way community colleges operate — changes that are essential to address the unacceptably low retention rates among entering students. While almost eight of 10 entering students (79%) state that their goal is to earn an associate degree, fewer than half do so. Nationally, community colleges lose about half of entering students prior to the second year of college.*
Effective Practice with Entering Students 3
top of every plan and stated at the beginning of every meeting. It should be the driving force behind every decision related to improvement efforts.
In business, achievement is measured in dollars. The overarching goal is improving the bottom line, and every employee knows it.
While financial stewardship is essential for commu-nity colleges, it is a means to an end. For community colleges, the overarching goal is increasing student success as measured by student learning; course completion and retention rates; and the rate at which students earn credentials, graduate, and/or transfer to four-year institutions. The goal of student success should be firmly rooted in community college practice
— as deeply ingrained, as unquestionably obvious, as the ultimate goal of increasing profits is in business.
Why Benchmark? There is a growing body of evidence about the practices that effectively improve outcomes at community colleges. More and more community colleges are undertaking the courageous work of benchmarking to help them maximize the value of this evidence and improve their practice so they can better serve their students.
Benchmarking helps colleges in multiple ways. It gives colleges:
n A process for establishing baselines, setting goals, and measuring progress toward those goals.
n A method to gauge and monitor their performance in areas central to their missions and goals.
n A means of answering the question of how their performance compares to the national average — and a reminder to ask whether that average is good enough.
As a result, benchmarking provides a basis for colleges to set priorities. Given the scarcity of resources and the large number of programs and practices colleges manage, they have to determine the best uses for their limited resources. Benchmarking helps colleges learn about practices that are effective in the field so they can devote resources to programs that are most likely to help the greatest number of students.
For morE inFormATion ABoUT SENSE, viSiT www.EnTEringSTUdEnT.org.
Benchmarking also creates opportunities for col-leges to share information and promising practices with other colleges that are committed to collecting and learning from data. When colleges participate together in programs designed to facilitate this kind of information exchange, they typically report that every institution, including the high-performing colleges, benefits from the interaction.
Finally, benchmarking sets the stage for colleges to ask and answer questions that will improve their prac-tice and help more students succeed. When a college benchmarks for student success, the process leads administrators, faculty, and staff to ask:
n How well are we doing compared with other col-leges that are similar to us? In this context, similar can refer to enrollment, setting (urban, suburban, or rural), institutional mission, demographics of the student body, makeup of the faculty, and so on.
n How are we doing over time? What approaches are working and should be scaled up? What should we stop doing?
n How are colleges that face similar challenges achieving better results? What can we learn from them? How can we adapt their approaches to work at our college?
n How good do we want to be? What metrics and standards should we use to define excellence in the areas most central to fulfilling our mission?
What Are Benchmark Scores?Benchmarks are groups of conceptually related items that address key areas of student engagement. The SENSE benchmarks denote areas that educational research has shown to be important to entering students’ college experiences and educational outcomes, and thus they provide useful ways to look at each college’s performance in these areas. Every college has a score for each benchmark. Each individual benchmark score is computed by averaging the scores on survey items that compose that benchmark.
SENSE benchmark scores are standardized so that the mean — the average of all participating students — always is 50 and the standard deviation is 25. One valuable use of benchmarks is to see an individual college’s deviation from the mean, and the standardized score provides an easy way to assess whether an individual college is performing above or below the mean (50) on each benchmark. The standardized scores make it possible for colleges to compare their own performance across benchmarks and to compare their own performance with groups of similar colleges.
For information about how the benchmark scores are calculated, visit www.enteringstudent.org.
The SENSE Benchmarks of Effective Practice with Entering Students
The SENSE benchmarks are groups of conceptually related survey items that address key areas of student engagement. The six SENSE benchmarks reflect critical elements of engagement for entering students.
Ideally, colleges engage entering students in all six benchmark areas, beginning with a student’s first contact with the institution — which could happen months before he or she begins classes — and continuing through completion of the first weeks of the initial academic term. This time is decisive because current research indicates that helping students succeed through the equivalent of the first semester (12–15 credit hours) can dramatically improve subsequent success, including completing courses and earning certificates and degrees.
While many of the student behaviors and institutional practices measured by the benchmarks can and should continue throughout students’ college careers, the SENSE items and the resulting data focus on this criti-cal entering student timeframe.
The SENSE Benchmarks of Effective Practice with Entering Students are early connections, high expectations and aspirations, clear academic plan and pathway, effective track to college readiness, engaged learning, and academic and social support network. Following are brief descriptions of each benchmark along with a list of the survey items that compose it. Examples of key findings related to the benchmark illustrate the kinds of actionable information that can be used in the benchmarking and improvement process, while student voices from the Initiative on Student Success provide context.
Early ConnectionsWhen students describe their early college experiences, they typically reflect on occasions when they felt discouraged or thought about dropping out. Their reasons for persisting almost always include one common element: a strong, early connection to someone at the college. The following five items constitute this benchmark:
Thinking about your experiences from the time of your decision to attend this college through the end of the first three weeks of your first semester or quarter, respond to each item (using a five-point scale from strongly agree to strongly disagree):
n The very first time I came to this college I felt welcome
n The college provided me with adequate information about financial assistance (scholarships, grants, loans, etc.)
n A college staff member helped me determine whether I
qualified for financial assistance
n At least one college staff member (other than an instructor) learned my name
Thinking about your experiences from the time of your decision to attend this college through the end of the first three weeks of your first semester or quarter, respond (answering yes or no):
n A specific person was assigned to me so I could see him/her each time I needed information or assistance
Key FindingsThe majority of entering students say they felt welcome at college, but smaller percentages of students report that they received information and support that is critical for their success.
n Nearly three-quarters of respondents (72%) agree or strongly agree that they felt welcome the first time they came to their colleges. However, 25% express no opinion on this item (neutral) — a response that might prompt both curiosity and concern.
n Almost half of respondents (49%) agree or strongly agree that their colleges provided them with adequate information about financial assistance, while 25% disagree or strongly disagree.
For morE inFormATion ABoUT SENSE, viSiT www.EnTEringSTUdEnT.org.
4 Benchmarking & Benchmarks

“I’ve been continuously making trips back and forth [to financial aid] … If they had told me everything I needed in the first place, it would have gone a lot smoother.” — Female student
n One-third of respondents (33%) agree or strongly agree that a college staff member helped them determine whether they qualified for financial assistance, while 40% disagree or strongly disagree.
n Less than half of respondents (45%) agree or strongly agree that at least one college staff member (other than an instructor) learned their names, compared with 37% who disagree or strongly disagree.
n Less than a quarter of students (23%) say that a specific person was assigned to them so they could see that person each time they needed information or assistance.
In Initiative on Student Success focus groups, students often remark about the friendliness of their campuses, and they consistently talk about the value of approach-ing new students and making them feel welcome. Yet comments about advising indicate that students also want their colleges to make greater efforts to establish ongoing relationships.
For example, one group of students recommends that colleges assign a specific counselor to each student. Says one student, “If you go to a counselor, you tell them everything, and if the next day you go to a dif-ferent counselor, you have to tell them the same thing, and it’s just a waste of time. So we figured if you have a counselor assigned to you, they know you and know what you’re doing and what problems you’re having.”
While these one-on-one relationships are invaluable, some colleges also establish and maintain meaningful,
long-term connections in group settings, such as an advisor working consistently with a group of students in a learning community or a student success course. One student reports, “Last quarter, a counselor came to my learning community. He taught me how to man-age my time; he taught us how to focus.” This approach has the added benefit of promoting interaction among the students.
Effective Practice with Entering Students 5
For morE inFormATion ABoUT SENSE, viSiT www.EnTEringSTUdEnT.org.
Key Findings for Early ConnectionsThinking about your experiences from the time of your decision to attend this college through the end of the first three weeks of your first semester or quarter, respond to each item (using a five-point scale from strongly agree to strongly disagree):
The very first time I came to this college I felt welcome
72%
The college provided me with adequate information about financial assistance49%
A college staff member helped me determine whether I qualified for financial assistance33%
At least one college staff member (other than an instructor) learned my name45%
0 20 40 60 80 100
Percentage of entering students who agree or strongly agree
Source: 2009 SENSE data.
SENSE: Quantitative and Qualitative DataThe Center for Community College Student Engagement uses two approaches to better understand the early college experiences of entering students: the SENSE survey, which provides detailed quantitative data; and the Initiative on Student Success, which provides qualitative data.
The SENSE survey is administered during the fourth and fifth weeks of the fall academic term in randomly selected courses chosen from those most likely to enroll entering students. The survey asks students about institutional practices and student behaviors — those that research indicates are associated with improved student success — during the early weeks of college. SENSE includes both the core survey, which is the same from year to year, plus several optional special-focus item modules. Each special-focus module delves deeply into a key issue related to entering student engagement. The 2009 administration included four special-focus modules — Commitment and Support, Engagement through Technology, Financial Assistance, and Student Success Courses. Participating colleges chose to include zero, one, or two modules in the survey of their students.
The Initiative on Student Success, supported by Houston Endowment Inc. and the MetLife Foundation, conducts qualitative research about the entering student experience. Through focus groups and interviews at select colleges, the Initiative on Student Success gathers the perspectives of new students, as well as faculty, student services professionals, and presidents, to paint a more complete picture of the entering student experience.
SENSE’s rich survey data help colleges better understand what is happening. Data from the focus groups and interviews can help them begin to figure out why. Throughout this report, qualitative findings are used to enrich understanding of the quantitative data.
For morE inFormATion ABoUT SENSE, viSiT www.EnTEringSTUdEnT.org.For morE inFormATion ABoUT SENSE, viSiT www.EnTEringSTUdEnT.org.
“I certainly hope it gets
better for me because I really do want to be in
college and get some more education — but
wow, it is so hard.”
— Female student
With regard to financial aid planning and assistance, students report disparate experiences. One student says, “I didn’t just pick up a form. The advisor helped me; she walked me through a plan for financial aid, and I got approved.” By contrast, another stu-dent recalls, “They didn’t tell me about financial aid options. They basically just told me, ‘Here’s how much you have to pay.’”
Many students also express frustration about long waiting times for financial aid assistance. One typical comment: “Every time I went to the financial aid office, it was overflowing. It was a two-hour wait to even talk to financial aid. You just can’t sit in an office for two and a half hours to talk to someone.”
Colleges making Early ConnectionsKilgore College (TX) began redesigning student orientation after reviewing unenthusiastic student evaluations. Then, SENSE data revealed that fewer than 30% of entering students believed any staff member other than their instructors knew their names. Armed with these data and with strategies developed at the Entering Student Success Institute (see page 22), the college abandoned plans to introduce online orientation and instead adopted a high-touch orientation that emphasized interaction with faculty and staff. A staff member who gives each student his or her contact information, along with two current students, conducts orientation in groups of 25. To help students with individualized degree planning, Kilgore doubled the number of faculty advisors available during orientation.
The Welcome to Campus program at Johnson County Community College (KS) encourages staff members to help new students feel welcome. Participating employees —including the president — commit to calling entering students the week before classes begin and to wearing special T-shirts while greeting students from 7:30 a.m. to the start of evening classes
at 6:00 p.m. for at least the first two class days. Employees are positioned in high-traffic areas to give students necessary information. In spring 2010, approximately 160 employees participated in the program.
After reviewing data from SENSE, CCSSE, and other surveys, as well as meeting with key stakeholders, Ivy Tech Community College-Central Indiana (IN) identified key pieces of information that many students did not know on their first day of college. This infor-mation is now included in a mandatory orientation for all first-time students. At the end of the orientation, participants are assessed to determine their ability to apply the new information. The assessment asks, for example, whether students can explain the financial aid process to a friend, whether they understand their placement test results and how those results influence course selection, and whether they know exactly what they need to accomplish before classes start.
High Expectations and AspirationsNearly all students arrive at their community colleges intending to succeed and believing that they have the motivation to do so. When entering students perceive clear, high expectations from college staff and faculty, they are more likely to understand what it takes to be successful and adopt behaviors that lead to achievement. Students then often rise to meet expectations, making it more likely that they will attain their goals. Often, students’ aspirations also climb, and they seek more advanced credentials than they originally envisioned. The following seven items constitute this benchmark:
Thinking about your experiences from the time of your decision to attend this college through the end of the first three weeks of your first semester or quarter, respond to each item (using a five-point scale from strongly agree to strongly disagree):
6 Benchmarking & Benchmarks
For morE inFormATion ABoUT SENSE, viSiT www.EnTEringSTUdEnT.org.
For morE inFormATion ABoUT SENSE, viSiT www.EnTEringSTUdEnT.org.For morE inFormATion ABoUT SENSE, viSiT www.EnTEringSTUdEnT.org.
Effective Practice with Entering Students 7
*Male respondents who described themselves as American Indian or Native American; Native Hawaiian; Black or African American, Non-Hispanic; Hispanic, Latino, or Spanish; or Other.
n The instructors at this college want me to succeed
n I have the motivation to do what it takes to succeed in college
n I am prepared academically to succeed in college
During the first three weeks of your first semester or quarter at this college, how often did you:
n Turn in an assignment late
n Not turn in an assignment
n Come to class without completing readings or assignments
n Skip class
Key FindingsEntering students say they have high motivation and strong preparation, but students’ reports of their first three weeks of college indicate that many are adopting behaviors that do not lead to success.
n Nine of ten students (90%) agree or strongly agree that they have the motivation to do what it takes to succeed in college.
n Most respondents (85%) believe (agree or strongly agree) that they are prepared academically to suc-ceed in college.
n More than three-quarters of respondents (87%) agree or strongly agree that the instructors at their colleges want them to succeed.
n Almost one-quarter (24%) report that they did not turn in an assignment at least once, while one-third of respondents (33%) say they turned in an assignment late at least once.
n Many respondents (43%) report coming to class without completing readings or assignments at least once.
n One-quarter (25%) report skipping class one or more times, and 8% report skipping class two or more times within the first three weeks.
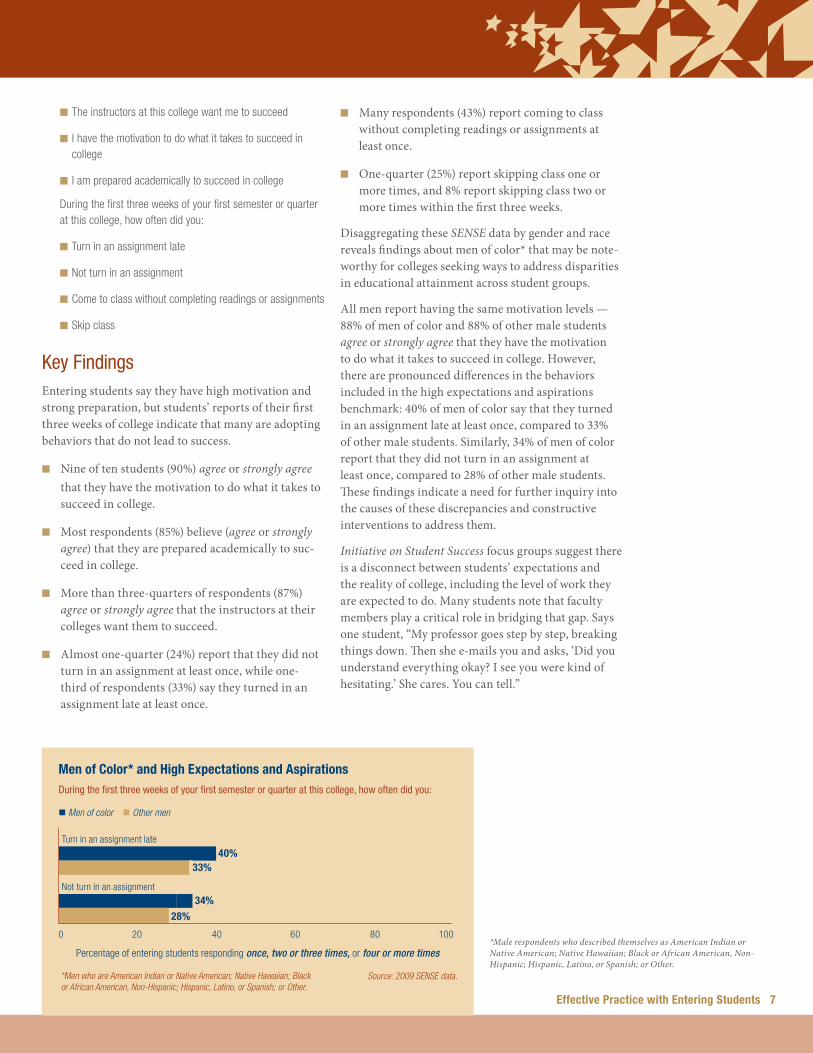
Disaggregating these SENSE data by gender and race reveals findings about men of color* that may be note-worthy for colleges seeking ways to address disparities in educational attainment across student groups.
All men report having the same motivation levels — 88% of men of color and 88% of other male students agree or strongly agree that they have the motivation to do what it takes to succeed in college. However, there are pronounced differences in the behaviors included in the high expectations and aspirations benchmark: 40% of men of color say that they turned in an assignment late at least once, compared to 33% of other male students. Similarly, 34% of men of color report that they did not turn in an assignment at least once, compared to 28% of other male students. These findings indicate a need for further inquiry into the causes of these discrepancies and constructive interventions to address them.
Initiative on Student Success focus groups suggest there is a disconnect between students’ expectations and the reality of college, including the level of work they are expected to do. Many students note that faculty members play a critical role in bridging that gap. Says one student, “My professor goes step by step, breaking things down. Then she e-mails you and asks, ‘Did you understand everything okay? I see you were kind of hesitating.’ She cares. You can tell.”
For morE inFormATion ABoUT SENSE, viSiT www.EnTEringSTUdEnT.org.
Men of Color* and High Expectations and Aspirationsduring the first three weeks of your first semester or quarter at this college, how often did you:
n Men of color n Other men
Turn in an assignment late
40%33%
Not turn in an assignment34%
28%
0 20 40 60 80 100
Percentage of entering students responding once, two or three times, or four or more times
Source: 2009 SENSE data.*Men who are American Indian or Native American; Native Hawaiian; Black or African American, Non-Hispanic; Hispanic, Latino, or Spanish; or Other.
For morE inFormATion ABoUT SENSE, viSiT www.EnTEringSTUdEnT.org.For morE inFormATion ABoUT SENSE, viSiT www.EnTEringSTUdEnT.org.
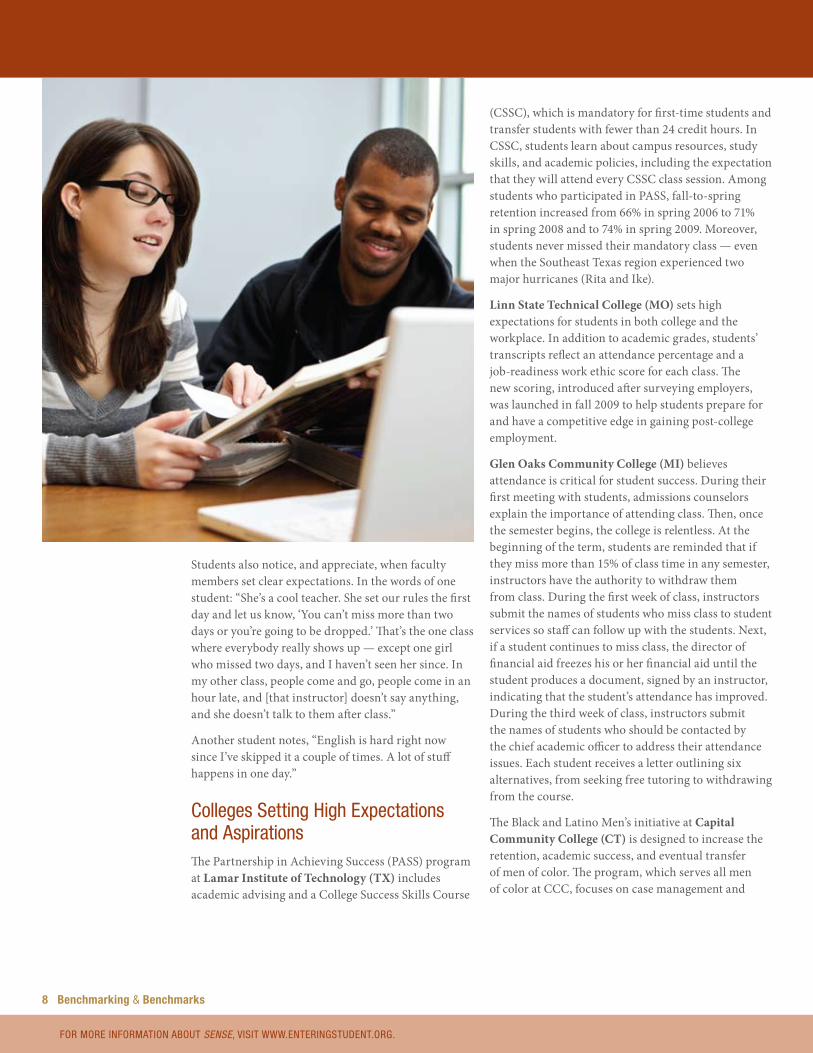
Students also notice, and appreciate, when faculty members set clear expectations. In the words of one student: “She’s a cool teacher. She set our rules the first day and let us know, ‘You can’t miss more than two days or you’re going to be dropped.’ That’s the one class where everybody really shows up — except one girl who missed two days, and I haven’t seen her since. In my other class, people come and go, people come in an hour late, and [that instructor] doesn’t say anything, and she doesn’t talk to them after class.”
Another student notes, “English is hard right now since I’ve skipped it a couple of times. A lot of stuff happens in one day.”
Colleges Setting High Expectations and AspirationsThe Partnership in Achieving Success (PASS) program at Lamar Institute of Technology (TX) includes academic advising and a College Success Skills Course
(CSSC), which is mandatory for first-time students and transfer students with fewer than 24 credit hours. In CSSC, students learn about campus resources, study skills, and academic policies, including the expectation that they will attend every CSSC class session. Among students who participated in PASS, fall-to-spring retention increased from 66% in spring 2006 to 71% in spring 2008 and to 74% in spring 2009. Moreover, students never missed their mandatory class — even when the Southeast Texas region experienced two major hurricanes (Rita and Ike).
Linn State Technical College (MO) sets high expectations for students in both college and the workplace. In addition to academic grades, students’ transcripts reflect an attendance percentage and a job-readiness work ethic score for each class. The new scoring, introduced after surveying employers, was launched in fall 2009 to help students prepare for and have a competitive edge in gaining post-college employment.
Glen Oaks Community College (MI) believes attendance is critical for student success. During their first meeting with students, admissions counselors explain the importance of attending class. Then, once the semester begins, the college is relentless. At the beginning of the term, students are reminded that if they miss more than 15% of class time in any semester, instructors have the authority to withdraw them from class. During the first week of class, instructors submit the names of students who miss class to student services so staff can follow up with the students. Next, if a student continues to miss class, the director of financial aid freezes his or her financial aid until the student produces a document, signed by an instructor, indicating that the student’s attendance has improved. During the third week of class, instructors submit the names of students who should be contacted by the chief academic officer to address their attendance issues. Each student receives a letter outlining six alternatives, from seeking free tutoring to withdrawing from the course.
The Black and Latino Men’s initiative at Capital Community College (CT) is designed to increase the retention, academic success, and eventual transfer of men of color. The program, which serves all men of color at CCC, focuses on case management and
For morE inFormATion ABoUT SENSE, viSiT www.EnTEringSTUdEnT.org.
8 Benchmarking & Benchmarks
For morE inFormATion ABoUT SENSE, viSiT www.EnTEringSTUdEnT.org.For morE inFormATion ABoUT SENSE, viSiT www.EnTEringSTUdEnT.org.
“She told me what I needed to do to accomplish my goals and what she thought would be in my best interest to take … She gave me food for thought.”
— Male student
tutoring in mathematics and language arts as well as culture (highlighting male figures), academics, advising, counseling, and college support services. Fall-to-spring retention of African-American males increased from a baseline of 61% in 2006 to 70% in spring 2009. Fall-to-spring retention of Hispanic males increased from 61% to 67% in the same time period.
In January 2009, Technical College of the Lowcountry (SC) introduced Promoting Integrity, Leadership, Academics, and cultural Understanding (PILAU) to focus on recruiting, retaining, and encouraging the academic success of African-American men. Through tutors and counselors, the program gives these students resources, support, and high expectations for character, perseverance, community service, personal growth, and leadership. The fall-to-fall retention rate for participants is 58%, compared to the typical annual retention rate of 30% for other African-American males at the college.
Clear Academic Plan and PathwayWhen a student, with knowledgeable assistance, creates a road map — one that shows where he or she is headed, what academic path to follow, and how long it will take to reach the end goal — that student has a critical tool for staying on track. Students are more likely to persist if they not only are advised about what courses to take but also are helped to set academic goals and to create a plan for achieving them. The following five items constitute this benchmark:
Thinking about your experiences from the time of your decision to attend this college through the end of the first three weeks of your first semester or quarter, respond to each item (using a five-point scale from strongly agree to strongly disagree):
n I was able to meet with an academic advisor at times convenient for me
Effective Practice with Entering Students 9
For morE inFormATion ABoUT SENSE, viSiT www.EnTEringSTUdEnT.org.
n An advisor helped me to identify the courses I needed to take during my first semester/quarter
n An advisor helped me to select a course of study, program, or major
n An advisor helped me to set academic goals and to create a plan for achieving them
n A college staff member talked with me about my commitments outside of school (work, children, dependents, etc.) to help me figure out how many courses to take
Key FindingsThe majority of entering students report that they had contact with an advisor, but a smaller percentage say they had help setting academic goals and developing plans.
n Close to two-thirds (61%) of entering student respondents agree or strongly agree that they were able to meet with an academic advisor at times convenient for them.
n Seven in 10 (70%) agree or strongly agree that an advisor helped them identify the courses they needed to take during their first semester/quarter.
n Six in 10 (60%) agree or strongly agree that an advi-sor helped them select a course of study, program, or major.
n Nearly one-third (31%) disagree or strongly disagree that an advisor helped them set academic goals and create a plan for achieving them.
n Almost half (48%) disagree or strongly disagree that a college staff member talked with them about their commitments outside of school to help them figure out how many courses to take.
For morE inFormATion ABoUT SENSE, viSiT www.EnTEringSTUdEnT.org.
10 Benchmarking & Benchmarks
For morE inFormATion ABoUT SENSE, viSiT www.EnTEringSTUdEnT.org.
Students’ comments in Initiative on Student Success focus groups indicate that the quality of advising varies. For example, in the words of one student, “The counselors made it very personal. Not only did they tell you what classes were good for you; they told you what classes would help you for your major and would help you transfer.”
By contrast, another student says of an advisor, “He basically just gave me a paper with the core curriculum and said, ‘Pick the ones you want to take.’ That wasn’t very helpful because if I knew what classes to take, I would just get it done on my own.”
Some students emphasize that they want to know which degrees will help them get a job when they graduate and the most direct path to earning those degrees. Students in one focus group generated specific questions for their advisors: “Let us know the numbers. What degrees lead to the best job? What degree should I take to have the best career? Do they actually get careers after they get that kind of degree instead of just sitting on their degree until the next minimum-wage job comes along?”
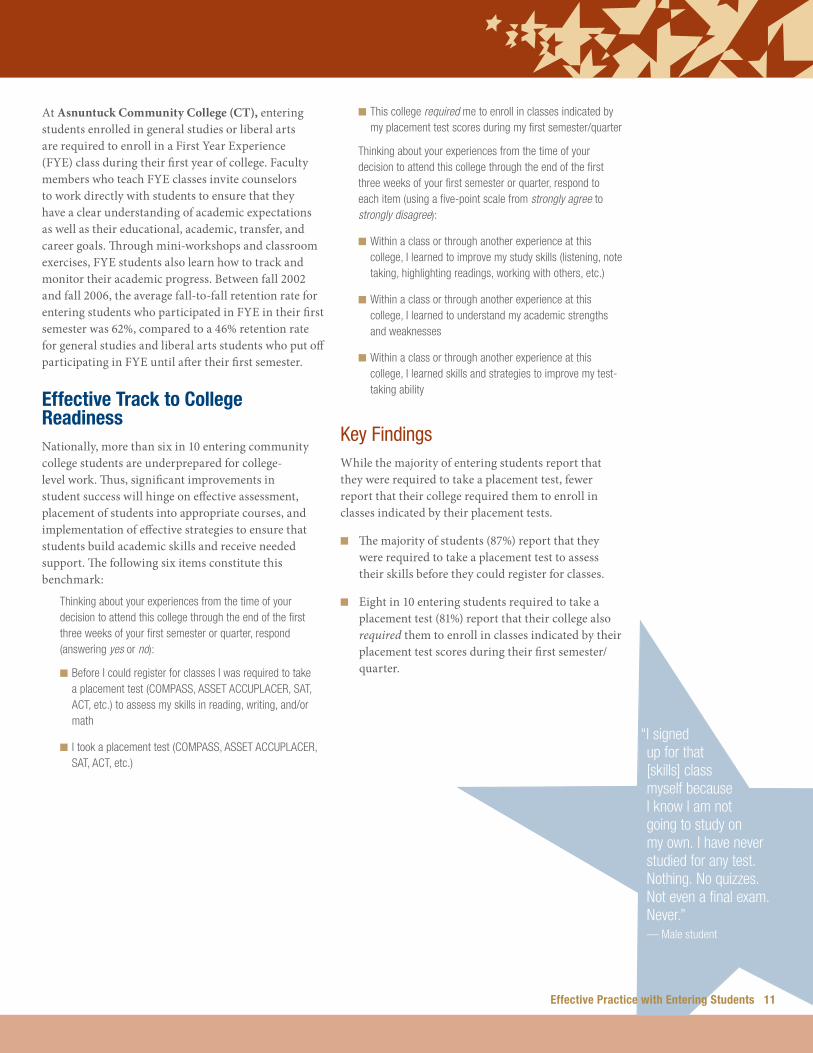
Colleges Creating a Clear Academic Plan and PathwayTo help general studies and transfer students set and refine goals early in their academic careers, Quinebaug Valley Community College (CT) moved advising for these students into the college’s Career Center. With this change, career information has become an integral part of students’ work to formulate their courses of study. In addition, faculty members advise students in the Career Center with the guidance and support of advisors and career counselors. Preliminary data show a 20% increase in semester-to-semester retention and an 8% increase in fall-to-fall retention for the first cohort of students advised in the Career Center as compared to previous cohorts.
Phillips Community College of the University of Arkansas (AR) created its Student Success Pass to con-nect academic advising and planning to Pell grant and scholarship disbursements. The only way a student can get a success pass is to meet with his or her assigned advisor — and students must show their success passes to pick up their grant and scholarship checks. The color of the success pass is changed each semester to simplify tracking and to ensure that students contact their advisors every semester.
For morE inFormATion ABoUT SENSE, viSiT www.EnTEringSTUdEnT.org.
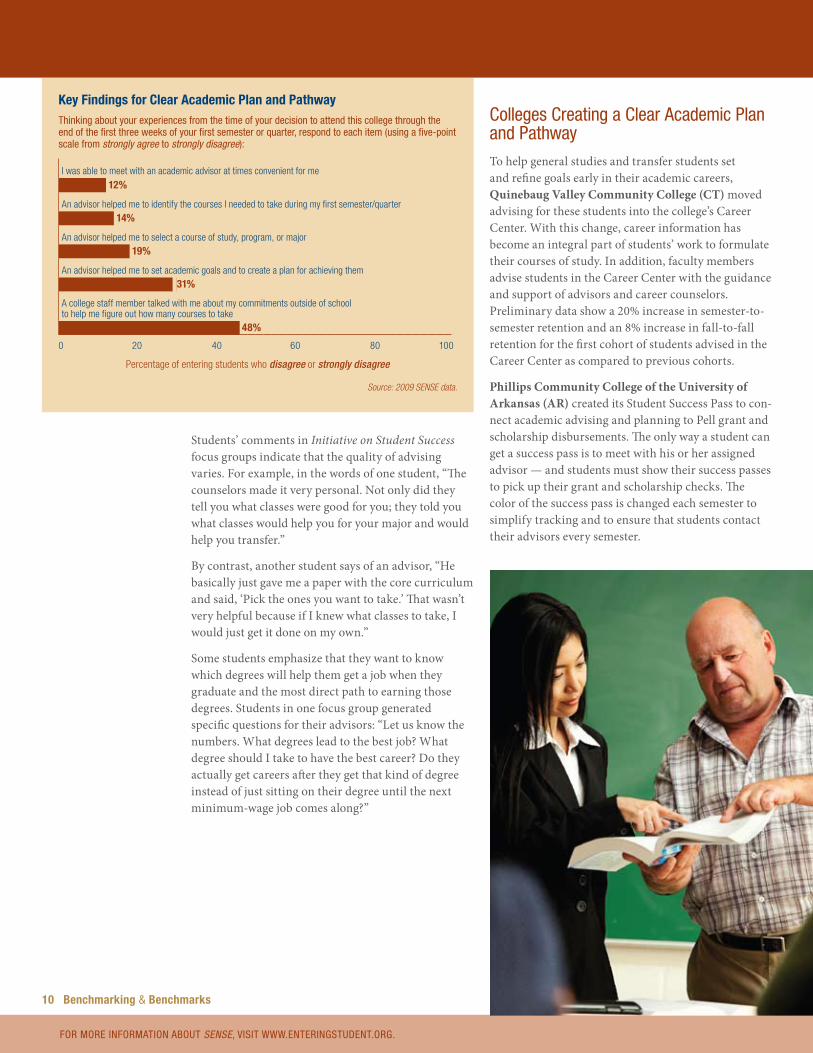
Key Findings for Clear Academic Plan and PathwayThinking about your experiences from the time of your decision to attend this college through the end of the first three weeks of your first semester or quarter, respond to each item (using a five-point scale from strongly agree to strongly disagree):
I was able to meet with an academic advisor at times convenient for me
12%
An advisor helped me to identify the courses I needed to take during my first semester/quarter14%
An advisor helped me to select a course of study, program, or major19%
An advisor helped me to set academic goals and to create a plan for achieving them31%
A college staff member talked with me about my commitments outside of school to help me figure out how many courses to take
48%
0 20 40 60 80 100
Percentage of entering students who disagree or strongly disagree
Source: 2009 SENSE data.
For morE inFormATion ABoUT SENSE, viSiT www.EnTEringSTUdEnT.org.For morE inFormATion ABoUT SENSE, viSiT www.EnTEringSTUdEnT.org.
At Asnuntuck Community College (CT), entering students enrolled in general studies or liberal arts are required to enroll in a First Year Experience (FYE) class during their first year of college. Faculty members who teach FYE classes invite counselors to work directly with students to ensure that they have a clear understanding of academic expectations as well as their educational, academic, transfer, and career goals. Through mini-workshops and classroom exercises, FYE students also learn how to track and monitor their academic progress. Between fall 2002 and fall 2006, the average fall-to-fall retention rate for entering students who participated in FYE in their first semester was 62%, compared to a 46% retention rate for general studies and liberal arts students who put off participating in FYE until after their first semester.
Effective Track to College ReadinessNationally, more than six in 10 entering community college students are underprepared for college-level work. Thus, significant improvements in student success will hinge on effective assessment, placement of students into appropriate courses, and implementation of effective strategies to ensure that students build academic skills and receive needed support. The following six items constitute this benchmark:
Thinking about your experiences from the time of your decision to attend this college through the end of the first three weeks of your first semester or quarter, respond (answering yes or no):
n Before I could register for classes I was required to take a placement test (COMPASS, ASSET ACCUPLACER, SAT, ACT, etc.) to assess my skills in reading, writing, and/or math
n I took a placement test (COMPASS, ASSET ACCUPLACER, SAT, ACT, etc.)
n This college required me to enroll in classes indicated by my placement test scores during my first semester/quarter
Thinking about your experiences from the time of your decision to attend this college through the end of the first three weeks of your first semester or quarter, respond to each item (using a five-point scale from strongly agree to strongly disagree):
n Within a class or through another experience at this college, I learned to improve my study skills (listening, note taking, highlighting readings, working with others, etc.)
n Within a class or through another experience at this college, I learned to understand my academic strengths and weaknesses
n Within a class or through another experience at this college, I learned skills and strategies to improve my test-taking ability
Key FindingsWhile the majority of entering students report that they were required to take a placement test, fewer report that their college required them to enroll in classes indicated by their placement tests.
n The majority of students (87%) report that they were required to take a placement test to assess their skills before they could register for classes.
n Eight in 10 entering students required to take a placement test (81%) report that their college also required them to enroll in classes indicated by their placement test scores during their first semester/quarter.
Effective Practice with Entering Students 11
For morE inFormATion ABoUT SENSE, viSiT www.EnTEringSTUdEnT.org.
“I signed up for that [skills] class myself because I know I am not going to study on my own. I have never studied for any test. Nothing. No quizzes. Not even a final exam. Never.”
— Male student
For morE inFormATion ABoUT SENSE, viSiT www.EnTEringSTUdEnT.org.For morE inFormATion ABoUT SENSE, viSiT www.EnTEringSTUdEnT.org.
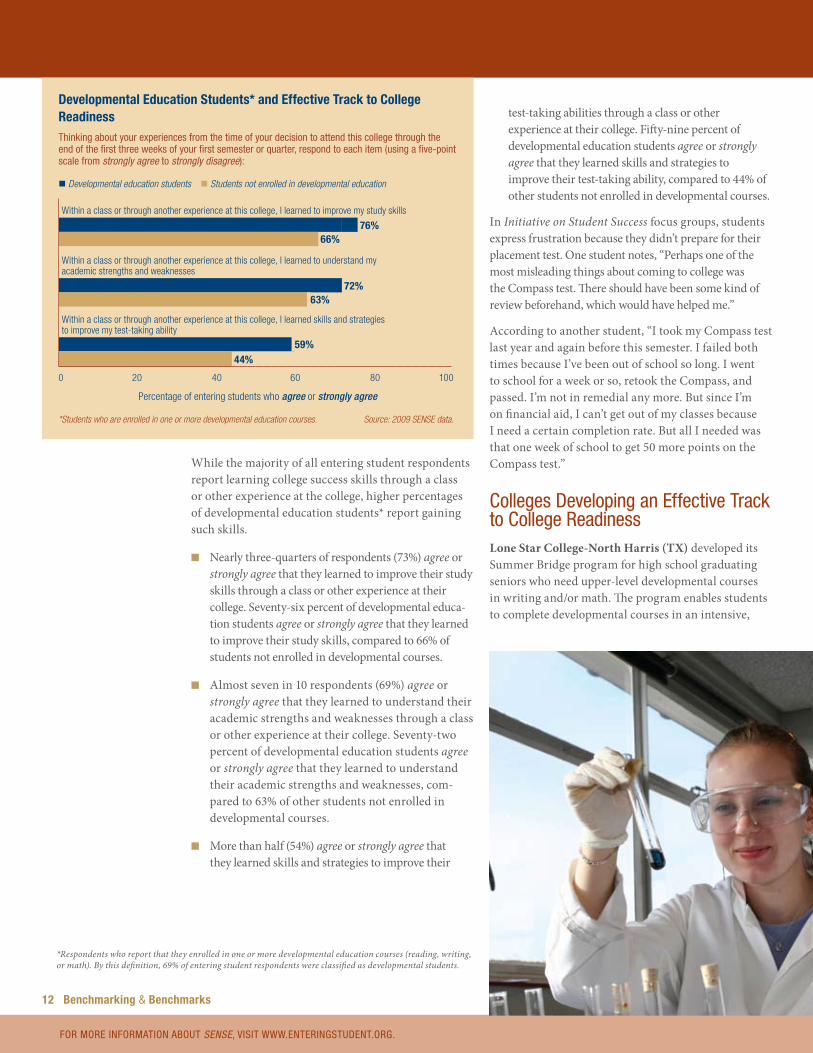
While the majority of all entering student respondents report learning college success skills through a class or other experience at the college, higher percentages of developmental education students* report gaining such skills.
n Nearly three-quarters of respondents (73%) agree or strongly agree that they learned to improve their study skills through a class or other experience at their college. Seventy-six percent of developmental educa-tion students agree or strongly agree that they learned to improve their study skills, compared to 66% of students not enrolled in developmental courses.
n Almost seven in 10 respondents (69%) agree or strongly agree that they learned to understand their academic strengths and weaknesses through a class or other experience at their college. Seventy-two percent of developmental education students agree or strongly agree that they learned to understand their academic strengths and weaknesses, com-pared to 63% of other students not enrolled in developmental courses.
n More than half (54%) agree or strongly agree that they learned skills and strategies to improve their
test-taking abilities through a class or other experience at their college. Fifty-nine percent of developmental education students agree or strongly agree that they learned skills and strategies to improve their test-taking ability, compared to 44% of other students not enrolled in developmental courses.
In Initiative on Student Success focus groups, students express frustration because they didn’t prepare for their placement test. One student notes, “Perhaps one of the most misleading things about coming to college was the Compass test. There should have been some kind of review beforehand, which would have helped me.”
According to another student, “I took my Compass test last year and again before this semester. I failed both times because I’ve been out of school so long. I went to school for a week or so, retook the Compass, and passed. I’m not in remedial any more. But since I’m on financial aid, I can’t get out of my classes because I need a certain completion rate. But all I needed was that one week of school to get 50 more points on the Compass test.”
Colleges developing an Effective Track to College readinessLone Star College-North Harris (TX) developed its Summer Bridge program for high school graduating seniors who need upper-level developmental courses in writing and/or math. The program enables students to complete developmental courses in an intensive,
12 Benchmarking & Benchmarks
For morE inFormATion ABoUT SENSE, viSiT www.EnTEringSTUdEnT.org.
Developmental Education Students* and Effective Track to College ReadinessThinking about your experiences from the time of your decision to attend this college through the end of the first three weeks of your first semester or quarter, respond to each item (using a five-point scale from strongly agree to strongly disagree):
n Developmental education students n Students not enrolled in developmental education
Within a class or through another experience at this college, I learned to improve my study skills
76%66%
Within a class or through another experience at this college, I learned to understand my academic strengths and weaknesses
72%63%
Within a class or through another experience at this college, I learned skills and strategies to improve my test-taking ability
59%44%
0 20 40 60 80 100
Percentage of entering students who agree or strongly agree
*Students who are enrolled in one or more developmental education courses. Source: 2009 SENSE data.
*Respondents who report that they enrolled in one or more developmental education courses (reading, writing, or math). By this definition, 69% of entering student respondents were classified as developmental students.
For morE inFormATion ABoUT SENSE, viSiT www.EnTEringSTUdEnT.org.For morE inFormATion ABoUT SENSE, viSiT www.EnTEringSTUdEnT.org.
“I swear, I don’t know how she does it. I don’t know how she can sit there and talk for an hour and 15 minutes. She just talks the entire time we’re in class. The entire time.” — Male student
15-day program so they can begin college-level courses in the fall, thus facilitating a smooth transition between high school and college. Summer Bridge students — who often are the first in their family to attend college — are recruited by a partnership of counselors working both at area high schools and the college. The program also links students to faculty or staff mentors when they arrive on campus. Textbooks are provided free of charge, and successful students receive $150 scholarships upon completion of the bridge program. The nine-year average completion rates (C or better) in Summer Bridge courses are 93% for English and 82% for math, whereas the overall retention rate for Bridge English students is 96% and for Bridge math students is 91%. The average GPA for the fall semester is 2.34, and the overall average re-enrollment rate for the spring semester is 87%. All these averages are much higher than the success, retention, and re-enrollment rates for comparable 16-week developmental courses.
The Hulu’ena model at Hawai’i Community College (HI) supports first-time Native-Hawaiian students who place into two or more developmental education areas. The college developed the program because Native-Hawaiian students fall below all other students on almost every measure of student performance, including successful completion of basic developmen-tal education classes, retention, persistence, transfer, and graduation. Hulu’ena requires enrollment in the appropriate developmental education class, a college
success course, and a Hawaiian culture class in a student’s first semester. Advising, counseling, and case management are mandatory, and each participant also receives tuition support for the first two semesters. Over the next three years, the college will measure the cohort’s rates of persistence and successful completion (C or better) of gatekeeper math and English classes, transfer to four-year degree programs, and graduation.
At Aims Community College (CO), developmental education students are required to take Advanced Academic Achievement (AAA), a class designed to help students develop basic study skills. Students who test into two or more developmental areas take a three-hour course. Students who test into only one developmental class take a one-hour course. The courses also are available to other students who choose to take them. Semester-to-semester retention rates for students who complete the AAA courses are 9% to 11% higher than those of the general student population.
Engaged LearningInstructional approaches that foster engaged learning are critical for student success. Because most community college students attend college part-time and most also must find ways to balance their studies with work and family responsibilities, the most effective learning experiences will be those the college intentionally designs. The following 16 items constitute this benchmark:
During the first three weeks of your first semester or quarter at this college, how often did you:
n Ask questions in class or contribute to class discussions
n Prepare at least two drafts of a paper or assignment before turning it in
n Participate in supplemental instruction (extra class sessions with an instructor, tutor, or experienced student)
For morE inFormATion ABoUT SENSE, viSiT www.EnTEringSTUdEnT.org.
Effective Practice with Entering Students 13

For morE inFormATion ABoUT SENSE, viSiT www.EnTEringSTUdEnT.org.
14 Benchmarking & Benchmarks
For morE inFormATion ABoUT SENSE, viSiT www.EnTEringSTUdEnT.org.
n Work with other students on a project or assignment during class
n Work with classmates outside of class on class projects or assignments
n Participate in a required study group outside of class
n Participate in a student-initiated (not required) study group outside of class
n Use an electronic tool (e-mail, text messaging, Facebook, MySpace, class website, etc.) to communicate with another student about coursework
n Use an electronic tool (e-mail, text messaging, Facebook, MySpace, class website, etc.) to communicate with an instructor about coursework
n Discuss an assignment or grade with an instructor
n Ask for help from an instructor regarding questions or problems related to a class
n Receive prompt written or oral feedback from instructors on your performance
n Discuss ideas from readings or classes with instructors outside of class
n Use face-to-face tutoring
n Use writing, math, or other skill lab
n Use computer lab
Key FindingsIn their first three weeks of college:
n 8% of students report that they never asked ques-tions in class or contributed to class discussions.
n 28% say they never prepared at least two drafts of a paper or assignment before turning it in.
n 69% report that they never participated in supple-mental instruction.
n 22% say they never worked with other students on a project or assignment during class.
n 68% say they never worked with classmates outside of class on class projects or assignments.
n 84% say they never participated in a required study group outside of class.
n 84% report that they never participated in a student-initiated (not required) study group outside of class.
n 49% say they never used an electronic tool (e-mail, text messaging, Facebook, MySpace, class website, etc.) to communicate with another student about coursework.
n 44% say they never used an electronic tool to com-municate with an instructor about coursework.
For morE inFormATion ABoUT SENSE, viSiT www.EnTEringSTUdEnT.org.
Key Findings for Engaged Learningduring the first three weeks of your first semester or quarter at this college, how often did you:
Ask questions in class or contribute to class discussions
8%
Prepare at least two drafts of a paper or assignment before turning it in
28%
Work with other students on a project or assignment during class
22%
Work with classmates outside of class on class projects or assignments
68%
Participate in a required study group outside of class
84%
Participate in a student-initiated (not required) study group outside of class
84%
Use an electronic tool to communicate with another student about coursework
49%
Use an electronic tool to communicate with an instructor about coursework
44%
Discuss an assignment or grade with an instructor
35%
Use face-to-face tutoring
84%
0 20 40 60 80 100
Percentage of entering students responding never
Source: 2009 SENSE data.
For morE inFormATion ABoUT SENSE, viSiT www.EnTEringSTUdEnT.org.For morE inFormATion ABoUT SENSE, viSiT www.EnTEringSTUdEnT.org.
n 35% say they never discussed an assignment or grade with an instructor.
n 25% say they never asked for help from an instructor regarding questions or problems related to a class.
n 27% say they never received prompt written or oral feedback from instructors on their performance.
n 68% report that they never discussed ideas from readings or classes with instructors outside of class.
n 84% report that they never used face-to-face tutoring.
n 65% say they never used writing, math, or other skill labs.
n 49% say they never used a computer lab.
Survey results for this benchmark underscore the difference in engagement of part-time and full-time students. For example, 73% of part-time students report that they never worked with classmates outside of class on class projects or assignments, compared to 61% of full-time students. Perhaps electronic communication could help engage students who spend less time on campus; however, SENSE results indicate that 55% of part-time students say they never used an electronic tool to communicate with another student about coursework, compared to 40% of full-time students; 48% of part-time students say they never used an electronic tool to communicate with an instructor about coursework, compared to 38% of full-time students.
Students in Initiative on Student Success focus groups prefer instructors and classes that use more engaged learning practices. For example, one student recalls a class in which the instructor “gave us a riddle and put us into groups to bring us closer as a class. We all clicked right away. We weren’t afraid to talk to each other and then we’d have a group discussion. Now people aren’t afraid to open up, and that’s great.”
Confirming the value of interventions that encourage interaction, another student adds, “I like whenever people are not afraid to talk to one another. I’m pretty sure in some classes there are kids that go without ever talking to that other kid across the classroom.”
In contrast, a student describing a lecture-based class says, “She’s a nice lady, a good teacher, but all that talking, it gets so boring after a while. And you know, it sucks because I don’t want to get tired, I want to listen, but I work late, and it’s not very lively.”
Colleges Promoting Engaged LearningEstrella Mountain Community College (AZ) created its student-to-student peer mentoring program to address low retention and persistence of academically underprepared students. Peer mentors serve as guides and role models assisting and supporting first-time students in their transition to college. The program was largely driven by students who wanted to help their peers. What emerged was a structured, purposeful mentoring program tied to a success course. Peer mentors work in collaboration with the counselor teaching the course, and the program mandates regular check-ins between mentor and mentee as well as small-group discussions about class work.
To provide additional engagement opportunities for first-time students, Kodiak College, University of Alaska Anchorage (AK), gives faculty and staff
Effective Practice with Entering Students 15
For morE inFormATion ABoUT SENSE, viSiT www.EnTEringSTUdEnT.org.
“She broke the class into groups. I just like this idea and even being forced to work with classmates. Bonds are made.” — Male student
For morE inFormATion ABoUT SENSE, viSiT www.EnTEringSTUdEnT.org.For morE inFormATion ABoUT SENSE, viSiT www.EnTEringSTUdEnT.org.
“One of the extra-credit
points on the first test was, ‘How many students’ first
names do you know in the class?’”
— Female student
members coaching assignments. Students meet with their coaches at least once each week to address their learning and social needs. Pilot data show that coaching has a positive influence on both GPA and persistence. Entering students who were coached achieved, on average, a half-point higher GPA and were retained fall-to-spring at a rate 24% higher than entering students who did not participate in coaching.
The Advisors in Residence (AIR) program at St. Philip’s College (TX) places full-time advisors within instructional departments. The 2008–09 fall-to-fall retention rate for students served by AIRs was 50%, compared to a 38% retention rate for students not served by AIRs. The AIR program began in spring 2003 with four full-time advisors serving 950 students. Today it has grown to 19 advisors serving 10,200 students each year.
Academic and Social Support NetworkStudents benefit from having a personal network that enables them to obtain information about college services along with the academic and social support critical to student success. Because entering students often don’t know what they don’t know, colleges must purposefully create those networks. The following seven items constitute this benchmark:
Thinking about your experiences from the time of your decision to attend this college through the end of the first three weeks of your first semester or quarter, respond to each item (using a five-point scale from strongly agree to strongly disagree):
n All instructors clearly explained academic and student support services available at this college
n All instructors clearly explained course grading policies
n All instructors clearly explained course syllabi (syllabuses)
n I knew how to get in touch with my instructors outside of class
n At least one other student whom I didn’t previously know learned my name
n At least one instructor learned my name
n I learned the name of at least one other student in most of my classes
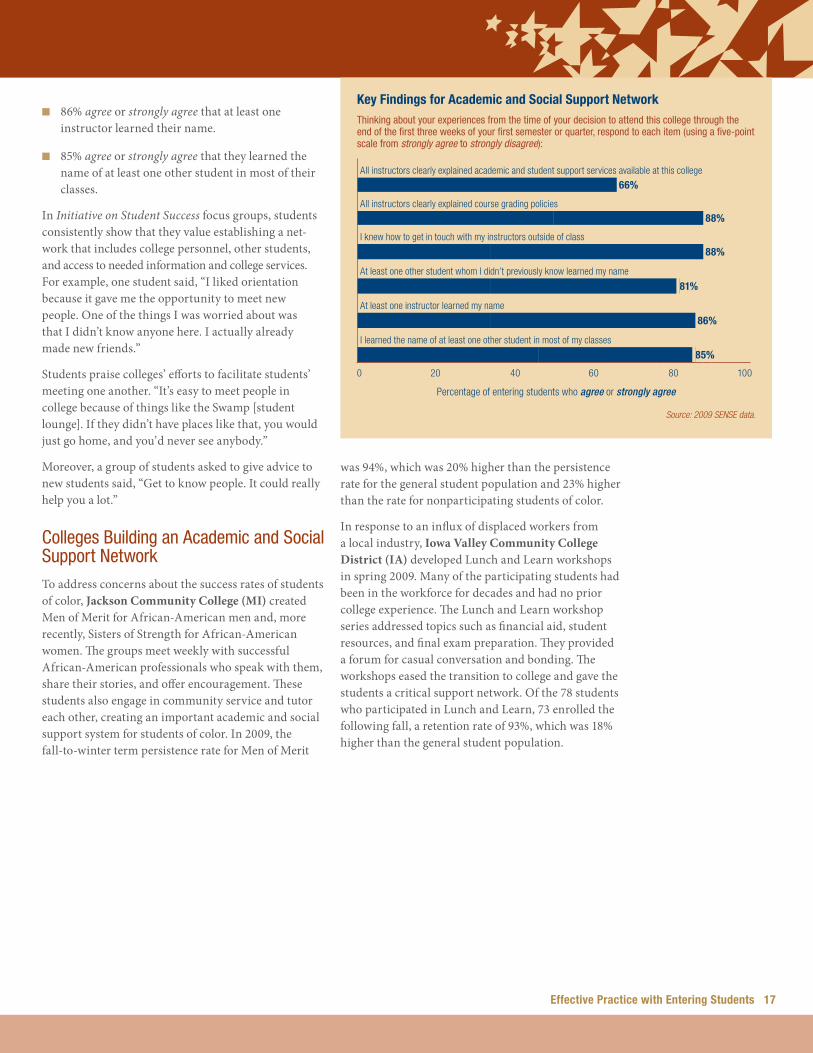
Key FindingsThe majority of students respond positively to these survey items, reflecting colleges’ efforts to build support networks. Still, there is evident room for improvement as institutions seek to ensure that all students get connected to the information, services, and people that can contribute significantly to their success.
n Two-thirds of respondents (66%) agree or strongly agree that all instructors clearly explained aca-demic and student support services available at their colleges.
n 88% agree or strongly agree that all instructors clearly explained course grading policies.
n 91% agree or strongly agree that all instructors clearly explained course syllabi.
n 88% agree or strongly agree that they knew how to get in touch with their instructors outside of class.
n 81% agree or strongly agree that at least one other student whom they didn’t previously know learned their name.
For morE inFormATion ABoUT SENSE, viSiT www.EnTEringSTUdEnT.org.
16 Benchmarking & Benchmarks
For morE inFormATion ABoUT SENSE, viSiT www.EnTEringSTUdEnT.org.For morE inFormATion ABoUT SENSE, viSiT www.EnTEringSTUdEnT.org.
Effective Practice with Entering Students 17
For morE inFormATion ABoUT SENSE, viSiT www.EnTEringSTUdEnT.org.
n 86% agree or strongly agree that at least one instructor learned their name.
n 85% agree or strongly agree that they learned the name of at least one other student in most of their classes.
In Initiative on Student Success focus groups, students consistently show that they value establishing a net-work that includes college personnel, other students, and access to needed information and college services. For example, one student said, “I liked orientation because it gave me the opportunity to meet new people. One of the things I was worried about was that I didn’t know anyone here. I actually already made new friends.”
Students praise colleges’ efforts to facilitate students’ meeting one another. “It’s easy to meet people in college because of things like the Swamp [student lounge]. If they didn’t have places like that, you would just go home, and you’d never see anybody.”
Moreover, a group of students asked to give advice to new students said, “Get to know people. It could really help you a lot.”
Colleges Building an Academic and Social Support networkTo address concerns about the success rates of students of color, Jackson Community College (MI) created Men of Merit for African-American men and, more recently, Sisters of Strength for African-American women. The groups meet weekly with successful African-American professionals who speak with them, share their stories, and offer encouragement. These students also engage in community service and tutor each other, creating an important academic and social support system for students of color. In 2009, the fall-to-winter term persistence rate for Men of Merit
was 94%, which was 20% higher than the persistence rate for the general student population and 23% higher than the rate for nonparticipating students of color.
In response to an influx of displaced workers from a local industry, Iowa Valley Community College District (IA) developed Lunch and Learn workshops in spring 2009. Many of the participating students had been in the workforce for decades and had no prior college experience. The Lunch and Learn workshop series addressed topics such as financial aid, student resources, and final exam preparation. They provided a forum for casual conversation and bonding. The workshops eased the transition to college and gave the students a critical support network. Of the 78 students who participated in Lunch and Learn, 73 enrolled the following fall, a retention rate of 93%, which was 18% higher than the general student population.
Key Findings for Academic and Social Support NetworkThinking about your experiences from the time of your decision to attend this college through the end of the first three weeks of your first semester or quarter, respond to each item (using a five-point scale from strongly agree to strongly disagree):
All instructors clearly explained academic and student support services available at this college
66%
All instructors clearly explained course grading policies
88%
I knew how to get in touch with my instructors outside of class
88%
At least one other student whom I didn’t previously know learned my name
81%
At least one instructor learned my name
86%
I learned the name of at least one other student in most of my classes
85%
0 20 40 60 80 100
Percentage of entering students who agree or strongly agree
Source: 2009 SENSE data.
For morE inFormATion ABoUT SENSE, viSiT www.EnTEringSTUdEnT.org.For morE inFormATion ABoUT SENSE, viSiT www.EnTEringSTUdEnT.org.
Digging Deeper: Exploring the DataThe SENSE online reporting system offers easy-to-use, point-and-click data reports as well as great flexibility in creating custom reports. Member colleges can answer a wide range of questions that help them make both external and internal comparisons. For example:
External Comparisonsn What are my college’s benchmark scores?
n How did my college perform relative to other colleges in my state? How do my college’s results compare to a custom peer group of my own choosing?
Internal Comparisonsn How can I look at the differences between traditional-age and nontraditional-age students on
all six SENSE benchmarks?
n How can I look at the differences between full-time and part-time developmental students on the effective track to college readiness benchmark?
Member colleges can access the SENSE online reporting system as well as interactive tutorials at www.enteringstudent.org (username and password required).
How to Benchmark An ongoing Cycle of improvement
Benchmarking is a powerful way to use data to improve performance. It relies on an ongoing cycle of gathering, analyzing, and using data: setting a goal, planning, implementing, evaluating, and then repeating the steps to continually refine practice. These steps include:
Put the benchmarking process in the context of your college’s strategic plan, the expression of your institution’s mission, vision, and values. What priorities have been identified? What issues are confronting your college? These may be defined broadly, such as placing a high value on equity in student outcomes, or narrowly, such as moving students more quickly through the developmental math sequence.
Engage many people in the benchmarking conversation. Involve members of your college community — faculty, staff, students — early in the process and encourage them to ask questions and provide feedback. Institutional improvement efforts are more effective when key groups identify areas of concern and participate in finding solutions.
Review and analyze the data:
n Start with the benchmarks. Benchmark scores highlight key areas of the entering student experience. Review your college’s benchmark scores, focusing most on those that best relate to the priorities identified in your strategic plan
or student success initiative. How does your college perform in each area relative to the other benchmarks? How does your college perform relative to the national average? To other colleges most like yours? To high-performing colleges?
n Look at individual survey items associated with the benchmarks. For each item, ask whether the college’s performance meets, exceeds, or falls short of expectations. Again, compare your college’s performance on specific items to the national average, to other colleges most like yours, and to high- performing colleges. Identify areas worthy of celebration and focus on educational practices, programs, and policies that may be in need of improvement.
n Disaggregate the data. Explore the data by race and ethnicity, age, enrollment status (full-time versus part-time), and gender to identify where students are having disparate experiences. Measure results for all students against results for your least-engaged groups. Do these findings confirm or refute your assumptions about the entering student experience at your college?
Look for themes and patterns. Add SENSE data to information you may have from other sources, such as student focus groups and cohort tracking. Taken together, they paint a picture of the entering student experience on your campus. Benchmark data provide a broad outline. Other quantitative data, such as findings from individual survey items, disaggregated findings, and cohort tracking data, fill in detail. Qualitative data, such as student input gathered in focus groups, add depth and texture. How do different types of data confirm each other or raise questions?
Determine what you need to know next. When people engage with data, they typically begin to raise questions that require further information. Clarify these questions, determine what additional data are needed, and plan how you will gather this information.
Assess the status quo and conduct a gap analysis. Once you have a clearer picture of the effectiveness of your college’s practices with entering students,
18 Benchmarking & Benchmarks
For morE inFormATion ABoUT SENSE, viSiT www.EnTEringSTUdEnT.org.For morE inFormATion ABoUT SENSE, viSiT www.EnTEringSTUdEnT.org.
Effective Practice with Entering Students 19
consider whether that performance is good enough. Where are you now compared with where you want to be? Discuss which promising practices should be expanded, which practices have potential and should be improved, and whether there are practices that should be discontinued. For example, if a well-implemented orientation increases entering student success, yet SENSE data indicate large numbers of entering students do not participate in an orientation, should your college require orientation for all entering students? If your college ostensibly requires academic advising for all entering students, yet many of your SENSE respondents indicate they never used academic advising, should the practice of waiving such requirements be discontinued?
Identify your top challenges and find colleges that are successfully addressing similar ones. When you know where you want to be, find out who is there already. Contact them, ask to review their data, visit them on-site, and learn from their experiences.
Set priorities for action and ground them in the realities of your college’s resources. Design strate-gies that address concerns and set targets for progress. Identify what steps can be taken by individuals, across departments, across the institution.
Share the data, your process, and your plans. As appropriate, engage a broad range of stakeholders including faculty and staff, students and their families, community members, business leaders, and policymakers.
Track progress over time. Compare the same survey items after each SENSE administration, track student cohorts, conduct student focus groups, and continue benchmarking.
Benchmarking in ActionFaculty and staff at Bowling Green Technical College (KY) regularly use data to make decisions about programming, services, and budgeting, with the college’s strategic plan providing context. Each year, BGTC’s employees and board update performance measures, examine institutional challenges, and set
goals for the next year. The college’s strategies for improvement — continually planning, implementing, and measuring — resulted in a very positive reaffirmation process with the Southern Association of Colleges and Schools Commission on Colleges.
Faculty members at Arkansas State University-Newport (AR) embraced the college’s electronic assessment data collection and submission tool. The tool supports the college’s effort to measure general education outcomes in four core competencies: communication, math, critical thinking, and technology. The college has a set of learning outcomes for each core competency. Faculty are required to measure these learning outcomes continuously in all courses and to submit relevant data each semester. The electronic tool speeds institution-wide data collection and facilitates internal benchmarking.
In fall 2009, Martin Community College (NC) held a Data Day workshop at which faculty reviewed data and established benchmark goals for institutional performance. After a four-hour discussion, the faculty determined that the college would focus on increasing student proficiency in reading, writing, and mathematics to the national average within three years. MCC students participate in assessment upon enrollment, again upon completion of 30 semester credit hours, and a third time at graduation. If at any time it is determined that reasonable progress is not being made, the faculty will identify interventions to improve student and institutional performance.
Ivy Tech Community College-Evansville (IN) engaged faculty and staff members in reviewing the college’s CCSSE results and brainstorming ways to improve student engagement. After a presentation of the data, small groups of faculty and staff worked together and then reported their ideas to the entire group. The college’s Learning Centered Team used these ideas to prepare a professional development schedule of 19 sessions related to the benchmarks and an additional 20 sessions on other topics taught by faculty and staff. A similar process will be used with the college’s SENSE results.

For morE inFormATion ABoUT SENSE, viSiT www.EnTEringSTUdEnT.org.
20 Benchmarking & Benchmarks
For morE inFormATion ABoUT SENSE, viSiT www.EnTEringSTUdEnT.org.
1. Losing sight of the overarching goal. The work of institutional change must be grounded in a mission of student success. Using student success measures — specifically the rates at which students successfully complete courses, persist semester to semester, earn credentials, graduate, and transfer to four-year institutions — as the cornerstone of improvement work provides an explicit guideline for setting priorities, allocating resources, and making other decisions.
2. Focusing exclusively on external comparisons. Benchmarking is fundamentally about improvement over time. Thus, the first order of business is to establish a baseline for your institution so that future performance can be compared to that starting place. Initial questions for campus discussion are Where are we now? Where do we aspire to be? How good is good enough? Then it is critical to examine further the differences in engagement within the institution: Are some student groups more engaged than others? Where are our apparent strengths? Where are the engagement gaps?
3. Settling for merely better than average. Performing as well as the national average or a peer-group average may be a reasonable initial aspiration, but it is important to recognize that these averages are sometimes unacceptably low. Even the top 10% may not be good enough. Aspiring to match and then exceed high-performance targets is the stronger strategy.
4. Failing to look behind the numbers. Completing the survey is just the beginning, followed by campus review and discussion of the results. But finding out what is behind the numbers — both on the home campus and at benchmark institutions — is essential to the improvement process. Looking internally, colleges can review disaggregated data and conduct student focus groups to build understanding of students’ experiences. To learn more about implementation of effective practice, benchmarking visits to high-performing colleges can be enlightening and productive.
5. Overlooking the opportunity to learn from others. High-performing community colleges are an invaluable resource for improvement. Seek out colleges that are successfully overcoming the challenges you face. Don’t hesitate to contact them, ask to review their data, visit them on-site, and learn.
6. Confusing benchmarking with ranking. College rankings may be popular, but they are statistically foolish. The Center opposes the use of survey data for ranking. Such uses obscure complex dimensions of institutional performance and student behavior. Benchmarking with SENSE allows comparison of a college’s performance to the performance of a peer group. SENSE and CCSSE data search tools provide for these types of comparisons, using aggregated data from at least three institutions.
7. Ignoring — or hiding behind — context. Data about community college quality and performance should be considered in the context of information about key college characteristics (mission, location, size, strategic priorities) and student demographics (enrollment status, risk factors). At the same time, the challenges inherent in the community college mission should not be used as excuses for poor performance. The better strategy is to benchmark: to identify opportunities for improvement and learn from similar institutions — those that serve a comparable student population, have equally constrained resources, and so on — that are implementing effective educational practices at scale.
8. Looking for someone to blame. Explaining poor performance by pointing to student deficiencies or faculty failures is always an unproductive detour from the path to institutional improvement. By contrast, a campuswide commitment to intellectual curiosity, rigorous inquiry, and a culture of evidence is consistent both with an academic mission and with the tenets of constructive institutional change.
9. Believing that small-scale success solves big-scale problems. Community colleges have committed themselves to some of the most difficult and important work in our society. Significant improvement in student learning, persistence, and degree attainment will not result from quick fixes, one-time interventions, or programs that benefit only small numbers of students. The significant challenge is for colleges to bring effective practice to scale, to make engaging student experiences the institutional norm rather than the exception.
10. Making everything (or nothing) a priority. Engaging the campus community with data that depict student experiences and institutional performance will raise many questions and prompt a plethora of ideas. But a process of constructive institutional change, particularly in a time of significant fiscal constraint, typically cannot involve doing everything all at once. The colleges that make progress on a student success agenda are those that demonstrate a relentless focus on a few clear priorities.
Ten Common Benchmarking Mistakes and How to Avoid Them
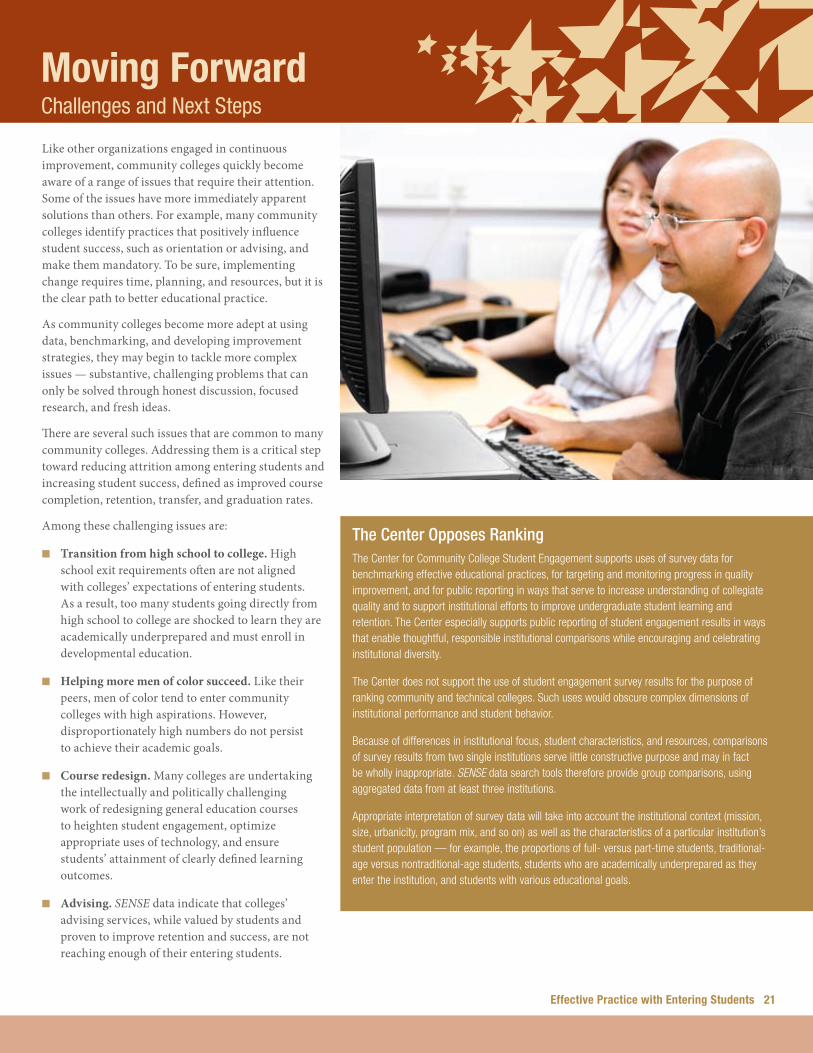
For morE inFormATion ABoUT SENSE, viSiT www.EnTEringSTUdEnT.org.For morE inFormATion ABoUT SENSE, viSiT www.EnTEringSTUdEnT.org.
Effective Practice with Entering Students 21
Moving ForwardChallenges and next Steps
Like other organizations engaged in continuous improvement, community colleges quickly become aware of a range of issues that require their attention. Some of the issues have more immediately apparent solutions than others. For example, many community colleges identify practices that positively influence student success, such as orientation or advising, and make them mandatory. To be sure, implementing change requires time, planning, and resources, but it is the clear path to better educational practice.
As community colleges become more adept at using data, benchmarking, and developing improvement strategies, they may begin to tackle more complex issues — substantive, challenging problems that can only be solved through honest discussion, focused research, and fresh ideas.
There are several such issues that are common to many community colleges. Addressing them is a critical step toward reducing attrition among entering students and increasing student success, defined as improved course completion, retention, transfer, and graduation rates.
Among these challenging issues are:
n Transition from high school to college. High school exit requirements often are not aligned with colleges’ expectations of entering students. As a result, too many students going directly from high school to college are shocked to learn they are academically underprepared and must enroll in developmental education.
n Helping more men of color succeed. Like their peers, men of color tend to enter community colleges with high aspirations. However, disproportionately high numbers do not persist to achieve their academic goals.
n Course redesign. Many colleges are undertaking the intellectually and politically challenging work of redesigning general education courses to heighten student engagement, optimize appropriate uses of technology, and ensure students’ attainment of clearly defined learning outcomes.
n Advising. SENSE data indicate that colleges’ advising services, while valued by students and proven to improve retention and success, are not reaching enough of their entering students.
The Center Opposes Ranking The Center for Community College Student Engagement supports uses of survey data for benchmarking effective educational practices, for targeting and monitoring progress in quality improvement, and for public reporting in ways that serve to increase understanding of collegiate quality and to support institutional efforts to improve undergraduate student learning and retention. The Center especially supports public reporting of student engagement results in ways that enable thoughtful, responsible institutional comparisons while encouraging and celebrating institutional diversity.
The Center does not support the use of student engagement survey results for the purpose of ranking community and technical colleges. Such uses would obscure complex dimensions of institutional performance and student behavior.
Because of differences in institutional focus, student characteristics, and resources, comparisons of survey results from two single institutions serve little constructive purpose and may in fact be wholly inappropriate. SENSE data search tools therefore provide group comparisons, using aggregated data from at least three institutions.
Appropriate interpretation of survey data will take into account the institutional context (mission, size, urbanicity, program mix, and so on) as well as the characteristics of a particular institution’s student population — for example, the proportions of full- versus part-time students, traditional-age versus nontraditional-age students, students who are academically underprepared as they enter the institution, and students with various educational goals.
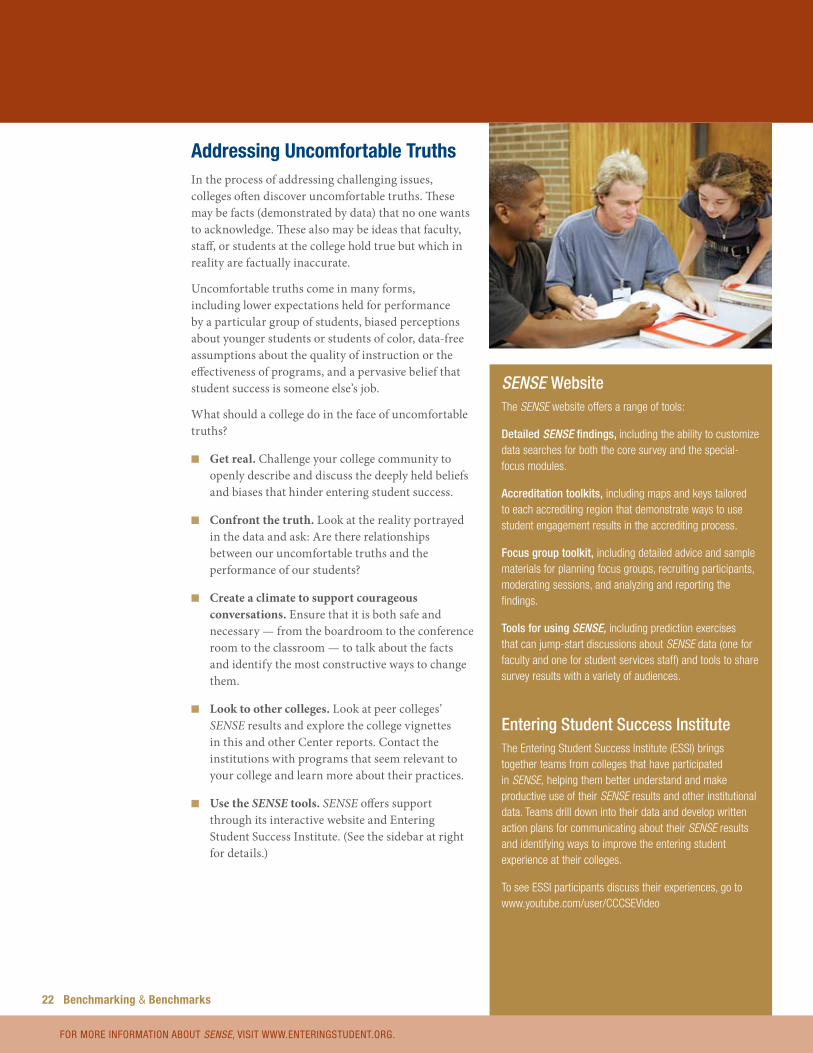
For morE inFormATion ABoUT SENSE, viSiT www.EnTEringSTUdEnT.org.For morE inFormATion ABoUT SENSE, viSiT www.EnTEringSTUdEnT.org.
SENSE Website The SENSE website offers a range of tools:
Detailed SENSE findings, including the ability to customize data searches for both the core survey and the special-focus modules.
Accreditation toolkits, including maps and keys tailored to each accrediting region that demonstrate ways to use student engagement results in the accrediting process.
Focus group toolkit, including detailed advice and sample materials for planning focus groups, recruiting participants, moderating sessions, and analyzing and reporting the findings.
Tools for using SENSE, including prediction exercises that can jump-start discussions about SENSE data (one for faculty and one for student services staff) and tools to share survey results with a variety of audiences.
Entering Student Success InstituteThe Entering Student Success Institute (ESSI) brings together teams from colleges that have participated in SENSE, helping them better understand and make productive use of their SENSE results and other institutional data. Teams drill down into their data and develop written action plans for communicating about their SENSE results and identifying ways to improve the entering student experience at their colleges.
To see ESSI participants discuss their experiences, go to www.youtube.com/user/CCCSEVideo
Addressing Uncomfortable TruthsIn the process of addressing challenging issues, colleges often discover uncomfortable truths. These may be facts (demonstrated by data) that no one wants to acknowledge. These also may be ideas that faculty, staff, or students at the college hold true but which in reality are factually inaccurate.
Uncomfortable truths come in many forms, including lower expectations held for performance by a particular group of students, biased perceptions about younger students or students of color, data-free assumptions about the quality of instruction or the effectiveness of programs, and a pervasive belief that student success is someone else’s job.
What should a college do in the face of uncomfortable truths?
n Get real. Challenge your college community to openly describe and discuss the deeply held beliefs and biases that hinder entering student success.
n Confront the truth. Look at the reality portrayed in the data and ask: Are there relationships between our uncomfortable truths and the performance of our students?
n Create a climate to support courageous conversations. Ensure that it is both safe and necessary — from the boardroom to the conference room to the classroom — to talk about the facts and identify the most constructive ways to change them.
n Look to other colleges. Look at peer colleges’ SENSE results and explore the college vignettes in this and other Center reports. Contact the institutions with programs that seem relevant to your college and learn more about their practices.
n Use the SENSE tools. SENSE offers support through its interactive website and Entering Student Success Institute. (See the sidebar at right for details.)
22 Benchmarking & Benchmarks

For morE inFormATion ABoUT SENSE, viSiT www.EnTEringSTUdEnT.org.For morE inFormATion ABoUT SENSE, viSiT www.EnTEringSTUdEnT.org.
Overview of the 2009 SENSE RespondentsThe 2009 SENSE survey was administered at 120 community colleges and yielded 50,327 usable surveys from entering students. The survey was administered in classes randomly selected from the population of all first college-level English, first college-level math, and developmental education courses (excluding ESL courses).
Colleges chose to include zero, one, or two of the four 2009 special-focus modules in their surveys. The 2009 special-focus modules were Commitment and Support, Engagement through Technology, Financial Assistance, and Student Success Courses. In all, 75 colleges administered special-focus modules.
Both entering students (those in their first term at the college) and returning students responded to the survey, but the findings presented in this report represent 2009 entering student respondents only.
SENSE Sampling note In SENSE sampling procedures, students are sampled at the classroom level. As a result, full-time students, who by definition are enrolled in more classes than part-time students, are more likely to be sampled. To adjust for this sampling bias, SENSE results are weighted based on the most recent publicly available IPEDS data. On the SENSE website, member colleges can generate frequency and means reports using either weighted or unweighted data.
Characteristics of 2009 Entering Student respondents
Characteristic Entering students
Male 44%
Female 56%
Enrolled part-time 26%
Enrolled full-time 74%
Traditional-age (18–24) 80%
Nontraditional-age (25 and older) 20%
Work more than 20 hours per week 32%
Report that English is their first language 87%
Married 11%
Have children living with them 20%
race/Ethnicity of 2009 respondents
Race/ethnicity Entering students
Latino/Hispanic 20%
White 54%
African American 16%
Asian 4%
Native American 2%
Native Hawaiian <1%
Other 4%
Note: Percentages may not total 100% due to rounding.
Source: 2009 SENSE data.
SENSE and Student EngagementSENSE is one of three surveys administered by the Center for Community College Student Engagement. The others are the Community College Survey of Student Engagement (CCSSE ) and the Community College Faculty Survey of Student Engagement (CCFSSE ). All are tools that assess student engagement — how engaged students are with college faculty and staff, with other students, and with their studies — and help colleges improve their educational practice so more students will succeed.
Why student engagement? Research shows that for many groups of students, the more actively engaged they are, the more likely they are to learn, to persist with their studies, and to attain their academic goals. Student engagement, therefore, is a valuable measure for assessing the quality of colleges’ educational practices and identifying ways they can help more students succeed.
CCSSE, now in its eighth national administration, surveys more experienced students to gather information about their overall college experience. SENSE focuses on the time from students’ first contact with the college through the first three weeks of their college experience, assessing practices that are most likely to engage entering students and encourage them to stay in college until they attain their academic goals. CCFSSE provides faculty perspectives on student experiences as well as their own work. Together, SENSE and CCSSE offer complementary pieces of the student success puzzle, with CCSSE providing a comprehensive look at the overall quality of all students’ educational experiences and SENSE offering a focused snapshot of new students and their earliest college experiences.
Effective Practice with Entering Students 23
Peter Ewell, ChairVice PresidentNational Center for Higher Education Management Systems (NCHEMS)
David ArmstrongPresidentBroward College (FL)
Rose AseraSenior ScholarThe Carnegie Foundation for the Advancement of Teaching
George BoggsPresident and CEOAmerican Association of Community Colleges
Walter BumphusChairman, Department of Educational AdministrationThe University of Texas at Austin
Jacqueline ClaunchPresidentNorthwest Vista College (TX)
Terrence GomesPresidentRoxbury Community College (MA)
George GraingerSenior Grant OfficerHouston Endowment Inc.
Alex JohnsonPresidentCommunity College of Allegheny County (PA)
William LawPresidentTallahassee Community College (FL)
Larry LiteckyPresidentCentury College (MN)
Byron N. McClenneyProgram Director, Achieving the DreamThe University of Texas at Austin
Alexander McCormickDirector, National Survey of Student EngagementIndiana University
Jan MottaExecutive DirectorMassachusetts Community College Executive Office (MA)
Cam PreusCommissionerDepartment of Community Colleges and Workforce Development (OR)
John E. RouecheDirector, Community College Leadership ProgramThe University of Texas at Austin
Gerardo de los SantosPresident and CEOLeague for Innovation in the Community College
Anne StantonProgram DirectorThe James Irvine Foundation
Vincent TintoDistinguished ProfessorSyracuse University
Evelyn WaiwaioleDirectorNISOD — National Institute for Staff & Organizational DevelopmentThe University of Texas at Austin
CCCSE National Advisory Board
SENSE Technical Advisory PanelTom BaileyDirectorCommunity College Research Center Teachers College, Columbia University
Kimberly CouttsDirector of Institutional ResearchMiraCosta Community College (CA)
Peter EwellVice PresidentNational Center for Higher Education Management Systems (NCHEMS)
Bob GonyeaAssociate Director, Center for Postsecondary ResearchIndiana University Bloomington
George GraingerSenior Grant OfficerHouston Endowment Inc.
Gary HansonSenior Research and Policy Analyst (Retired)The University of Texas System
Steve HeadPresidentLone Star College-North Harris (TX)
C. Nathan MartiManager of Consulting Services, Division of Statistics and Scientific ComputationThe University of Texas at Austin
Alexander McCormickDirector, National Survey of Student EngagementIndiana University Bloomington
Ann M. ToomeyDirector, System Research and Grants Community College System of New Hampshire (NH)
Alice VilladsenPresident EmeritusBrookhaven College (TX)
Ted WrightSpecial Assistant to the President (Retired)Broward Community College (FL)
24 Benchmarking & Benchmarks
Kay McClenneyDirector
Jeff CrumpleyAssociate Director, Operations
Angela Oriano-DarnallAssociate Director, Survey of EnteringStudent Engagement
Arleen ArnspargerProject Manager, Initiative on Student Success
E. Michael BohligSenior Research Associate
Courtney AdkinsSurvey Operations Coordinator
Karla FisherCollege Relations Coordinator
Christine McLeanSenior Associate
Chris CosartWeb and Database Administrator
Shanna HowardWebmaster
Carlos HernandezProgrammer
Beiyi CaiResearch Associate
Don BoudreauxResearch Associate
Sandra ShannonProject Coordinator
Rowland CadenaCollege Liaison
April JuarezCollege Liaison
Deryl HatchResearch Assistant
JaNice MarshallResearch Assistant
Kerry MixResearch Assistant
Dana SendziolResearch Assistant
Judy RowAdministrative Manager
Chris LynchAccountant
Amina BenchouiaAdministrative Associate
Michael MerckAdministrative Associate
Annine MiscoeAdministrative Associate
Patri O’GanAdministrative Associate
Marlana RodgersAdministrative Associate
Chris OrozcoOffice Assistant
CCCSE Staff
Editorial and design by KSA-Plus Communications, Inc.
SENSE Member CollegesFor a list of SENSE member colleges, visit www.enteringstudent.org
Center for Community College Student EngagementCommunity College Leadership Program
College of EducationThe University of Texas at Austin3316 Grandview StreetAustin, TX 78705
T: 512.471.6807 F: 512.471.4209
www.enteringstudent.org