bell quiz. objectives make graphs and decide if they represent functions
TRANSCRIPT
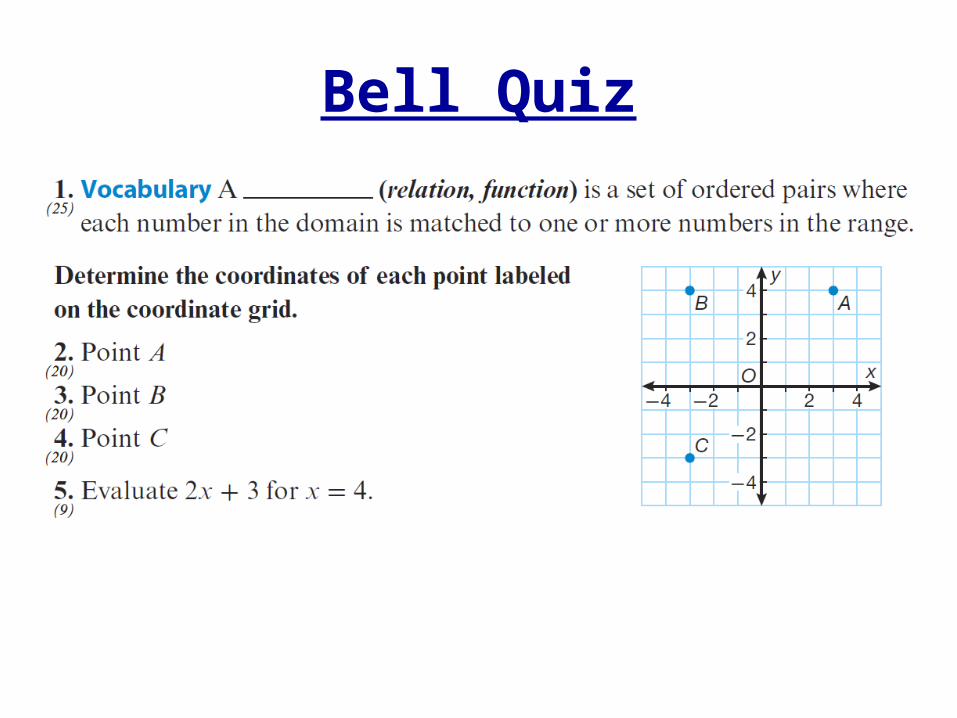
Bell Quiz
Objectives
• Make graphs and decide if they represent functions.
Linear Equation
• A Linear Equation is an equation whose graph is a line.
• You can use a table of ordered pairs to graph an equation.
• To determine if the graph represents a function, use the vertical line test. – If a vertical line intersects the graph at more
than one point then the graph is not a function
Linear Function
• A Linear Function is a function whose graph is a line.
• A linear function can be written in the from f(x) = mx + b– m and b are real numbers.
Example 1Using Tables to Graph Functions
Graph the equation using a table of values. Decide whether the graph represents a function and whether it is linear or nonlinear.
y = 2x + 5

Solution
Lesson Practice
Graph the equation using a table of values. Decide whether the graph represents a function and whether it is linear or nonlinear.
y = x
Solution
Example 2Using Tables to Graph Functions
Graph the equation using a table of values. Decide whether the graph represents a function and whether it is linear or nonlinear.
y = x2

Solution

Lesson Practice
Graph the equation using a table of values. Decide whether the graph represents a function and whether it is linear or nonlinear.
y = x2 + 1

Solution
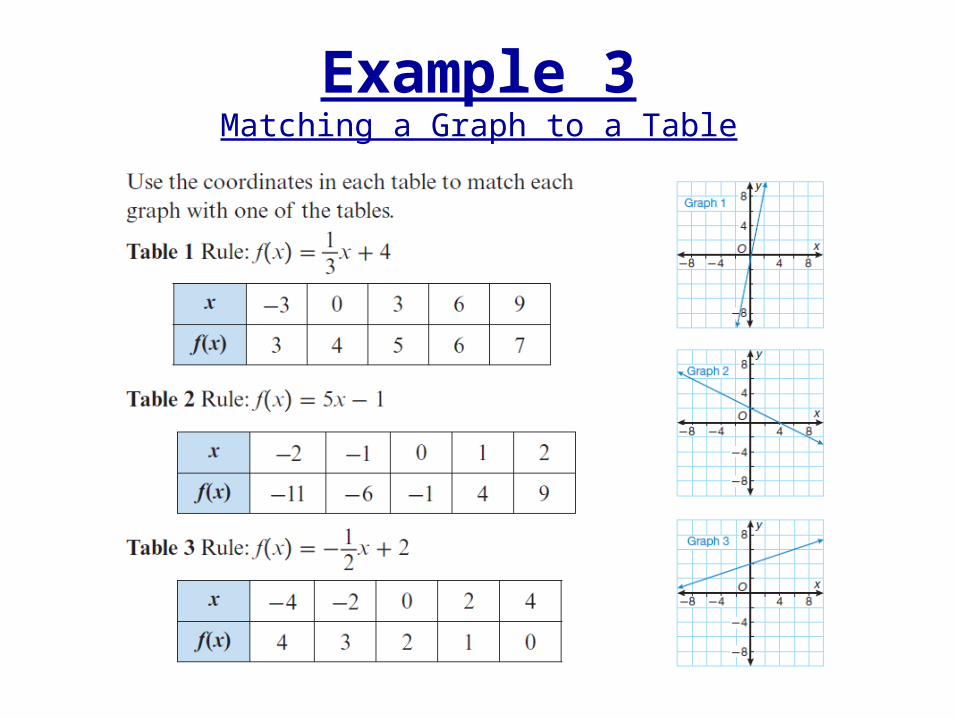
Example 3Matching a Graph to a Table
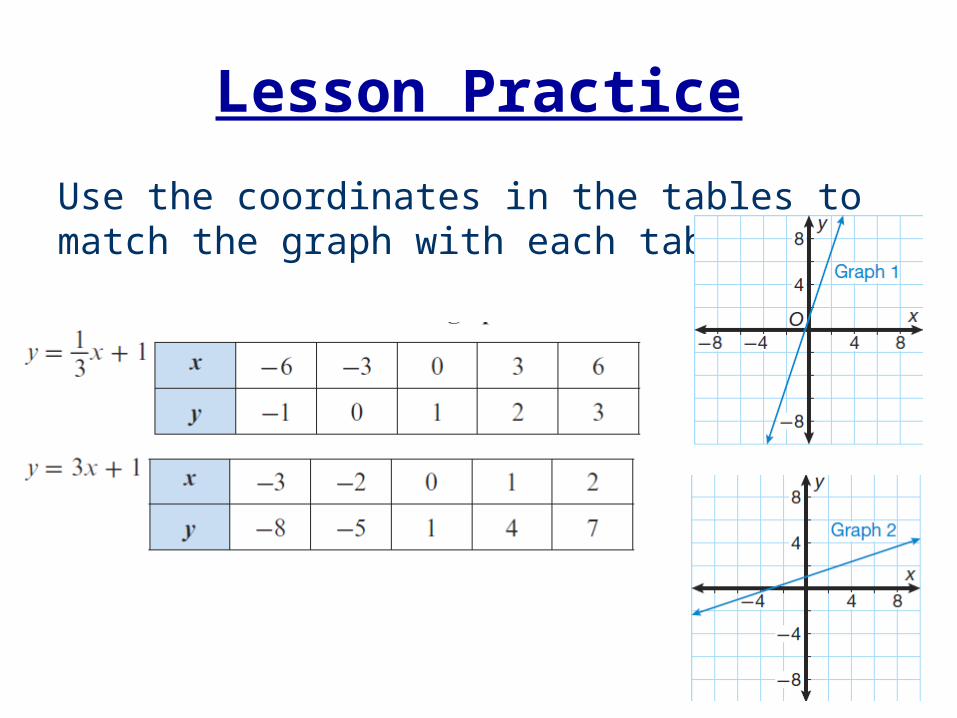
Lesson Practice
Use the coordinates in the tables to match the graph with each table.
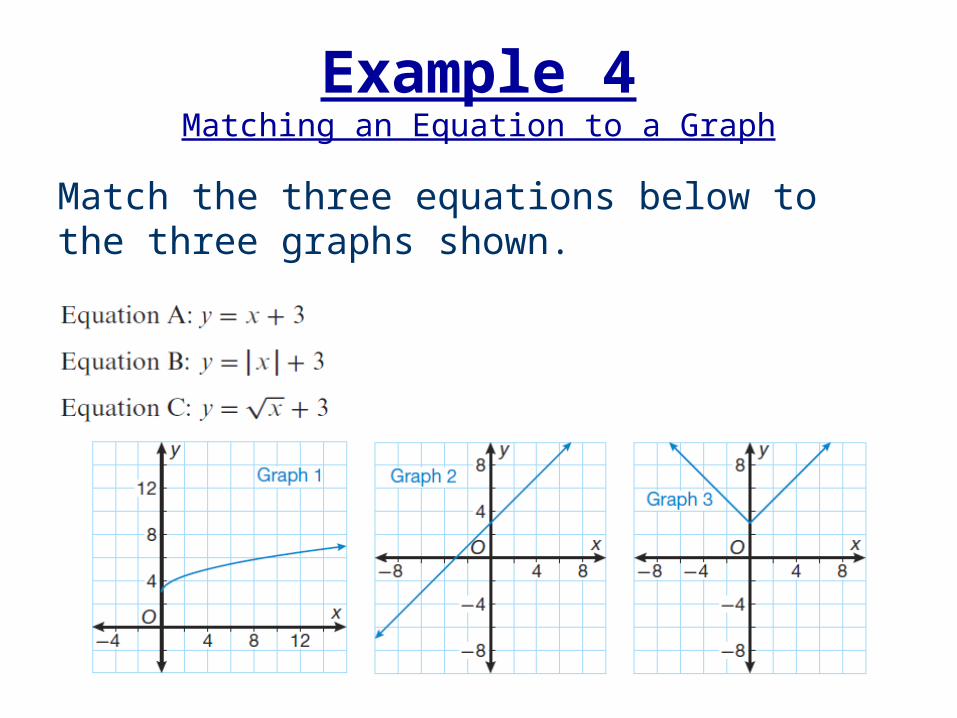
Example 4Matching an Equation to a Graph
Match the three equations below to the three graphs shown.
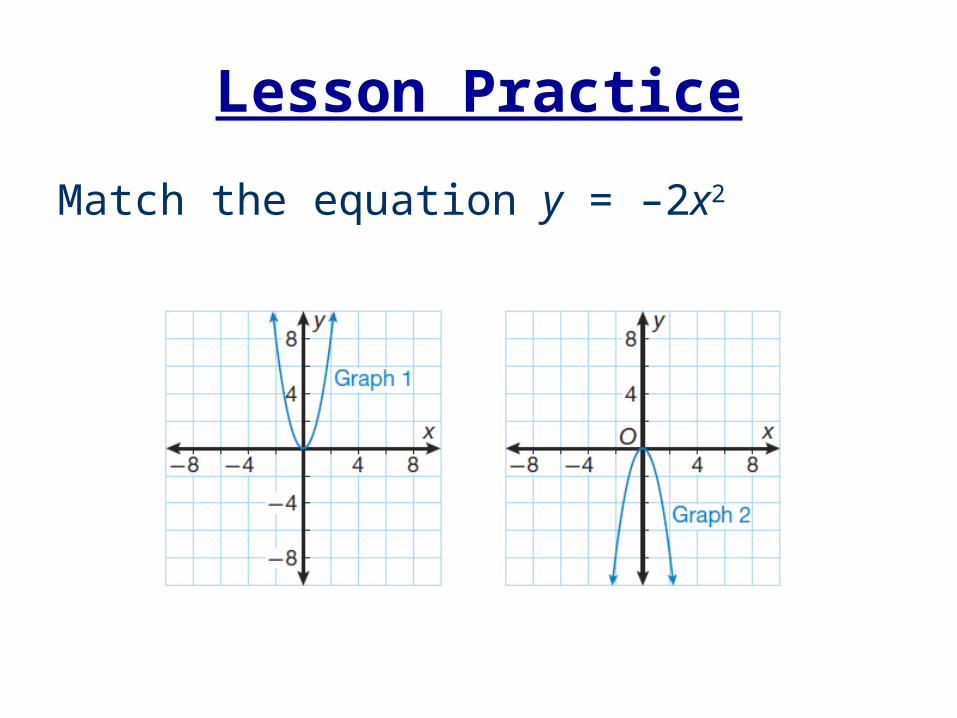
Lesson Practice
Match the equation y = –2x2
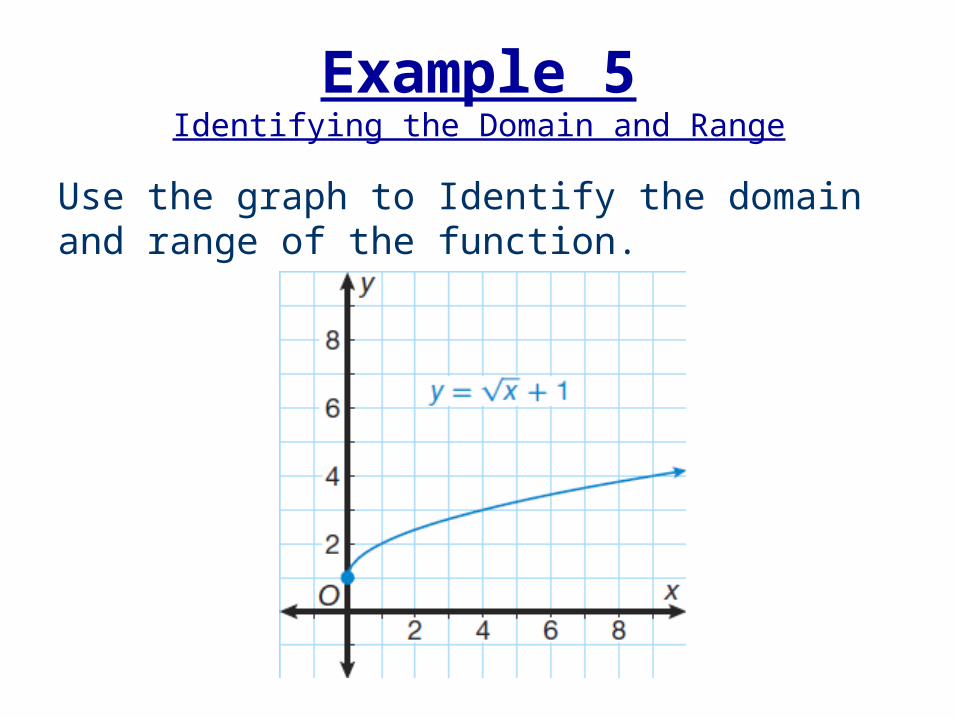
Example 5Identifying the Domain and Range
Use the graph to Identify the domain and range of the function.
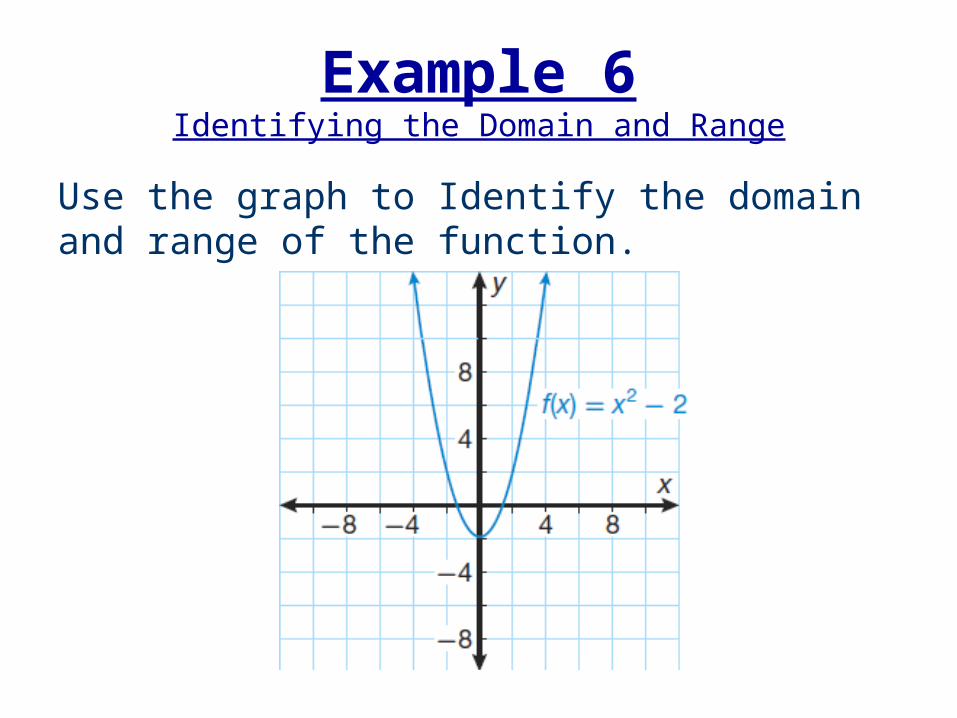
Example 6Identifying the Domain and Range
Use the graph to Identify the domain and range of the function.
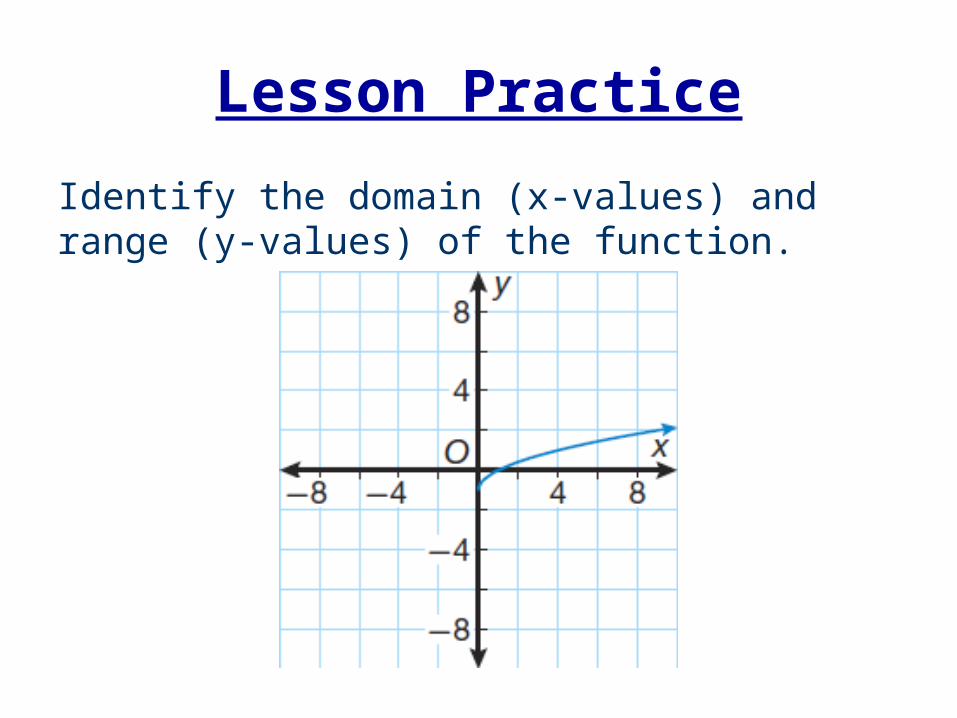
Lesson Practice
Identify the domain (x-values) and range (y-values) of the function.
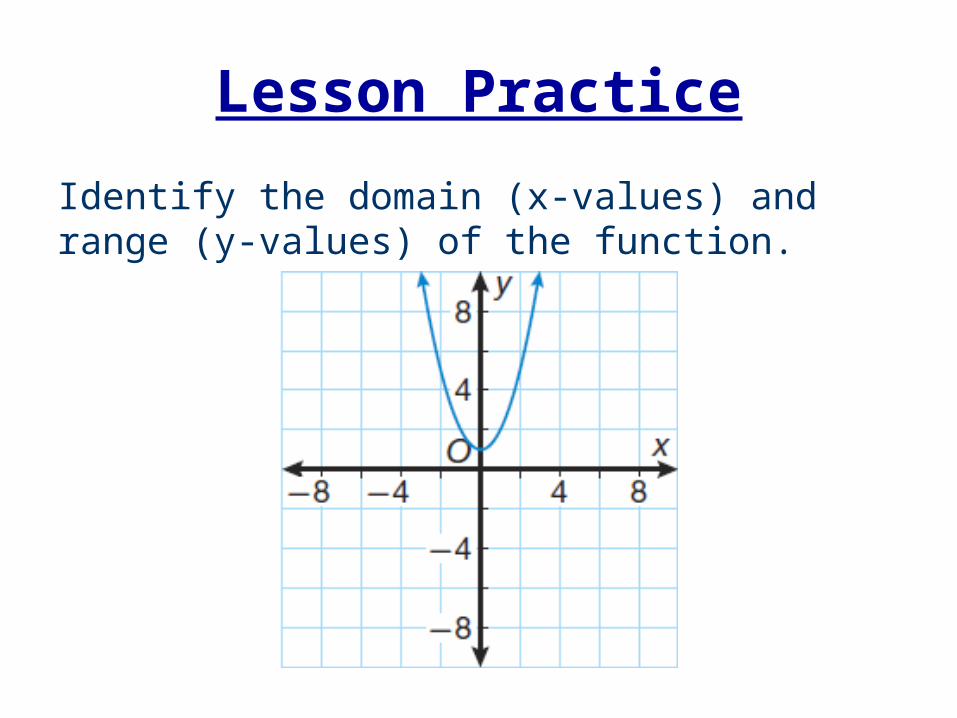
Lesson Practice
Identify the domain (x-values) and range (y-values) of the function.
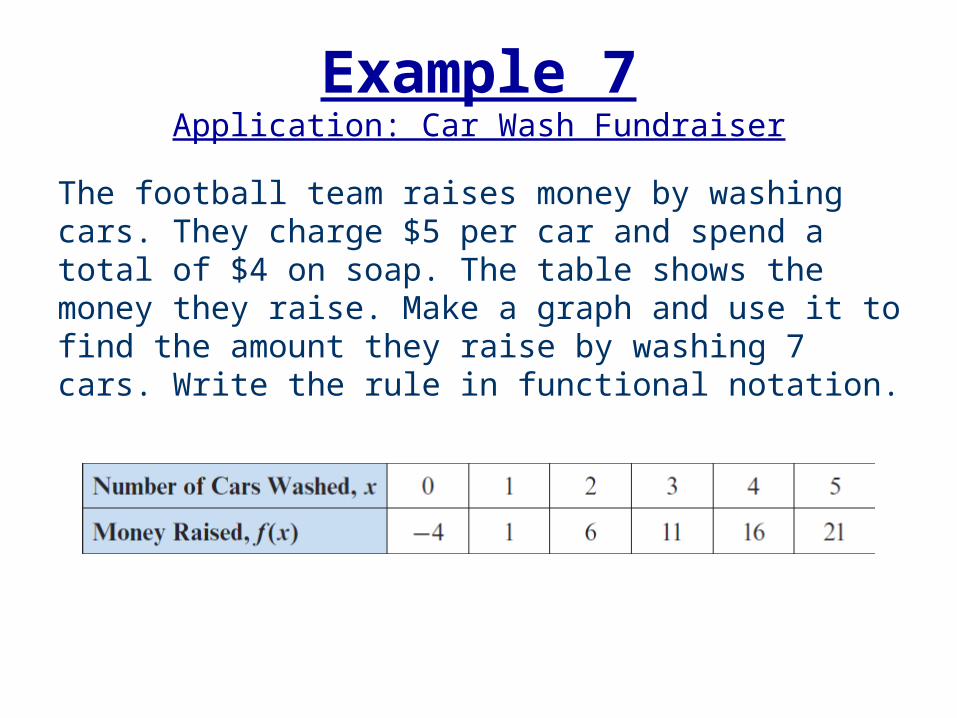
Example 7Application: Car Wash Fundraiser
The football team raises money by washing cars. They charge $5 per car and spend a total of $4 on soap. The table shows the money they raise. Make a graph and use it to find the amount they raise by washing 7 cars. Write the rule in functional notation.
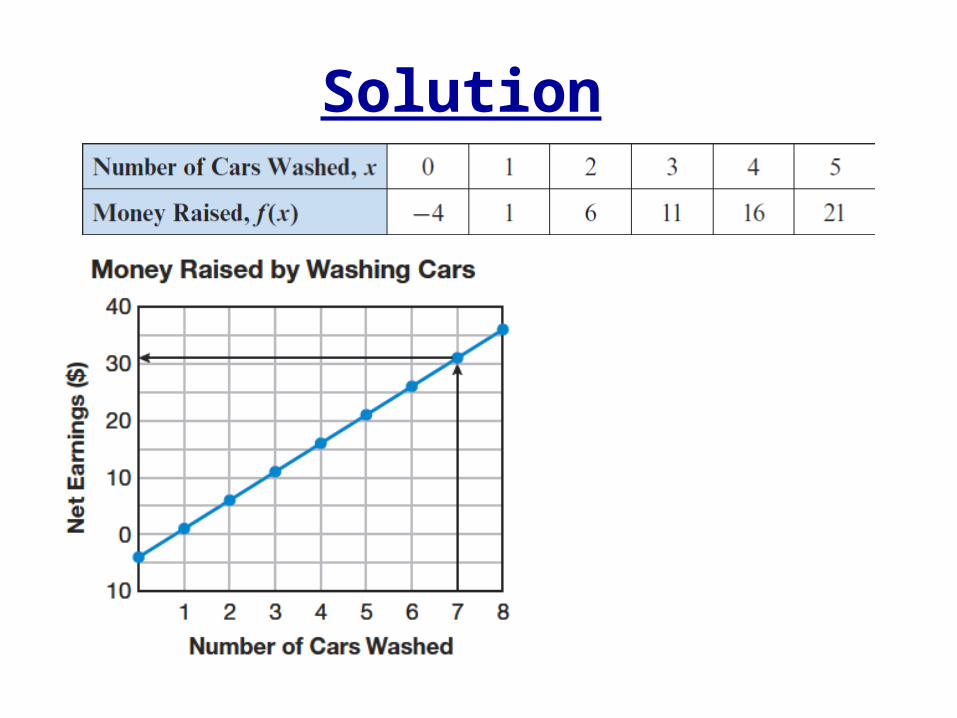
Solution
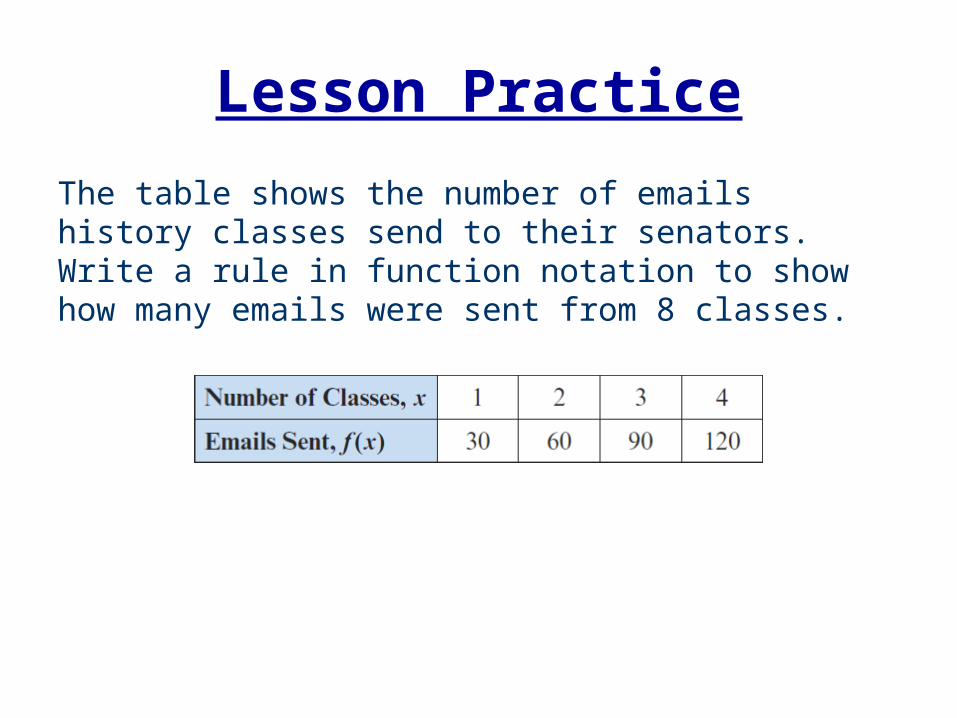
Lesson Practice
The table shows the number of emails history classes send to their senators. Write a rule in function notation to show how many emails were sent from 8 classes.