bear creek watershed management study › dnrp › library › water-and-land › watershe… ·...
TRANSCRIPT

Bear Creek Watershed Management Study
DRAFT
February 21, 2018
Alternate Formats Available

(This page intentionally left blank).

Bear Creek Watershed Management Study
A watershed-scale stormwater management study with instream, riparian, and wetland habitat elements in compliance with NPDES Phase I permit requirements
DRAFT
Prepared for:
This study is required for compliance with NPDES Permit conditions S5.C.5.c (Phase 1) and S5.C.4.g (Phase 2). Submitted on behalf of King County, Snohomish County, City of Redmond, City of Woodinville, and Washington State Department of Transportation
Submitted by:
Timothy Clark, Sevin Bilir, Jeff Burkey, Jessica Engel, Eric Ferguson, Claire Jonson, Josh Kubo, Scott Miller, Jen Vanderhoof, and Mark Wilgus, P.E. King County Water and Land Resources Division Department of Natural Resources and Parks

(This page intentionally left blank).

DRAFT Bear Creek Watershed Management Study
King County Science and Technical Support Section i February 2018
Acknowledgements
The authors would like to thank the following people for their contributions to this project and this report:
Bill Leif, P.E., Snohomish County
Andy Rheaume, City of Redmond
Asha D’Souza and Tom Hansen, P.E., (Retired), City of Woodinville
Curt Crawford, King County
Elsa Pond and Richard Gersib (Retired), Washington State Department of Transportation
King County Staff: David Batts, Tom Beavers, Steven Brady, Stephen Conroy, Chris Gregersen, Ruth Harvey, Larry Jones, Shannon Kelly, Joann Kosai-Eng, Dan Lantz, Jason Mulvihill-Kuntz, Michael Murphy, Doug Navetski, Kate OLaughlin, Blair Scott, Jim Simmonds, Scott Stolnack, and Jason Wilkinson.
Citation
King County. 2018. Bear Creek Watershed Management Study. Prepared by Timothy Clark, Sevin Bilir, Jeff Burkey, Jessica Engel, Eric Ferguson, Claire Jonson, Josh Kubo, Scott Miller, Jen Vanderhoof, and Mark Wilgus, Water and Land Resources Division. Seattle, Washington.

DRAFT Bear Creek Watershed Management Study
King County Science and Technical Support Section ii February 2018
(This page intentionally left blank).

DRAFT Bear Creek Watershed Management Study
King County Science and Technical Support Section iii February 2018
Table of Contents
Executive Summary...............................................................................................................................................x
Abbreviations and Acronyms ........................................................................................................................ xvi
1.0 Introduction .............................................................................................................................................. 1
1.1 Permit and Project Background ................................................................................................... 2
1.2 Known Concerns in the Bear Creek Watershed ..................................................................... 5
1.3 Bear Creek 1990 Basin Plan ........................................................................................................... 6
1.4 Related Complementary Efforts ................................................................................................... 6
1.4.1 WRIA 8 Chinook Salmon Conservation Plan ..................................................................... 6
1.4.2 Monticello Creek Watershed Restoration Plan ................................................................ 7
1.4.3 King County Land Conservation ............................................................................................. 7
1.4.4 King County Stormwater Facility Management ............................................................... 7
1.4.5 King County Roads Services ..................................................................................................... 8
1.4.6 Bear–Evans Multi-Parameter TMDL..................................................................................... 8
1.4.7 Climate Change Impacts Study ............................................................................................... 8
1.5 Related Regulations and Code ...................................................................................................... 9
1.5.1 Surface Water Management Requirements ....................................................................... 9
1.5.2 Critical Areas Ordinances ......................................................................................................... 9
1.5.3 Growth Management Act .......................................................................................................... 9
1.5.4 Clearing and Grading Requirements ..................................................................................10
1.5.5 Shoreline Management Act ....................................................................................................10
1.5.6 State Environmental Protection Act ...................................................................................10
1.6 Study Development .........................................................................................................................10
1.6.1 Watershed Partners ..................................................................................................................10
1.6.2 Technical Team ...........................................................................................................................11
1.6.3 External Participants Input ....................................................................................................12
1.6.4 Reports Supporting the Watershed Management Study ............................................13
1.7 Purpose and Structure of Watershed Management Study ...............................................14
2.0 Watershed Goals, Objectives, Metrics, and Targets .................................................................17
2.1 Watershed Goals and Management Objectives ....................................................................17
2.2 Watershed Model Metrics and Targets ...................................................................................18

DRAFT Bear Creek Watershed Management Study
King County Science and Technical Support Section iv February 2018
2.3 General Methods to Generate Priority Strategies ................................................................20
3.0 Existing Conditions ..............................................................................................................................23
3.1 Land Use ..............................................................................................................................................23
3.2 Water Quality.....................................................................................................................................26
3.3 Hydrology/B-IBI ...............................................................................................................................26
3.4 Stormwater Facilities .....................................................................................................................27
3.5 Instream Habitat and Salmon Use .............................................................................................29
3.6 Wetlands ..............................................................................................................................................31
3.7 Riparian Corridors ...........................................................................................................................33
4.0 Stormwater Strategy Identification and Prioritization ..........................................................35
4.1 Structural Stormwater Strategies ..............................................................................................35
4.2 Catchment Prioritization ...............................................................................................................37
4.3 Identified Structural Strategies ..................................................................................................43
4.4 Identified Non-structural (Programmatic) Strategies .......................................................47
5.0 Instream Habitat Strategy Identification and Prioritization ................................................51
5.1 Structural Instream Habitat Strategies and Restoration Projects ................................51
5.2 Instream Project Prioritization ..................................................................................................55
5.3 Identified Structural Strategies ..................................................................................................59
5.4 Identified Non-structural (Programmatic) Strategies .......................................................66
6.0 Wetland Strategy Identification and Prioritization .................................................................69
6.1 Structural Wetland Strategies .....................................................................................................69
6.2 Wetland Project Prioritization ....................................................................................................70
6.3 Identified Structural Strategies ..................................................................................................74
6.3.1 Restoration strategies ..............................................................................................................74
6.3.2 Conservation strategies ...........................................................................................................78
6.4 Identified Non-structural (Programmatic) Strategies .......................................................81
7.0 Riparian Corridor Strategy Identification and Prioritization ..............................................83
7.1 Structural Riparian Corridor Strategies ..................................................................................83
7.2 Riparian Corridor Prioritization ................................................................................................84
7.3 Identified Structural Strategies ..................................................................................................86
7.3.1 Restoration strategies ..............................................................................................................86
7.3.2 Conservation strategies ...........................................................................................................87
DRAFT Bear Creek Watershed Management Study
King County Science and Technical Support Section v February 2018
7.4 Identified Non-structural (Programmatic) Strategies .......................................................90
8.0 Other Non-structural (Programmatic) Strategies ....................................................................93
9.0 Potential Implementation Framework .........................................................................................97
10.0 Adaptive Management and Measuring Progress and Success ......................................... 101
10.1 Adaptive Management ................................................................................................................ 101
10.2 Monitoring and Assessment Management Plan ................................................................ 102
10.3 Timeline for Reporting and Evaluation ................................................................................ 104
11.0 Potential Near-term Actions Schedule and Budget .............................................................. 107
11.1 Schedule of Potential Near-term Actions............................................................................. 107
11.2 Summary of Estimated Near-term Costs ............................................................................. 112
12.0 Funding Strategy ................................................................................................................................ 115
13.0 Recommended Next Steps .............................................................................................................. 124
14.0 References ............................................................................................................................................ 126
Figures
Figure 1. Greater Bear Creek watershed, including Cottage Lake and Evans Creek drainage. .......................................................................................................................................... 3
Figure 2. Bear Creek study area 2011 land use and land cover. .................................................24
Figure 3. Bear Creek study area 2011 impervious areas. .............................................................25
Figure 4. Percent of existing stormwater ponds and vaults by Surface Water Design Manual year. .................................................................................................................................28
Figure 5. Mapped wetlands in the study area once all wetland data are merged. Note that some wetland polygons span across watershed study area boundaries. ...32
Figure 6. Land cover in the riparian corridor of salmonid-bearing streams in the study area......................................................................................................................................34
Figure 7. Stormwater structural strategy prioritization schematic. .........................................39
Figure 8. Catchments included in prioritization for stormwater projects and the associated lead jurisdiction. ..................................................................................................40
Figure 9. Prioritized catchments for stormwater projects and the associated lead jurisdiction. ..................................................................................................................................45
Figure 10. Schematic of instream habitat project scoring and prioritization for the mainstem of Bear and Cottage Lake creeks. ....................................................................56
Figure 11. Bear Creek study area instream restoration project prioritization. ......................61

DRAFT Bear Creek Watershed Management Study
King County Science and Technical Support Section vi February 2018
Figure 12. Lower Bear Creek Restoration Project Prioritization (road/bridge crossing projects were not included in the prioritzation scoring). ..........................................62
Figure 13. Cottage Lake Creek Restoration Project Prioritization (road/bridge crossing projects were not included in the prioritzation scoring). ........................63
Figure 14. Upper Bear Creek Restoration Project Prioritization (road/bridge crossing projects were not included in the prioritzation scoring). ..........................................64
Figure 15. Prioritization of wetlands for rehabilitation strategies (tree planting). ..............77
Figure 16. Adaptive management framework. ................................................................................. 101
Tables
Identified water and habitat quality concerns in the Bear Creek study area. ...... 5 Table 1.
Watershed partners. .................................................................................................................10 Table 2.
Technical team members and respective association and roles. ............................11 Table 3.
External partners included in Study workshops. ..........................................................12 Table 4.
Technical reports supporting the Study. ..........................................................................13 Table 5.
Watershed goals, management objectives, and indicators. .......................................17 Table 6.
Metrics and targets used in the watershed model. .......................................................19 Table 7.
Overview of SWDM requirements for stormwater facilities and BMPs. ..............28 Table 8.
Strategies for improving stormwater quality and/or quantity. ..............................36 Table 9.
Criteria and datasets used to develop water quality/quantity prioritization. ...41 Table 10.
Summary of BMPs recommended by catchment for priority basins (bold Table 11.cells are recommended for near-term implementation, i.e., 1-10 years). ...........46
Non-structural stormwater strategies. ..............................................................................48 Table 12.
Restoration strategies and ecological benefits. ..............................................................52 Table 13.
Determinations of Which Restoration Strategies are included in Restoration Table 14.Projects. .........................................................................................................................................53
Select Instream Habitat Restoration Projects in the Bear Creek Study Area. ....54 Table 15.
Datasets used to develop instream habitat prioritization. ........................................58 Table 16.
Summary of instream habitat projects by waterbody. ................................................65 Table 17.
Non-structural instream habitat strategies. ....................................................................67 Table 18.
Criteria used to prioritize wetlands for conservation and restoration. ................71 Table 19.
Acres of land, by jurisdiction and ownership, that would benefit from tree-Table 20.planting restoration. .................................................................................................................75

DRAFT Bear Creek Watershed Management Study
King County Science and Technical Support Section vii February 2018
Sample of highest ranked wetlands for rehabilitation for each jurisdiction. .....76 Table 21.
Cost estimates for all 62 parcels identified for potential acquisition. ...................80 Table 22.
Cost estimates to for all 275 parcels identified for potential easements. ............81 Table 23.
Non-structural strategies for wetland restoration and conservation. ..................82 Table 24.
Criteria used to develop riparian corridor prioritization scheme. .........................85 Table 25.
Acres of riparian corridors prioritized for restoration by jurisdiction and Table 26.ownership. Public indicates areas that are fully or partially on public lands. ...86
Cost estimates for all 128 parcels identified for potential acquisition. ................89 Table 27.
Cost estimates for all 538 parcels identified for potential easements. .................90 Table 28.
Non-structural riparian strategies. .....................................................................................92 Table 29.
Programmatic (non-structural) strategies. ......................................................................94 Table 30.
Watershed coordinator one-time and ongoing responsibilities and time Table 31.commitment. ................................................................................................................................98
Monitoring plan elements for the MAMP. ..................................................................... 103 Table 32.
King County Watershed Study potential near-term actions if implemented. . 109 Table 33.
Snohomish County Watershed Study potential near-term actions if Table 34.implemented. ............................................................................................................................ 110
City of Redmond Watershed Study potential near-term actions if Table 35.implemented. ............................................................................................................................ 111
City of Woodinville Watershed Study potential near-term actions if Table 36.implemented. ............................................................................................................................ 111
Watershed Study near-term budget summary. ........................................................... 112 Table 37.
Potential Local Funding Sources ....................................................................................... 116 Table 38.
State Funding Sources ........................................................................................................... 118 Table 39.
Federal Funding Sources ...................................................................................................... 121 Table 40.
Private Funding Sources ...................................................................................................... 122 Table 41.
Near-term (first 10 years) recommendations for restoring the Bear Creek Table 42.watershed. ................................................................................................................................. 125
Appendices
Appendix A: Prioritization: Water Quality and Quantity Strategies
Appendix B: Prioritization: Instream Habitat Projects
Appendix C: Prioritization: Wetland Strategies

DRAFT Bear Creek Watershed Management Study
King County Science and Technical Support Section viii February 2018
Appendix D: Prioritization: Riparian Corridor Strategies
Appendix E: Public Engagement Summary
Appendix F: Identified Structural Stormwater Strategies for Entire Study Area
Appendix G: Potential Strategy Implementation Schedule and Budget
Appendix H: Permit Crosswalk

DRAFT Bear Creek Watershed Management Study
King County Science and Technical Support Section ix February 2018
(This page intentionally left blank).

DRAFT Bear Creek Watershed Management Study
King County Science and Technical Support Section x February 2018
EXECUTIVE SUMMARY
Development of this Bear Creek Watershed Management Study (the Study) meets the requirements of King County’s 2012-2018 National Pollutant Discharge Elimination System (NPDES) Phase I Municipal Stormwater Permit. The Study represents a multi-jurisdictional approach to resolving one of the last and most challenging environmental issues in the Puget Sound basin – stormwater. Stormwater running off of developed lands can carry toxic chemicals, harmful pathogens, and habitat-smothering sediments. Habitat loss and degradation through development, such as decreased stream shading from trees and large changes in streamflow, are negatively impactful on salmon and other aquatic life.
King County, Snohomish County, the City of Redmond, the City of Woodinville, and the Washington State Department of Transportation have collaborated to complete this Study. The Study provides a comprehensive analysis of the current condition of the Bear Creek watershed and identifies a suite of stormwater management strategies that would result in hydrologic and water quality conditions that fully support “existing uses,” and “designated uses” throughout the stream system, with a particular focus on Low Impact Development (LID) best management practice (BMP) strategies.
This Study provides a long-term analysis for the restoration of the Bear Creek watershed, including a ten year strategy, budget, and specific projects that can be undertaken. Doing so would constitute a critical step in the hard work of retrofitting outdated stormwater infrastructure and restoring water quality and habitat in the Bear Creek watershed.
Purpose and Context
This Study was developed in accordance with Special Condition S5.C.5.c of King County’s 2012-2018 NPDES Phase I Municipal Stormwater Permit (the Permit). King County was the lead agency for developing the Study, in partnership with Snohomish County, the City of Woodinville, the City of Redmond, and the Washington State Department of Transportation.
King County selected the Bear Creek watershed for this Study because the majority of the watershed is in unincorporated King County and it was identified by the Washington Department of Ecology (Ecology), the agency that issued the Permit, as a targeted watershed for stormwater retrofit planning due to its high ecological integrity. While there are restoration needs and concerns, the watershed contains important habitat for salmon recovery, and has generally good water quality.
The Permit-defined objective of the Study is to identify stormwater management strategies that would result in hydrologic and water quality conditions that fully support “existing uses,” and “designated uses” throughout the stream system. These uses are defined in Washington Administrative Code (WAC) 173-201A and include core summer salmonid habitat, salmon spawning, rearing and migration; and recreational, water supply, and miscellaneous uses. While the 2012-2018 NPDES Permit requires development of the stormwater strategies, there is no requirement that the findings be implemented.
DRAFT Bear Creek Watershed Management Study
King County Science and Technical Support Section xi February 2018
The Study evaluated a number of stormwater management strategies to assess what would be needed to improve instream flow metrics and water quality parameters. The strategies include installation of stormwater facilities and low impact development (LID) best management practices (BMPs) throughout the watershed; and tree planting (to meet state water quality standards for temperature) along degraded stream corridors.
The Study identifies strategies for preservation and improvement of instream habitat, wetlands, and riparian areas. This aspect of this study exceeds the analysis required by the Permit and was not completed by other NPDES Phase I municipal permittees that were required to conduct a watershed study. King County and partners expanded the Study to include a focus on habitat conditions to address the integrated nature of aquatic resources across a watershed, specifically the linkage of fish and habitat to water quality.
In line with the Study’s aspirational objectives – to fully restore the water quality and simultaneously address habitat – a suite of strategies are presented that are estimated to need a long time period (many decades) to implement. In light of the scale of the effort to address degraded conditions throughout the watershed, the Study identifies – and recommends – a set of near term actions for getting started over the next 10 years.
The proposed near-term recommendations actions are not required by the permit, but they offer a road map to begin restoring the ecological health of the Bear Creek watershed. While the proposed actions are significant, it is clear that new information and unforeseen changes will affect what projects that would be constructed in future decades. The early steps would begin the process toward restoration, and in so doing, generate information to refine and improve the effectiveness of the long-term strategy.
Background and Existing Conditions
The Study area covers about 26 square miles of the Bear Creek watershed. The majority of the study area is within unincorporated King County, with smaller portions in the City of Woodinville, the City of Redmond, and unincorporated Snohomish County. Bear Creek currently supports a wide range of salmonids including Chinook, sockeye, coho, kokanee, steelhead, and coastal cutthroat. Moreover, Bear Creek has been identified as one of two high priority habitats to restore for Chinook salmon recovery (known as “Tier 1” habitat) by the Water Resource Inventory Area 8 (WRIA 8) Salmon Conservation Plan, covering the Greater Lake Washington Watershed.
Bear Creek’s water quality, while generally good, is challenged with high levels of fecal coliform bacteria, elevated water temperatures, and low dissolved oxygen levels. Ecology has developed Total Maximum Daily Loads for temperature and bacteria in Bear Creek. Native vegetation along the stream corridor has been degraded over time and historic wetlands have been altered or filled in for other uses. Instream habitat, critical for salmon and other aquatic life, is lacking in quantity, quality and variety. Bear Creek’s overall aquatic health based on observed Benthic Index of Biotic Integrity (B-IBI) scores is categorized as “Fair”.

DRAFT Bear Creek Watershed Management Study
King County Science and Technical Support Section xii February 2018
The majority of land in the watershed is privately owned and has already been developed to some extent. Most areas not developed are within the City of Redmond Watershed (protected for water supply purposes) or are defined as critical areas by King County code. A small number of undeveloped parcels outside of these protected areas remain. Most of the development in the watershed occurred prior to current requirements for modern stormwater controls. Some stormwater facilities to manage runoff (such as ponds) have been built in the past, but most were based on older design standards that do not adequately protect aquatic resources. Land use projections based on population trends and current zoning suggest increasingly dense developments within the urban areas of the watershed in the future, with incremental increases in development levels in rural areas.
Complementary Actions in the Watershed
There is already a lot of investment by public agencies towards maintaining and improving the quality of the Bear Creek watershed. These investments include, but are not limited to, King County land conservation and acquisition efforts, WRIA 8 salmon habitat recovery projects, road drainage improvements, stormwater retrofits, pollution source control, and Redmond’s Watershed Restoration Plan. The Study reviewed several of the major planned actions over the next 10 years and over $40 million may be expected to be invested in the Bear Creek watershed that will improve water and habitat quality. Additional investments are expected from projects and programs not reviewed as part of this Study.
Assessing Actions to Achieve the Permit Targets and Standards
The Study identified a suite of strategies that if implemented would result in achieving the instream flow metrics and water quality targets as defined in the Permit. The strategies include installation of stormwater facilities built to current standards (ponds, gravity injection wells, etc.) and low impact development (LID) best management practices (rain

DRAFT Bear Creek Watershed Management Study
King County Science and Technical Support Section xiii February 2018
gardens, permeable pavement, drywells) throughout the watershed to address flow metrics and water quality. The strategies also include a source control effort to reduce fecal bacteria loadings and tree planting to reduce stream temperatures along degraded stream corridors. Incentive programs are recommended to promote these strategies on private lands. The Study results suggest that the majority of hard surfaces (roads, driveways, houses, parking lots, etc.) in the watershed would require treatment with LID BMPs and/or traditional stormwater facilities. While the identified strategies reflect the best available science, the effectiveness of many of these actions is not yet fully understood. As a consequence, the Study suggests a long-term timeframe and calls for adaptive management. The identified long term actions (and any associated costs) are therefore highly uncertain — new approaches and technologies are likely to modify what is ultimately needed.
The Study identifies comprehensive strategies for conservation and improvement of instream habitat, wetlands, and riparian areas. While the Permit considers the identification and analysis of these strategies discretionary, such strategies directly address the stream’s aquatic life uses. They were deliberately included in the scope of the project from the outset, and supported through public workshops held during the plan’s preparation.
Despite the challenges of fully implementing a comprehensive watershed management plan, King County and its partners recognize the need and opportunity to move beyond planning and take a critical first step. To that end, the Study recommends near-term actions that will begin to restore the watershed and generate momentum for ongoing improvements.
Near-Term Recommendations
The Study recommends a set of near term actions – over the next ten years – to improve water quality in select catchments (small, sub basins within the Bear Creek Watershed) and begin to restore habitat throughout the Bear Creek watershed. While many factors, including jurisdictional priorities, limited funding, and other ongoing activities will affect the degree to which recommendations are implemented, they reflect a path toward restoring the basin. Focusing intense stormwater efforts in smaller geographic areas increases the likelihood of achieving measurable instream improvements earlier, compared to more diffused efforts throughout the watershed. Besides demonstrating results, focused implementation can provide timely, useful feedback on the strategies employed so that they can be modified, as needed, to ensure effectiveness.
Key recommendations over the next 10 years include:
Aggressively seeking funding (e.g. grants) to implement high priority actions;
Constructing the recommended stormwater management facilities and LID BMPs on public land in the high priority catchments;

DRAFT Bear Creek Watershed Management Study
King County Science and Technical Support Section xiv February 2018
Providing incentives for LID BMP construction on private residential properties in the high priority catchments; and
Restoring 50 percent of degraded wetlands and riparian corridors, installing 10 percent of the high priority instream habitat projects, and providing incentives to plant trees along stream corridors throughout the watershed.
Additional activities recommended over the next 10 years include:
Developing an in-lieu fee program that allows those proposing development activities the option to pay for stormwater mitigation in the watershed when it is infeasible to provide mitigation on a development site;
Completing a study that analyzes the feasibility of a flow-control credit transfer program in unincorporated King County;
Implementing a monitoring program to track strategy effectiveness, to be used in adaptively managing the plan;
Completing a study that identifies and prioritizes fish barriers in the Bear Creek stream system;
Implementing a public outreach and education campaign to support plan implementation by residents; and
Completing a program review at completion of the ten year period, to inform next steps.
If implemented, the estimated costs to perform the recommended near term actions over the ten year period is $81 million (presumably shared among the watershed partners). The analysis completed in the Study estimates the near-term capital construction cost for stormwater facilities in the priority catchments to be $51 million. The near-term capital cost for habitat improvement projects is estimated to be $26 million. Program costs including recommended studies and monitoring are estimated at $4 million. The remainder of the estimated 10-year cost would cover a wide range of operation and maintenance activities for stormwater facilities in the watershed.
The extent to which funds are available to implement the near-term recommendations is unknowable at this time. Funding is dependent upon factors such as grant availability, the ability to leverage existing programs, and the ability to raise additional funds through rate setting and budgeting processes. It is expected that existing complementary efforts in the watershed will lower the additional amount of funding sought.
The Importance of Ongoing Public Support, Commitment, and Involvement
Public involvement, support, and cooperation will be crucial to the success of water quality and habitat restoration efforts in the Bear Creek watershed. Not only is public support

DRAFT Bear Creek Watershed Management Study
King County Science and Technical Support Section xv February 2018
required for many of the agency strategies identified in the Study, some strategies like stream corridor planting and construction of new LID BMPs are projected to occur on private lands. Reducing pollutants to the stream that result from common activities depend on changed practices and behaviors by watershed residents. The Study identified the long term challenge, and identified steps that can be taken to get started. But the kind of public commitment that is necessary for achieving the goals of the Study can only result from a sustained, cooperative effort based on an understanding the stream’s value to the greater community, and a commitment to its stewardship.

DRAFT Bear Creek Watershed Management Study
King County Science and Technical Support Section xvi February 2018
ABBREVIATIONS AND ACRONYMS
ASGWC ..................................................................... Areas Susceptible to Groundwater Contamination B-IBI ............................................................................................................. Benthic Index of Biotic Integrity BMP ......................................................................................................................... Best Management Practice CAO .............................................................................................................................. Critical Areas Ordinance CSP ........................................................................................................ Conservation Stewardship Program CWM .................................................................................................. Cooperative Watershed Management DO ................................................................................................................................................ dissolved oxygen Ecology ..................................................................................... Washington State Department of Ecology EDT ............................................................................................................... Ecosystem Diagnosis Treatment EPA............................................................................................................ Environmental Protection Agency ESRP ......................................................................................... Estuary and Salmon Restoration Program FCBMP ......................................................................................... Flow-control Best Management Practice GROSS ................................................................................. Grants of Regional or Statewide Significance HOA .......................................................................................................................... Home Owners Association HSPF ................................................................................ Hydrological Simulation Program—FORTRAN LCI ........................................................................................................................ Land Conservation Initiative LID ..............................................................................................................................Low Impact Development LWCF ..................................................................................................... Land and Conservation Water Fund MAMP.............................................................................. Monitoring and Assessment Management Plan NFWF ............................................................................................. National Fish and Wildlife Foundations NPDES ........................................................................ National Pollutant Discharge Elimination System PBRS ........................................................................................... Public Benefit Open Space Rating System
RCO ........................................................................................................ Recreation and Conservation Office RCPP .................................................................................... Regional Conservation Partnership Program REET ................................................................................................................................. Real Estate Excise Tax SUSTAIN ................................. System for Urban Stormwater Treatment and Analysis Integration SWM ......................................................................................................................Surface Water Management STS .................................................................................................. Science and Technical Services Section SWDM ..................................................................................... King County Surface Water Design Manual SWS ...................................................................................................................... Stormwater Services Section TMDL...................................................................................................................... Total Maximum Daily Load TSS ....................................................................................................................................total suspended solids UGA ........................................................................................................................................ Urban Growth Area US......................................................................................................................................................... United States WAC ............................................................................................................ Washington Administrative Code WHPA ........................................................................................................................Wellhead Protection Area WLRD .......................................................................... King County Water and Land Resources Division WPZ ........................................................................................................................ Wellhead Protection Zones WRIA .............................................................................................................Water Resource Inventory Area WSDOT ...................................................................... Washington State Department of Transportation

DRAFT Bear Creek Watershed Management Study
King County Science and Technical Support Section xvii February 2018
(This page intentionally left blank).

DRAFT Bear Creek Watershed Management Study
King County Science and Technical Support Section 1 February 2018
1.0 INTRODUCTION
This Bear Creek Watershed Management Study (the Study) was developed in accordance with Special Condition S5.C.5.c of the 2013-2018 National Pollutant Discharge Elimination System (NPDES) Phase I Municipal Stormwater Permit (the Permit). King County is a Phase I permittee, and the Permit was issued by the Washington State Department of Ecology. King County was the lead agency for developing the Study, with participation, as required by applicable NPDES permits, Snohomish County (Phase I S5.C.5.c.vi), the City of Woodinville (Phase II S5.C.4.g.iv), the City of Redmond (Phase II S5.C.4.g.iv), and the Washington State Department of Transportation (WSDOT) (S5.A.4.a).
The Permit-defined objective of watershed-scale stormwater planning is to identify a stormwater management strategy or strategies that would result in hydrologic and water quality conditions that fully support “existing uses,” and “designated uses” throughout the stream system. These uses are defined in Washington Administrative Code (WAC) 173-201A and include core summer salmonid habitat, salmon spawning, rearing and migration; and recreational, water supply, and miscellaneous uses. While the Permit requires the development of watershed strategies, it does not require implementation of the strategies.
As required by the Permit, stormwater management strategies evaluated include potential future structural retrofit projects and changes to development-related codes, rules, and standards. These strategies target improvements to instream flow metrics and water quality parameters. The structural strategies considered include installation of Best Management Practices (BMPs) and Low Impact Development (LID) techniques. Tree planting was considered along degraded stream corridors to reduce stream temperatures.
The Study also includes analysis of several efforts and identified strategies considered discretionary by the Permit. These efforts include an evaluation of strategies to preserve or improve other factors that influence maintenance of the existing and designated uses of the stream system. Evaluation and prioritization of projects that preserve or improve instream habitat, wetlands, and riparian areas was performed. These projects directly support the objective of improving designated aquatic life uses in the stream system. King County assessed existing hydrologic, biologic, water quality, and habitat conditions in the study area to support strategy recommendations. Existing stream flow metrics, Benthic Index of Biotic Integrity (B-IBI) scores, concentrations of dissolved copper and zinc, temperature, and fecal coliforms were quantified and then utilized to develop and calibrate a continuous runoff model. This calibrated model was used to evaluate the effectiveness and estimated costs of proposed mitigation strategies under future land use conditions.1
The Study includes an implementation schedule and cost estimates of the identified structural and programmatic strategies that are expected to result in the achievement of
1 Future land use conditions were based on the full build-out of the most recent Comprehensive Plans (as of 2016) from King and Snohomish counties and the cities of Redmond and Woodinville.

DRAFT Bear Creek Watershed Management Study
King County Science and Technical Support Section 2 February 2018
the Study goals. The strategies and individual projects outlined in the Study are based on the best available current information. Adaptive management of the Study is recommended on a decadal timescale. Modifications to recommended strategies, projects, and schedule are anticipated as more information becomes available over time.
1.1 Permit and Project Background
The NPDES program was established by US Congress in 1972 as part of the Clean Water Act. The Clean Water Act allows the United States Environmental Protection Agency (EPA) to delegate NPDES permitting to individual states that meet specified requirements. The Washington State Department of Ecology (Ecology) issues municipal stormwater NPDES permits to municipalities, cities, counties, and special purpose districts in Washington State. The municipal stormwater permits require permittees to undertake efforts to reduce stormwater pollution by implementing best management practices (BMPs), which refer to a wide variety of pollution prevention systems or efforts.
King County’s current NPDES Phase I Municipal Stormwater Permit was issued by Ecology, effective August 1, 2013 through July 31, 2018, and was modified January 16, 2015. Section S5.C.5.c of the Permit requires King County to conduct a watershed-scale stormwater management planning effort. King County selected the Bear Creek watershed because the majority of the watershed is in unincorporated King County and it was identified by Ecology as a targeted watershed for stormwater retrofit planning due to its high integrity (Figure 1) (King County, 2015). The selection meets the Permit defined criteria for watershed selection and has been approved by Ecology2.
For this effort, the selected watershed (the study area) is defined as including Bear Creek and lands that drain to Bear Creek, with the following exclusions:
The Evans Creek basin (a tributary to Bear Creek) The reach of Bear Creek downstream of the confluence to Evans Creek, along with
small direct drainages and tributaries to this reach of Bear Creek Cottage Lake and the area that drains to Cottage Lake.3
About 2.4 square miles of the study area are in the City of Redmond, 1.1 square miles are in the City of Woodinville, 1.9 acres are owned by WSDOT, 3.7 square miles are in unincorporated Snohomish County, and 18.9 square miles are in unincorporated King County. The majority of the unincorporated King County area is designated rural except for about 1.9 square miles within the urban growth boundary (UGA) (Figure 1). Woodinville and Redmond are within the UGA. About 39 percent of the study area, including some unincorporated rural area, have existing densities greater than one house per 2.5 acres.
2 Scope of Work approved January 13, 2016 by Ecology (https://your.kingcounty.gov/dnrp/library/water-and-land/watersheds/sammamish/BC-Stormwater-Plan-related/BCP-SOW-approval-2016-01-16.pdf) 3 Drainages upstream of Cottage Lake are not included in the project area because Cottage Lake serves to substantially mitigate the effects of land use change upstream of the lake. Thus, selection of potential mitigation sites would be most effective downstream of Cottage Lake when focusing on Cottage Lake Creek.

DRAFT Bear Creek Watershed Management Study
King County Science and Technical Support Section 3 February 2018
Figure 1. Greater Bear Creek watershed, including Cottage Lake and Evans Creek drainage.
DRAFT Bear Creek Watershed Management Study
King County Science and Technical Support Section 4 February 2018
Substantial development has already occurred and more is expected in the Bear Creek study area. The study area currently is home to an estimated population of about 27,000 people. Land use, based on satellite imagery from 2011, is composed largely of a mixture of light urban, medium urban, deciduous/mixed forest, and grass. Future land use was estimated using current comprehensive land use plans, and the zoning regulations contained within them. Current land use regulations set limits for the amount of impervious surfaces allowed for a given density. Projected future land use assumes these limits will be reached reflecting the substantial growth pressures anticipated in this basin.
Bear Creek water quality monitoring data indicate that the creek does not meet water quality standards for several parameters. High levels of fecal coliform bacteria, elevated water temperatures, and low dissolved oxygen levels have been all documented. B-IBI scores, an indicator of overall stream health, are in the “Fair” range. Bear Creek supports a wide range of salmonids, including Chinook4, sockeye, coho, kokanee, steelhead, and coastal cutthroat.5 The Bear Creek watershed was identified by Ecology as a targeted watershed for stormwater retrofit planning6, with a watershed integrity index of 9 (based on a scale of 1 (low integrity) to 9 (high integrity)). An integrity index of 9 characterizes the basin as a high value resource and high potential to be restored. Ecology has also identified the mainstem of Bear Creek as requiring special protection vis-à-vis water temperature for native char, salmon, and trout spawning and incubation (Ecology, 2011a). Completing and implementing a watershed management strategy for Bear Creek would help preserve and restore these aquatic resources.
In September 2017, Snohomish County completed a stormwater management plan for the Little Bear Creek watershed within Snohomish County. The Little Bear Creek watershed is adjacent to the western boundary of the Bear Creek watershed. Snohomish County’s project was performed to meet the same Phase 1 NPDES municipal stormwater permit requirements applicable to King County. Snohomish County concluded that water quality standards could be met through a combination of development under existing stormwater regulations coupled with a significant Snohomish County capital program of low impact development BMPs, stormwater treatment and flow control BMPs, riparian planting, and continuation and potential expansion of program activities that target the reduction of fecal coliform bacteria. An important finding was that anticipated new development and redevelopment after full build-out in the Little Bear Creek study area resulted in improvements to B-IBI and temperature under current Snohomish County stormwater regulations.
4 Listed as threatened species under the Endangered Species Act 5 Kerwin, J., 2001. Salmon and Steelhead Habitat Limiting Factors Report for the Cedar - Sammamish Basin (Water Resource Inventory Area 8). Washington Conservation Commission. Olympia, WA 6 Assessed by Ecology in support of National Estuary Program Watershed Protection & Restoration Grant Program 2015 (http://www.ecy.wa.gov/puget_sound/docs/grants/2015TargetWatershedsStormwaterRetrofit.pdf)

DRAFT Bear Creek Watershed Management Study
King County Science and Technical Support Section 5 February 2018
1.2 Known Concerns in the Bear Creek Watershed
Through the analysis of existing and newly collected data, the Bear Creek technical team identified concerns, i.e., the problems preventing Bear Creek from fully supporting its existing and designated uses. Table 1 details the identified water quality and habitat quality problems in the Bear Creek study area.
Identified water and habitat quality concerns in the Bear Creek study area. Table 1.
Problem Rationale TMDL
a
Exists Reference(s)
Water Quality
Temperature and Dissolved Oxygen (DO)
Temperatures are too warm and DO too low to meet state water quality standards which support the designated salmonid use.
Yes
King County, 2017a,b;
Ecology, 2011b
Fecal Coliform Fecal coliform levels frequently exceed
the state water quality standard. Yes
King County, 2017a,b;
Ecology, 2011b
Metal Toxicants
Dissolved metals, specifically copper and zinc, found in stormwater runoff may cause surface water to exceed state standards. Cold and Mackey Creeks had exceedances of the state water quality standard for copper.
No
King County, 2017a;
Hobbs, et al. 2015;
King County, 2017h
Habitat
Riparian Corridor Degradation
Riparian corridors have been altered and degrading as development has occurred. Riparian forests provide important water quality (including stream shading) and habitat benefits.
Not applicable
King County, 2017c
Wetland Loss and Degradation
Wetlands have been altered and degrading as development has occurred. Wetlands provide important water quality, hydrologic, and habitat benefits.
Not applicable
King County, 2017d
Stream Flow Regime
Many parts of Bear Creek exhibit characteristics of a flashy stream system.
Not applicable
King County, 2017e,h
Instream Habitat and Fish Barriers
Instream habitat in Bear Creek has been identified as generally lacking in quantity, quality, and variety. Salmon and other aquatic life require a variety of habitat types. Additionally, fish passage barriers prevent movement in tributaries.
Not applicable
King County, 2017e
Biology

DRAFT Bear Creek Watershed Management Study
King County Science and Technical Support Section 6 February 2018
Problem Rationale TMDL
a
Exists Reference(s)
B-IBI
The average qualitative B-IBI score in the study area is considered “Fair.” The “flashiness” of a stream has been linked to “Poor” macroinvertebrate health as measured by B-IBI.
Not applicable
King County, 2017e,h
DeGasperi et al., 2009
a. Total Maximum Daily Load
1.3 Bear Creek 1990 Basin Plan
The Bear Creek Basin Plan was originally published in 1990. Elements of the basin plan were adopted by the King County Council in 1992 and 1995. The basin plan assessed the condition of the Bear-Evans Creek drainage basin and predicted future changes based on development patterns. The basin plan recommended ways to protect valuable stream, wetland and fishery habitat and reduce flooding, erosion and sedimentation. Regulations resulting from the basin plan included clearing restrictions, enhanced stream buffers, and advanced stormwater flow control. The basin plan may be responsible for the relative high quality of Bear Creek relative to other developed streams in the region. Unfortunately, there was not a comprehensive effort to track the implementation of the basin plan or to assess the effectiveness of the actions. The work completed for this Watershed Management Study examines existing conditions and identifies updated regulations, programs, and specific capital projects that are expected to result in Bear Creek supporting existing and designated uses. This Study has a narrower focus on the Bear Creek watershed, evaluation upstream of the Evans Creek confluence and not including Cottage Lake and its drainage.
1.4 Related Complementary Efforts
There are several other major efforts underway that will improve water and habitat quality in the Bear Creek watershed. The Study reviewed several of the major planned actions over the next 10 years and over $40 million may be expected to be invested in the Bear Creek watershed that will improve water and habitat quality. Additional investments are expected from projects and programs not reviewed as part of this Study.
1.4.1 WRIA 8 Chinook Salmon Conservation Plan
The WRIA 8 Chinook Salmon Conservation Plan recommends actions to restore and protect habitat that Chinook salmon need to survive in the Lake Washington / Cedar/ Sammamish Watershed, including Bear Creek.7 Between 2006 and 2015, over 85 projects have been completed, and another 90 projects (including 11 in the study area) are being implemented
7 http://www.govlink.org/watersheds/8/planning/chinook-conservation-plan.aspx

DRAFT Bear Creek Watershed Management Study
King County Science and Technical Support Section 7 February 2018
or advancing toward implementation. Between 2006 and 2015, WRIA 8 has guided the investment of nearly $11.3 million in state and federal funding and over $13.4 million in local funding to salmon habitat projects.
Over the next ten years, implementation of the WRIA 8 Plan’s recommendations for restoration on Bear Creek and Cottage Lake Creek could cost in the range of $8.5 to $12.9 million. Many of the acquisitions identified in the LCI are also WRIA priorities and are identified in the WRIA 8 Plan. In many cases, it is anticipated that restoration will follow acquisition; however, the restoration cost estimated above does not account for future restoration of lands that may be acquired through the LCI. Restoration projects on those acquired lands are not expected to occur within the next 10 years.
1.4.2 Monticello Creek Watershed Restoration Plan
The City of Redmond developed the Monticello Creek Watershed Restoration Plan in 2016 and 2017. Monticello Creek is a tributary to Bear Creek. The Monticello Creek Watershed Restoration Plan identifies potential stormwater retrofit and instream projects that will improve flow, water quality and habitat of the creek. The City of Redmond plans to complete design, then secure additional grant funding to install the three highest priority projects beginning in 2020. The City of Redmond expects to complete restoration efforts in the Monticello Creek watershed by 2025. The City of Redmond plans to undertake intensive monitoring of the stream’s response to restoration. Over the next 10 years, Redmond plans to spend $8 million for restoring Monticello Creek.
1.4.3 King County Land Conservation
King County and its advisory group has identified and prioritized conservation and preservation of 65,000 acres of critical natural lands and green spaces countywide. At the current level of investment, this objective is projected to be achieved in 70 years. King County Executive Dow Constantine has proposed an initiative to “finish the job of protecting our great places forever.” The Land Conservation Initiative (LCI) sets forth the goal of conserving and preserving the remaining high conservation value lands throughout King County within the next 30 years. In planning the LCI, King County staff and partners have identified 220 parcels totaling more than 900 acres of high conservation value land in the Bear Creek Basin, with an estimated cost of acquisition of approximately $61 million for a mix of fee title and conservation easements. If the LCI results in full funding for land conservation, in the next ten years King County and partners may be able to permanently protect 75 parcels totaling 300 acres at an estimated cost of $20 million. In all cases, acquisitions under the LCI would be voluntary on the part of the landowners.
1.4.4 King County Stormwater Facility Management
King County Stormwater Services estimates it may spend approximately $2.8 million in capital dollars for asset management of stormwater facilities within the Bear Creek Basin over the next 10 years. This assumes the current level of service funding allocation of

DRAFT Bear Creek Watershed Management Study
King County Science and Technical Support Section 8 February 2018
capital dollars to asset management of all stormwater facilities within the County prorated to the estimated proportion of stormwater facilities within the Bear Creek Basin. This estimate does not include the cost of retrofitting these stormwater facilities to meet a higher performance standard necessary to achieve Bear Creek flow control and treatment goals. The current allocation of capital dollars to Stormwater Services for retrofitting existing facilities and constructing new ones is approximately $970,000 for the biennium. This amounts to about $4.85 million over the next 10 years assuming the funding stays at status quo. A large proportion of this funding could be allocated to the Bear Creek Basin given that very little of it is currently committed to specific projects outside of the Basin beyond this biennium.
1.4.5 King County Roads Services
The Bear Creek study area contains approximately 120 miles of unincorporated King County roadway. This is eight percent of the roadway inventory in unincorporated King County. King County Road Services Division plans to perform $100,000 per year on maintenance, which may benefit water quality such as catch basin cleaning and street sweeping. The Roads Services Division also anticipates the investment of $1 million over the 10 years towards improvement to drainage systems, which would have a habitat and/or water quality benefits. Therefore, over the 10 year time period, $2 million may be invested in the study area. These estimates do not project potential emergent projects that may occur over the next 10 years, such as bridge replacements, slides, and other emergency type work.
1.4.6 Bear–Evans Multi-Parameter TMDL
The Bear–Evans Multi-Parameter TMDL covers the entire Bear Creek watershed, including both the Evans Creek and Cottage Lake sub-watersheds (Ecology, 2011b). The water quality concerns identified for improvement are temperature, dissolved oxygen, and fecal coliform bacteria. As part of the TMDL study, Ecology identified the pollution problems and specified how much pollutant loading needs to be reduced to achieve clean water. As a follow-up to the TMDL study, Ecology worked with the local community to prepare a Water Quality Implementation Plan detailing the specific actions needed to improve water quality in the basin. The plan describes management roles, activities, and schedules for partners. EPA approved the TMDLs in August and September 2008.
TMDL implementation is currently underway. Ecology and other watershed stakeholders are working on projects that are consistent with the Water Quality Implementation Plan. As part of its fecal coliform TMDL implementation plan, King County expects to spend approximately $2 million on source control in Bear Creek over the next 10 years.
1.4.7 Climate Change Impacts Study
Recent research has indicated that climate change may result in an increase of the frequency and intensity of extreme precipitation events (Warner et al., 2015). Design standards in existing stormwater manuals are based on historic rainfall patterns and may not provide sufficient protection for local water bodies as extreme precipitation events

DRAFT Bear Creek Watershed Management Study
King County Science and Technical Support Section 9 February 2018
become more frequent and intense. King County has partnered with the University of Washington Climate Impacts Groups to evaluate outputs from multiple global climate models. These model outputs will be used to obtain rainfall data at the proper scale to analyze local stormwater impacts in King County under several climate change scenarios. The analysis will be used to develop recommendations to modify the King County Stormwater Design Manual to account for changes in precipitation patterns.
1.5 Related Regulations and Code
King County, Snohomish County, City of Redmond, City Woodinville, and Washington State have established land use code and regulations to protect water and habitat quality in their jurisdictions, including the Bear Creek watershed. The most substantial regulations are the surface water management requirements, Critical Areas Ordinance, Growth Management Act, Shoreline Management Act, clearing and grading requirements, and the State Environmental Protection Act.
1.5.1 Surface Water Management Requirements
As development of the landscape occurs and changes the quantity and quality of surface and storm water runoff, great care must be taken to minimize the impacts of these changes to natural resources, public safety, and property. This necessitates the provision of surface and storm water management systems that not only mitigate such impacts but must comply with the NPDES General Municipal Stormwater Permit issued by the Washington State Department of Ecology pursuant to the Clean Water Act. Permitted jurisdictions have adopted Ecology’s Surface Water Design Manual or its equivalent. Current stormwater regulations that apply to Bear Creek watershed require that new development be mitigated in a manner that matches forested conditions by installing ponds, vaults, and flow control best management practices.
1.5.2 Critical Areas Ordinances
Critical areas are lands with natural hazards or lands that support certain unique, fragile or valuable resource areas. Lands designated by King County as critical include areas at high risk for erosion, landslides, earthquakes or flooding; coal mines; or wetlands or lands adjoining streams, rivers and other water bodies. The regulations protect critical areas as well as their buffers in order to protect public health and safety, and to promote environmental health in the region.
1.5.3 Growth Management Act
The Growth Management Act (GMA) is a series of state statutes, first adopted in 1990, that requires fast-growing cities and counties to develop a comprehensive plan to manage their population growth. A key mechanism in the comprehensive plans is placement of limitations on the amount of impervious surfaces allowed on an individual parcel tied to the size of the parcel. It is primarily codified under Chapter 36.70A RCW, although it has been amended and added to in several other parts of the RCW.

DRAFT Bear Creek Watershed Management Study
King County Science and Technical Support Section 10 February 2018
1.5.4 Clearing and Grading Requirements
Clearing and grading are activities associated with developing property for various commercial and residential uses. Clearing has to do with removing vegetation or other organic material and grading involves reshaping the ground surface. Clearing or grading proposals may need to be reviewed and a permit may be required before moving land in order to ensure the activity will not negatively impact the environment or existing structures.
1.5.5 Shoreline Management Act
In 1972, Washington State Voters approved the Shoreline Management Act by public referendum. The Shoreline Management Act has three broad policy goals: (1) Protect shoreline natural resources, (2) Promote public access, and (3) Encourage water-dependent uses. The Shoreline Management Act recognizes that "the shorelines of the state are among the most valuable and fragile of its natural resources." In order to protect this fragile resource, the Shoreline Act requires counties and cities to develop plans and adopt regulations to "prevent the inherent harm in an uncoordinated and piecemeal development of the state's shorelines." Shorelines of the state in the Bear Creek watershed include Bear Creek upstream to its confluence with Struve Creek, Cottage Lake Creek’s lower 1.3 miles, and Seidel Creek’s lowest mile, and Cottage Lake plus its adjacent wetlands. Areas regulated under the Shoreline Act include 200 feet from ordinary high water mark (OHWM).
1.5.6 State Environmental Protection Act
The State Environmental Policy Act (SEPA) process identifies and analyzes environmental impacts from governmental decisions. These decisions may be related to issuing permits for private projects, constructing public facilities, or adopting regulations, policies, or plans. SEPA review helps agency decision-makers, applicants, and the public understand how a proposal will affect the environment. SEPA can be used to modify or deny a proposal to avoid, reduce or compensate for probable impacts.
1.6 Study Development
The Study was produced by the Bear Creek team within the King County Water and Land Resources Division (WLRD) with considerable input from watershed jurisdictional partners, stakeholders, and external partners.
1.6.1 Watershed Partners
The watershed partners (the Partners) consist of representatives from each of the local governments located within the study area (Table 2).
Watershed partners. Table 2.
Jurisdiction Representative Title
City of Redmond Andy Rheaume Senior Planner

DRAFT Bear Creek Watershed Management Study
King County Science and Technical Support Section 11 February 2018
City of Woodinville Asha D’Souza Assistant Public Works Director
Tom Hansen (Retired) Public Works Director (Former)
King County Curt Crawford Stormwater Services Manager
Snohomish County Bill Leif Environmental Programs Compliance Specialist
Washington State DOT
Dick Gersib (Retired) Watershed Program Manager
Elsa Pond Statewide Erosion Control and Total Maximum Daily Load (TMDL) Lead
1.6.2 Technical Team
The technical team included staff from the Science and Technical Services (STS) and Stormwater Services (SWS) Sections within King County WLRD. Individual team members and their roles are detailed in Table 3.
Technical team members and respective association and roles. Table 3.
Team Member Title Primary Role(s)
Jeff Burkey Hydrologist Project Manager, watershed and stormwater modeling
David Batts Stormwater Engineer Stormwater facilities, regulation assessment
Sevin Bilir Hydrogeologist Public and stakeholder engagement
Steven Brady Ecologist B-IBI and flow assessment
Timothy Clark Limnologist Implementation and watershed Study. Water quality assessment and project prioritization
Jessica Engel Project Manager Funding strategy
Eric Ferguson Hydrogeologist Water quality assessment
Clare Jonson Stormwater Engineer Watershed Study
Josh Kubo Ecologist Salmonid habitat use assessment and project prioritization
Scott Miller Stormwater Engineer Watershed Modeling
Mark Preszler
Mapping & Information Management Coordinator
Mapping stormwater facilities
Jim Simmonds Supervisor Project oversight
Jen Vanderhoof Ecologist Riparian and wetland assessment and project prioritization
Mark Wilgus Stormwater Engineer Stormwater facilities, regulation assessment

DRAFT Bear Creek Watershed Management Study
King County Science and Technical Support Section 12 February 2018
1.6.3 External Participants Input
The Partners actively sought input from watershed residents, local groups and organizations, state and federal agencies, and tribal nations throughout the development of the Study. External input was sought to inform the Study and ensure that a multitude of perspectives were considered Public engagement events and distribution are summarized in Appendix E: Public Engagement Summary.
The following public engagement events were held:
Technical Workshop #1: November 4, 2015
Public Meeting #1: February 25, 2016
Public Meeting #2: October 13, 2016
Technical Webinars: November 15 and December 12, 2016
Technical Workshop #2: March 29, 2017
Public Meeting #3: Scheduled for March 2018
A summary of external partners that attended the Study engagement events are included in Table 4.
External partners included in Study workshops. Table 4.
Organization Type External Partner Group
Non-governmental organizations
Futurewise
Sno-King Watershed Council
Water Tenders
Trout Unlimited
Wild Fish Conservancy
Washington Environmental Council
Tribal Nations Muckleshoot Indian Tribe
State Agency
Washington State Department of Ecology (Ecology)
Washington State Department of Fish and Wildlife
Washington State Department of Natural Resources
Washington State Conservation Commission
Private Residents Persons residing in study area and surrounding region

DRAFT Bear Creek Watershed Management Study
King County Science and Technical Support Section 13 February 2018
1.6.4 Reports Supporting the Watershed Management Study
Table 5 lists and summarizes the eight reports published by King County that support the final Bear Creek Watershed Management Study.
Technical reports supporting the Study. Table 5.
Report Summary
Existing Water Quality Conditions (King County, 2017a)
Characterization of existing water quality conditions in the basin was based on sampling of storm events and base flow conditions between March 2015 and January 2016. In agreement with historic data for Bear Creek (King County, 2017b), temperature, dissolved oxygen, and fecal coliform bacteria were identified as water quality concerns due to exceedances of the state water quality standards. Adding to these concerns, this study identified exceedance of the state numeric criteria for copper in Mackey and Cold creeks during wet-weather flow.
Analysis of Long-term trends in Bear Creek Water Quality (King County, 2017b)
Water quality has improved in terms of some parameters and worsened for others. Fecal coliform and nutrient concentrations have decreased over the past three decades. Long-term trends in temperature and dissolved oxygen have indicated that conditions have worsened over the past four decades.
Assessment of Bear Creek Watershed Riparian Areas (King County, 2017c)
Riparian areas are important because of their role in the watershed’s hydrology and ecology. Mature native trees provide shade to streams, which help prevent increased temperatures. Change analysis shows ~22% less riparian tree cover in the study area than in 1972.
Assessment of Bear Creek Watershed Wetlands (King County, 2017d)
Wetlands are important because of their role in the watershed’s hydrology and ecology. There are approximately 330 mapped wetlands in watershed and likely many more unmapped wetlands. 20% of mapped wetlands were visibly altered since 1981-1990.
Bear Creek Watershed Juvenile Salmon Habitat Use (King County, 2017e)
Results from this study indicate that a variety of habitat types are needed to support the freshwater life stages of juvenile Chinook and coho salmon in the Bear Creek watershed. Juvenile salmonid habitat use and distribution appears to shift between different habitat types at different times of the year. Prior assessments of existing habitat conditions indicate degraded instream habitats in the Bear Creek watershed. Multiple factors affect Bear Creek habitat, including altered hydrology, the loss of channel complexity and connectivity, degradation of riparian areas, loss of large wood, and increased sedimentation.
Benthic Macro-invertebrate Status and Trends in the Bear Creek Study Area (King County, 2017f)
This report evaluates B-IBI scores in the context of land cover and stream flashiness in the Bear Creek study area. B-IBI scores showed a relatively strong correlation with land cover but showed weaker and more variable relationships with stream flashiness. B-IBI scores were also highly variable across sites, but relatively stable within a site over time. Thus, the capacity for B-IBI to respond to restoration efforts may be limited and/or require relatively long periods of time.

DRAFT Bear Creek Watershed Management Study
King County Science and Technical Support Section 14 February 2018
Report Summary
Stormwater Regulations History and Existing Stormwater Infrastructure in the Bear Creek Watershed (King County, 2017g)
The report summarizes current and past stormwater regulations and stormwater infrastructure development in the study area.
Watershed Model Development for Bear Creek Stormwater Retrofit Planning Project (King County, 2018)
This report details the development and calibration of the Hydrological Simulation Program—Fortran (HSPF) and System for Urban Stormwater Treatment and Analysis IntegratioN (SUSTAIN) models used to select stormwater BMPs for the Bear Creek study area.
1.7 Purpose and Structure of Watershed
Management Study
The purpose of this document is to describe stormwater management strategies that would result in hydrologic and water quality conditions that fully support designated and existing uses throughout the project area.
The Study includes the following components:
watershed goals and management objectives, and model metrics and targets (Chapter 2)
summary of existing watershed conditions (Chapter 3)
stormwater strategy development and prioritization (Chapter 4)
instream habitat strategy development and prioritization (Chapter 5)
wetland strategy development and prioritization (Chapter 6)
riparian corridor strategy development and prioritization (Chapter 7)
non-structural (programmatic) strategies not specific or unique to stormwater, instream habitat, wetlands, or riparian corridors (Chapter 8)
potential implementation framework (Chapter 9)
adaptive management and measuring progress and success (Chapter 10)
potential schedule, budget, and funding strategy for implementation (Chapters 11 and 12)
recommended next steps (Chapter 13)
Details on the prioritization of projects for stormwater, instream habitat, wetland habitat, and riparian corridor habitat are presented in Appendices A, B, C, and D. A summary of the public engagement activities as part of the development of the Study is presented in Appendix E. The identified stormwater strategies for the entire watershed are presented in Appendix F. The potential schedule and budget for mid- and long-term strategy

DRAFT Bear Creek Watershed Management Study
King County Science and Technical Support Section 15 February 2018
implementation is presented in Appendix G. A crosswalk detailing how the Permit requirements are met is presented in Appendix H.

DRAFT Bear Creek Watershed Management Study
King County Science and Technical Support Section 16 February 2018
(This page intentionally left blank).

DRAFT Bear Creek Watershed Management Study
King County Science and Technical Support Section 17 February 2018
2.0 WATERSHED GOALS, OBJECTIVES,
METRICS, AND TARGETS
This chapter defines the goals and management objectives for the Bear Creek study area, and details the metrics and targets that were used in the modeling assessment to determine strategy effectiveness.
2.1 Watershed Goals and Management Objectives
The goals and management objectives developed by the technical team and Partners are aimed at restoration of the stream to designated and existing uses (Table 6). The objectives include those with associated indicators specifically required to be assessed by the Permit (B-IBI, flow, and water quality) and others considered discretionary that nonetheless directly support the aim of restored uses and successful implementation.
Watershed goals, management objectives, and indicators. Table 6.
Goal Management Objective(s) Potential
Indicator(s)
Permit Required
Assessment?
Improve and maintain watershed functions in Bear Creek, including water quality, habitat, and hydrology
Minimize impacts of stormwater runoff on stream hydrology to promote stable stream morphology, protect habitat, and support biota
B-IBI Flow metrics
Yes
Provide for healthy habitat through protecting, restoring, and maintaining riparian buffers, wetlands, and instream habitat.
Area of riparian forest planted
Wood volume and number of pieces added to stream channel
Wetland inventory Tree cover
No
Restore quantity, quality, variety, and connectivity of instream habitat.
Acres of floodplain reconnected
Wood volume and number of pieces added to stream channel
Temperature - Number, location and area of thermal refugia created/restored
No
Minimize impacts to stream water quality from stormwater runoff.
Meet state freshwater quality standards (Temperature, dissolved metals, Turbidity/ Total suspended solids)
Yes

DRAFT Bear Creek Watershed Management Study
King County Science and Technical Support Section 18 February 2018
Goal Management Objective(s) Potential
Indicator(s)
Permit Required
Assessment?
Protect human health, safety, and property
Minimize human gastrointestinal health risk associated with recreational exposure
Meet state fecal coliform standard
Yes
Minimize human health risk associated with drinking water
Meet state drinking water quality standards
No
Minimize flooding to protect property and human health and safety.
Flooding damage No
Involve external partners in the protection, maintenance, and restoration of Bear Creek
Encourage the public to participate in watershed stewardship.
Public attendance at public meetings and workshops
Volunteers on public work days
No
Coordinate with partner jurisdictions on watershed management and restoration efforts
Meetings between regional partners
Joint projects/ programs
No
2.2 Watershed Model Metrics and Targets
A set of calibrated hydrologic models (HSPF) were used to project the values of selected water quality and flow metrics under various scenarios. Water quality and flow conditions from monitored streams were extrapolated to streams not monitored based on land use. The outputs of these models were used to evaluate the effectiveness of the identified structural strategies. Scenarios modeled include:
current conditions, fully-forested conditions, future conditions built out to current zoning, and future conditions with reduced impervious build-out.
Potential stormwater management scenarios were developed using SUSTAIN model optimization. SUSTAIN is a decision support system to facilitate selection and placement of stormwater Best Management Practices (BMPs) and Low Impact Development (LID) techniques in urban watersheds (King County, 2017f). In addition, SUSTAIN allows for analysis of cost-effectiveness. Details of scenarios, modeling input, and assumptions can be found in the Watershed Model Development for Bear Creek Stormwater Retrofit Planning Project report (King County, 2018).
The effectiveness of the developed mitigation scenarios was gauged on the degree to which identified targets for the flow, B-IBI, and water quality were achieved. Selecting mitigation strategies that achieve targets for multiple metrics provides additional confidence that the goal of restored uses will be achieved. Table 7 defines each of the model metrics and the associated target.

DRAFT Bear Creek Watershed Management Study
King County Science and Technical Support Section 19 February 2018
Flow, temperature, dissolved copper, dissolved zinc, total suspended solids (TSS), and fecal coliform were modeled using HSPF. B-IBI was estimated based on relationships with the High Pulse Count flow metric (i.e., the annual number of flow events exceeding twice the average streamflow). Turbidity was estimated based on its relationship with TSS in study area streams.
Numeric water quality standards from WAC 173-201A were used as targets for the temperature, dissolved copper and zinc, fecal coliform, and turbidity metrics. The B-IBI target score of 60 (on the 0-100 scale) corresponds with a stream health rating considered “Good” (Karr et al., 1986; Morely, 2000; King County, 2014).
The potential ecological benefits of habitat projects were not modeled with one exception: temperature changes resulting from proposed riparian plantings. It is likely that habitat and riparian restoration will positively impact nearby B-IBI scores, however, currently no research has been done that has established science-based correlations that allow for predictive modeling.
Metrics and targets used in the watershed model. Table 7.
Model Metric Description Estimation Method Target
B-IBI
B-IBI is a multimetric index based on benthic macroinvertebrate assemblage that quantifies the ecological conditions of streams in the Pacific Northwest.
Estimated based on relationship with stream High Pulse Count and was supported based on results from King County (2017f)
Score of 60 or greater (Good to Excellent) (based on 0-100 scale)
Flow Metrics
Four metrics of stream flashiness were calculated:
high pulse count (HPC),
high pulse duration (HPD),
high pulse range (HPR), and
TQ mean
Modeled using HSPF Meet flow metric thresholds associated with Good to Excellent B-IBI scores (see above)
Wate
r Q
uality
Temperature
Aquatic organisms, including salmonids, are sensitive to high water temperatures.
Modeled using HSPF Meet WAC Water Quality Standards:
For May 16 to Sept. 14: 7-DADMax ≤16 °C
For Sept. 15 to May 15: 7-DADMax ≤13 °C
Dissolved Copper
Copper, at elevated levels, poses toxicity to aquatic organisms.
Modeled using HSPF
Meet WAC Water Quality Standards:
Hardness-dependent, e.g, Hardness
(mg/L) Chronic (µg/L)
Acute (µg/L)
25 3.5 4.6
37.5 4.9 6.8
50 6.3 8.9

DRAFT Bear Creek Watershed Management Study
King County Science and Technical Support Section 20 February 2018
Model Metric Description Estimation Method Target
Dissolved Zinc
Zinc, at elevated levels, poses toxicity to aquatic organisms.
Modeled using HSPF
Meet WAC Water Quality Standards:
Hardness-dependent, e.g, Hardness
(mg/L) Chronic (µg/L)
Acute (µg/L)
25 32.3 35.4
37.5 45.5 49.9
50 58.1 63.6
Fecal Coliform
Fecal coliforms are indicator bacteria for human health risk related to fecal contamination.
Modeled using HSPF
Meet WAC Water Quality Standards:
Geometric Mean <50
90th Percentile<100
Turbidity
Water turbidity negatively impacts aquatic organisms by burying habitat via sedimentation, affecting sight-feeding animals, and may provide attachment places for other pollutants.
Turbidity was estimated based on relationship with modeled (HSPF) TSS values. (King County, 2017a)
Meet WAC Water Quality Standards:
If background ≤50: <5 NTU above background
If background >50: <110% of background
Note: 7-DADMax: seven-day moving average of daily maximum temperature
2.3 General Methods to Generate Priority
Strategies
The Permit requires that King County identify a stormwater management strategy or strategies that would result in hydrologic and water quality conditions that fully support “existing uses,” and “designated uses.” The habitat improvement strategies identified for instream habitats, riparian corridors (non-shading), and wetlands were an optional addition. Identification of stormwater, instream habitat, wetlands, and riparian corridors strategies was made based a variety of data, including:
existing and modeled future land use, water quality data, and hydrologic data, existing stormwater facilities, planned habitat projects, existing instream habitat, wetland, and riparian corridor conditions, and parcel data (property ownership [public vs. private] and assessed value).
Relevant elements of the aforementioned data were used to develop strategies that are expected to achieve watershed goals and objectives (Table 6). The data were also used to prioritize projects and/or geographic areas for implementation. These prioritizations were used to develop the schedule and budget (Chapter 11).
The Study evaluated both structural and non-structural strategies. Structural strategies are defined as constructed stormwater BMPs and habitat restoration projects. Non‐structural (programmatic) strategies encompass programs, actions, and code or policy changes that

DRAFT Bear Creek Watershed Management Study
King County Science and Technical Support Section 21 February 2018
affect runoff, pollution generation and treatment, and the health of instream, riparian, and wetland habitats. Other examples of non‐structural strategies include increased maintenance of storm drainage systems, inspection of septic systems, and education/outreach to watershed residents.
The structural and non-structural (programmatic) strategies for stormwater, instream habitat, wetlands, and riparian corridors are discussed in chapters 4, 5, 6, and 7, which also describe the data sources and prioritization methods. Chapter 8 details non-structural strategies that are not specific or unique to one subject area.

DRAFT Bear Creek Watershed Management Study
King County Science and Technical Support Section 22 February 2018
(This page intentionally left blank).

DRAFT Bear Creek Watershed Management Study
King County Science and Technical Support Section 23 February 2018
3.0 EXISTING CONDITIONS
This chapter summarizes the existing land use, water quality, hydrologic, stormwater facility, instream habitat, wetland, and riparian corridor conditions in the Bear Creek study area.
3.1 Land Use
Land use in the Bear Creek study area, based on satellite imagery from 2011,8 is composed of a mixture of low and open-space (non-building, pervious) development (48 percent), medium intensity development (4 percent), forest (40 percent), and wetlands (5 percent) (Figure 2). Grassland, pasture, cultivated crops, barren, and shrubland each make up 1 percent of the study area or less. Approximately 12 percent of the study area is impervious (Figure 3). Development is most concentrated in the City of Redmond, City of Woodinville, several unincorporated Snohomish County neighborhoods, and several unincorporated King County neighborhoods.
8 2011 Nation Land Cover Database land use represented the most recent available data during the time of analysis.

DRAFT Bear Creek Watershed Management Study
King County Science and Technical Support Section 24 February 2018
Figure 2. Bear Creek study area 2011 land use and land cover. National Land Cover Database – 98-foot resolution.

DRAFT Bear Creek Watershed Management Study
King County Science and Technical Support Section 25 February 2018
Figure 3. Bear Creek study area 2011 impervious areas. National Land Cover Database – 2011 Percent Developed Impervious Surface - 98-foot resolution.

DRAFT Bear Creek Watershed Management Study
King County Science and Technical Support Section 26 February 2018
3.2 Water Quality
Characterization of existing water quality conditions in the basin was based on sampling of storm events and base flow conditions between March 2015 and January 2016 (King County 2017b). The primary goals of the sampling effort were to characterize existing water quality during storm and baseflow events throughout the year to support calibration of a watershed model. In the model, conditions were extrapolated to non-monitored catchments based on land use. Thirteen sites were sampled during six baseflow and six storm events. Continuous flow and temperature gages were used to calculate instantaneous loading and temperature water quality standard exceedances. Historic water quality monitoring data from King County’s Routine Streams Monitoring Program (1970s through 2015) were reviewed as well (King County 2017a).
The study identified temperature, dissolved oxygen, and fecal coliform bacteria were identified as water quality concerns due to exceedances of the state water quality standards consistent with historic data for Bear Creek. Adding to these concerns, this study identified exceedance of the state criteria for dissolved copper in Mackey and Cold creeks during wet-weather.
Genetic analysis of water samples indicated the presence of human gut-associated bacteria in wet-weather samples from Lower Bear Creek, Mackey Creek, and South Seidel Creek. The relatively high levels of the genetic marker in Lower Bear Creek provides evidence of the presence of human feces, while the relatively low levels found in Mackey and South Seidel creeks are less compelling. Potential human fecal bacteria sources include illicit sewage connections, failing septic systems, leaking sewer pipes, homeless encampments without access to sanitary facilities, or human feces otherwise not deposited in a functioning sanitary system.
The study identified Monticello Creek as a major pathway of suspended solids during wet-weather flow. Monticello Creek’s instantaneous loads were similar to Middle Bear Creek and greater than Cottage Lake Creek, which make up most of flow entering Lower Bear Creek. Suspended solid loading from stormwater conveyance systems, bank erosion, and non-gaged tributaries were identified as additional important pathways to Lower Bear Creek.
Ecology has identified Bear Creek and several of its tributaries as impaired for temperature, dissolved oxygen, and fecal coliform bacteria. As noted in Chapter 1, Ecology developed the Bear–Evans Multi-Parameter TMDL for temperature, dissolved oxygen, and fecal coliform. Echo Lake, Lake Leota, and Paradise Lake are also listed as impaired due to elevated phosphorus levels.
3.3 Hydrology/B-IBI
The Puget Lowland B-IBI was developed in the 1990s as an integrative measure of the biological health of wadeable streams in the Pacific Northwest. B-IBI is an index composed of 10 metrics that characterize aquatic macroinvertebrate communities by measuring taxa

DRAFT Bear Creek Watershed Management Study
King County Science and Technical Support Section 27 February 2018
richness, relative abundance, and other ecological characteristics of stream macroinvertebrates. In 2014, the B-IBI was recalibrated from a range of 10-50 to 0-100. The recalibration improved the B-IBI as a strong indicator of conditions and its ability to detect changes in condition (King County, 2014). The 0-100 B-IBI scale was used in the analysis supporting this Study, where a score of 80 to 100 represents excellent condition, 60 to 80 is good, 40 to 60 is fair, 20 to 40 is poor, 0 to 20 is very poor.
B-IBI conditions and trends were assessed within the Bear Creek study area as part of the planning effort (King County, 2017f). Ecology has identified Bear Creek and Cottage Lake Creek as impaired in terms of low B-IBI scores. B-IBI was negatively correlated with both urban cover and road density in the surrounding landscape. These landscape features are important drivers of stream flashiness, which is negatively correlated with B-IBI scores. Within the study area, both the amount of impervious surface and stream flashiness have increased over time (King County, 2017f).
B-IBI is highly variable throughout the study area, and more generally, throughout the region. A range of B-IBI scores have been found in streams that appear healthy (i.e., characterized by low watershed imperviousness and stream flashiness). This is consistent with the regional pattern in B-IBI scores, wherein a small fraction of streams in undeveloped areas can have low scores, while a small fraction of streams in urbanized areas can have high scores. This variability does not indicate that the B-IBI is uninformative. Knowledge on the relationships of watershed land use and stream B-IBI conditions is imperfect and evolving.
3.4 Stormwater Facilities
The Bear Creek project team reviewed the history of stormwater regulations and existing stormwater infrastructure in the Bear Creek study area (King County, 2017g). The review accomplished the following:
tabulated an inventory of existing ponds and vaults in the Bear Creek Basin;
determined which version of the King County Surface Water Design Manual (SWDM) each stormwater facility was designed to meet;
summed the current stormwater detention storage in the basin provided by those facilities; and
projected the total stormwater detention storage that would be required for the basin’s developed surfaces based on current (2016) requirements. The projection was calculated by multiplying developed surfaces (impervious, grass, and pasture) in the basin by derived detention storage ratios.
Figure 4 presents the percentage of the 173 inventoried ponds and vaults in Bear Creek Study Area by SWDM date. Table 8 below summarizes key differences between the dated versions of the SWDM.
Key findings from this study effort include:

DRAFT Bear Creek Watershed Management Study
King County Science and Technical Support Section 28 February 2018
More than half of the existing inventory was built to pre-1990 standards, and about three-quarters of the existing inventory was built to the 1990 or earlier standards.
Approximately 179 acre-feet of detention storage is provided within the basin’s existing detention ponds and vaults. The current detention storage amount is roughly 10 percent of the estimated 1,598 acre-feet that would be needed to meet King County’s current default flow control standard for all developed surfaces in the basin.
52 percent of the existing pond facilities and vaults inventoried were developed prior to 1990 SWDM standards where formal water quality treatment was first required. This suggests a significant deficit in water quality treatment of developed surfaces in the basin.
There are very few flow control BMPs in the basin. Only 3.5 percent of the inventoried facilities were built to 2009 SWDM standards under which flow control BMPs were first designed to protect the hydrologic function of small streams. Flow control BMPs are likely critically important to address flashiness in Bear Creek and its tributaries, to cool receiving waters via infiltration of stormwater from developed surfaces, and to recharge groundwater.
Figure 4. Percent of existing stormwater ponds and vaults by Surface Water Design Manual
year.
Overview of SWDM requirements for stormwater facilities and BMPs. Table 8.
Design Manual Year
Flow Control Standard Water Quality
Pre-1990 Aimed to prevent flooding. No water quality treatment required.

DRAFT Bear Creek Watershed Management Study
King County Science and Technical Support Section 29 February 2018
3.5 Instream Habitat and Salmon Use
The Bear Creek watershed is an important salmonid bearing system in the greater Sammamish River geographic area. The various streams, lakes, and wetlands in the watershed support several salmonid species including Chinook (Oncorhynchus tshawytscha), sockeye (O. nerka), coho (O. kisutch), kokanee (O. nerka), coastal cutthroat (O. clarki), and steelhead (O. mykiss). Among the salmon species observed in the Bear Creek watershed, sockeye, coho, and Chinook are most numerous. Salmon spawn and rear throughout reaches in the Bear Creek watershed, with the majority of Chinook and sockeye spawning in mainstem channels of Bear and Cottage Lake creeks, and coho spawning in upper reaches of the mainstem and tributaries.
Juvenile salmon produced across mainstem and tributary spawning areas rear in habitats throughout Bear Creek. Results from King County (2017e) indicated that a variety of habitat types are needed to support the freshwater life-stages of juvenile Chinook and coho salmon. While the timing of habitat-specific use varies by salmon species, King County (2017e) indicated that as juvenile salmon grow and transition through early life stages, their habitat use and distribution appears to shift. Specifically, different habitat types appear to be used at different times of the year likely due to changing biological and behavioral patterns. In order to support the continuum of early life-stages for juvenile Chinook and coho salmon, a variety of freshwater rearing habitats are needed throughout the Bear Creek watershed.
Productivity and overall abundance of Chinook, coho, and sockeye has been much reduced from historic levels (Kerwin 2001, WRIA 8 Steering Committee 2005, WRIA 8 Salmon Recovery Council 2017). Salmon populations in Bear Creek are part of the WRIA (Watershed Resource Inventory Area) 8 populations which are considered depressed and in decline. Specifically, depressed Puget Sound Chinook populations, including those in WRIA 8, were listed as threatened in 1999 under the Endangered Species Act (ESA). Salmon in the Bear Creek watershed are at risk in large part due to reduced productivity, abundance, diversity, and spatial distribution attributed to habitat degradation throughout the watershed (WRIA 8 Steering Committee 2005, WRIA 8 Salmon Recovery Council 2017).
1990 Improved modeling methods (results in larger facilities
Added water quality treatment requirements.
1998 Improved to prevent erosion relative to existing conditions (results in larger facilities than 1990 SWDM)
2005 and 2009
Improved to require historic (forested)
conditions (results in larger facilities than
1998 SWDM)
Best Management Practices (BMPs)
and Low Impact Development (LID)
techniques incentivized and required at
maximum levels
2016 Requires maximizing the use of FCBMPs

DRAFT Bear Creek Watershed Management Study
King County Science and Technical Support Section 30 February 2018
Habitat degradation influences the diversity (quantity, quality, variety) and connectivity of instream habitats, which impacts both juvenile and adult salmon life-stages.
In an effort to evaluate the degree of habitat degradation in the Bear Creek study area, existing instream habitat conditions were summarized from prior assessments that focused on evaluating salmon habitat conditions (King County, 2017e). The Bear Creek watershed is a core area for Chinook use and has relatively higher levels of watershed function compared to much of WRIA 8 (Lake Washington / Cedar / Sammamish watershed). However, instream habitats within Bear Creek are still degraded compared to well-functioning and unmanaged forested basins. Factors like altered hydrology, the loss of channel complexity and connectivity, degradation of riparian areas, loss of large wood, and increased sedimentation appear to be associated with the decline of naturally produced salmon in the Bear Creek watershed (Kerwin 2001, WRIA 8 Steering Committee 2005, WRIA 8 Salmon Recovery Council 2017). Associated factors including increased water temperatures during the summer months, loss of shoreline complexity, instream barriers, and introduced fish and plant species also contribute to salmon decline.
Across the Bear Creek study area, Cottage Lake Creek and Upper Bear Creek have relatively higher levels of watershed function compared to Lower Bear Creek (WRIA 8 Steering Committee 2005, WRIA 8 Salmon Recovery Council 2017). Greater watershed function is largely attributed to lower percentages of impervious surface, fewer road crossings, and higher levels of forest cover and riparian forest (WRIA 8 Steering Committee 2005, WRIA 8 Salmon Recovery Council 2017). The hydrology of the Bear Creek watershed has been altered primarily due to land conversion from historic forests and wetlands to grass and impervious surfaces (King County 2000). This altered hydrology influences factors like recharge and infiltration, storm-flow volume and run-off rates, and the intensity and frequency of instream high flow events. Changes in these hydrologic responses has subsequently resulted in decreased habitat quality and quantity by influencing bank erosion, instream scour, wood residence time, and juvenile salmonid displacement (King County et al. 1989).
The loss of channel complexity and connectivity throughout the Bear Creek watershed is associated with channelization, the removal of large woody debris, clearing of the riparian corridor, and disconnection with floodplain and off-channel areas. Floodplain connectivity in Bear Creek has been impacted by confinement, channelization, and road crossings (Entranco 1994, King County 2000). Floodplain area has been significantly decreased due to the conversion of floodplain and riparian areas to residential and commercial development. The conversion of the floodplain and riparian areas has subsequently reduced the complexity and diversity of habitats in the Bear Creek watershed (King County 2000).
Instream habitat complexity in Bear Creek is limited due to an insufficient amount of large wood as well as poor pool quality and quantity (King County et al. 1994, Parametrix 2002). Large wood present in Bear Creek tends to be small in volume and low in frequency. Lower and Upper Bear creeks have less large wood than Cottage Lake Creek (King County et al. 1989) and the greater Bear Creek watershed has considerably lower wood volumes than

DRAFT Bear Creek Watershed Management Study
King County Science and Technical Support Section 31 February 2018
well-functioning and unmanaged forested basins (e.g., Fox and Bolton 2007). Removal of large wood from the stream reduces hydraulic diversity and alters sediment dynamics, decreasing the complexity and heterogeneity of available habitats (Maser et al. 1988, King County et al. 1989). Large wood maintains the hydraulic stability of critical instream habitat features, especially pools (Bilby and Ward 1991), and dissipates hydraulic energy during peak flows providing high-flow refuge for salmonids (Bilby 1984). Additionally, large wood provides excellent cover and habitat diversity for salmonids (Harmon et al. 1986).
Many fish barriers have been documented in the Bear Creek watershed, primarily in smaller streams in the upper reaches (inventory/locations of barriers were not included in this report). Documented passage barriers include culverts, dams, weirs, high velocity stream flows, beaver dams, and choking vegetation. The extent to which these barriers influence salmonids in Bear Creek is not fully known. However, it is likely that juvenile and adult life-history stages among many salmonids are influenced by these barriers.
3.6 Wetlands
Wetlands were mapped in the study area as part of the current conditions assessment (for details on wetland identification methods, see King County, 2017d). Seven different data sources were used from King County, Snohomish County, City of Woodinville, City of Redmond, and the National Wetland Inventory (NWI). The final combined, merged wetland dataset from the seven available data sources show 327 wetland polygons9 in the study area totaling 1,793 acres.
Additional analysis conducted for this Study and presented in Appendix C: Prioritization: Wetland Strategies included visual inspection of all wetland polygons using aerial imagery (no field surveys were conducted). Nine of the 327 wetland polygons in King County (2017d) were discovered to not be wetlands. There are likely more wetlands in the basin that are not mapped (errors of omission), and it is likely more mapped wetlands are not actually wetlands (errors of commission). The final map, which is used to identify known or potential wetland locations as well as generate the total area of wetland cover, is shown in Figure 5.
The available data indicates forested wetlands are the most common wetland type in the Bear Creek study area followed by scrub-shrub wetlands. The third most common type is emergent wetland. Open-water ponds are the least common type present.
9 Polygons are a GIS feature class used to represent features and areas, such as wetlands. Because of how the original wetland datasets were combined and merged, a single wetland polygon does not necessarily represent a single wetland – it may be several wetlands in a wetland complex, or it may contain surrounding upland area, depending on the accuracy of the original dataset. Because referring to these areas as “wetlands” implies a greater level of accuracy than is present, they are referred to as wetland polygons in this analysis. See King County 2017b for more detailed discussion of the original wetland datasets.
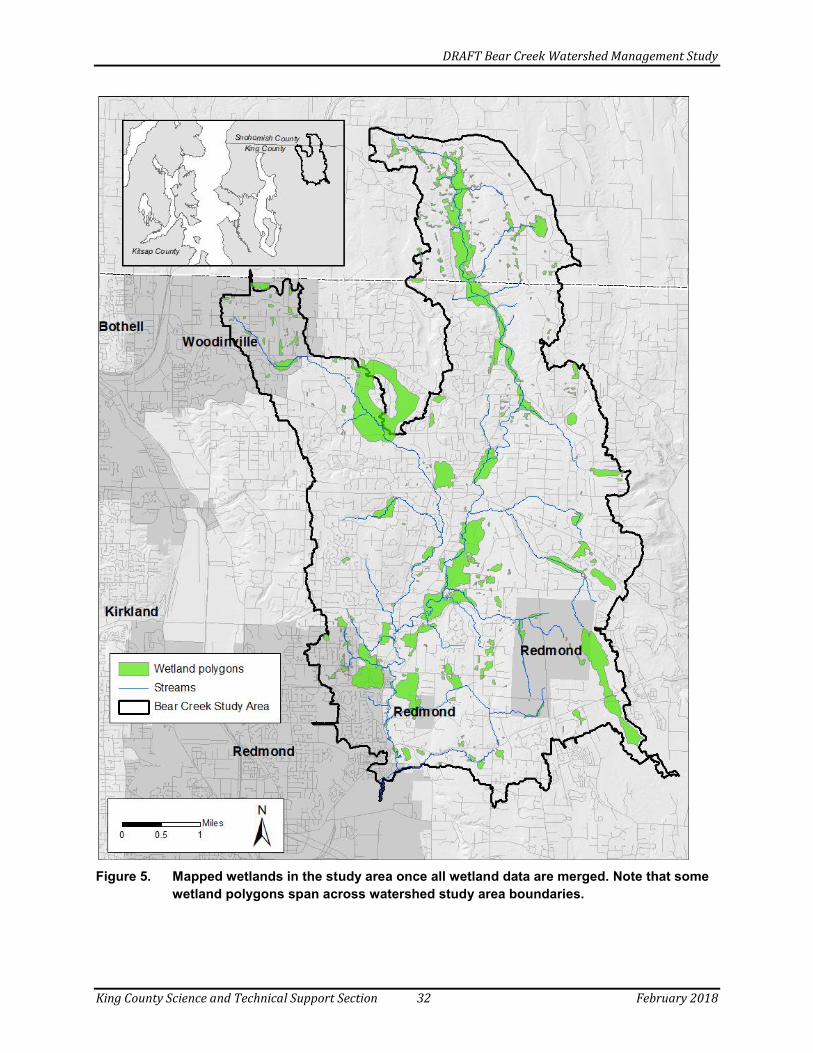
DRAFT Bear Creek Watershed Management Study
King County Science and Technical Support Section 32 February 2018
Figure 5. Mapped wetlands in the study area once all wetland data are merged. Note that some
wetland polygons span across watershed study area boundaries.

DRAFT Bear Creek Watershed Management Study
King County Science and Technical Support Section 33 February 2018
3.7 Riparian Corridors
King County mapped and assessed the current conditions of land cover in the riparian corridor based on 2015 aerial imagery10 (for details on riparian land cover mapping methods see King County, 2017c). The extent of the riparian corridor assessed is 200 feet on each side of the mapped stream center line (for a total of 400 ft) of salmonid-bearing streams11 (Figure 7). Changes in land use between 1972 and 2015 were also evaluated using 1972 aerial infrared imagery. The major findings from these analyses are:
As of 2015, 47 percent of the riparian corridor is forested or covered in trees, and 7 percent is impervious surface.
Approximately 15 percent of the riparian corridor has invasive species present (reed canarygrass and Himalayan blackberry were the only two invasive species mapped and analyzed for this study).
Of the 46.9 stream miles in the riparian study extent, 17.3 miles (37 percent) were identified as lacking shade on one or both sides of the stream channel.
Since 1972, the amount of disturbed areas (impervious plus Himalayan blackberry plus “Other”12) in the riparian corridor has increased from 13 to 27 percent. The amount of forest/shrub cover decreased from 69 to 58 percent.
10 2015 Natural color Pictometry, 0.25ft. 11 All known stream extents within the study area where Chinook, sockeye, coho, kokanee, steelhead, and cutthroat trout were recorded were included in this analysis. For a more detailed description of how the riparian study corridor was built, see King County (2017d). 12 Other may include bare areas, grass, mud, lawn/yard, landscaping, or roadside mowed areas.

DRAFT Bear Creek Watershed Management Study
King County Science and Technical Support Section 34 February 2018
Figure 6. Land cover in the riparian corridor of salmonid-bearing streams in the study area.

DRAFT Bear Creek Watershed Management Study
King County Science and Technical Support Section 35 February 2018
4.0 STORMWATER STRATEGY
IDENTIFICATION AND PRIORITIZATION
This chapter details the strategies for stormwater control and treatment and their prioritization. The goal is to restore, where feasible, ecologically functioning habitats. The objectives for stormwater projects/programs are to 1) meet state water quality standards in receiving waters (except temperature – see Chapter 7), 2) minimize impacts of stormwater runoff on stream hydrology to promote stable stream morphology, protect habitat, and support biota, 3) minimize human gastrointestinal health risk associated with recreational exposure, and minimize flooding to protect property and human health and safety.
4.1 Structural Stormwater Strategies
Poor water quality (temperature, dissolved oxygen, fecal coliform bacteria, turbidity, copper, and zinc) and altered hydrology are significant factors in causing Bear Creek and its tributaries to not meet their designated uses (King County, 2017a & 2017b). Both water quality and quantity concerns may be improved through stormwater management and treatment.
Stormwater BMPs include both low impact development (LID) type facilities, such as permeable pavement or bioretention systems, and more traditional facilities, such as stormwater detention and treatment ponds. LID BMPs generally address stormwater impacts near the source (developed land where rainfall is unable to infiltrate and/or is contaminated), and traditional facilities can either be local or more regional in nature, serving larger areas further away from the source. The mitigation provided by stormwater BMPs is readily modeled and comprised the primary management strategy used in the SUSTAIN optimization model scenarios.
The stormwater strategies presented in Table 9 were selected for evaluation for the watershed-scale modeling. Each strategy provides different levels of treatment over varying time periods and may be best suited for only certain types of land use. Table 9 is not an exhaustive list of all structural stormwater strategies – these are the strategies with adequate data (i.e., construction cost, treatment/control effectiveness) to be assessed in the SUSTAIN and HSPF models.

DRAFT Bear Creek Watershed Management Study
King County Science and Technical Support Section 36 February 2018
Strategies for improving stormwater quality and/or quantity. Table 9.
Strategy or Facility
Description
Design Drainage
Area Land Cover
Life Cycle
(years)
Metric(s) Affected
Permeable Pavement BMP
Porous pavement surface, often built with an underlying stone reservoir that temporarily stores surface runoff before it infiltrates into the subsoil. Sand filtration is part of the underlayment for water quality treatment. Porous pavement replaces traditional pavement, allowing stormwater to infiltrate directly into the soil.
Low traffic road surfaces, driveways, parking lots, and runoff from roofs and sidewalks
15 Flow/B-IBI Fecal Coliform Metals TSS/ Turbidity
Bioretention BMP (Raingarden)
Shallow landscaped depression designed to temporarily store and promote infiltration of stormwater runoff.
Roof, urban road, driveway, parking lots
50 Flow/B-IBI Fecal Coliform Metals TSS/ Turbidity
Roadside Bioretention Ditch (bioswale) BMP
Long, gently sloped, vegetated ditch designed to remove pollutants from stormwater. Grass is the most common vegetation, but wetland vegetation can be used if the soil is saturated.
Rural Road Sections
50 Flow/B-IBI Fecal Coliform Metals TSS/ Turbidity
Combination Detention/ Wet Pond Facility
Combined detention and water quality wetpool facilities have the appearance of a detention facility but contain a permanent pool of water as well.
all 30 Flow/B-IBI Metals TSS/ Turbidity
Wet Pond
Pond that retains a permanent pool of water (a "wetpool") at least during the wet season.
all 30 Flow/B-IBI Metals TSS/ Turbidity
Infiltration Pond
Constructed by excavating or constructing berms that allow for temporary storage of runoff while it is being infiltrated.
all 15 Flow/B-IBI Metals Fecal Coliform Temperature TSS/ Turbidity
Wet pond for gravity well
Pond that retains a permanent pool of water. Used here for pretreatment prior to infiltration via a gravity well.
all 30 Flow/B-IBI Metals Fecal Coliform Temperature TSS/Turb.
Gravity Well Infiltration
Also known as deep well injection. Surface water is directed into subsurface soils to infiltrate via an excavated shaft. Typically used to direct water past limiting non infiltrative layers to soils that infiltrate well.
all 50 Flow/B-IBI Metals Fecal Coliform Temperature TSS/ Turbidity
Cisterns
Collection system includes components such as a catchment area (typically a roof), gutters and downspouts, an above or below-ground cistern.
Roof* only 50 Flow/B-IBI
*Roofs are assumed to be non-Pollutant generating surfaces (NPGS).

DRAFT Bear Creek Watershed Management Study
King County Science and Technical Support Section 37 February 2018
4.2 Catchment Prioritization
The Bear Creek study area was divided into 87 drainage catchments for modeling and prioritization purposes. Most catchments were about 100 to 400 acres. The largest catchment modeled was 650 acres and the smallest catchment modeled was 10 acres. Catchments within each jurisdiction in the study area were prioritized for early implementation of proposed actions. Figure 7 provides an overview of the prioritization. Catchments were prioritized for focused action to increase the likelihood that stream quality and flow conditions would noticeably improve in those locations early in the implementation. Focused action would allow for the demonstration of success and provide learning opportunities to inform adaptive management of the Study. The prioritization method was developed based on stakeholder input and used a range of criteria. Criteria were developed that evaluated the number/severity of problems and potential opportunities for impactful/cost effective projects in the catchments. Priority catchments are those where the need is greatest and opportunities for cost effective improvement are more available based on criteria detailed in Table 10.
Individual catchments (as delineated for the HSPF and SUSTAIN models) were assessed. Eighty-seven (87) catchments were within the study area, including 6 in Redmond, 70 in King County, 3 in Woodinville, and 8 in Snohomish County (Figure 8). In some cases, several model catchments were grouped due to similar problems, opportunities, and identified strategies. The selected catchments are at a spatial scale that measurable outcomes would be expected if targeted projects were implemented.
Catchments with poor water quality and B-IBI score (i.e., with problems) were given more weight (i.e., a greater prioritization) than catchments with good water quality and B-IBI scores. Catchment opportunity is defined as the expected simplicity (or conversely, complexity) to which water quality projects could be implemented in the catchment. Catchments with greater opportunity were given more weight. The criteria used in the prioritization are detailed in Table 10. The prioritization score is the summation of the criteria scores, with higher values representing higher priority.
Catchment prioritization was completed for each jurisdiction. Catchments within multiple jurisdictions were assigned to the jurisdiction with the greatest geographic coverage. The prioritization metric employed is not fixed and may be altered in the future to fit specific jurisdictional goals. Within each catchment (or group of catchments), potential strategies and locations were identified. This may be helpful in the implementation of the Study.
Appendix A: Prioritization: Water Quality and Quantity Strategies provides further detail on the prioritization and scoring metric and details the priority catchments within each partner jurisdiction:
Four catchments (BEA120, BEA200, BEA300, and BEA740) and one group of catchments (BEA230/240/245/250) are prioritized for King County,

DRAFT Bear Creek Watershed Management Study
King County Science and Technical Support Section 38 February 2018
one catchment (BEA670) and two groups of catchments (BEA620/625/630 and BEA640/660) for Snohomish County,
three catchments (BEA840, BEA850, and BEA860) for City of Woodinville, and
four catchments (BEA010, BEA100, BEA110, and BEA190) and one group of catchments (MON) for City of Redmond.
Of the catchments not categorized as high priority, there are 67 catchments remaining in King County, two remaining in Snohomish County, none remaining in City of Woodinville, and one remaining in City of Redmond.

DRAFT Bear Creek Watershed Management Study
King County Science and Technical Support Section 39 February 2018
Figure 7. Stormwater structural strategy prioritization schematic.

DRAFT Bear Creek Watershed Management Study
King County Science and Technical Support Section 40 February 2018
Figure 8. Catchments included in prioritization for stormwater projects and the associated lead jurisdiction.

DRAFT Bear Creek Watershed Management Study
King County Science and Technical Support Section 41 February 2018
Criteria and datasets used to develop water quality/quantity prioritization. Table 10.
Criteria Explanation Data Source Important Limitations /
Caveats
Water Quality Conditions (Modeled Existing and Future [2050])
Number of modeled exceedances of water quality standards (temperature, turbidity, fecal coliform, copper, zinc) A greater number of exceedances may indicate a greater opportunity for improvement and are higher priority.
Data on modeled water quality were used to highlight areas of the watershed where conditions are not expected to support designated uses.
Water quality
conditions were
modeled using HSPF
from recent water
quality data at a select
number of sites.
Conditions were
extrapolated to un-
monitored catchments
based on land use.
Future conditions are
based on modeled
growth and
development.
B-IBI (Modeled Existing and Future [2050])
B-IBI associated with the modeled flow metrics in the catchment. Lower BIBI score may indicate a great need for improvement and are higher priority.
B-IBI is a multi-metric index that calculates a single, numerical score designed to represent information about the ecological health of a stream.
The modeled B-IBI
scores are based on
best-fit regressions
with flow metrics.
The flow metrics used
to estimate B-IBI were
modeled through
HSPF and SUSTAIN
based on land use,
stormwater facilities,
and monitored flows in
the basin.
Future conditions are
based on modeled
growth and
development.

DRAFT Bear Creek Watershed Management Study
King County Science and Technical Support Section 42 February 2018
Criteria Explanation Data Source Important Limitations /
Caveats
Untreated Impervious Area
Untreated impervious areas are a priority because stormwater may cause flashiness in streams in addition to delivering pollutants.
2011 National Land
Cover Database
Impervious Surface (30 m
resolution)
Mapped facility drainages
(King County and
Monticello Creek only)
Additional
development has
occurred between
2011 and 2017
Many stormwater
facilities drainage
areas are not mapped
and therefore
designated as
untreated
Not all stormwater
facilities may be
providing an adequate
amount of treatment
Existing Stormwater Facilities
Existing facilities are an opportunity for retrofitting to meet current stormwater design standards, improving both stream flashiness and water quality. Catchments with more existing facility are a higher priority.
King County Stormwater
Facilities Shapefile
(storm_fac_point –
accessed 2016)
Snohomish County
Drainage Inventory
City of Redmond (Pond
and swVault)
City of Woodinville
(sw_facility)
Existing facilities may
not be present in the
inventory.
Horse and Livestock (Forage) Land
Un-mitigated horses and livestock can have negative impacts on stream water quality due to bank erosion, runoff from manure, and low riparian and instream habitat complexity. They represent an opportunity to install agricultural BMPs through partnerships with landowners and the King Conservation District.
King County Agricultural Land Use 2013 (ag_landuse2013)
Existing agricultural
BMPs are not
available and were not
assessed.
Land use may have
changed between
2013 and 2017,
including conversion to
or from horse/livestock
land.

DRAFT Bear Creek Watershed Management Study
King County Science and Technical Support Section 43 February 2018
Criteria Explanation Data Source Important Limitations /
Caveats
Property Value
Catchments with low property values represent an opportunity to purchase property for the purpose of construction regional stormwater facilities in addition to instream and out-of-stream habitat improvement projects
King County Parcel
database using 2016
assessed values
Snohomish County Parcel
database using 2016
assessed values
Assessed value does
not always equal the
market value.
Willingness to sell was
not assessed.
Roof Area Building rooftops are opportunities for on-site stormwater management (e.g., rain gardens, cisterns, dry wells).
Puget Sound LiDAR Consortium
King County GIS
Older LiDAR data may not represent the current building roof footprint
Public Lands and Easements
Public lands and existing easements are a priority for stormwater and tree planting projects due to lower costs associated with construction and obtaining access.
King County Parcel
database
Snohomish County Parcel
database
Not all public land may
be suitable for
stormwater facility
construction or tree
planting.
Right-of-Ways Right-of-ways represent an opportunity to construct BMPs (or habitat projects) near roadways that can treat stormwater without purchasing private land.
King County Right of Way
Snohomish County Right
of Way
Not all right-of-ways are
suitable for stormwater
facility construction or
tree planting
4.3 Identified Structural Strategies
SUSTAIN optimization modeling was used to determine the number and type of structural strategies required to achieve instream targets (Table 7 in Section 2.2) for water quality and flow metrics for all catchments (see King County [2018] for a description of how the structural strategies were modeled). The structural stormwater strategies identified for the prioritized catchments are presented below. The structural stormwater strategies identified for the entirety of the study area are presented in Appendix F: Identified Structural Stormwater Strategies for Entire Study Area.
The priority catchment or catchment-groups, as identified in Appendix A: Prioritization: Water Quality and Quantity Strategies, are outlined in Figure 9 for each jurisdiction. Table 11 summarizes the BMPs identified in the priority basins and the costs associated with each. One or two of the prioritized catchments within each jurisdiction were selected for near-term (first 10 years) implementation.

DRAFT Bear Creek Watershed Management Study
King County Science and Technical Support Section 44 February 2018
The costs for King County, Snohomish County, and Woodinville priority catchments range from $9.0 to $58 million per square mile. Redmond costs ($132 to $976 million per square mile) are substantially more given the level of development and increased expense for installation of vaults rather than surface water ponds. The total structural stormwater capital costs (in non-discounted 2017 dollars) for the prioritized catchments by jurisdiction are:
King County - $94 million plus $1.3 million annual operations and maintenance
Snohomish County - $37 million plus $0.2 million annual operations and maintenance
Redmond - $171 million plus $0.4 million annual operations and maintenance
Woodinville - $15 million plus $0.2 million annual operations and maintenance
The Study identified five of the prioritized catchments that structural stormwater projects could be constructed in within the first 10 years of implementation. These catchments are BEA120 and BEA300 in King County, BEA640/660 in Snohomish County, MON in Redmond, and BEA850 in Woodinville. The near-term priority capital costs are $8 million for King County, $19 million for Snohomish County, $74 million for City of Redmond, and $5 million for City of Woodinville.

DRAFT Bear Creek Watershed Management Study
King County Science and Technical Support Section 45 February 2018
Figure 9. Prioritized catchments for stormwater projects and the associated lead jurisdiction.

DRAFT Bear Creek Watershed Management Study
King County Science and Technical Support Section 46 February 2018
Summary of BMPs recommended by catchment for priority basins (bold cells are recommended for near-term Table 11.implementation, i.e., 1-10 years).
Juris-diction
Catch-ment
Cost ($M) Area Bioretention
Roadside Bioretention Ditch Cisterns
Permeable Pavement
Gravity Wells
Infiltration Ponds
Dry+Wet Ponds
Wet ponds
Capital O&M (acres) (inches of storage) Units / acre (inches of storage)
King County
BEA120 $6.43 $0.09 241.1 0.048 0.008 0.004 0.066 0.025 0.041 0.172 0.093
BEA200 $13.88 $0.18 321.0 0.033 0.025 0.018 0.256 0.022 0.100 0.314 0.133
BEA230 $1.97 $0.03 43.9 0.034 0.056 0.010 0.301 0.114 0.112 0.000 0.255
BEA240 $5.68 $0.11 99.8 0.061 0.096 0.023 0.309 0.040 0.025 0.416 0.149
BEA245 $9.51 $0.16 117.4 0.142 0.055 0.026 0.474 0.102 0.210 0.152 0.317
BEA250 $43.42 $0.59 493.3 0.011 0.096 0.017 0.768 0.187 0.000 0.505 0.336
BEA300 $2.04 $0.03 62.7 0.049 0.013 0.007 0.105 0.048 0.315 0.000 0.030
BEA740 $10.88 $0.15 160.5 0.045 0.075 0.032 0.340 0.118 0.015 0.444 0.278
Red-mond
BEA010 $25.06 $0.07 44.2 0.198 0.068 0.154 0.212 0.158 0.167 0.000 0.463
BEA100 $21.88 $0.07 62.9 0.129 0.034 0.029 0.324 0.048 0.000 0.283 0.237
BEA110 $2.44 $0.00 64.1 0.001 0.000 0.007 0.000 0.437 0.000 0.000 0.000
BEA190 $47.53 $0.20 169.5 0.148 0.026 0.075 0.397 0.147 0.000 0.350 0.132
MON $73.90 $0.09 358.8 0.001 0.016 0.000 0.000 0.020 0.000 0.827 0.000
Snoho-mish
County
BEA620 $3.83 $0.03 46.1 0.038 0.003 0.005 0.072 0.043 0.748 0.514 0.202
BEA625 $3.88 $0.02 103.5 0.009 0.002 0.005 0.016 0.135 0.024 0.401 0.072
BEA630 $4.94 $0.04 168.3 0.021 0.004 0.001 0.013 0.006 0.015 0.458 0.044
BEA640 $2.32 $0.01 55.2 0.009 0.005 0.008 0.020 0.145 0.313 0.215 0.034
BEA660 $16.81 $0.09 1168.3 0.006 0.003 0.004 0.025 0.111 0.002 0.020 0.041
BEA670 $5.60 $0.04 185.1 0.009 0.010 0.007 0.018 0.049 0.000 0.417 0.070
Woodin-ville
BEA840 $3.87 $0.06 255.1 0.034 0.003 0.010 0.035 0.024 0.068 0.047 0.022
BEA850 $5.04 $0.03 246.7 0.012 0.003 0.002 0.016 0.049 0.210 0.024 0.053
BEA860 $6.21 $0.05 242.0 0.018 0.010 0.003 0.041 0.066 0.173 0.123 0.023
*Total area of catchment includes all land cover surfaces (e.g., Forest, wetland, developed, etc.). All costs are in 2017 dollars, no discount or inflation rate applied.

DRAFT Bear Creek Watershed Management Study
King County Science and Technical Support Section 47 February 2018
4.4 Identified Non-structural (Programmatic)
Strategies
Several non-structural strategies are identified. Non-structural strategies may be programs that identify or fund capital (structural) projects; studies that fill data gaps that will inform other programs; and programs that intend to result in behavior change and reduction in pollutant generation. Table 12 details each of the identified non-structural strategies. Septic inspections and repair are expected to continue as part of the existing King County Public Health program. However, the existing program requires inspections as part of property transfers and in response to problem calls. The Study identified that the existing inspection program could be expanded to include preemptive inspections of septic systems. King County Stormwater Services currently operates an ongoing illicit discharge detection and elimination (IDDE) program in Bear Creek as part of its TMDL requirements. A Fecal Bacteria Source Tracking Study with genetic analysis was identified to provide follow-up bacteria hot spots identified by the IDDE effort. The study could determine the relative contribution of fecal bacteria from several animals groups (e.g., human, rodent, bovine, equine, canine, and feline). Results of the study may be used to drive targeted septic inspections and other source control efforts. A public outreach/education program is also identified to improve stormwater quality in addition to the other topic areas (instream habitat, wetlands, and riparian corridors). The outreach/education program is detailed in Chapter 8.

DRAFT Bear Creek Watershed Management Study
King County Science and Technical Support Section 48 February 2018
Non-structural stormwater strategies. FTE-year: a single year of full-time employee work (one-time). FTE/year: an ongoing Table 12.year of full-time employee work (continuous).
Strategy Description Targeted
Metric/Benefit(s) Discussion Cost Jurisdiction
LID/ Flow Control BMP incentives/ technical assistance program for private properties.
Develop and implement a program to provide financial assistance, SWM fee discounts/rebates, and /or technical assistance to private property owners to disconnect impervious surfaces from direct drainage systems and infiltrate or disperse runoff via small scale BMPs
Target for full retrofit of single–family residences not projected to
trigger redevelopment requirements in 100 years.
B-IBI/Flow Flashiness
Stream temperature
TSS/Turbidity
Use program to engage and educate community regarding stormwater issues and how they can help restore the basin.
Likely will require program overhead/ staff and substantial subsidy (100%) due to lack of viable incentives. The payback period for BMP installation costs using SWM Fee discounts on residential lots is substantial. Ensures LID retrofitting occurs at a pace in line with the timeline. Relying on qualifying redevelopment of single family homes to provide LID retrofits would not achieve modeled LID need within timeline.
0.5 FTE–year (to develop program and secure funding) Estimated annual operating/ installation cost of program based on 1% of SFR inventory/year = $7.5 million
King County
City of Woodinville
In-Lieu Fee Program
If it is not feasible to install on-site stormwater management (LID) BMPs in a development project in accordance with existing regulations, the developer would pay a fee commensurate with the cost of constructing such BMPs. King County would use the revenue to fund stormwater mitigation and habitat projects in the watershed
B-IBI/Flow Flashiness
Metals
Stream temperature
TSS/Turbidity
Wetlands (in-lieu fee)
Instream habitat (in-lieu fee)
Riparian corridor (in-lieu fee)
This proposal does not change the existing stormwater standards. It would provide a funding source that could accelerate the pace at which King County could implement stormwater-related elements of the structural program described in Chapter 6.
0.5 FTE-year (to develop initial In Lieu Fee program)
King County

DRAFT Bear Creek Watershed Management Study
King County Science and Technical Support Section 49 February 2018
Strategy Description Targeted
Metric/Benefit(s) Discussion Cost Jurisdiction
Existing Stormwater Pond Optimization Program
Expand existing King County Stormwater Assets Management Program to focus pond optimization in priority catchments within the study area.
B-IBI/Flow flashiness
Metals
TSS/Turbidity
Evaluate the existing public inventory of stormwater ponds for opportunities to expand or optimize their function.
.25 FTE/year (part of existing Assets Management Program)
King County
Septic System Inspection Program
Expand existing King County Public Health program. Inspect a fraction of the total number of septic systems in the watershed each year.
Fecal coliform Current septic inspection programs are inadequate to preempt impacts to water quality.
Perform 50 inspections per year (~1% of septic systems) 0.10 FTE/year
King County
Flow Transfer Program Feasibility Study
Develop a report that evaluates the feasibility and benefits of setting up a flow transfer program whose goal is more rapidly achieving the implementation Study’s targets and/or metrics.
Potentially allows for more rapid retrofitting of a priority basin by transferring restorative mitigation from lower priority basins.
Redmond currently operates a trading program within its jurisdiction. More information is needed to determine if feasible for the rest of the watershed.
.25 FTE-year (to evaluate feasibility)
King County
Fecal Bacteria Source Tracking Study
Study of bacteria source types (e.g., avian, human, canine, bovine, feline) via genetic analysis of surface waters. Results will be used to identify target areas for source control (e.g., pets, livestock, septic).
Fecal coliform Work with the King County Microbial Source Tracking Program, Stormwater Services Illicit Connection/Discharge Elimination Program, and Public Health Septic Program
2 FTE-years over a 5-year period Approximately $50k (~300 samples) for monitoring
King County
Agricultural BMP Incentive Program Evaluation
Evaluate the efficacy of current agricultural regulations and programs toward improving in stream water quality in Bear Creek. Develop a ‘next steps’ plan towards aligning and/or improving regulations, program funding for improving water quality impacts from agricultural operations in the watershed.
Fecal coliform
Stream temperature
TSS/Turbidity
King Conservation District is a potential partner. Coordination with the King County Agriculture Program is important.
.25 FTE-year King County

DRAFT Bear Creek Watershed Management Study
King County Science and Technical Support Section 50 February 2018
(This page intentionally left blank).

DRAFT Bear Creek Watershed Management Study
King County Science and Technical Support Section 51 February 2018
5.0 INSTREAM HABITAT STRATEGY
IDENTIFICATION AND PRIORITIZATION
This chapter details the strategies for instream habitat projects and their prioritization. The goal of instream habitat projects is to improve and maintain riverine and floodplain conditions throughout the Bear Creek study area. While the habitat restoration projects do not have specific quantitative goals (see Chapter 2), the objective is to restore, where feasible, ecologically functioning habitats that support salmon and fish.
5.1 Structural Instream Habitat Strategies and
Restoration Projects
Salmonids depend on various habitat types throughout their life-cycle to support individual survival as well as population sustainability (Bjornn and Reiser 1991, Roni et al. 2014). The suite of habitats and associated environmental conditions experienced throughout their life-cycle subsequently influence the abundance, productivity, distribution, and diversity of salmonid populations (McElhany et al. 2000). The quantity, quality, and connectivity of these habitats are thus inherently critical to salmonid survival and productivity (Roni et al. 2014). Since salmonid growth and rearing in freshwater habitats have the potential to influence survival at later stages, it is critical to protect and restore freshwater habitats. As juvenile salmon grow and transition through early life stages, their habitat use and distribution appears to shift with different habitat types being used at different times of the year (King County 2017a). In order to support the continuum of early life stages, a variety of freshwater rearing habitats are needed throughout the Bear Creek study area. Freshwater habitat quantity, quality, and connectivity are inherently related to well-functioning riverine, floodplain, and riparian processes. Supporting these processes through protection and restoration strategies can promote the habitat conditions needed by juvenile salmonids. Critical salmonid life stages are sustained by protecting areas where habitat conditions are closer to well-functioning as well as actively restoring areas where habitat conditions are degraded. Protection strategies aimed at conserving well-functioning areas are discussed below in Section 5.4: Identified Non-structural (Programmatic) Strategies. In areas of Bear Creek where habitats have been degraded, instream restoration strategies are identified that focus on restoring habitat quantity, quality, variety, and connectivity. Restoration strategies suggested for the Bear Creek study area which promotes these habitat conditions and supports salmonid freshwater life stages are summarized in Table 13. Riparian reforestation is discussed in Chapter 7.

DRAFT Bear Creek Watershed Management Study
King County Science and Technical Support Section 52 February 2018
Restoration strategies and ecological benefits. Table 13.
Restoration Strategy
Salmonid Ecological Benefits*
Tributary Confluence Restoration
Provides rearing habitats, high-flow and predator refuge, areas of high food resource availability, potential cold water refugia, increased connectivity to habitat areas, and increased confluence habitat heterogeneity.
Wetland Connection
Provides connection to rearing and overwinter habitats. Improves water quality, hydrology, primary productivity, organic matter retention, and food resources availability.
Floodplain Connection
Reconnects lateral and floodplain habitats important for rearing and refuge, allows channel migration, restores longitudinal connectivity, supports transport of nutrients and sediment. Improves water quality, hydrology, water residence time, overbank fine sediment deposition, primary productivity, and organic matter retention.
Off-channel & Side-Channel Creation
Provides rearing and overwinter habitats, high-flow refuge, areas of food resource availability, spawning habitats, increases habitat heterogeneity and complexity.
Large Woody Debris Addition
Increases pool frequency/depth, woody debris, habitat heterogeneity and complexity, spawning gravel, sediment retention, and organic matter retention. Provides cover from predators, food recourses, and promotes hyporheic exchange.
Road/Bridge Crossing Improvements**
Improves channel and floodplain connectivity, fish passage and colonization, water quality, hydrology, and reduces sediment supply.
* Summarized from Roni et al. 2008, Rice et al. 2008, and Roni et al. 2014 ** Road/Bridge Crossing Improvements can be accomplished through various efforts and supports fish passage needs, as mentioned in Section 3.5.
Within the Bear Creek study area, one or more of the restoration strategies in Table 13 were included in an instream habitat project. Determination of habitat projects (i.e., which restoration strategies were included in a project) was based on the relative proximity/adjacency of a project area to floodplain features, wetlands, and landscape modifications (Table 14). Additionally, land-use and ownership was considered when selecting appropriate restoration strategies for a restoration project. Further discussion of how restoration projects were determined as well as how specific restoration strategies were selected for a given project is detailed in Appendix B.

DRAFT Bear Creek Watershed Management Study
King County Science and Technical Support Section 53 February 2018
Determinations of Which Restoration Strategies are included in Restoration Projects. Table 14.
Restoration Strategy
Determination of Inclusion in a Restoration Project
Data Source Important Limitations/ Caveats
Tributary Confluence Restoration
Proximity/adjacency to tributary confluences: areas around tributary confluences help to support tributary restoration and connection.
King County Streams and Rivers (King County GIS library)
Some tributaries may not be included in the streams and river inventory.
Wetland Connection
Proximity/adjacency to wetlands: areas around wetlands will help support wetland connection, creation, and restoration.
Bear Creek combined wetlands (from 2017 Assessment of Bear Creek Watershed Wetlands)
Limitation of wetland inventory discussed in Assessment of Bear Creek Watershed Wetlands.
Floodplain Connection
Available floodplain extents: areas where the floodplain is less constricted and has a greater extent will provide more area for floodplain connection.
King County 100 Year Floodplains, LIDAR, orthophotography, Bear Creek combined wetlands
Corrections to the 100 year floodplain were made to account for infrastructures, landscape features, and floodplain features.
Off-channel & Side-Channel
Creation
Proximity/adjacency to available floodplain extents: floodplain areas may have topographic and geomorphologic characteristics that support channel migration which help to create and connect off-channel and side-channel features.
King County 100 Year Floodplains, LIDAR, orthophotography, Bear Creek combined wetlands
Corrections to the 100 year floodplain were made to account for infrastructures, landscape features, and floodplain features.
Large Woody Debris
Addition
Proximity/adjacency to available floodplain extent as well as areas in public ownership and/or areas with minimal infrastructure: areas in public ownership or with minimal infrastructure may be best suited for large wood placement to ensure minimal risk of wood/river movement to infrastructures and public safety.
King County Public Lands Areas, King County 100 Year Floodplains, LIDAR, orthophotography, Bear Creek combined wetlands
Corrections to the 100 year floodplain were made to account for infrastructures, landscape features, and floodplain features.
A total of 65 instream habitat projects were identified throughout the mainstem of Bear and Cottage Lake Creeks. The upstream extents of all instream projects were based on the upstream extents of mapped floodplains as well as the upstream extents of salmonid use within the Bear Creek study area. A few restoration projects included only one strategy; however, the majority of restoration projects included several strategies. An abbreviated list of projects and specific restoration strategies is included in Table 15 and the comprehensive list is included in Appendix B.

DRAFT Bear Creek Watershed Management Study
King County Science and Technical Support Section 54 February 2018
Select Instream Habitat Restoration Projects in the Bear Creek Study Area. Table 15.
Project Sub-Basin Location Restoration Strategies
LB3 Lower Bear Creek Downstream of NE 95th St.
Tributary Confluence Restoration, Floodplain Connection, Off-channel & Side-Channel Creation, LWD Addition
LB4 Lower Bear Creek Between NE 95
th Street
and NE Novelty Hill Rd.
Wetland Connection, Floodplain Connection, Off-channel & Side-Channel Creation, LWD Addition
LB5 Lower Bear Creek Upstream of NE Novelty Hill Rd.
Floodplain Connection, Off-channel & Side-Channel Creation, LWD Addition
C7 Cottage Lake Creek
Upstream of NE 136th St.
Wetland Connection, Floodplain Connection, Off-channel & Side-Channel Creation
C9 Cottage Lake Creek
Adjacent to 194th Ave NE
Floodplain Connection, Off-channel & Side-Channel Creation, LWD
C20 Cottage Lake Creek
Upstream of NE 165th St.
Tributary Confluence Restoration, Wetland Connection, LWD Addition
UB4 Upper Bear Creek Upstream of NE 127th St.
Wetland Connection, Floodplain Connection, Off-channel & Side-Channel Creation, LWD
UB11 Upper Bear Creek Upstream of NE 141st St.
Wetland Connection, Floodplain Connection, Off-channel & Side-Channel Creation, LWD
UB17 Upper Bear Creek Upstream of NE 155th St.
Tributary Confluence Restoration, Wetland Connection, Floodplain Connection, Off-channel & Side-Channel Creation
The cost of restoration projects in similarly sized creeks average about $3,000,000 per river mile. Restoration projects identified for the mainstem Bear and Cottage Lake creeks range in estimated construction costs from $90,000 to $2,100,000. These approximated construction costs do not include any related acquisition costs, so a separate approach was used to estimate acquisition costs. The acquisition costs for a given project were estimated based on the average cost-per-acre for private parcels within a project area. The cost was based on the acquisition of only the fraction of the parcels within the proposed project areas and does not include acquisition of outside areas or built improvements. Acquisition costs for projects estimated for the mainstem Bear and Cottage Lake creeks range from $10,000 to $1,000,000. Appendix B provides further details on the specific instream habitat projects and their estimated costs.

DRAFT Bear Creek Watershed Management Study
King County Science and Technical Support Section 55 February 2018
5.2 Instream Project Prioritization
In order to determine the prioritization of individual instream habitat projects, each project was scored and ranked. The process of scoring and ranking instream habitat projects is outlined in the following discussion and detailed in Appendix B. A schematic of instream habitat scoring and prioritization is included in Figure 10 and relevant data sets are included in Table 16. Instream habitat projects within the Bear Creek study area were prioritized based on two main scoring criteria including a restoration value score as well as an opportunity/feasibility score.

DRAFT Bear Creek Watershed Management Study
King County Science and Technical Support Section 56 February 2018
Figure 10. Schematic of instream habitat project scoring and prioritization for the mainstem of Bear and Cottage Lake creeks.

DRAFT Bear Creek Watershed Management Study
King County Science and Technical Support Section 57 February 2018
Restoration value scores were based on three elements including: 1) the ecological value of a given project area, 2) the acreage of a given project area, and 3) the potential likelihood of fish use. The ecological value of a project area was based on the selected restoration strategies for a project areas and their relative impact on salmon habitat quality/quantity, variety, and connectivity. Project areas were grouped based on acreage (e.g., smaller, medium, larger) and scored based on the potential benefits to salmon habitat (i.e., larger project areas have greater benefits). Potential fish use was scored based on the location of instream projects across the mainstem of Bear and Cottage Lake creeks and the likelihood of juvenile and adult life-stages to use those reaches.
Opportunity/ feasibility scores were based on two elements including: 1) the land-uses within a given project area and 2) the adjacency of project areas to salmon habitat project locations listed in the WRIA 8 Chinook Salmon Conservation Plan (WRIA 8 Steering Committee 2005, WRIA 8 Salmon Recovery Council 2017). The land-use element of the opportunity/feasibility scores was calculated based on the percentage of a project area that was in land-use types which may be conducive to restoration strategies. Land-use types which may be conducive to restoration are discussed in Appendix B. The adjacency of Bear Creek project areas to listed WRIA 8 project locations was considered to increase the opportunity or feasibility of a given project area. Adjacency to WRIA 8 project locations increased the opportunity/feasibility scores since projects on the WRIA 8 Salmon Conservation list have had some degree of vetting, either through salmon recovery forums, through previous planning efforts, or through communication with local jurisdiction, habitat enhancement groups, or private property owners.
Once restoration projects along the mainstem of Bear and Cottage Lake creeks were given a restoration value score and an opportunity/feasibility score, the projects were divided into four prioritization categories (Figure 10. Each category indicated the relative prioritization of restoration projects, with specific projects being categorized as either higher priority, moderate - higher priority, lower - moderate priority, or lower priority. Within these prioritization categories, individual restoration projects can be ranked using the product of the restoration value score and opportunity/feasibility score (hereafter referred to as the ranking score). Project ranking scores can be organized by prioritization category or by sub-basin area (i.e., Lower Bear Creek, Upper Bear Creek, Cottage Lake Creek). Additionally, supplemental information can also be used to further inform project prioritization and ranking (included in “Additional Information” in Table 16). The criteria and elements used in restoration project prioritization and ranking are further detailed in Table 16 and Appendix B.

DRAFT Bear Creek Watershed Management Study
King County Science and Technical Support Section 58 February 2018
Datasets used to develop instream habitat prioritization. Table 16.T
yp
e
Criteria or Element
Explanation Data Source Important Limitations/ Caveats
Resto
rati
on
Valu
e S
co
re
Ecological Value
Based on the influence of a given strategy on habitat quality/quantity, habitat diversity, and habitat connectivity.
Ecological values for each restoration strategy were determined through communication with ecologists at King County Water and Lands Resources Division
The relative value of individual restoration strategies is subject to best professional judgement. Rationale for chosen values is included in Appendix B.
Project Area
Area score based on the acreage of a given project relative to other project areas in the Bear Creek study area.
Acreages of project footprint areas. Project area delineation discussed in Appendix B.
Project area may not fully reflect the upstream and downstream influence of a given restoration project.
Potential Fish Use
Potential likelihood of fish use within a given reach. Based on relative locations of projects within the Bear Creek study area.
Bear Creek restoration project locations and King County Streams and Rivers (King County GIS library)
Site-specific and reach-specific fish use is likely variable and based on relative adult and juvenile abundances.
Op
po
rtu
nit
y/F
easib
ilit
y S
co
re
Land-Use Type or Designation
Percentage of a project area that is in land-use types and designations which may be conducive to restoration strategies
King County Public Lands Areas, King County Public Benefit Rating System, King County Farm and Agricultural Use, King County Parks Properties (King County GIS library)
While certain land uses and designation may be more conducive to restoration strategies, the opportunities and feasibility of a given area has the potential to change over time.
Adjacent WRIA 8 Projects
Adjacency of Bear Creek project areas to salmon habitat projects listed in the WRIA 8 Chinook Salmon Conservation Plan
Appendix F of the WRIA 8 Chinook Salmon Conservation Plan: WRIA 8 Salmon Habitat Project List: Bear/Cottage Lake Creeks
Projects listed in Appendix F of the WRIA 8 Chinook Salmon Conservation Plan may or may not be completed.
Ad
dit
ion
al
Info
rmati
on
Ecosystem diagnosis treatment (EDT) ranks
Relative potential of a reach to improve salmon performance based on habitat conditions in the reach and the exposure of Chinook life stages to those habitat conditions.
WRIA 8 EDT Reaches:
Restoration Rank
EDT ranks correspond to reaches generally greater in length than project areas. Subsequently, there may be reaches where multiple restoration projects fall within a given prioritization rank.

DRAFT Bear Creek Watershed Management Study
King County Science and Technical Support Section 59 February 2018
Typ
e
Criteria or Element
Explanation Data Source Important Limitations/ Caveats
Water Quality and Habitat Problems Score
Frequency of water quality and habitat problems that occur within a project area
Bear Creek water quality
and habitat problems
heat map.
The frequency of water quality and habitat problems is highly dependent on the available extents and availability of various data sets.
Approximated Cost
Relative restoration costs of other King County Projects for similar sized creeks (cost estimate based on ~$3M per river mile)
River length derived from King County Streams and Rivers (King County GIS library)
Approximated cost does
not include related
property acquisition costs
5.3 Identified Structural Strategies
All of the 65 instream habitat projects identified for the mainstem of Bear and Cottage Lake creeks were prioritized (Figures 11-14; Table 17). Twenty one restoration projects were categorized as higher priority. Projects that ranked as higher priority have the highest restoration value scores and the highest opportunity/feasibility scores. These projects were identified to be the highest priority for restoration and protection in the Bear Creek study area since they have the greatest value and opportunity. Higher priority projects would result in the restoration of ~5.8 river miles. Fifteen restoration projects were categorized as moderate - higher priority. Moderate-higher priority projects have higher restoration value scores and lower opportunity/feasibility scores. These projects may require further private/public outreach as well as conservation/protection strategies (e.g., easements, Public Benefit Open Space Rating System (PBRS), acquisition, etc.) prior to restoration to help increase opportunities and feasibility. Moderate - higher priority projects would result in the restoration of ~3.8 river miles. Twelve restoration projects were categorized as lower - moderate priority. Projects that ranked as lower - moderate priority have lower restoration value scores but relatively higher opportunity/feasibility scores. Since these projects may be opportunistic/feasible but have less value, it may make sense to implement these project in concert with higher priority projects (when funding is available) to increase project connectivity and to increase the relative size of higher priority project areas. Lower - moderate priority projects would result in the restoration of ~2.0 river miles. Seventeen restoration projects were categorized as lower priority. Lower priority projects have relatively lower restoration value scores and lower opportunity/feasibility scores. Since these project rank lower, they are a relatively low priority among all projects but may help supplement habitat needs when other prioritized projects have been addressed.

DRAFT Bear Creek Watershed Management Study
King County Science and Technical Support Section 60 February 2018
Additionally, similar to moderate – higher priority projects, these lower priority projects may require further private/public outreach prior to implementation. Lower priority projects would result in the restoration of ~2.3 river miles. Across the mainstem of the Bear Creek study area, there were 31 identified road and/or bridge crossings. As discussed in Appendix B, road and bridge crossings were not included in the project scoring system, but rather highlighted as important and prioritized similarly across the Bear Creek study area. The ranking of individual restoration projects within a given prioritization category as well as within a given sub-basin area are included in Appendix B.

DRAFT Bear Creek Watershed Management Study
King County Science and Technical Support Section 61 February 2018
Figure 11. Bear Creek study area instream restoration project prioritization. No projects were identified upstream of Paradise Lake. Specific project numbers as well as road/bridge crossing projects are included in Figure 12-14.
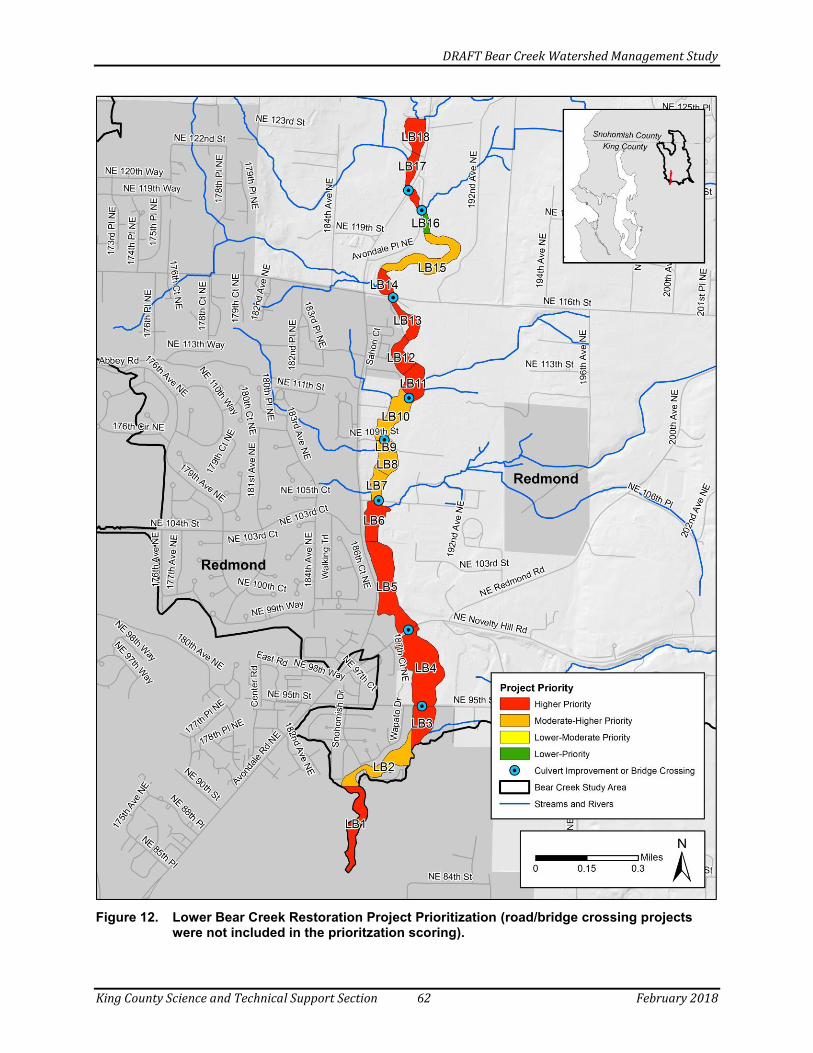
DRAFT Bear Creek Watershed Management Study
King County Science and Technical Support Section 62 February 2018
Figure 12. Lower Bear Creek Restoration Project Prioritization (road/bridge crossing projects were not included in the prioritzation scoring).

DRAFT Bear Creek Watershed Management Study
King County Science and Technical Support Section 63 February 2018
Figure 13. Cottage Lake Creek Restoration Project Prioritization (road/bridge crossing projects were not included in the prioritzation scoring).

DRAFT Bear Creek Watershed Management Study
King County Science and Technical Support Section 64 February 2018
Figure 14. Upper Bear Creek Restoration Project Prioritization (road/bridge crossing projects were not included in the prioritzation scoring).

DRAFT Bear Creek Watershed Management Study
King County Science and Technical Support Section 65 February 2018
Summary of instream habitat projects by waterbody. Table 17.
Sub-basin Area Priority Category Number of Projects
Lower Bear Creek
Higher 11
Moderate-Higher 6
Lower-Moderate 0
Lower 1
Sub Total 18
Upper Bear Creek
Higher 7
Moderate-Higher 5
Lower-Moderate 11
Lower 2
Sub Total 25
Cottage Lake Creek
Higher 3
Moderate-Higher 4
Lower-Moderate 1
Lower 14
Sub Total 22
Grand Total 65

DRAFT Bear Creek Watershed Management Study
King County Science and Technical Support Section 66 February 2018
5.4 Identified Non-structural (Programmatic)
Strategies
Protection strategies for the Bear Creek watershed may include continued or further implementation of land-use policies that protect habitat areas including regulatory mechanisms such as comprehensive plans, critical areas ordinance, shoreline programs, zoning regulations, stormwater management, and reduction of development impacts. Additional strategies aimed at protecting critical habitat areas include conservation easements and transfers/purchase of development rights, water rights and instream flow protection, best management practices and voluntary measures, as well as other strategies. Protection strategies are integral in ensuring that well-functioning area remain intact and help to minimize the net loss and degradation of available habitat areas. The location and impact of fish passage barriers were acknowledged data gaps. A potential path forward is to develop a plan to inventory and prioritize mitigation or replacement of fish barriers in the study area (Table 18). The mitigation plan would allow for prioritization for cost effectiveness. Fish habitat in the tributaries to Bear and Cottage Lake creeks were not evaluated as part of the Study. These tributaries may be assessed in the future (Table 18). Following the assessment, the compilation of potential instream habitat projects following the methods detailed previously in this chapter could occur. A public outreach/education program is also identified to improve stormwater quality in addition to the other topic areas (stormwater, wetland, and riparian corridors). The outreach/education program is detailed in Chapter 8.

DRAFT Bear Creek Watershed Management Study
King County Science and Technical Support Section 67 February 2018
Non-structural instream habitat strategies. FTE-year: a single year of full-time employee work (one-time). FTE/year: an Table 18.ongoing year of full-time employee work (continuous).
Strategy Description Targeted
Metric/Benefit(s) Discussion Cost Jurisdiction
Fish Passage Study and Mitigation Plan
Develop a plan to inventory and prioritize mitigation/replacement of fish barriers in the watershed.
Instream habitat Mitigation plan will allow for prioritization for cost effectiveness.
.25 FTE/year (to develop study and implement plan)
King County
Tributary Fish Habitat Assessment, Project Prioritization, and Implementation
Develop an assessment plan, apply the prioritization method described in Appendix B, and construct high priority restoration projects.
Instream habitat Fish habitat in the tributaries to Bear and Cottage Lake creeks were not evaluated as part of the Plan.
2 FTE-years (to assess and prioritize) The cost of the prioritized tributary habitat projects were not estimated due to limited information.
King County

DRAFT Bear Creek Watershed Management Study
King County Science and Technical Support Section 68 February 2018
(This page intentionally left blank).

DRAFT Bear Creek Watershed Management Study
King County Science and Technical Support Section 69 February 2018
6.0 WETLAND STRATEGY
IDENTIFICATION AND PRIORITIZATION
This chapter details the strategies for wetland restoration and conservation and their prioritization. The proposed wetland habitat strategies focus on restoring ecologic function throughout the watershed. There is no specific quantitative goal associated with the habitat projects (see Chapter 2). The goal is to restore, where feasible, ecologically functioning habitats. The objectives for wetland restoration are (1) to provide habitat supportive of aquatic, terrestrial, and avian life and (2) provide natural water quality treatment (not stormwater) and hydrology.
6.1 Structural Wetland Strategies
Wetlands provide a variety of ecological, water quality, and landscape services and functions. Services and functions provided by wetlands include (Michaud 2001):
protecting water quality by trapping sediments and retaining excess nutrients and other pollutants such as heavy metals.
providing flood protection by holding the excess runoff after a storm, and then releasing it slowly, thereby maintaining streamflows.
recharging groundwater systems/aquifers, which, in turn, provide water for drinking, irrigation, and maintenance of streamflow and lake and reservoir levels.
providing habitat for species of birds, fish, mammals, reptiles, and amphibians that rely on wetlands for breeding, foraging, and cover.
Wetland restoration is defined herein as the manipulation of the physical, chemical, or biological characteristics of a site with the goal of returning natural/historic functions to degraded or former wetland (definitions based on EPA, 2017). Restoration of a degraded wetland is referred to as wetland rehabilitation. Wetland rehabilitation is defined in this Study to include:
The repair of natural/historic functions of a degraded wetland. A gain in wetland function, but does not a gain in wetland acres. The planting native of vegetation (trees and shrubs) around the periphery of the
wetland in areas that are currently covered in grass, impervious surface, or some other non-native vegetation.
Restoration of a former wetland is referred to as wetland re-establishment. Wetland re-establishment is defined in this Study to include:
The return of natural/historic functions to a former wetland. The building of a functional wetland where one does not currently exist but did exist
within the past 100-200 years. A gain in wetland acres. The transformation of a wet field of reed canarygrass into a wetland with native
vegetation, potentially including an open-water component, and improved function.

DRAFT Bear Creek Watershed Management Study
King County Science and Technical Support Section 70 February 2018
Stormwater treatment wetlands may also be created to perform water quality treatment functions. Stormwater wetlands are typically constructed where no wetland previously existed. Site selection for created stormwater treatment wetlands was not in the scope of the Study.
Planting native vegetation for wetland rehabilitation typically consists of site preparation, purchasing the trees and shrubs, labor for doing the planting, and follow-up maintenance (e.g., watering, weeding). Wetland rehabilitation costs can vary widely based on site conditions. Average wetland rehabilitation costs in the Bear Creek study area are expected to be about $30,000 per acre13. The average cost does not include related property acquisition costs. Wetland re-establishment typically costs substantially more than wetland rehabilitation. Wetland re-establishment typically requires the use of earth-moving equipment to create shallow depressions. Wetland re-establishment costs can vary widely based on site conditions. Average wetland re-establishment costs are expected to be over $100,000 per acre. The average wetland re-establishment cost does not include related property acquisition costs.
6.2 Wetland Project Prioritization
Criteria from Cappiella et al. (2006) were adapted to use with wetland and landcover data to prioritize wetlands for restoration and conservation. Table 19 summarizes the criteria used to develop a point system for scoring each wetland and subsequently each parcel associated with the wetlands. Appendix C: Prioritization: Wetland Strategies provides detail on the methods and point system used to identify and prioritize wetlands for restoration and conservation.
For wetland restoration the scoring is intended to indicate greatest potential to rehabilitate one or more wetland functions. Prioritization is highest for wetlands that have:
the greatest value in terms of connectivity the least amount of impervious surface highest potential for improving water temperatures the greatest feasibility for planting (are publicly owned)
These criteria and associated scoring are intended to be used to get the most out of restoration dollars. Emphasis is placed on bog wetlands, those wetlands in public ownership, and wetlands lacking shade. Because bogs are the wetland type most sensitive to disturbance in the study area, they are assumed to be the most important to restore
13 Rehabilitation costs vary widely depending on site conditions and habitat type. Costs vary depending on the amount of site prep required, amount of weeding and watering afterwards, the trees and shrubs and what type they are (stake versus potted plant, and if potted, size of plant), and how many plants installed per acre. Costs also include all labor associated with site prep, planting, monitoring, and maintenance. Difficult site access or other extenuating circumstances can dramatically increase planting costs. Cost estimates can typically range between $15,000 and $36,000. $30,000 is assumed to be a conservative average estimate.

DRAFT Bear Creek Watershed Management Study
King County Science and Technical Support Section 71 February 2018
whenever possible. They are therefore a high priority for restoration. It is assumed that it will be much more feasible to conduct wetland restoration projects on public lands over private lands. Planting trees around a wetland lacking in native vegetation is assumed to provide both water quality and wildlife benefits.
For wetland conservation, emphasis is placed on bog wetlands for the reasons described above as well as those wetlands already in partial public ownership in native vegetation. If the wetland is already partially protected, conservation for the remaining portion is considered highly desirable because not only will the wetland be fully protected, but an increased area of connectivity is also protected.
Criteria used to prioritize wetlands for conservation and restoration. Table 19.
Criteria Definition Question
derived from criteria
Rationale Conservation / Restoration?
Type
Sensitive, locally rare, or difficult-to-replace wetland types. Prioritize bogs over other wetland types.
Is the wetland a bog?
Because of the sensitive and relatively rare nature of bogs, the point value assigned for them is high enough to elevate them to a top priority.
Used as criterion for both conservation and restoration.
Function
Lack of native vegetation present.
Does the wetland have reed canarygrass present? Is the wetland mowed on some portion of its shoreline?
(Surrogates for the following questions: Can water quality functions be improved? Can wildlife habitat functions be improved?)
The two primary wetland-related problems that may be addressed with rehabilitation (tree planting) are lack of shade and invasive species. Even in the absence of an open-water component, replacing reed canarygrass with native vegetation will improve wildlife habitat. However, planting trees along a shoreline is assumed to provide both water quality and wildlife benefits, hence the higher score for “mowed.”
Used as criterion for restoration.
Water is present.
Is there water present?
This question addresses both feasibility and the impact a planting project will have. If the wetland is an agriculture field full of reed canarygrass, planting trees will not results in cooling water temperatures. This element raises the priority for wetlands that have water present to some degree.
Used as criterion for restoration.

DRAFT Bear Creek Watershed Management Study
King County Science and Technical Support Section 72 February 2018
Criteria Definition Question
derived from criteria
Rationale Conservation / Restoration?
Condition
Good or Excellent condition.
What is the percentage of impervious land cover within 300 ft of the wetland?
No impervious surface within the buffer of a wetland should indicate a wetland in relatively better condition than those with buffers that do have impervious surface. Above 10 percent impervious surface in a wetland buffer area is assumed to degrade wetland condition.
Used as criterion for both conservation and restoration.
Connectivity
King County Wildlife Habitat Network intersects wetland or parcel associated with wetland.
Does the King County Wildlife Habitat Network intersect the wetland or parcel associated with wetland?
Regulated connectivity increases the wildlife habitat value of the wetland.
Used as criterion for both conservation and restoration.
Part of a wetland complex.
Is the wetland part of a wetland complex?
Wetland connectivity is very important for wildlife survival and biodiversity. But because of the limitations of identifying wetland complexes geospatially, the scoring for wetlands defined herein as being in a complex is relatively low. Additionally, many of the single wetland polygons are actually wetland complexes.
Used as criterion for both conservation and restoration.
Wetland is located fully or partially on protected lands.
Is the wetland already fully or partially protected (e.g., public lands, Tract parcels, Home Owners Associations (HOA), green space)?
If the wetland is partially protected, completing the level of conservation is considered highly desirable.
It is assumed that it will be much more feasible to conduct wetland restoration projects on public lands over private lands.
Used as criterion for both conservation and restoration.

DRAFT Bear Creek Watershed Management Study
King County Science and Technical Support Section 73 February 2018
Criteria Definition Question
derived from criteria
Rationale Conservation / Restoration?
Adjacent to other protected undeveloped open space (public lands, Tract parcels, HOA green space).
Is the parcel containing the wetland adjacent to other protected, undeveloped open space?
This attribute is already partially covered by tagging the wetlands for whether they are already protected. However, parcels play a role in connectivity and so are also scored for whether they are connected to other protected lands, because in some instances the parcels will be connected and the wetland will not have been.
Used as criterion for conservation.
Location in watershed
Located in headwaters.
Is the wetland located in headwaters?
Headwaters of streams impact water quality, including water temperature. Lowering a headwater wetland’s water temperature should also lower the stream water temperature.
Used as criterion for both conservation and restoration.
Located in areas of known high water temperature.
Does the stream water temperature exceed the standards?
If the wetland is located along a stream reach with elevated water temperatures, it is assumed that tree planting may help alleviate the high water temperatures.
Used as criterion for restoration.
Development pressure
Parcels are not currently subdivided as small as they may be.
Is the parcel containing the wetland currently not subdivided as small as it can be? That is, can the parcel be subdivided?
If the parcel associated with the wetland can be further subdivided, the development pressure is assumed to be higher than undividable parcels.
Used as criterion for conservation.
Special designation
Identified in riparian analysis (King County, 2017c) or King County Land Conservation Initiative (which includes salmon recovery priorities).
Are associated parcels identified as part of the riparian analysis (King County, 2017c), King County Land Conservation Initiative, or similar program?
Assumes that if there are multiple values associated with preservation versus only one conservation target, parcel is more valuable from a conservation standpoint.
Used as criterion for conservation.

DRAFT Bear Creek Watershed Management Study
King County Science and Technical Support Section 74 February 2018
6.3 Identified Structural Strategies
6.3.1 Restoration strategies
6.3.1.1 Rehabilitation
A total of 198 wetland polygons (“wetlands”), totaling approximately 1500 acres, were identified in the study area with some level of degradation. Of these 198 wetlands, 86 of them were degraded in ways that are not addressed in this Study. For example, many of these mapped wetlands are currently wet farm fields. Others are scrub-shrub wetlands with roads crossing through them. Of the other 112 wetlands, 67 were identified as having reed canarygrass present, and 55 were mowed along at least some portion of the edge plus 3 appeared to be degraded from livestock access (for a total of 58 generally referred to as “mowed”). These 112 wetlands are potential targets for rehabilitation in this Study. The distribution of the 112 is as follows:
King County: 89 Redmond: 4 Snohomish County: 15 Snohomish County and King County shared: 1 Woodinville: 3
Of the 58 wetlands identified as being mowed to the edge:
6 are fully on public property and 3 are partially on public property.
13 also have reed canarygrass.
5 are also in the riparian corridor (total of 8.4 acres in need of trees around the
wetlands).
2 have concrete paving around some of the edges, and one has a gravel driveway.
5 are ponds on golf courses.
Not including golf course ponds and lawns along residential lakes, approximately 34.5 acres could be planted in trees and shrubs around these “mowed” wetlands if all landowners fully cooperated (Table 20).

DRAFT Bear Creek Watershed Management Study
King County Science and Technical Support Section 75 February 2018
Acres of land, by jurisdiction and ownership, that would benefit from tree-planting Table 20.restoration. Includes areas around wetlands mowed to the edge of the open-water component and areas covered in reed canarygrass. For areas that are mowed and have reed canarygrass present, acreage is included with mowed wetlands. Area in this table does not overlap with restoration areas identified in Section 6.4, Riparian Restoration.
Of the 67 wetlands identified as having reed canarygrass present:
11 are fully on public lands, and 16 are partially on public property.
3 are beaver ponds, which pose extra challenges for tree plantings because they are
so wet.
25 do not have an open-water component associated with them, and approximately
8 of these are farm fields with no other indication of a wetland present beyond the
reed canarygrass.
Many of the wetlands that have reed canarygrass present but are not identified as being mowed to the edge are in stream riparian corridors, and there is no open water component to the wetland other than the stream. These riparian areas would benefit from tree planting. Many of these areas are captured in the riparian analysis (Appendix D – Prioritization: Riparian Corridor Strategies). Other areas with reed canarygrass but no “mowed edges” are farm fields. Planting trees in these farm fields would have terrestrial habitat benefits but likely very low benefits for wetland function. Reed canarygrass areas not associated with the riparian analysis, not included in the mowed estimates, and not including farm fields make up the 67 wetlands described above and total approximately 74 acres (Table 20). The cost of rehabilitation was evaluated for the 112 wetlands identified as having reed canarygrass or being mowed along at least some portion of the edge. Tree-planting projects are assumed to cost about $30,000 per acre in 2017 dollars. The cost of wetland rehabilitation on public lands throughout the study area is estimated to be $306,000 (Table 20). The total cost to rehabilitate wetlands on private lands (excluding any costs to acquire the land or easement to the land) is estimated to be $2.95 million. Wetlands were ranked for planting prioritization using the methods described in detail in Appendix C: Prioritization: Wetland Strategies. Figure 15 indicates a ranking of high, medium, low, and very low for restoration planting of the wetlands, where:
High = 110-165 points
Jurisdiction Mowed to edge (58 wetlands) Reed canarygrass (67 wetlands)
Total Public Private Est. Cost* Total Public Private Est. Cost*
King 30.5 2.7 27.8 $915,000 70.5 5.6 64.9 $2,115,000
Snohomish 1.8 0.0 1.8 $54,000 2.0 0 2.0 $60,000
Redmond 1.6 1.6 0 $48,000 1.5 0 1.5 $45,000
Woodinville 0.6 0.3 0.3 $18,000 0 0 0 $0
*Costs are estimated to be $30,000 per acre.

DRAFT Bear Creek Watershed Management Study
King County Science and Technical Support Section 76 February 2018
Medium = 70-105 points
Low = 20-65 points
Very Low = 0-10 points
It is useful to keep in mind that the entirety of a wetland does not necessarily need rehabilitation. Areas in need of rehabilitation may be small in relation to the size of the wetland. For example, a wetland polygon mapped in Snohomish County is 284 acres in size, but the size of the area in need of native tree planting is 37 acres.
Table 21 provides a sample of the highest ranked wetlands for rehabilitation in each jurisdiction and estimated cost per project. All information generated from this analysis for tree planting will be provided to all of the partnering jurisdictions.
Sample of highest ranked wetlands for rehabilitation for each jurisdiction. Whether the Table 21.
wetland has reed canarygrass present and/or is mowed to the edge are noted. Also presented are approximate sizes of areas to be planted associated with each wetland and cost estimate assuming $30,000 per acre.
Jurisdiction Wetland
ID Ranking
Wetland size
(acres)
Reed canarygrass
Mowed Acres to
be planted
Cost estimate
($)
King County
233 High 0.23 Yes Yes 0.10 3,000
215 High 308.38 Yes
37.3 1,119,000
118 High 79.79 Yes
**
105 High 6.64 Yes
3.69 110,000
23 High 0.06 Yes Yes 0.18 5,400
Redmond
103 High 9.94 Yes
**
62 High 3.15 Yes Yes 1.64 49,200
61 Medium 0.23 Yes
0.35 10,500
75 Low 2.77 Yes
1.11 33,300
Snohomish County
327 High 9.98 Yes
**
284 Medium 0.09 Yes
0.15 4,500
288 Medium 25.05
Yes ***
260 Medium 0.22
Yes 0.76 22,800
283 Medium 0.82 Yes
1.42 42,600
Snohomish Co. – King Co.*
323 High 284.84 Yes
**
Woodinville
240 High 0.06
Yes 0.33 9,900
213 Medium 17.70 Yes ***
223 Medium 0.43 Yes 0.26 7,800
*This is a large wetland complex that spans across county boundaries. **Captured in riparian analysis. ***These “wetlands” are residential lakes with numerous lawns along the lakeshore. These lawn areas were not tabulated for this exercise.

DRAFT Bear Creek Watershed Management Study
King County Science and Technical Support Section 77 February 2018
Figure 15. Prioritization of wetlands for rehabilitation strategies (tree planting).

DRAFT Bear Creek Watershed Management Study
King County Science and Technical Support Section 78 February 2018
6.3.1.2 Re-establishment
Wetland polygons were intersected with soil data to identify all potential mapped wetlands that intersect mapped hydric soils. All wetland polygons showing open water were removed from consideration, because a wetland typically already exists in those locations or they are addressed above under “Rehabilitation.” Wetland polygons showing native vegetation were removed from consideration under the assumption they may be forested or scrub-shrub wetlands. Nine wetlands remained for consideration of re-establishment.
Six of the 9 polygons are on farm fields or pasture, and 2 of the polygons are actually in a single farm field. Two of the areas have reed canarygrass. These 9 wetland polygons intersect a total of 15 parcels, and none are publicly owned. All of the potential re-establishment sites are all in King County’s jurisdiction.
These potential re-establishment sites could be evaluated further in the field to confirm assumptions based on mapping data and further evaluate restoration feasibility. If wetland re-establishment were to occur at any of these sites, excavation combined with native vegetation planting would transform these sites from fields to wetlands with habitat value, flood storage, and groundwater recharge functions.
6.3.2 Conservation strategies
A total of 588 parcels were identified that were associated with the 268 wetland polygons:
107 undeveloped privately owned parcels containing all or part of a mapped
wetland polygon.
462 developed residential parcels that might be candidates for conservation
easements or partial acquisition because they contain part or all of a wetland.
19 undeveloped forested parcels directly adjacent to parcels with wetlands.
17 parcels with easements already in place.
Wetland scores were combined with points from parcel-specific criteria to prioritize the parcels for conservation. The 588 parcels had scores ranging from 0 to 220. Parcels were ranked as high, medium, low, and very low, where:
High = 160-220 points
Medium = 80-150 points
Low = 20-70 points
Very Low = 0-10 points
Parcels that scored only 0 or 10 points are assumed to not be a priority for conservation. The distribution of parcels that scored at least 20 points for conservation is as follows:
King County – 335 parcels out of 409 scored; points ranging from 20 to 220
Redmond – 21 parcels out of 23 scored; points ranging from 20 to 80
Snohomish County – 71 parcels out of 94 scored; points ranging from 20 to 210
Woodinville – 22 parcels out of 62 scored; points ranging from 20 to 180

DRAFT Bear Creek Watershed Management Study
King County Science and Technical Support Section 79 February 2018
Undeveloped parcels are candidates for acquisition or easement; cost analyses assume acquisition, which is more costly. Parcels with development are assumed to be candidates for easements and not acquisitions, though there may be some circumstances when a developed parcel is purchased and any structures demolished. Costs of acquisition were calculated by first obtaining the combined assessed land value and assessed improved value (value of improvements, such as houses) from King County parcel data and the combined market land value and market improved value from the Snohomish County parcel data. Next, a multiplier of 115 percent14 was applied to those values to account for the difference between the assessed value and appraised value. Costs of easements were calculated by taking the assessed land value from King County parcel data and the market land value from the Snohomish County data and using a multiplier of 40 percent15. Easement calculations assumed less than half the parcel would be put in easement. For the cost analysis, in all instances where parcels in the riparian analysis in Section 7.3 overlapped parcels in this wetland analysis, they were removed from this wetland analysis. A total of 126 parcels were identified for potential wetland acquisition (had no development). Sixty-four (64) of those parcels were also identified in the riparian analysis for acquisition. This wetland cost analysis for acquisition only includes the remaining 62 parcels. Costs for acquisition for each partner jurisdiction are present in Table 22. Costs were separated out for priority basins in addition to the priority ranking described in this strategy. Total costs for acquisition in priority basins and remaining High and Medium ranked parcels would be approximately $5,520,000.
14 15 percent is added to the assessed value because appraisals were running higher than assessed value by about 15 percent in 2015 and 2016. 15 40 percent assumes the following: (a) the amount of the parcel that would be placed under easement would be less than 50 percent and more than 1 percent, and 25 percent is the average between 1 and 50, and (b) 15 percent is added to the 25 percent to account for the difference between assessed value and appraised value.

DRAFT Bear Creek Watershed Management Study
King County Science and Technical Support Section 80 February 2018
Cost estimates for all 62 parcels identified for potential acquisition. Priority Table 22.catchments described in Section 4.2 are identified separately.
Prioritization Ranking Catchment Cost
number of parcels
King County
High All others $1,431,000 4
Medium BEA120 $99,000 1
Medium All others $2,650,000 9
Low BEA120 $86,000 1
Snohomish County
High BEA660 $600 1
High All others $1,000 1
Low BEA660 $488,000 2
Very Low BEA660 $264,000 1
Unknown BEA660 $289,000 3
Woodinville
Very Low BEA850 $210,000 1
A total of 462 parcels had some development on them and thus were identified for potential wetland easements. One hundred and eighty-seven (187) of those parcels were also identified in the riparian analysis for easements. This wetland cost analysis for easements only includes the remaining 275 parcels. Costs for easements for each partner jurisdiction are presented below in Table 23. Costs were separated out for priority basins in addition to the priority ranking described in this strategy. Total costs for easements in priority basins and remaining High and Medium ranked parcels would be approximately $11,190,000.

DRAFT Bear Creek Watershed Management Study
King County Science and Technical Support Section 81 February 2018
Cost estimates to for all 275 parcels identified for potential easements. Priority Table 23.catchments described in Section 4.2 are identified separately.
Prioritization Ranking Catchment Cost
number of parcels
King County
High All others $1,632,000 12
Medium All others $6,835,000 48
Low BEA120 $205,000 2
Redmond
Medium All others $975,000 10
Snohomish County
High BEA660 $410,000 5
High All others $183,000 2
Medium All others $112,000 1
Low BEA660 $581,000 6
Very Low BEA660 $252,000 3
6.4 Identified Non-structural (Programmatic)
Strategies
Underlying the implementation of structural wetland strategies detailed in this chapter, three programs are identified (Table 24). King County may coordinate with internal and external conservation programs to acquire and preserve identified priority open space lands that align with recommended mitigation of the basin (e.g. wetland mitigation, expansion, and connections; riparian buffer planting). Examples of conservation programs include King County Acquisitions, the Nature Conservancy. King County is pursuing expanded funding via the Land Conservation Initiative (LCI). A tree-planting incentive program was identified. A potential program could provide private individuals and businesses with incentives (such as SWM fee reduction) and technical assistance to plant trees degraded wetland perimeters within their property. Coordination with the existing mitigation banking program may also assist with reaching objectives. A public outreach/education program was identified to improve appreciation of wetlands and desire for landowners to protect or restore them in addition to the other topic areas (stormwater, instream habitat, and riparian corridors). The outreach/education program is detailed in Chapter 8.

DRAFT Bear Creek Watershed Management Study
King County Science and Technical Support Section 82 February 2018
Non-structural strategies for wetland restoration and conservation. FTE-year: a single year of full-time employee work (one-Table 24.time). FTE/year: an ongoing year of full-time employee work (continuous).
Strategy Description Targeted
Metric/Benefit(s) Discussion Cost Jurisdiction
Tree Planting Incentive Program (Also part of riparian strategy)
Develop and implement a program to provide financial assistance, SWM fee discounts/rebates, and /or technical assistance to private property owners to plant trees, especially in the riparian area.
B-IBI/Flow Flashiness
Stream temperature
Instream habitat
TSS/Turbidity
City of Redmond currently operates a tree-planting incentive program in its jurisdiction. Can leverage King County’s One Million Trees Initiative
.25 FTE-year (to develop program) .25 FTE/year (to implement program)
King County
Preservation and Acquisition of high priority open space (Also part of riparian strategy)
Coordinate with internal and external conservation programs to acquire and preserve identified priority open space lands that align with recommended mitigation of the basin (e.g. wetland mitigation, expansion, and connections; riparian buffer planting).
Wetlands
Riparian corridors
Purchase or easement of/on critical properties at a faster pace before further development occurs will ensure that critical mitigation projects can be accomplished.
Examples of conservation programs include KC Acquisitions, Nature Conservancy, etc. KC is pursuing expanded funding via the Land Conservation Initiative (LCI).
.10 FTE/year King County
Mitigation Banking (Also part of riparian strategy)
Identified wetland and/or riparian projects in the plan use KC existing banking programs as a method of funding critical projects.
Wetlands
Riparian corridors
This type of program could essentially pay for an identified critical wetland or riparian project by selling mitigation credits to developers in the watershed.
N/A King County

DRAFT Bear Creek Watershed Management Study
King County Science and Technical Support Section 83 February 2018
7.0 RIPARIAN CORRIDOR STRATEGY
IDENTIFICATION AND PRIORITIZATION
This chapter details the strategies for riparian corridor restoration and conservation and their prioritization. The proposed riparian habitat strategies focus on restoring ecologic function throughout the watershed. There is no specific quantitative goal associated with the habitat projects, with the exception of temperature reduction associated with riparian shading (see Chapter 2). The goal is to restore, where feasible, ecologically functioning habitats. The objectives for riparian corridor restoration are (1) to provide stream shading for attaining temperatures within state water quality standards and (2) to provide habitat supportive of aquatic life.
7.1 Structural Riparian Corridor Strategies
The riparian zone or area is the interface between land and a natural body of water. Natural riparian areas provide a wide range of highly valuable ecological functions. Healthy riparian areas are vegetated in native trees and shrubs. They help maintain good water quality by filtering nutrients, sediments, and pathogens before they reach waterways. Healthy riparian areas are important habitats for a wide range of wildlife (Knutson and Naef 1997) and are considered essential for sustaining wild fish populations (Naiman et al. 1993). Healthy riparian areas:
improve water quality by filtering pollutants
reduce stream bank erosion
increase instream shade, which helps water temperatures from increasing, which in turn supports the higher dissolved oxygen levels important to salmonids
provide a source for the natural recruitment of large wood into streams to create channel complexity needed for salmonid refugia and protection from predators
provide over-hanging vegetation, a source of food (invertebrates) for juvenile salmonids
Restoration of riparian areas means replacing existing non-native vegetation or other land cover with native trees and shrubs within the riparian corridor. In this Study, the riparian corridor is generally defined as the 165-ft buffer on each side of all streams in the study area with salmonid presence (see King County 2017c). As with wetland vegetation planting, riparian planting costs are variable based on existing conditions. Riparian planting projects are expected average about $30,000 per acre16, not including related property acquisition costs.
16 Rehabilitation costs vary widely depending on site conditions and habitat type. Costs vary depending on the amount of site prep required, amount of weeding and watering afterwards, the trees and shrubs and what type they are (stake versus potted plant, and if potted, size of plant), and how many plants installed per acre. Costs also include all labor associated with site prep, planting, monitoring, and maintenance. Difficult site

DRAFT Bear Creek Watershed Management Study
King County Science and Technical Support Section 84 February 2018
7.2 Riparian Corridor Prioritization
Criteria from Cappiella et al. (2006) were adapted to use with riparian and landcover data to prioritize the riparian corridor in the Bear Creek study area for conservation and restoration. Table 25 summarizes the criteria and rationale used to assign a point system for parcels along the riparian corridor. Appendix D: Prioritization: Riparian Corridor Strategies provides detail on the methods and point systems used to identify and prioritize lands along the riparian corridor for conservation and restoration.
In the Study, riparian restoration (tree planting) was identified for those areas lacking vegetation along the streams and in public ownership. It is assumed that it will be more feasible to conduct tree planting projects on public lands over private lands.
Riparian conservation was identified for those areas already fully forested and undeveloped as well as those areas adjacent to lands already protected. This approach to land conservation focuses on acquiring and protecting the highest value lands from a stormwater and an ecological perspective. By protecting lands adjacent to lands already in protection, connectivity of conserved lands is increased.
access or other extenuating circumstances can dramatically increase planting costs. Cost estimates can typically range between $15,000 and $36,000. $30,000 is assumed to be a conservative average estimate.

DRAFT Bear Creek Watershed Management Study
King County Science and Technical Support Section 85 February 2018
Criteria used to develop riparian corridor prioritization scheme. Table 25.
Category Criteria Rationale Conservation / Restoration?
Condition
No shade/mowed to
edge of water
This criteria implicitly includes
immediate proximity to stream and
so gets a high point value.
Used as criterion for restoration.
Presence of invasive
species
Reed canarygrass is an invasive
monoculture that reduces
biodiversity and native habitat.
Parcels includes areas that lack
shade and contain reed canarygrass
or Himalayan blackberry, as
identified in aerial imagery.
Used as criterion for restoration.
Area currently forested No apparent restoration activities are
needed; most cost-effective; zero
wait time for tree-growth.
Used as criterion for conservation.
Connectivity
Along the Wildlife Habitat Network (WHN)
Trees planted here contribute to vegetated wildlife corridors.
Used as criteria for both conservation and restoration.
Adjacent to public, Tract, and HOA parcels
Parcels adjacent to parcels that are already protected increase the contiguously protected area and may fill in gaps in protected areas.
Used as criterion for conservation.
Location in watershed
Along headwater streams, defined as first-order streams.
Trees planted along the stream here help contribute to lower water temperatures at the stream’s source.
Used as criteria for both conservation and restoration.
Where water temperature exceedances are known to occur.
Trees planted here help to lower or at least maintain water temperatures.
Used as criterion for restoration.
Along Chinook-bearing
waters
Trees planted here will eventually
contribute to large wood in the
streams.
Used as criteria for both conservation and restoration.
Development pressure
Parcels are not currently
subdivided as small as
they may be.
Parcels that are not currently
subdivided as small as they may be.
Used as criterion for conservation.
Special designation
Identified in wetland
analysis (King County,
2017d) or King County
Land Conservation
Initiative (which includes
salmon recovery
priorities).
Assumes that if there are multiple values associated with preservation versus only one conservation target, parcel is more valuable from a conservation standpoint.
Used as criterion for conservation.
Feasibility On public land. This criteria gets a high point value
because of presumed agency cooperation
Used as criterion for restoration.

DRAFT Bear Creek Watershed Management Study
King County Science and Technical Support Section 86 February 2018
7.3 Identified Structural Strategies
The strategies for riparian corridor preservation and restoration are based on both the output of the parcel-scale riparian analysis described in Section 7.2 and the output of the HSPF model indicating the shading necessary to meet state temperature standards (King County, 2018). The parcel-scale analysis in Section 7.2 was completed for salmon-bearing streams, whereas the modeled shade analysis in the Modeling Report (King County, 2018) included all flowing surface waters in the study area. In salmon-bearing streams, a 165-foot buffer was evaluated to provide shading and habitat, and in non-salmon-bearing streams, a 50-foot buffer was evaluated to primarily provide shading in addition to habitat.
7.3.1 Restoration strategies
In the study area, a total of approximately 316 acres of riparian area spread across 371 parcels are identified that would benefit from tree planting (Table 26). Another 205 acres along/around non-salmon-bearing streams/tributaries are identified for planting in a 50-ft stream buffer. These areas lack trees either along the stream channel or in the regulated riparian buffer. The calculated area is approximate and would need to be verified on a site-by-site basis.
Acres of riparian corridors prioritized for restoration by jurisdiction and ownership. Table 26.Public indicates areas that are fully or partially on public lands.
Jurisdiction
165-ft Habitat and Shade Buffer (Salmon-Bearing Streams)
50-ft Shade Buffer (Non-Salmon-Bearing Streams)
Public Private Total Public Private Total
King 83 141 224 43 140 183
Snohomish 31 19 50 4 4 8
Redmond 25 10 35 5 9 14
Woodinville 0 7 7 0 0 0
Prioritization of parcels in the 165-ft buffer was accomplished by applying the criteria and associated points described in Table 25 and Appendix D – Prioritization: Riparian Corridor Strategies and then summing the points per parcel to score the 371 parcels. Riparian restoration parcels were ranked based on their scores, where:
High = 90-120 points Medium = 70-80 points Low = 20-60 points Very Low = 0-10 points
Parcels that scored only 0 or 10 points are assumed to not be a priority for 165-ft buffer restoration (59 parcels scored 0 or 10 points). Parcels that scored at least 20 points for riparian restoration (tree planting), by partner jurisdiction are:
King County – 262 parcels; points ranging from 20 to 120 Redmond – 20 parcels; points ranging from 20 to 100 Snohomish County – 13 parcels; points ranging from 20 to 60

DRAFT Bear Creek Watershed Management Study
King County Science and Technical Support Section 87 February 2018
Woodinville – 16 parcels; points ranging from 20 to 80 WSDOT – 1 parcel; 100 points
Some parcels were examined but not ranked. Parcels that were fully vegetated are classified as “Vegetated.” Parcels whose riparian buffers were constructed because of houses or other development but whose remaining riparian buffer was vegetated are classified as “Vegetated small buffers.” Individual parcels were not evaluated for the 50-ft non-salmon-bearing stream riparian buffer. All publicly owned parcels are high priority for planting. The remaining privately owned lands are identified to be targeted following the restoration of downstream, salmon-bearing stream riparian corridors if downstream temperature goals are not met. Prioritization of parcels in the 50-ft buffer may be done following the methods detailed in Section 7.2 and Appendix D. The cost of tree-planting was assumed to average $30,000 per acre, not including any land acquisition costs. The cost of restoring salmon-bearing stream riparian corridors on public lands is estimated to be $4.2 million ($2.5 million for King County; $930,000 for Snohomish County; $750,000 for City of Redmond; and $0 for City of Woodinville). The private lands are identified to be targeted through an incentive program (see Section 7.4). The total cost to restore riparian corridors on private lands is estimated to be $5.3 million. These costs include areas of riparian corridor that are ranked low or very low. The cost of restoring non-salmon-bear streams riparian corridors to a 50-ft buffer is estimated at $6.2 million ($5.5 million for King County; $240,000 for Snohomish County; $420,000 for City of Redmond; and $0 for City of Woodinville).
7.3.2 Conservation strategies
A total of 741 parcels in the 165-ft salmon-bearing stream riparian corridor were ranked for conservation priority, including:
128 undeveloped privately owned parcels (71 forested, 54 associated with
wetlands, and 3 in non-native vegetation)
498 developed residential parcels that might be candidates for conservation easements or partial acquisition because they contain stream or stream buffer
115 developed residential parcels denoted as having limited options; typically these parcels are better candidates for tree planting/restoration than conservation, as they are smaller, developed parcels that did not score highly
59 undeveloped parcels are directly adjacent to publicly owned parcels

DRAFT Bear Creek Watershed Management Study
King County Science and Technical Support Section 88 February 2018
Publicly owned parcels, TRACT parcels, and Home Owners Associations (HOA) parcels were not considered for land conservation because they are already publicly owned or otherwise conserved. Potential conservation parcels were put into one of the following categories:
Undeveloped: Undeveloped parcels may be covered in forest, wetland, shrub, or grass.
Potential Easement: development is present on some portion of the parcel as well as some portion of the riparian corridor.
Limited Options: Parcels with riparian corridors reduced in size and constrained by roads, driveways, or buildings.
Prioritization ranking was accomplished by applying the criteria and associated points described in Appendix D – Prioritization: Riparian Corridor Strategies and then summing the points per parcel to score the 741 parcels. Riparian conservation parcels were ranked as high, medium, low, and very low, where:
High = 100 to 140 points Medium = 70 to 90 points Low = 20 to 60 points Very Low = 0 to 10 points
Parcels that scored 0 or 10 points are assumed to be a very low priority for conservation. Of the 741 parcels that were scored, 524 scored at least 20 points for conservation. The 524 parcels are spread across the partner jurisdictions:
King County – 444 parcels; points ranging from 20 to 140 Redmond – 16 parcels; points ranging from 20 to 110 Snohomish County – 48 parcels; points ranging from 30 to 120 Woodinville – 16 parcels; points ranging from 20 to 100
Of the 741 parcels, 115 were identified as “Limited Options.” Of those parcels, 40 scored between 0 and 30 points and are included in their respective low and very low categories. The remaining 75 limited options parcels scored a negative number (from -10 to -30). Those 75 parcels are identified as “Limited Options,” and no action was identified for those parcels. Undeveloped parcels are candidates for acquisition or easement; cost analyses assume acquisition. “Potential easement” parcels are assumed to be candidates for easements and not acquisitions, though there may be some circumstances when a developed parcel is purchased and any structures demolished. Parcels categorized as “Limited Options” were considered for easements when they scored low and very low. Costs of acquisition were calculated by first obtaining the combined assessed land value and assessed improved value (value of improvements, such as houses) from King County
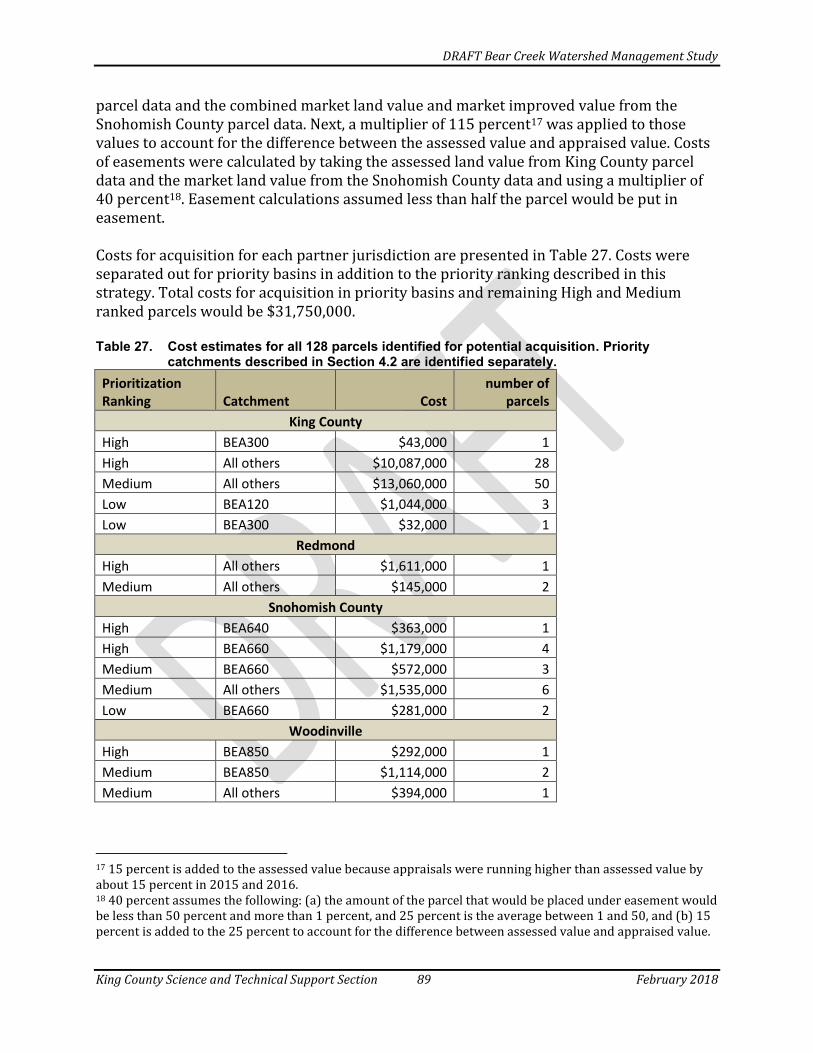
DRAFT Bear Creek Watershed Management Study
King County Science and Technical Support Section 89 February 2018
parcel data and the combined market land value and market improved value from the Snohomish County parcel data. Next, a multiplier of 115 percent17 was applied to those values to account for the difference between the assessed value and appraised value. Costs of easements were calculated by taking the assessed land value from King County parcel data and the market land value from the Snohomish County data and using a multiplier of 40 percent18. Easement calculations assumed less than half the parcel would be put in easement. Costs for acquisition for each partner jurisdiction are presented in Table 27. Costs were separated out for priority basins in addition to the priority ranking described in this strategy. Total costs for acquisition in priority basins and remaining High and Medium ranked parcels would be $31,750,000.
Cost estimates for all 128 parcels identified for potential acquisition. Priority Table 27.catchments described in Section 4.2 are identified separately.
Prioritization Ranking Catchment Cost
number of parcels
King County
High BEA300 $43,000 1
High All others $10,087,000 28
Medium All others $13,060,000 50
Low BEA120 $1,044,000 3
Low BEA300 $32,000 1
Redmond
High All others $1,611,000 1
Medium All others $145,000 2
Snohomish County
High BEA640 $363,000 1
High BEA660 $1,179,000 4
Medium BEA660 $572,000 3
Medium All others $1,535,000 6
Low BEA660 $281,000 2
Woodinville
High BEA850 $292,000 1
Medium BEA850 $1,114,000 2
Medium All others $394,000 1
17 15 percent is added to the assessed value because appraisals were running higher than assessed value by about 15 percent in 2015 and 2016. 18 40 percent assumes the following: (a) the amount of the parcel that would be placed under easement would be less than 50 percent and more than 1 percent, and 25 percent is the average between 1 and 50, and (b) 15 percent is added to the 25 percent to account for the difference between assessed value and appraised value.

DRAFT Bear Creek Watershed Management Study
King County Science and Technical Support Section 90 February 2018
Costs for easements for each partner jurisdiction are present in Table 28. Costs were separated out for priority basins in addition to the priority ranking described in this strategy. Total costs for easements in priority basins and remaining High and Medium ranked parcels would be $29,230,000.
Cost estimates for all 538 parcels identified for potential easements. Priority Table 28.catchments described in Section 4.2 are identified separately.
Prioritization Ranking Catchment Cost
number of parcels
King County
High All others $590,000 1
Medium All others $16,389,000 41
Low BEA120 $3,125,000 6
Low BEA300 $1,571,000 5
Very Low BEA120 $1,710,000 8
Snohomish County
Medium BEA660 $444,000 2
Low BEA640 $201,000 1
Low BEA660 $3,058,000 17
Very Low BEA660 $624,000 4
Woodinville
Low BEA850 $1,521,000 5
7.4 Identified Non-structural (Programmatic)
Strategies
Underlying the implementation of structural wetland strategies detailed in this chapter, three programs were identified (Table 29). King County may coordinate with internal and external conservation programs to acquire and preserve identified priority open space lands that align with recommended mitigation of the basin (e.g. wetland mitigation, expansion, and connections; riparian buffer planting). Examples of conservation programs include King County Acquisitions, the Nature Conservancy. King County is pursuing expanded funding via the Land Conservation Initiative (LCI). A tree-planting incentive program was identified. A potential program could provide private individuals and businesses with incentives (such as SWM fee reduction) and technical assistance to plant trees degraded wetland perimeters within their property. Coordination with the existing mitigation banking program may also assist with reaching objectives. A public outreach/education program was identified to improve appreciation of riparian corridors and desire for landowners to protect or restore them in addition to the other

DRAFT Bear Creek Watershed Management Study
King County Science and Technical Support Section 91 February 2018
topic areas (stormwater, instream habitat, and wetlands). The outreach/education program is detailed in Chapter 8.

DRAFT Bear Creek Watershed Management Study
King County Science and Technical Support Section 92 February 2018
Non-structural riparian strategies. FTE-year: a single year of full-time employee work (one-time). FTE/year: an ongoing year Table 29.of full-time employee work (continuous).
Strategy Description Targeted
Metric/Benefit(s) Discussion Cost Jurisdiction
Tree Planting Incentive Program (Also part of wetland strategy)
Develop and implement a program to provide financial assistance, SWM fee discounts/rebates, and /or technical assistance to private property owners to plant trees, especially in the riparian area.
B-IBI/Flow Flashiness
Stream temperature
Instream habitat
TSS/Turbidity
City of Redmond currently operates a tree-planting incentive program in its jurisdiction. Can leverage King County’s One Million Trees Initiative
.25 FTE-year (to develop program) .25 FTE/year (to implement program)
King County
Preservation and Acquisition of high priority open space (Also part of wetland strategy)
Coordinate with internal and external conservation programs to acquire and preserve identified priority open space lands that align with recommended mitigation of the basin (e.g. wetland mitigation, expansion, and connections; riparian buffer planting).
Wetlands
Riparian corridors
Purchase or easement of/on critical properties at a faster pace before further development occurs will ensure that critical mitigation projects can be accomplished.
Examples of conservation programs include KC Acquisitions, Nature Conservancy, etc. KC is pursuing expanded funding via the Land Conservation Initiative (LCI).
.10 FTE/year King County
Mitigation Banking (Also part of wetland strategy)
Identified wetland and/or riparian projects in the plan use KC existing banking programs as a method of funding critical projects.
Wetlands
Riparian corridors
This type of program could essentially pay for an identified critical wetland or riparian project by selling mitigation credits to developers in the watershed.
N/A King County

DRAFT Bear Creek Watershed Management Study
King County Science and Technical Support Section 93 February 2018
8.0 OTHER NON-STRUCTURAL
(PROGRAMMATIC) STRATEGIES
Chapters 4 to 7 present some non-structural strategies to meet the watershed goals and objectives detailed in Chapter 2. In addition to those, Table 30 describes non-structural strategies that are not specific or unique to stormwater, instream habitat, riparian corridors, or wetland. These strategies are expected to accelerate and track the rate at which the watershed goals and objectives are achieved.
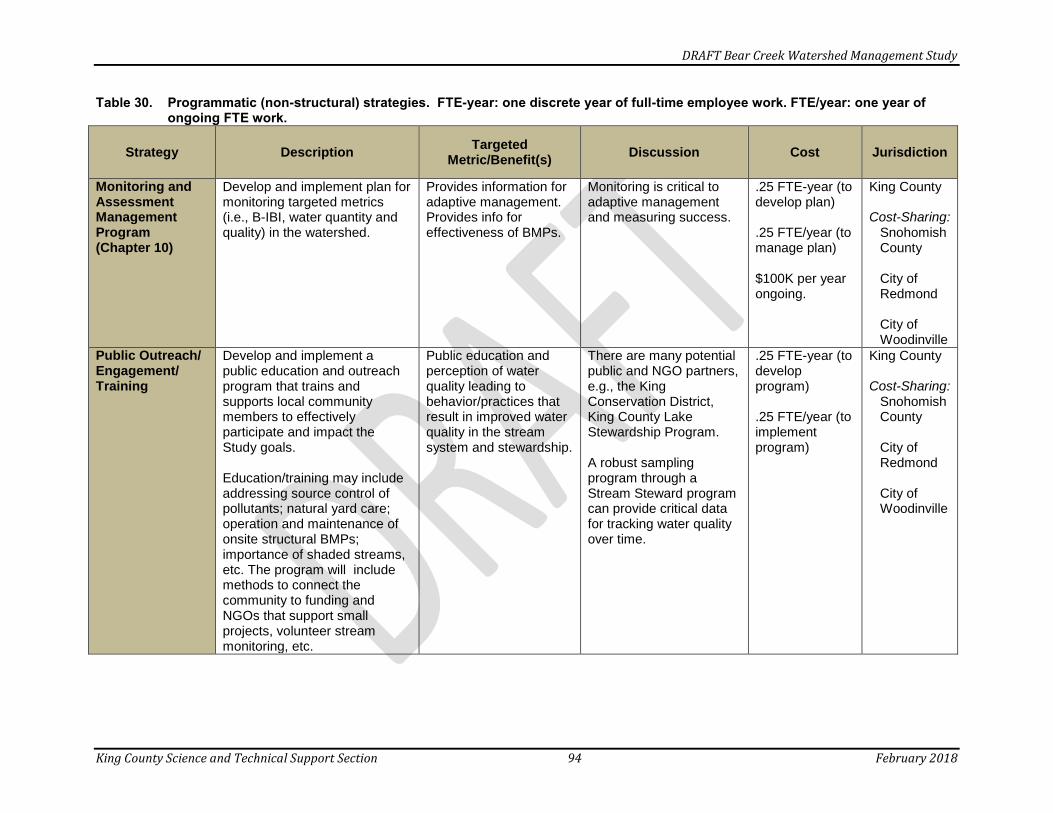
DRAFT Bear Creek Watershed Management Study
King County Science and Technical Support Section 94 February 2018
Programmatic (non-structural) strategies. FTE-year: one discrete year of full-time employee work. FTE/year: one year of Table 30.ongoing FTE work.
Strategy Description Targeted
Metric/Benefit(s) Discussion Cost Jurisdiction
Monitoring and Assessment Management Program (Chapter 10)
Develop and implement plan for monitoring targeted metrics (i.e., B-IBI, water quantity and quality) in the watershed.
Provides information for adaptive management. Provides info for effectiveness of BMPs.
Monitoring is critical to adaptive management and measuring success.
.25 FTE-year (to develop plan) .25 FTE/year (to manage plan) $100K per year ongoing.
King County Cost-Sharing:
Snohomish County City of Redmond City of Woodinville
Public Outreach/ Engagement/ Training
Develop and implement a public education and outreach program that trains and supports local community members to effectively participate and impact the Study goals. Education/training may include addressing source control of pollutants; natural yard care; operation and maintenance of onsite structural BMPs; importance of shaded streams, etc. The program will include methods to connect the community to funding and NGOs that support small projects, volunteer stream monitoring, etc.
Public education and perception of water quality leading to behavior/practices that result in improved water quality in the stream system and stewardship.
There are many potential public and NGO partners, e.g., the King Conservation District, King County Lake Stewardship Program. A robust sampling program through a Stream Steward program can provide critical data for tracking water quality over time.
.25 FTE-year (to develop program) .25 FTE/year (to implement program)
King County Cost-Sharing:
Snohomish County City of Redmond City of Woodinville

DRAFT Bear Creek Watershed Management Study
King County Science and Technical Support Section 95 February 2018
Strategy Description Targeted
Metric/Benefit(s) Discussion Cost Jurisdiction
Bear Creek Watershed Website and Watershed Committee Coordination
Set up and manage a clearing house/ informational webpage that connects interested parties in the watershed. The page will inform on ongoing monitoring, capital projects, collaborative and funding opportunities, ongoing programs, progress on implementation, contact information, volunteer events, and organizations that contribute to watershed restoration goals.
No direct impact on environmental quality.
The website will provide program transparency and useful for tracking Study progress.
.25 FTE/year (ongoing) .05 FTE/year for Partner jurisdictions
King County Participatory Only:
Snohomish County City of Redmond City of Woodinville

DRAFT Bear Creek Watershed Management Study
King County Science and Technical Support Section 96 February 2018
(This page intentionally left blank).

DRAFT Bear Creek Watershed Management Study
King County Science and Technical Support Section 97 February 2018
9.0 POTENTIAL IMPLEMENTATION
FRAMEWORK
The implementation of the identified suite of strategies would require a concerted effort among many governmental and non-governmental entities. Because of the long-term nature of this Study, the establishment of an ongoing organizational structure to oversee, secure funding for, monitor, document, and, as needed, modify the Study is suggested. A structure that will support the scope of project work and effectively involve necessary partners is recommended. The implementation framework may build upon the framework established in the development of the Study and other existing relationships. A potential organization structure is as follows:
There are two key elements of the identified potential watershed management organization:
Bear Creek Watershed Coordinator – a full-time employee
Bear Creek Watershed Committee – an inter-organizational network composed of the Watershed Coordinator and self-appointed representatives from the City of Redmond, City of Woodinville, King County, Snohomish County, and WSDOT.
The role of Watershed Coordinator may include the coordination of the following activities:
Facilitation of Watershed Committee meetings twice per year
External partner engagement and coordination, including but not limited to:
o watershed residents and businesses,
o Department of Ecology,
o environmental and salmon recovery groups,
o WRIA 8 Salmon Recovery Council, and
o the Muckleshoot Indian Tribe
Initiation and coordination of a monitoring program
Identification and promotion of potential multi-objective (e.g., water quality and habitat) projects
Program and policy development
Grant application and management
Management of staffing
Tracking and public reporting of status
Publication of annual reports summarizing activities
Publication of 5-year Study effectiveness reports
Publication of 10-year Study updates
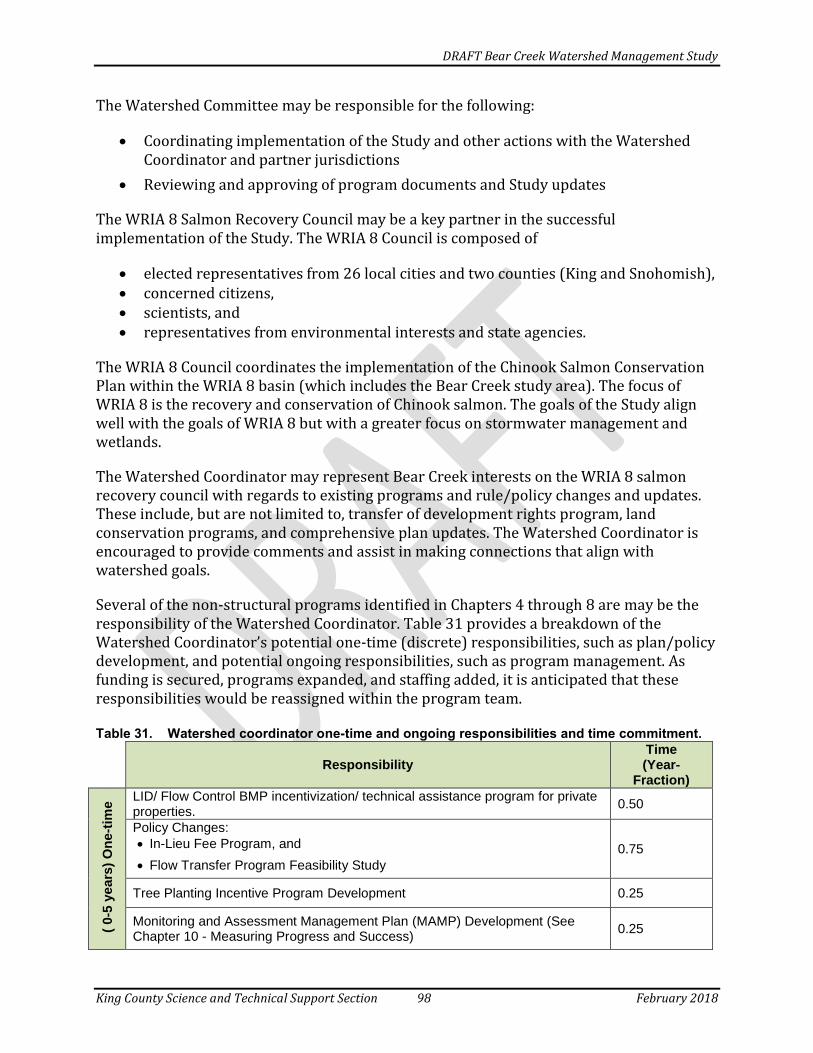
DRAFT Bear Creek Watershed Management Study
King County Science and Technical Support Section 98 February 2018
The Watershed Committee may be responsible for the following:
Coordinating implementation of the Study and other actions with the Watershed Coordinator and partner jurisdictions
Reviewing and approving of program documents and Study updates
The WRIA 8 Salmon Recovery Council may be a key partner in the successful implementation of the Study. The WRIA 8 Council is composed of
elected representatives from 26 local cities and two counties (King and Snohomish), concerned citizens, scientists, and representatives from environmental interests and state agencies.
The WRIA 8 Council coordinates the implementation of the Chinook Salmon Conservation Plan within the WRIA 8 basin (which includes the Bear Creek study area). The focus of WRIA 8 is the recovery and conservation of Chinook salmon. The goals of the Study align well with the goals of WRIA 8 but with a greater focus on stormwater management and wetlands.
The Watershed Coordinator may represent Bear Creek interests on the WRIA 8 salmon recovery council with regards to existing programs and rule/policy changes and updates. These include, but are not limited to, transfer of development rights program, land conservation programs, and comprehensive plan updates. The Watershed Coordinator is encouraged to provide comments and assist in making connections that align with watershed goals.
Several of the non-structural programs identified in Chapters 4 through 8 are may be the responsibility of the Watershed Coordinator. Table 31 provides a breakdown of the Watershed Coordinator’s potential one-time (discrete) responsibilities, such as plan/policy development, and potential ongoing responsibilities, such as program management. As funding is secured, programs expanded, and staffing added, it is anticipated that these responsibilities would be reassigned within the program team.
Watershed coordinator one-time and ongoing responsibilities and time commitment. Table 31.
Responsibility Time (Year-
Fraction)
( 0
-5 y
ears
) O
ne
-tim
e LID/ Flow Control BMP incentivization/ technical assistance program for private
properties. 0.50
Policy Changes:
In-Lieu Fee Program, and
Flow Transfer Program Feasibility Study
0.75
Tree Planting Incentive Program Development 0.25
Monitoring and Assessment Management Plan (MAMP) Development (See Chapter 10 - Measuring Progress and Success)
0.25

DRAFT Bear Creek Watershed Management Study
King County Science and Technical Support Section 99 February 2018
Agricultural BMP Incentive Program Evaluation 0.25
Public Engagement Plan 0.25
Total 2.25
On
go
ing
Program administration, status reports, staff oversight, and grant management 0.15
Preservation and Acquisition coordination 0.10
MAMP Management and Reporting 0.25
Bear Creek Watershed Website and Watershed Committee coordination 0.25
Public Engagement 0.25
Total 1.00

DRAFT Bear Creek Watershed Management Study
King County Science and Technical Support Section 100 February 2018
(This page intentionally left blank).

DRAFT Bear Creek Watershed Management Study
King County Science and Technical Support Section 101 February 2018
10.0 ADAPTIVE MANAGEMENT AND
MEASURING PROGRESS AND SUCCESS
There are many projects and programs identified by the Study that would support the achievement of the watershed goals outlined in Chapter 2 based on the best available science. The effectiveness of these projects and programs in achieving watershed goals and objectives is important information for managers. An adaptive management framework is recommended for implementation. The framework is recommended to utilize a monitoring program to evaluate strategy effectiveness and inform future Study updates.
10.1 Adaptive Management
The Study recommends an adaptive management framework for implementation. Adaptive management is a systematic process for improving future management actions by learning from the outcomes of implemented actions. Figure 16 depicts the cycle of adaptive management. The figure shows both a series of specific activities and arrows that indicate the importance of establishing purposeful and explicit connections between the activities – each action informs the next action. Undertaking actions that address the individual activities without giving similar consideration to the connections between them will lead to ineffective or inefficient Study implementation.
Figure 16. Adaptive management framework.
Effective implementation of the Study requires adaptive management. The major steps of an adaptive management cycle are to:
1. Assess - Identify goals and objectives

DRAFT Bear Creek Watershed Management Study
King County Science and Technical Support Section 102 February 2018
2. Design - Plan actions for achieving identified goals and objectives and plan monitoring
3. Implement – Construct structural projects and implement programs
4. Monitor – Measure implementation (actions taken), project effectiveness (individual results), and overall effectiveness (cumulative results)
5. Evaluate - Analyze data and use results to adapt assumptions and approach
6. Adjust – Adjust project and program designs based on evaluated data
This Study represents the initial assessment and design for the Bear Creek study area. The Study recommends a monitoring program (see Section 10.2) that will track implemented projects and programs and measure degree of success. Implementation of the Study is recommended to be adaptively managed by linking monitoring and new and emerging information to decision-making through reports and presentations to the Watershed Committee and stakeholders, and through specific recommendations from the Watershed Coordinator. The 5-year Study effectiveness reporting provides opportunity for evaluating effectiveness. The 10-year Study updates are recommended to use these evaluations and partner and stakeholder feedback to adjust strategies to more efficiently and effectively work towards meeting watershed goals.
The Study has identified long-term goals in Chapter 2. For the purposes of adaptive management, interim, short-term (5 to 10 year) strategy-specific objectives with quantitative elements may be developed as part of the monitoring plan (see Section 10.2). Assessing whether these short-term objectives are met would assist in determining overall effectiveness and the need to make changes in implementation strategy.
10.2 Monitoring and Assessment Management Plan
Monitoring and evaluation are crucial components of adaptive management. In the first year of implementing this Study, it is recommended a Monitoring and Assessment Management Plan (MAMP) be developed. The MAMP can track Study actions, effectiveness, and outcomes. There are three types of monitoring necessary to track the progress and success of the Study: implementation monitoring, effectiveness monitoring, and cumulative effectiveness monitoring (Table 32). Development of the MAMP will include any relevant existing monitoring efforts that support the MAMP needs. It may be necessary to revisit the objectives of the current monitoring programs and, if possible, modify to meet the multiple objectives.

DRAFT Bear Creek Watershed Management Study
King County Science and Technical Support Section 103 February 2018
Monitoring plan elements for the MAMP. Table 32.
Monitoring Type Central Question(s) Example Measures of Success
Implementation monitoring
What strategies and actions have been carried out as recommended?
Are strategies and actions being implemented on schedule?
Number of stormwater facility retrofits
Percent of impervious area with flow control
Acres of wetland preserved
Number of LID BMPs installed through incentive program
Number of trees planted
Acres of riparian area planted
Grants awarded
Project/ program effectiveness monitoring
Are the strategies and actions working as intended (i.e., did the activity have the desired effect)?
Increase in habitat quantity, quality, and connectivity as well as increased salmonid use following instream habitat projects
Temperature changes of stream following increase in shade
Public stewardship program involvement and participants
Pollutant reduction from public outreach campaign
Cumulative effectiveness monitoring
Are watershed conditions improving?
Is the strategy progressing towards its goals?
Surface water quality (fecal coliform, metals) adherence to state standards
Improved B-IBI scores
Decreased stream flashiness
Acres of high-quality wetlands
Ongoing stakeholder/ resident engagement
Cumulative increases in habitat quantity, quality, and connectivity as well as improved salmon abundance, productivity, and diversity
The watershed website (clearinghouse), as mentioned in Table 29 in Chapter 8, may be a tool for assisting with implementation monitoring. The development and management of a public website is recommended. The content of the website may be populated with project information and status updates provided by the watershed partners. Information on structural and non-structural strategies/actions that have been implemented is recommended to both be tracked internally and be made publicly available. Some of the non-structural (and some structural) stormwater BMPs and habitat projects do not have quantified effectiveness data. For strategies and actions lacking published effectiveness data, monitoring and evaluation is recommended to be undertaken as strategies and actions are implemented over time. By tracking the effectiveness of individual projects and programs, future decisions and actions can be better informed. Knowledge of past successes and problems can lead to more cost-effective and substantial improvements to the Bear Creek watershed.

DRAFT Bear Creek Watershed Management Study
King County Science and Technical Support Section 104 February 2018
The cumulative effectiveness monitoring element of the MAMP may aim to track the collective, medium- to large-scale impacts of the Study actions and strategies. This monitoring component can evaluate whether the suite of implemented projects and program are resulting in a measurable improvement in Bear Creek habitat and water quality. The purpose of the monitoring is to answer if the Study is on track to meet its watershed goals and management objectives. In the development of the MAMP, it is recommended that existing resources and monitoring programs that may be utilized be evaluated. For example, King County WLRD maintains several long-term water quality monitoring stations and flow/temperature gages in the Bear Creek watershed. These stations can be used to assess cumulative effectiveness of water quality and flow projects implemented within their drainages. However, there are gaps in the existing program and additional monitoring may be recommended in streams currently lacking a monitoring station. The measures of success within the MAMP are recommended to align with the goals and management objectives defined in Chapter 2. For the purposes of adaptive management, it recommended that interim, short-term (5 to 10 year) goals with quantitative elements be developed. Assessing whether these short-term goals are met can assist in determining Study effectiveness and the need to make changes in Study implementation. The MAMP is estimated to cost approximately $100,000 per year on average for multi-metric monitoring. This cost is in addition to the existing routine stream monitoring program, which has two stations in the study area (these two stations annually cost approximately $3,000 each for monthly water quality monitoring). The $100,000 estimate is based on the cost of additional monitoring completed for this Study, which included water quality, fish use, instream habitat, riparian, and wetland assessments. Costs will vary year-to-year depending on the type and frequency of monitoring undertaken. For example, an intensive fish habitat survey may be undertaken every 5 or 10 years, resulting in a high short-term cost, whereas stream temperature monitoring can be an ongoing, lower cost. The MAMP, when developed, would have more detailed cost estimates of the plan and its components. The Partners may complete monitoring within their individual jurisdiction or contribute funding to watershed-wide monitoring.
10.3 Timeline for Reporting and Evaluation
Reporting of activities and their effectiveness may be done to inform adaptive management decisions. The reports are recommended to follow a predictable timeline that remains current to decision-making. The following are the initial recommendations for such a timeline.
Annually: Publish report summarizing the Study activities undertaken over the course of the year.
Every 5 years: Public report assessing the Study effectiveness including:

DRAFT Bear Creek Watershed Management Study
King County Science and Technical Support Section 105 February 2018
o A high-level summary suitable for policy-makers
o Summary of projects completed since the start of implementation and in-progress
o Summary of monitoring data collected to date
o Identification of important data gaps
o Breakdown of funding sources and amounts
o Recommendations for adaptive management
Every 10 years: Publish updated management strategy incorporating analyzed monitoring data and lessons learned over past 10 years.

DRAFT Bear Creek Watershed Management Study
King County Science and Technical Support Section 106 February 2018
(This page intentionally left blank).

DRAFT Bear Creek Watershed Management Study
King County Science and Technical Support Section 107 February 2018
11.0 POTENTIAL NEAR-TERM ACTIONS
SCHEDULE AND BUDGET
The Study has identified a potential suite of strategies that if implemented would result in achieving the targets for instream flow metrics and water quality as defined in the Permit. The Study has also identified several instream, riparian, and wetland habitat improvement strategies. This chapter identifies the schedule and provides cost estimates for the near-term strategies if they were to be implemented. Specificity on the mid-term and long-term actions can be found in Appendix G. The schedule and budget below is organized by near-term actions within each of the partner jurisdictions. The long-term nature of the watershed management stresses the importance of adaptive management to better track, handle, and incorporate new information. The results of the near-term actions may be used to inform future management decisions in Bear Creek and elsewhere. The budgets detailed in this chapter represent costs associated with additional projects and programs on top of those already in place. This is useful for defining the level of additional funding that would be needed if projects and programs were fully implemented to meet watershed goals.
11.1 Schedule of Potential Near-term Actions
The identified schedule and cost for implementing the Study is summarized in Tables 33 to 36 for the respective partner jurisdictions: King County, Snohomish County, City of Redmond, and City of Woodinville. The time horizon for near-term actions is the 10 years following the finalization of the Study. Following the finalization of the Study, King County may hire the Watershed Coordinator, if funding is secured. The Watershed Coordinator could then begin the development, implementation, and funding of the non-structural programs detailed in Chapters 4, 5, 6, 7, and 8 within the first five years. Early enactment of the programs will secure the greatest ongoing, long-term benefits for the watershed. These programs are less costly than structural projects, do not require substantial ongoing maintenance, and are expected to grow and expand over the Study timeline. In the second five years of the near-term phase, King County could focus on coordinating the implementation of instream habitat, riparian, and wetland projects and stormwater projects associated with the prioritized catchments such as:
Completing stormwater projects in two of the five prioritized King County stormwater catchments (or catchment groups) via new facilities and retrofits.
Completing ten percent of the higher priority instream habitat projects.

DRAFT Bear Creek Watershed Management Study
King County Science and Technical Support Section 108 February 2018
Planting trees on half (50 percent) of the prioritized riparian corridors and all wetlands located on public land in unincorporated King County during the near-term.
In addition, the tree planting incentive program, one of the nonstructural programs implemented immediately, may be conservatively expected to result in planting on five percent of the privately-owned parcels identified for riparian and wetland restorations in the near-term.
The City of Redmond plans to implement its Monticello Creek Watershed Restoration Plan, which is expected to take place over a 60-year period. That plan’s goals and objectives are strongly aligned with the goals and objectives of the Study. The City of Redmond may continue implementing its tree planting incentive program and focus on planting in the riparian corridor. Snohomish County may focus on constructing new stormwater facilities and retrofits in the two of the five prioritized catchments (or catchment groups) during the near-term. The City of Woodinville may focus on constructing new stormwater facilities and retrofits in the one of the three prioritized catchments. The city may develop a tree planting incentive program during the last five years of the near-term. In the tenth year of implementation, the Study may be updated. The update process could be led by the Watershed Coordinator. The update is advised to include the assessment of the effectiveness of past actions, including an evaluation of to what degree stormwater projects have improved conditions in the priority catchments. The HSPF and SUSTAIN models may also be updated with the most recent environmental data and in consideration of the actions completed through the programs implemented during the near-term phase. Riparian and wetland change analysis and instream habitat condition and fish use analysis could be done to identify and reprioritize projects. The update can recommend adaptive management that are expected to result in a more effective and efficient method for meeting the Study’s goals. The updates may consider climate change impacts on storm event intensity and stormwater facility sizing. The schedule and budget for the implementation of potential mid- and long-term actions is presented in Appendix G.

DRAFT Bear Creek Watershed Management Study
King County Science and Technical Support Section 109 February 2018
King County Watershed Study potential near-term actions if implemented. Table 33.
Category Description Near-term Action
(Years 1-10)
Program
Public Engagement/ Education Program
Develop Public Engagement/ Education Program
$100,000 over 2 years
LID Incentive Program
Develop LID Incentive Program
$100,000 over 2 years to develop $2M/year over 5 years to implement
In-lieu fee Program Develop In-lieu fee Program
$100,000 over 2 years
Monitoring and Assessment Management Plan
Develop Monitoring Plan
$50,000 over 2 years
Tree Planting Incentive Program Tree Planting Incentive Program
$50,000 over 2 years
Fish Passage Study Complete Inventory of Fish Barriers
$100,000 over 2 years
Structural Projects
Construct Stormwater Facilities Build new facilities in priority catchments
$846,000/year
Evaluate and Optimize Existing Stormwater Facilities
Evaluate/optimize in priority catchments
No Additional Cost
Instream Habitat Projects Construct high priority projects
$343,000/year over 5 years
Riparian Restoration
Acquire/ease and preserve high priority areas
$91,000/year over 5 years
Wetland Restoration
Acquire/ease and preserve high priority areas
$19,000/year over 5 years
Studies, Analyses
Flow Transfer Program (Done in First 5 Years)
Study program feasibility
$50,000 over 2 years
Agricultural BMP Program
Assess existing regulation and incentive programs
$50,000 over 2 years

DRAFT Bear Creek Watershed Management Study
King County Science and Technical Support Section 110 February 2018
Category Description Near-term Action
(Years 1-10)
Fecal Bacteria Source Tracking Study
Follow-up IDDE work for TMDL by King County SWS
$60,000/year over 5 years
Watershed Coordination and Strategy
Administration
Program Management
Watershed Coordinator holds Committee meetings, prepares reports, oversees grants, and supervises staff
$30,000/year
Update Watershed Study Update every 10 Years
$200,000
All costs are in 2017 dollars, no discount or inflation rate applied.
Snohomish County Watershed Study potential near-term actions if implemented. Table 34.
Category Description Near-term Action
Structural Projects
Construct Stormwater Facilities Build new facilities in priority catchments
$1.9M / year
Studies and Analyses
MAMP (or equivalent) Monitor and Evaluate Results
$9,000 / year last 5 years
Watershed Coordination and Strategy
Administration
Watershed Committee Participation
Participate in bi-annual watershed committee coordination meetings
$10,000 / year
Update Watershed Study Update every 10 Years
$9,000
All costs are in 2017 dollars, no discount or inflation rate applied.

DRAFT Bear Creek Watershed Management Study
King County Science and Technical Support Section 111 February 2018
City of Redmond Watershed Study potential near-term actions if implemented. Table 35.
Category Description Near-term Action
Structural Projects
Construct Stormwater Facilities
Complete Monticello Creek Restoration Plan
$7.3M / year
Implement Programs
Tree Planting Program Plant trees on willing private property
$7,000 / year
Studies and Analyses
MAMP (or equivalent) Monitor and Evaluate Results
$10,000 / year (last 5 years)
Watershed Coordination and Strategy
Administration
Watershed Committee
Participate in bi-annual watershed committee coordination meetings
$10,000 / year
Update Watershed Study Update every 10 Years
$10,000
All costs are in 2017 dollars, no discount or inflation rate applied.
City of Woodinville Watershed Study potential near-term actions if implemented. Table 36.
Category Description Near-term Action
Structural Projects
Construct Stormwater Facilities
Build new facilities in priority catchments
$500,000 / year
Tree Planting Incentive Program Program Development
$19,000 / year last 5 years
Studies and Analyses
MAMP (or equivalent) Monitor and Evaluate Results
$6,000 / year
Watershed Coordination and Strategy
Administration
Watershed Committee
Participate in bi-annual watershed committee coordination meetings
$10,000 / year
Update Watershed Study Update every 10 Years
$6,000 / year
All costs are in 2017 dollars, no discount or inflation rate applied.

DRAFT Bear Creek Watershed Management Study
King County Science and Technical Support Section 112 February 2018
11.2 Summary of Estimated Near-term Costs
Table 37 summarizes the estimated costs of the Study’s elements during the near-term phase of the Study if the recommendations were fully implemented. Cost estimates are based on based on the best available information for instream habitat project costs ($3M per mile), tree planting costs ($30K per acre), stormwater structural strategy (construction, maintenance, and replacement) costs, property acquisition costs, and program management costs.
Watershed Study near-term budget summary. Table 37.
Jurisdiction Expense
Type
Cost Incurred by Juris. or
Private Indiv./Entity
Near-Term Actions ($M) (Year 1-10)
King County
Capital Private $0.55
Public $7.91
O & M Private $0.23
Public $0.09
Habitat
Public
$3.22
Programs $2.57
Studies $1.05
Acquisitions $8.39
Total Private $0.78
Total Public $21.23
Snohomish County
Capital Private $0.76
Public $18.36
O & M Private $0.16
Public $0.12
Habitat
Public
$1.32
Programs $0.11
Acquisitions $9.22
Total Private $0.93
Total Public $29.13
Redmond
Capital Private $54.46
Public $19.44
O & M Private $0.16
Public $0.10
Habitat
Public
$0.05
Programs $0.16
Acquisitions $0.00
Total Private $54.62
Total Public $19.76
Woodinville Capital Private $0.25
Public $4.79

DRAFT Bear Creek Watershed Management Study
King County Science and Technical Support Section 113 February 2018
Jurisdiction Expense
Type
Cost Incurred by Juris. or
Private Indiv./Entity
Near-Term Actions ($M) (Year 1-10)
O & M Private $0.04
Public $0.05
Habitat
Public
$0.09
Programs $0.34
Acquisitions $4.06
Total Private $0.30
Total Public $9.33
ALL PARTNERS
Capital Private $56.02
Public $50.50
O & M Private $0.59
Public $0.36
Habitat
Public
$4.68
Programs $3.18
Studies $1.05
Acquisitions $21.67
Total Private $56.63
Total Public $81.45
Public: Cost incurred by public institutions Private: Cost incurred by private developers, firms, or individuals All costs are in 2017 dollars, no discount or inflation rate applied.

DRAFT Bear Creek Watershed Management Study
King County Science and Technical Support Section 114 February 2018
(This page intentionally left blank).

DRAFT Bear Creek Watershed Management Study
King County Science and Technical Support Section 115 February 2018
12.0 FUNDING STRATEGY
To successfully fulfill the goals of the Study, additional funding would be needed beyond what is currently invested in the watershed. Additional funding may be pursued from a variety of local, state, federal, and private sources and through collaboration with complementary efforts in the watershed.
If fully implemented, the estimated public cost to perform the identified near-term actions over the ten year period is $81 million across the partner jurisdictions. These near-term actions are targeted in a subset of the 26 square mile study area. As a point of comparison, the annual SWM utility fee revenues for the municipalities that developed this Study is approximately $67 million for a service area that is over 1800 square miles. Each of the municipalities currently allocates SWM revenues to a variety of projects and programs that are required by NPDES permits and other state and federal regulations. In order to implement the identified full suite of strategies, a substantial level of funding would need to be secured.
The jurisdictions would need to aggressively apply for and secure grants and/or increase revenues through fee increases. During the initial years of implementation, in addition to program development, staff may focus on securing funding for additional staffing to manage aspects of the Study (e.g., public engagement) and to apply for grants.
Tables 38 to 41 list the additional funding that may be pursued from a variety of local, state, federal, and private sources, respectively. When possible, the amount of accessible funds for these sources is provided. In many cases, however, the level of funding from a source varies from year to year. The funding sources are often dedicated to certain types of projects or programs. Dedicated staff time would be required to coordinate identifying and attaining funding for ongoing and capital projects/programs.
One of the non-structural (programmatic) strategies for King County represents potential funding mechanisms. An in-lieu fee program may be used to transfer funds from development projects where on-site stormwater management BMPs are not feasible. King County would use the revenue to fund stormwater mitigation and habitat projects in the watershed.

DRAFT Bear Creek Watershed Management Study
King County Science and Technical Support Section 116 February 2018
Potential Local Funding Sources Table 38.
Fund/ Grant Name
Funding Source
(Agency) Description
Total Accessible
Funds
Surface Water Management (SWM) Service Fees
King County Snohomish County City of Woodinville City of Redmond
Each jurisdiction is required by state and federal law to provide surface water management services to address problems impacting local water bodies such as erosion, flooding, and increased water temperatures, habitat degradation, and low stream flows. In order to pay for these services, property owners pay an assessed SWM fee. SWM fees support several ongoing as well as new efforts across the region. Some of these efforts include;
mapping stormwater conveyance systems,
increasing habitat restoration projects,
managing stormwater assets,
maintaining and replacing aging stormwater infrastructure,
improving conditions of stormwater flow control structures, and
addressing chronic drainage and flooding management issues.
The total amount accessible cannot be estimated. Funds may be allocated from existing Service Fees OR A fee increase may be imposed to partially cover implementation
Urban Growth Area (UGA) Service Charges
Snohomish County
Under the authority of RCW 36.89, UGA service charge rates are specified in Snohomish County Code Title 25. This an additional surcharge to SWM service charges, in part to reflect a higher level of service in UGA areas.
The funding availability varies. Very little of this would be accessible for Bear Creek projects.
Real Estate Excise Tax (REET)
King and Snohomish Counties and Cities of Woodinville and Redmond
All real estate transactions that involve conveyance of property require consideration of excise tax
The funding varies year to year based on taxable real estate sales in unincorporated King County but the anticipated revenue for 2017 is about $15.5 million. Very little of this would be accessible for Bear Creek projects.

DRAFT Bear Creek Watershed Management Study
King County Science and Technical Support Section 117 February 2018
Fund/ Grant Name
Funding Source
(Agency) Description
Total Accessible
Funds
Road Fund King County
The Road Services Division adopted six year Capital Improvement Program for 2017-2022 is programmed using the Strategic Plan for Road Services that guides and directs priorities for road investments. The capital program reflects an on-going, evolving response to significant structural funding challenges that are affecting the county’s ability to preserve and maintain the roadways in the unincorporated areas.
The total six year program is approximately $169.7 million. In prioritizing capital investments, the division is guided by the priority framework in the Strategic Plan for Road Services.
WaterWorks Grant Program
King County Wastewater Treatment Division
WaterWorks provides funding for projects that improve water quality in the service area for King County's regional wastewater system.
Eligible areas: Redmond, Woodinville, Redmond Ridge, Maltby, North Redmond unincorporated urban area.
$2 million every two years for projects within the wastewater service area.
In-lieu fees
King County Snohomish County City of Woodinville City of Redmond
A program involving the restoration, establishment, enhancement, and/or preservation of aquatic resources through funds paid to a governmental or non-profit natural resources management entity to satisfy compensatory mitigation requirements. Similar to a mitigation bank, an in-lieu fee program sells compensatory mitigation credits to permittees whose obligation to provide compensatory mitigation is then transferred to the in-lieu program sponsor.
The funding availability varies.
Community Engagement Grants
King County
The purpose of the Community Engagement Grants is to fund community projects that offer unincorporated area residents the Community Service Areas an opportunity to participate and be more connected in their communities. Funded projects must demonstrate how activities are accessible to all residents regardless of race, income, or language spoken. Funds available: (2014) $60,000 with amounts limited to less than $5,000 per project.
$90,000 annually / $5,000 per project.
Cooperative Watershed Management (CWM) Grants
King County Flood Control District (FCD)
In 2012 the KC FCD began providing funding to support watershed salmon recovery projects and activities in King County watersheds through a CWM Grant Program.
The award range varies by WRIA and the length of awards is two to three years.

DRAFT Bear Creek Watershed Management Study
King County Science and Technical Support Section 118 February 2018
State Funding Sources Table 39.
Fund/ Grant Name
Funding Source
(Agency) Description
Total Accessible Funds Statewide
Section 319 Grants
Washington Department of Ecology Ecology)
Typical water quality projects include agricultural BMPs; education and stewardship; water quality monitoring; lake water quality monitoring; riparian and wetlands habitat restoration and enhancement; stream restoration; TMDL plan development and implementation; and wellhead protection.
$250,000 with any combination match option,
$500,000 with cash only match option, 25% match required.
Centennial Grants
Ecology
Provides grants for water quality infrastructure and nonpoint source pollution projects to improve and protect water quality. Eligible infrastructure projects are limited to wastewater treatment construction projects for financially distressed communities. Eligible nonpoint projects include stream restoration and buffers,
on‐site septic repair and replacement, education and outreach, and other eligible nonpoint activities.
Cash only match - $500,000,
In-kind contributions - $250,000,
25% for non-point source pollution projects
Watershed Planning Implementation and Flow Achievement Grants
Ecology
Funds projects that increase flows below the project site; improve instream and riparian zone conditions (such as enhancing fish passage or habitat); reorganizing or concentrating points of diversion; establishing water banks, water exchanges, or pursing trust water opportunities; improving public water supply or irrigation district infrastructure that leads to water savings.
No set limit, no match required.
Municipal Stormwater Capacity Building Grants
Ecology
This grant is a biannual opportunity dependent on approved state budget and funds activities and equipment necessary for permit implementation among Phase I and Phase II NPDES municipal permittees. No match is required.
$50,000 per recipient every two years.

DRAFT Bear Creek Watershed Management Study
King County Science and Technical Support Section 119 February 2018
Fund/ Grant Name
Funding Source
(Agency) Description
Total Accessible Funds Statewide
Water Quality Financial Assistance
Ecology
These grants and loans are for high-priority projects to protect and improve the health of Washington’s lakes, rivers, streams and marine waters. Jurisdictions eligible to apply for this funding include local governments, tribes, special purpose districts, conservation districts and non-profits. Funding comes from a mix of state and federal funds dedicated for water quality improvement and protection.
Wastewater facilities hardship grants: $5 million,
Nonpoint source activities grants: $250,000 or $500,000 depending on match,
Stormwater activities grants: $250,000 or $500,000 depending on match,
Stormwater facilities grants: $5 million.
Grants of Regional or Statewide Significance (GROSS)
Ecology
This grant funds projects that provide benefits for more than one permittee and are offered to Phase I and Phase II NPDES municipal permittees. No match is required.
$300,000 every two years.
Salmon Recovery Grants
Washington State Recreation and Conservation Office (RCO) Salmon Recovery Board
Projects that protect existing, high‐quality habitats for salmon, and restore degraded habitat to increase overall habitat health and biological productivity. Typical projects include replacing fish barriers, replanting stream banks, removing dikes and levees, installing large woody debris to protect shorelines, and buying pristine habitat.
Operations - $4 million Capital - $222.1 million every 2 years.
Puget Sound Acquisition and Restoration/ Salmon Recovery Funding Program
RCO
Funds projects that protect existing,
high‐quality habitats for salmon, and that restore degraded habitat to increase overall habitat health and biological productivity. Projects may include the actual habitat used by salmon and the land and water that support ecosystem functions and processes important to salmon.
The funding availability varies.
Land and Water Conservation Fund (LWCF)
RCO
Funding to preserve and develop outdoor recreation resources, including parks, trails, and wildlife lands. Typical LWCF projects include land acquisition and development or renovation, such as renovating community parks, building new parks and trails, protecting wildlife habitat, and building athletic fields.
$500,000 State program. $750,000 Legacy program. 50% match. For local agencies and special purpose districts, at least 10% of the total project cost must be from a non-state, non-federal contribution.
Washington Wildlife and
RCO Funding for a range of land protection and outdoor recreation projects,
$55 million biennially. Local agencies, special

DRAFT Bear Creek Watershed Management Study
King County Science and Technical Support Section 120 February 2018
Fund/ Grant Name
Funding Source
(Agency) Description
Total Accessible Funds Statewide
Recreation Program
including park acquisition and development, habitat conservation, farmland preservation, and construction of outdoor recreation facilities.
purpose districts, salmon recovery lead entities, and nonprofits must provide 50% match and at least 10 % of the total project cost must be from a non-state, non-federal contribution. State agencies do not have to provide match. Native American tribes must provide 50% match. Local agencies, special purpose districts, salmon recovery lead entities, and nonprofits must provide 50% match and at least 10% of the total project cost must be from a non-state, non-federal contribution. State agencies do not have to provide match. Native American tribes must provide 50% match
Estuary and Salmon Restoration Program (ESRP)
WA State Department of Fish and Wildlife
ESRP was created to support the emerging priorities of the Puget Sound Nearshore Ecosystem Restoration Program. Typical projects include nearshore restoration and protection activities that restore natural ecosystem processes and functions, including protection of nearshore and wetland habitat, restoration of salmon habitat and estuaries, removing or breaching dikes, removing bulkheads, feasibility and design, and decommissioning roads and removing fill.
$10 million biennially. A match of cash or in-kind services equaling 30% of the total project cost is required.
Landscape Scale Restoration
WA State Department of Natural Resources
Funds projects that address priorities identified in Washington’s Forest Action Plan and national themes of conserving working forests and enhancing public benefits from trees and forests, which include: clean air and water, fish and wildlife habitat, open space, outdoor recreation opportunities, and climate change buffering.
Maximum grant request of $240,000.

DRAFT Bear Creek Watershed Management Study
King County Science and Technical Support Section 121 February 2018
Federal Funding Sources Table 40.
Fund/ Grant Name
Funding Source
(Agency) Description
Total Accessible Funds Nationwide
Pollution Prevention Grant Program
US Environmental Protection Agency (EPA)
The Pollution Prevention Grant Program supports State and Tribal technical assistance programs which help businesses identify better environmental strategies and solutions for reducing or eliminating waste at the source. Grants will be awarded and managed by each of EPA's 10 Regional Pollution Prevention Program Offices. Grant amounts awarded are dependent on the Congressional appropriations for this program and the quality of proposals received.
Overall award is around $4 million with a proposed range of around $40,000-$360,000 for a two-year funding period. A 50% match is required.
Water Pollution Control Program
US EPA
Section 106 of the Clean Water Act authorizes EPA to provide federal assistance to states (including territories, the District of Columbia, and Indian Tribes) and interstate agencies to establish and implement ongoing water pollution control programs. Prevention and control measures supported by State Water Quality Management programs include permitting, pollution control activities, surveillance, monitoring, and enforcement; advice and assistance to local agencies; and the provision of training and public information.
There are no funds specifically appropriated or otherwise allocated for these grants.
Conservation Stewardship Program
US Department of Agriculture Natural Resources Conservation Service (USDA NRCS)
Assists agricultural and forest landowners build on existing conservation efforts while strengthening their operation. From improved grazing conditions, increased crop yields, to developing wildlife habitat, CSP can help. CSP offers annual incentive payments for installing these practices on your land.
The funding availability varies.
Environmental Quality Incentive Program
USDA NRCS
Provides financial and technical assistance to agricultural producers to plan and implement conservation practices that improve soil, water, plant, animal, air, and related natural
resources on agricultural land and non‐industrial private forestland.
The contracts are limited to $20,000 per fiscal year and $80,000 during any 6-year period for persons or legal entities.

DRAFT Bear Creek Watershed Management Study
King County Science and Technical Support Section 122 February 2018
Fund/ Grant Name
Funding Source
(Agency) Description
Total Accessible Funds Nationwide
Regional Conservation Partnership Program
USDA NRCS
Partners (recipient of program funding) help producers and private landowners install and maintain conservation activities in selected project areas. Partners leverage RCPP funding in project areas and report on the benefits achieved.
NRCS will award up to $252 million dollars to locally driven, public-private partnerships that improve the nation’s water quality, combat drought, enhance soil health, support wildlife habitat and protect agricultural viability.
Agricultural Conservation Easement Program
USDA NRCS
Provides financial and technical assistance to help conserve agricultural lands and wetlands and their related benefits. Under the Agricultural Land Easements component, NRCS helps American Indian tribes, state and local
governments, and non‐governmental organizations protect working agricultural lands.
NRCS and partners are investing $15 million in technical and financial assistance available to help eligible conservation partners leverage local resources to voluntarily protect, restore, and enhance critical wetlands on agricultural lands.
Community‐based Coastal and Marine Habitat Restoration
National Oceanic and Atmospheric Administration U.S Department of Commerce
Seeks restoration projects that use a
habitat‐based approach to promote productive and sustainable fisheries, improve the recovery and conservation of protected resources, and promote healthy ecosystems and resilient communities.
Up to $5 million available and proposals with a range from $100,000 to $4 million over a one- to three- year period will be accepted.
National Fish Passage Program
US Fish and Wildlife Service
Funds fish passage projects. A fish passage project is any activity that improves the ability of fish or other aquatic species to move by reconnecting habitat that has been fragmented by barriers.
On average the fish passage program contributes between $70,000, there is no upper limit and strives to achieve a 50% match.
Private Funding Sources Table 41.
Fund/ Grant Name
Funding Source
(Agency) Description Accessible Funds
Trout and Salmon Foundation
Private Funding and donations
Provides matching for an individual project that aids in the restoration or improvement of any trout stream, salmon fishery, and/or ambient stream conditions through research, education, publication, and physical stream restoration that will result in improved fish reproduction, fish growth and survival, or expansion of the trout/salmon fisheries.
Since 1972, the Foundation has donated over $1.3 million towards projects across North America. The annual average funds available are around $35,000 with each project receiving around $2,000 - $3,000.
Five Star & Urban Waters
National Fish and Wildlife
Assists with projects focused on improving water quality, watersheds, and the species and habitats they support.
Approximately $2.5 million nationwide. Awards range from $20,000 to $50,000 with an

DRAFT Bear Creek Watershed Management Study
King County Science and Technical Support Section 123 February 2018
Fund/ Grant Name
Funding Source
(Agency) Description Accessible Funds
Restoration Programs
Foundations (NFWF)
Funding priorities for this program include
on‐the‐ground wetland, riparian, in‐stream, and/or coastal habitat restoration; education and training activities; measurable ecological, education, and community benefits; and partnerships to achieve ecological and educational outcomes.
average size of $30,000 and 40-50 grants awarded per year.
Bring Back the Natives/ More Fish
NFWF
Funding priorities focus on projects that produce measurable outcomes for native fish species of conservation concern. Projects should focus on restoring habitat connectivity; restoring riparian, instream habitat, and water quality; invasive species management; and innovation and game changing research.
Up to $1,000,000 in grant funds is available. Grant awards generally range in size from $50,000 to $100,000, although grants greater than $100,000 will be considered on a case by case basis. Applicants must provide at least $1 in matching non-federal funds for every $1 of NFWF grant funds requested.

DRAFT Bear Creek Watershed Management Study
King County Science and Technical Support Section 124 February 2018
13.0 RECOMMENDED NEXT STEPS
The Study found that a substantial effort would be necessary to achieve the desired objectives. For example, the majority of hard surfaces (roads, driveways, houses, parking lots, etc.) in the watershed would require treatment with LID BMPs and/or traditional stormwater facilities. While the identified strategies reflect the best available science, the effectiveness of many of these actions is not yet fully understood. As a consequence, the Study suggests a realistic, long term timeframe for achieving these objectives, allowing for adaptive management. The long term actions called for (and any associated costs) are therefore highly uncertain—new approaches and technologies are likely to modify what is ultimately needed. Despite these challenges, King County and its partners recognize the need and opportunity to move beyond planning. To that end, the Study recommends a set of near term actions – over the next ten years – to improve water quality in select catchments (small, sub-basins within the Bear Creek Watershed) and begin to restore habitat throughout the Bear Creek watershed. While many factors, including jurisdictional priorities, available funding, and other ongoing activities will affect how different recommendations are implemented, they reflect a potential path toward restoring the basin. Focusing intense stormwater efforts in smaller geographic areas increases the likelihood of achieving measurable instream improvements earlier, compared to more diffused efforts throughout the watershed. Besides demonstrating results, focused implementation will also provide timely, useful feedback on the strategies employed so that they can be modified, as needed, to ensure effectiveness. The Study recommends that structural stormwater projects be constructed in five of the prioritized catchments identified in Section 4.3:
One catchment along upper Bear Creek in unincorporated King County (BEA300),
One catchment along Lower Mackey Creek in unincorporated King County (BEA120),
Monticello Creek sub-basin for the City of Redmond (MON),
The upper Cold Creek catchment, which is the western-most of three catchments in the watershed in the City of Woodinville (BEA 850), and
The catchment immediately draining to upper Bear Creek directly upstream of Paradise Lake in unincorporated Snohomish County (BEA 640/660).
The near-term recommendations for the jurisdictions are described in Table 42. If fully implemented, the estimated public costs to perform the recommended near term actions over the ten year period is $81 million. The near-term capital construction cost for stormwater facilities in the priority catchments on public land is estimated to be $51 million. The near-term capital cost for habitat improvement projects is estimated to be $26

DRAFT Bear Creek Watershed Management Study
King County Science and Technical Support Section 125 February 2018
million. Program costs including recommended studies and monitoring are estimated at $4 million ($400K per year).
Near-term (first 10 years) recommendations for restoring the Bear Creek watershed. Table 42.
Recommendation
King County
Snohomish County
City of Redmond
City of Woodinville
Fu
nd
ing
Aggressively seek funding (e.g., grants to implement recommendations)
Develop an in-lieu fee program that allows those proposing development activities to pay for mitigation in the watershed when it is infeasible to provide mitigation on a development site
Sto
rmw
ate
r
Construct the recommended stormwater management facilities and LID BMPs on public land in the high priority catchments
Provide incentive for LID BMP construction on private residential properties
Hab
itat
Restore 50 percent of degraded wetlands and riparian corridors
Install 10 percent of the high priority instream habitat projects Provide incentives to plant trees along stream corridors
Complete a study that identifies and prioritizes fish barriers in the Bear Creek stream system
Ed
ucati
on
an
d
Stu
die
s
Implementing a public education campaign targeting reduction of fecal bacteria and other pollutants
Complete a study that analyzes the feasibility of a flow-control credit trading program between watersheds in unincorporated King County
Ad
ap
tive
Man
ag
em
en
t Implement a monitoring program to track strategy effectiveness, to be used in adaptively managing the plan
Complete a program review at completion of the ten year period, to inform next steps

DRAFT Bear Creek Watershed Management Study
King County Science and Technical Support Section 126 February 2018
14.0 REFERENCES
Bilby, R.E. 1984. Removal of woody debris may affect stream channel stability. Journal of
Forestry 82:609–613.
Bilby, R.E., and J.W. Ward. 1991. Characteristics and function of large woody debris in
streams draining old-growth, clear-cut, and second-growth forests in southwestern
Washington. Can. J. Fish. Aquat. Sci. 48, 2499-2508, 1991.
Bjornn, J.R., and D.W. Reiser. 1991. Habitat requirements of salmonids in streams. In W.R.
Meehan (ed.), Influence of forest and rangeland management on salmonid fishes and
habitats, pp. 83–138. Special Publ. 19. American Fisheries Society, Bethesda, MD.
Cappiella, K., A. Kitchell, and T. Schueler. 2006. Using Local Watershed Plans to Protect
Wetlands Article #2 of the Wetlands & Watersheds Article Series. Center for
Watershed Protection. Prepared for: Office of Wetlands, Oceans and Watersheds,
U.S. Environmental Protection Agency. Washington, DC
DeGasperi C.L., H.B. Berge, K.R. Whiting, J.J. Burkey, J.L. Cassin, and R.R. Fuerstenberg. 2009.
Linking hydrologic alteration to biological impairment in urbanizing streams of the
Puget Lowland, Washington, USA. Journal of the American Water Resources
Association 45(2):512-33.
Entranco. 1994. Bear, Evans, Cottage Lake, and Mackey Creeks – Habitat Assessment
Technical Memorandum. Prepared for King County Water and Land Resources
Division. Seattle, WA.
Fox, M., and S. Bolton. 2007. A regional and geomorphic reference for quantities and
volumes of instream wood in unmanaged forested basins of Washington State.
North American Journal of Fisheries Management 27: 342–359.
Harmon, M.E., J.F. Franklin, F.J. Swanson, P. Sollins, S.V. Gregory, J.D. Lattin, N.H. Anderson,
S.P. Cline, N.G. Aumen, J.R. Sedell, G.W. Lienkaemper, K. Cromack, Jr., and K.W.
Cummins. 1986. Ecology of coarse woody debris in temperate ecosystems. Adv. Ecol.
Res. 15: 133-302.
Hobbs, W., B. Lubliner, N. Kale, and E. Newell. 2015. Western Washington NPDES Phase 1
Stormwater Permit: Final Data Characterization 2009-2013. Washington State
Department of Ecology, Olympia, WA. Publication No. 15-03-001.

DRAFT Bear Creek Watershed Management Study
King County Science and Technical Support Section 127 February 2018
Karr, J. R., K. D. Fausch, P. L. Angermeier, P. R. Yant, and I. J. Schlosser. 1986. Assessing
biological integrity in running waters: A method and its rationale. Illinois Natural
History Survey, Special Publication 5.
Kerwin, 2001. Salmon and Steelhead Habitat Limiting Factors Report for the Cedar–
Sammamish Basin. Washington Conservation Commission. Olympia, WA.
King County. 2000. Draft Bear Creek Basin Management Evaluation Program, 1995–1998.
Prepared by Water and Land Resources Division, Seattle, WA.
King County. 2014. Recalibration of the Puget Lowland Benthic Index of Biotic Integrity (B-
IBI). Prepared by Jo Opdyke Wilhelm, (Water and Land Resources Division [WLRD]);
Leska Fore (Statistical Design), Deb Lester (WLRD) and Elene Dorfmeier (WLRD).
Seattle, Washington.
King County. 2015. Scope of Work and Schedule for the Bear Creek Watershed–Scale
Stormwater Plan. Prepared by King County Water and Land Resources Division,
Seattle, WA.
King County. 2017a. Bear Creek Watershed-scale Stormwater Plan: Existing Water Quality
Conditions. Prepared by Timothy Clark and Eric Ferguson, Water and Land
Resources Division. Seattle, WA.
King County. 2017b. Analysis of Long-term Trends in the Bear Creek Watershed. Prepared
by Timothy Clark, Water and Land Resources Division. Seattle, WA.
King County. 2017c. Assessment of Bear Creek Watershed Riparian Areas. Prepared by Jen
Vanderhoof, Water and Land Resources Division. Seattle, WA.
King County. 2017d. Assessment of Bear Creek Watershed Wetlands. Prepared by Jen
Vanderhoof, Water and Land Resources Division. Seattle, WA.
King County. 2017e. Bear Creek Watershed Juvenile Salmon Habitat Use. Prepared by Josh
Kubo, Water and Land Resources Division. Seattle, WA.
King County. 2017f. Benthic Macroinvertebrate Status and Trends in the Bear Creek Study
Area. Prepared by Steven Brady, Water and Land Resources Division. Seattle, WA.
King County. 2017g. Stormwater Regulations History and Existing Stormwater
Infrastructure in the Bear Creek Watershed. Prepared by Mark Wilgus, Water and
Land Resources Division. Seattle, WA.

DRAFT Bear Creek Watershed Management Study
King County Science and Technical Support Section 128 February 2018
King County. 2018. Watershed Model Development for Bear Creek Stormwater Retrofit
Planning Project. Prepared by Scott Miller and Jeff Burkey, Water and Land
Resources Division. Seattle, WA.
King County, Snohomish County, City of Redmond. 1989. Bear Creek Basin Current and
Future Conditions Analysis. 217 pp.
King County, Snohomish County, City of Redmond, City of Woodinville. 1994. Bear Creek
Basin Annual Report – 1994 Water Year. 61 pp.
Knutson, K.L., and V.L. Naef. 1997. Management recommendations for Washington’s
priority habitats: riparian. Washington State Department of Fish and Wildlife,
Olympia, WA.
Maser, C., R.F. Tarrant, J.M. Trappe, and J.F. Franklin. 1988. From the Forest to the Sea: A
Story of Fallen Trees. PNW-GTR-229, USDA Forest Service.
McElhany, P., M.H. Ruckelshaus, M.J. Ford, T.C. Wainwright, and E.P. Bjorkstedt. 2000.
Viable salmonid populations and the recovery of evolutionarily significant units. U.S.
Dept. Commer., NOAA Tech. Memo. NMFS-NWFSC-42. 156 pp.
Morley, S. A. 2000. Effects of Urbanization on the Biological Integrity of Puget Sound
Lowland Streams: Restoration with a Biological Focus. M.S. thesis, University of
Washington. Seattle, Washington.
Michaud, J. 2001. At home with wetlands - a land owner’s guide. Washington Department of
Ecology (Ecology). Ecology Publication #90-31.
Naiman, R.J., H. Décamps, and M. Pollock. 1993. The role of riparian corridors in
maintaining regional biodiversity. Ecological Applications 3:209-212.
Parametrix. 2002. Bear Creek Habitat Inventory and Assessment. Prepared for King County
Water and Land Resources Division. Seattle, WA.
Rice S.P., P. Kiffney, C. Greene, G. R. Pess. 2008. The ecological importance of tributaries and confluences. In: River Confluences, Tributaries and the Fluvial Network (Eds S.P. Rice, A.G. Roy & B.L. Rhoads), pp. 209–242. John Wiley & Sons Ltd., West Sussex, England.
Roni, P., K. Hanson, and T. Beechie. 2008. Global review of the physical and biological
effectiveness of stream habitat rehabilitation techniques. North American Journal of Fisheries Management, 28, 856–890.
DRAFT Bear Creek Watershed Management Study
King County Science and Technical Support Section 129 February 2018
Roni, P., G.R. Pess, T.J. Beechie, and K.M. Hanson. 2014. Fish-habitat relationships and the
effectiveness of habitat restoration. U.S. Dept. Commerce. NOAA Tech. Memo. NMFS-
NWFSC-127.
US EPA. 2017. Web page accessed 21 April 2017. https://www.epa.gov/wetlands
Washington State Department of Ecology (Ecology). 2011a. Waters Requiring
Supplemental Spawning and Incubation Protection for Salmonid Species.
Washington State Department of Ecology, Olympia, WA. Publication No. 11-10-024.
Washington State Department of Ecology (Ecology). 2011b. Bear-Evans Watershed
Temperature, Dissolved Oxygen and Fecal Coliform Bacteria Total Maximum Daily
Load Water Quality Implementation Plan. Washington State Department of Ecology,
Olympia, WA. Publication No. 06-10-038.
WRIA 8 Steering Committee. 2005. Final – Lake Washington/Cedar/Sammamish Watershed (WRIA8) Chinook Salmon Conservation Plan, Volumes I-III. Prepared by the WRIA 8 Technical Committee. Seattle, WA.
WRIA 8 Salmon Recovery Council. 2017. Lake Washington/Cedar/Sammamish Watershed
(WRIA 8) Chinook Salmon Conservation Plan 10-year Update (2017). Water Resource Inventory Area (WRIA) 8. Seattle, WA.

DRAFT Bear Creek Watershed Management Study
King County Science and Technical Support Section 130 February 2018