beacon monitor operations experiment · dennis decoste, sue finley, henry hotz, gabor lanyi, alan...
TRANSCRIPT

i
Dennis DeCoste, Susan G. Finley, Henry B. Hotz, Gabor E. Lanyi,Alan P. Schlutsmeyer, Robert L. Sherwood, Miles K. Sue, John Szijjarto,E. Jay WyattJet Propulsion LaboratoryCalifornia Institute of TechnologyPasadena, California 91109
Beacon Monitor Operations ExperimentDS1 Technology Validation Report

Deep Space 1 Technology Validation Report—Beacon Monitor Operations Experiment
ii
Table of ContentsSection Page
Table of Contents..................................................................................................................................................... iiFigures ...................................................................................................................................................................... iiTables........................................................................................................................................................................ iiExtended Abstract .................................................................................................................................................. ivBeacon Monitor Operations Experiment (BMOX)................................................................................................. 1DS1 Technology Validation Report ........................................................................................................................ 11.0 Introduction ........................................................................................................................................................ 12.0 Technology Description .................................................................................................................................... 1
2.1 What It Is/What It Is Supposed To Do .............................................................................................................................. 12.2 Key Technology Validation Objectives at Launch............................................................................................................ 32.3 Expected Performance Envelope....................................................................................................................................... 32.4 Detailed Description.......................................................................................................................................................... 52.5 Technology Interdependencies.......................................................................................................................................... 82.6 Test Program ..................................................................................................................................................................... 8
3.0 Technology Validation Summary ................................................................................................................... 103.1 Tone Experiment Results ................................................................................................................................................ 103.2 Data Summarization Results ........................................................................................................................................... 103.3 Operational Effectiveness Assessment............................................................................................................................ 123.4 Lessons Learned.............................................................................................................................................................. 15
4.0 Technology Application for Future Missions................................................................................................ 175.0 Acknowledgments ........................................................................................................................................... 186.0 List of References............................................................................................................................................ 18Appendix A. List of Telemetry Channels and Names......................................................................................... 19Appendix B. DS1 Technology Validation Power On/Off Times......................................................................... 21
FiguresFigure Page
Figure 1. Operational Concept .................................................................................................................................................... 1Figure 2. Tone-Signal Structure .................................................................................................................................................. 2Figure 3. Monitoring Signal Detector and Message Decoder ..................................................................................................... 5Figure 4. Prioritized Summary Data Description ........................................................................................................................ 7Figure 5. ELMER Adaptive Alarm Limits.................................................................................................................................. 7Figure 6. 1-sec Fourier Spectra of the Input Signals to the Four-Tone Detectors ....................................................................... 8Figure 7. Fourier Spectra of the Output of the Tone-Detectors after Aligning and Summing
(and averaging) 10 FFTs of 1-sec Each............................................................................................................................... 9Figure 8. Tracking of Adaptive Alarm Limit to DS1 Solar Array Temperature ....................................................................... 13Figure 9. Battery Temperature Episode Detection .................................................................................................................... 13
TablesPage Page
Table 1. Tone Definitions............................................................................................................................................................ 2Table 2. BMOX Validation Summary ........................................................................................................................................ 4Table 3. Summarization Telemetry Packets................................................................................................................................ 7Table 4. BMOX Validation Schedule and Matrix..................................................................................................................... 10Table 5. List of Tone Experiments............................................................................................................................................ 11Table 6. Summary of Engineering Data Monitored .................................................................................................................. 12Table 7. Tracking Cost Per Month (34m BWG, 2 contacts per week)...................................................................................... 15

Deep Space 1 Technology Validation Report—Beacon Monitor Operations Experiment
iv
EXTENDED ABSTRACT
The Beacon Monitor Operations Experiment (BMOX) wasone of twelve new technologies that were flight validated onNASA’s Deep Space 1 Mission (DS1). The technologyenables a spacecraft to routinely indicate the urgency ofground contact using a tone signal rather than telemetrywhile also summarizing onboard data to be transmittedwhenever telemetry contact is required. This technology canbe used to lower operational cost, decrease mission risk, anddecrease loading on the over-constrained Deep SpaceNetwork antennas. The technology is baselined onupcoming NASA missions to Europa, Pluto, and the Sun.Successful flight validation has met a requirement todemonstrate the technology before routine use on theEuropa mission.
The end-to-end, Beacon-tone signaling system wasdeveloped to provide a low-cost and low-bandwidth methodfor determining when ground intervention is required. WithBeacon monitoring, the spacecraft sets the tone signal and itis transmitted either in a scheduled manner or continuously,depending on spacecraft operability constraints. The tonesignal is detected on the ground with smaller apertureantennas than would be required for telemetry on a givenmission. Tone detection times are short—on the order of 15minutes or less for most mission designs. The flightvalidation experiment checked out the functionality of thetone-detection and message-delivery system, characterizedoperational performance, obtained parameter limits, andtested selection of tone states by flight software based on thespacecraft’s assessment of its own health. The tone systemwas tested on the DS1 spacecraft in both the X-band andKa-Band.
Engineering data-summarization flight software createsevent-driven and periodic summaries of spacecraft activitiessince the last contact. Episodes are created by identifyingthe culprit and causally-related sensors around the time ofimportant events. This data is gathered at a high sample-rate, assigned a priority, and stored for downlink at the nexttelemetry pass. The gaps are filled in by “snapshots” of all
sensor channels at a much lower sample-rate. The softwarecan use either traditional (static) alarm thresholds oradaptive alarm-limit functions that are determined by astatistical learning network. The adaptive alarm-limittechnology, called the Envelope Learning and Monitoringusing Error Relaxation (ELMER) is one of two artificialintelligence (AI) components in the current software design.The second AI-based method computes empiricaltransforms on individual data channels. These pseudo-sensors enhance the value of summaries and serve as anadditional input in determining the adaptive limits. Thesoftware was originally developed to support Beaconmonitor operations, an approach that enables the spacecraftto determine when ground contact is necessary. In thisapproach, summarization plays a key role in providingoperators with the most important data because all of thestored data cannot be downlinked in a single telemetry pass.Efficient summaries also help facilitate quicktroubleshooting and thus can reduce the risk of losing themission. Summarization algorithms can also be applied tononspace systems to decrease the time required to performdata analysis. The current version of the software runs onVxWorks and has been executed on the PowerPC andRAD6000 target processors.
The experiment also included operational testing of aground system prototype, called BeaVis (BeaconVisualization), that was designed to facilitate quickinteraction with BMOX data. The purpose of this system isto track Beacon-tone states throughout a mission and todisplay downlinked summary data. For Beacon missions,the user must be able to quickly maneuver through summarydata to arrive at an assessment of overall system state and todiagnose any problems that occur. The software enables theuser to scroll through a graphical depiction of telemetrydownlinks throughout the life of the mission to select thedesired data. Summary data is represented graphically witha hypertext style link to the strip charts of the sensorchannels contained in each of the four types of summarydata packets. A web version of the tool was alsoimplemented.

Deep Space 1 Technology Validation Report—Beacon Monitor Operations Experiment
v
What is It?The Beacon monitor operations technology providesthe spacecraft the functionality required to initiate te-lemetry tracking only when ground intervention is nec-essary.
Why Is It Exciting Technology?
• Mission operations cost is reduced substantiallybecause there is less contact with the spacecraft
• Reduced loading on ground antennas enablesmore spacecraft to be operated with existingground resources
• Beacon uses state-of-the-art techniques for sum-marizing onboard spacecraft performance data
How Does it Work?
• Instead of routinely sending spacecraft healthdata, the spacecraft evaluates its own state andtransmits one of four Beacon tones that revealhow urgent it is to send high-rate health data
• When telemetry tracking is required, the space-craft creates and transmits "intelligent" summariesof onboard conditions instead of sending bulk te-lemetry data to the ground
When Will it be Demonstrated?
• Flight demonstration occurred on the Deep Space1 mission launched in October 1998
• The technology is being adopted by the DS1 Ex-tended Mission to lower operations cost
• The technology has also been baselined forplanned NASA missions to Europa, Pluto, and theSun
Intelligentsummarieswhen trackingis required
Tones indicate theurgency of trackingspacecraft for telemetry
Automated tone detectionusing small aperture antenna
Antenna normally used fortelemetry acquisitionIssue tracking
request
Report tone status to flight team
Concept Overview
Technology for Low Cost Operations
Principal Investigator: E. Jay WyattEmail: [email protected]
Team: Dennis DeCoste, Sue Finley, Henry Hotz,Gabor Lanyi, Alan Schlutsmeyer, Rob Sherwood,
John Szijjarto, Miles Sue
Jet Propulsion LaboratoryCalifornia Institute of Technology
Pasadena, California 91109
World Wide Web - http://eazy.jpl.nasa.gov/Beacon
JPL 2/00
National Aeronautics andSpace Administration
Jet Propulsion LaboratoryCalifornia Institute of Technology

Deep Space 1 Technology Validation Report—Beacon Monitor Operations Experiment
1
Beacon Monitor Operations Experiment (BMOX)DS1 Technology Validation Report
Dennis DeCoste, Sue Finley, Henry Hotz, Gabor Lanyi, Alan Schlutsmeyer,Robert L. Sherwood, Miles Sue, John Szijjarto, E. J. Wyatt
Jet Propulsion Laboratory, California Institute of Technology, Pasadena, California
1.0 INTRODUCTION
The budget environment that has evolved since the adventof NASA’s Faster, Better, Cheaper initiative has causedmission-risk policies and mission designs to change in waysthat have been conducive to the inception of new operationsconcepts and supporting technologies. Such was the casewhen the Beacon monitor concept was conceived to enablea mission to Pluto to be achieved within the budgetconstraints passed down from NASA. The technology wasaccepted into the New Millennium Program and baselinedfor flight validation on the DS1 mission. As the technologywas being developed for DS1, the NASA community hasexpressed a growing interest and acceptance of adaptiveoperations and onboard autonomy.
In traditional mission operations, the spacecraft typicallyreceives commands from the ground and, in turn, transmitstelemetry in the form of science or engineering data. WithBeacon monitoring, the spacecraft assumes responsibilityfor determining when telemetry will be sent and sends whatamounts to a command to the ground to inform the flightoperations team how urgent it is to track the spacecraft fortelemetry. There are only four such commands. Thinking ofBeacon operations in this way creates a paradigm shift overthe way operations are traditionally approached. Also, it isvery important to not think of the tone message as just alittle bit of telemetry. If one does this, it is easy to make theargument that a little more telemetry is better. Our approachis one where telemetry is only transmitted when it isnecessary for ground personnel to assist the spacecraft. Ifthe spacecraft goes through long periods (a month or so)without requiring ground assistance. When telemetrytracking is necessary, the intelligent data summaries containthe most relevant information to provide full insights intospacecraft activities since the last contact. The key challengehas been to develop an architecture that enables thespacecraft to adaptively create summary information tomake best use of the available bandwidth as the missionprogresses such that all pertinent data is received in onefour-to-eight-hour telemetry pass.
This work was funded from three NASA funding sources.The NASA Cross Enterprise Technology DevelopmentProgram (CETDP) Thinking Systems Thrust Area fundedflight software development. The Telecommunications andMission Operations Directorate (TMOD) Mission Services
Technology Program funded development of the tonedetection algorithm and also funded development of flightsoftware. Additionally, a small amount of funding from theNew Millennium Program was supplied towards the end ofthe prime mission to help offset the additional costsimposed by DS1 schedule delays.
2.0 TECHNOLOGY DESCRIPTION
2.1 What It Is/What It Is Supposed To DoBeacon Monitor Operations refers to a spacecraft-initiatedoperations concept and the supporting technologycomponents. The supporting technology components are thetone subsystem and the onboard engineering datasummarization subsystem, both of which were flightvalidated on DS1. The operational concept shown in Figure1 depicts a typical end-use scenario where the spacecraftroutinely sends one of four X-band tone messages thatindicate how urgent it is to track for telemetry. This tone isreceived at a smaller aperture antenna than would berequired for telemetry for that mission. If the tone indicatedthat telemetry tracking was required, a summary of theimportant telemetry data stored onboard since the lastcontact would be downlinked via a normal telemetry link.
Telemetry Summary
BeaconTone
PagerNotification
Schedule Telemetry Track
AnalyzeSummary Data
Figure 1. Operational Concept
Advantages of using this technology fall into threecategories: reducing mission cost, reducing Deep SpaceNetwork (DSN) loading, and reducing mission risk.Operations cost is reduced by reducing the frequency ofcontact and by reducing the total volume of downlinkeddata. Savings are realized through staffing reductions

Deep Space 1 Technology Validation Report—Beacon Monitor Operations Experiment
2
(because fewer people are required to analyze telemetry)and reductions in antenna usage. These reductions help theDSN contend with the oversubscription problem that existstoday and that is poised to become worse in the future dueto the large number of planned missions. Mission-riskreductions are another major advantage to this technology.At first glance, it may seem that Beacon operations is morerisky than traditional operations. However, with today’sfaster-better-cheaper missions, scheduled telemetry trackingis being scaled-back due to cost constraints. With Beaconmonitoring, the spacecraft can, at low cost, transmitassurances that the spacecraft is behaving as expected inbetween scheduled telemetry tracks. This reduces thechance of having a catastrophic, time-critical failure and, forion-propulsion system, affords the additional advantage ofverifying that thrusting is ON. If, for example, an ionmission lost thrusting immediately after a scheduledtelemetry pass, a week or more may pass before groundpersonnel become aware of the problem. With Beacon,response time could be cut to just a few days (or less). Lossof thrusting for a week or more could cause the mission tonot reach the target body.
2.2.1 Beacon Tone Monitoring System—As mentionedbefore, the tone system is used to routinely monitor thehealth of the mission. There are four tone signals; eachsignal uniquely represents one of the four urgency-basedBeacon messages. The DS1 tone definitions are summarizedin Table 1. These tones are generated as the spacecraftsoftware reacts to real-time events.
Table 1. Tone DefinitionsTone Definition
NominalSpacecraft is nominal. All functions are per-forming as expected. No need to downlinkengineering telemetry.
Interesting
An interesting and non-urgent event has oc-curred on the spacecraft. Establish communi-cation with the ground when convenient. Ex-amples: device reset to clear error caused bySingle Event Upset (SEU), other transientevents.
Important
Communication with the ground needs to beachieved within a certain time or the space-craft state could deteriorate and/or criticaldata could be lost. Examples: memory nearfull, non-critical hardware failure.
Urgent
Spacecraft emergency. A critical componentof the spacecraft has failed. The spacecraftcannot autonomously recover and groundintervention is required immediately. Exam-ples: PDU failure, SRU failure, IPS gimbalstuck.
No ToneBeacon mode is not operating. Spacecrafttelecom is not Earth-pointed or spacecraftanomaly prohibited tone from being sent.
It is important to communicate the urgency of groundresponse using a telecommunications method that has a lowdetection threshold and short detection times. Ease ofdetection translates to lower cost operations. The signalstructure is shown in Figure 2. Each message is representedby a pair of tones centered about the carrier frequency.Tones are generated by phase-modulating the RF carrier bya square-wave subcarrier using a 90-degree modulationangle. The carrier frequency (Fc) is completely suppressed.The resulting downlink spectrum consists of tones at oddmultiples of the subcarrier frequency above and below thecarrier. Four pairs of tones are needed to represent the fourpossible messages.
Fc Fc+f1 Fc+f4f
B
Fc-f4 Fc-f1
B=Frequency uncertainty Fc=Carrier frequencyfi=Subcarrier frequency for the i message
Figure 2. Tone-Signal Structure
2.1.2 Onboard Summarization System—If the Beacon toneindicates that tracking is required, the onboardsummarization system provides concise summaries of allpertinent spacecraft data since the previous contact. Thissubsystem gathers high-level spacecraft information—suchas the number of alarm crossings, spacecraft mode and statehistories, and other pertinent statistics—since the lastground contact. It also gathers episode data for the culpritand causally related sensor channels whenever a sensorviolates an alarm threshold and stores the data at a highsample rate. It collects snapshot telemetry at a much lowersample rate for all sensors and transform channels. Snapshotdata serves only for rough correlation and to fill in the gapsbetween episodes. The last component of the downlinkedsummary—performance data—is similar to episode data butcaptures maneuvers or other events known in advance to beof interest to people on the ground. All of the summaryalgorithms are implemented in C for the VxWorks operatingsystem.
The summary algorithms incorporate AI-based methods toenhance anomaly-detection and episode-identificationcapability. The Envelope Learning and Monitoring usingError Relaxation (ELMER) technology replaces traditionalredlines with time-varying alarm thresholds to provide fasterdetection with fewer false alarms. The system uses astatistical network to learn these functions; training can beperformed onboard or on the ground (ground-based forDS1). ELMER is particularly powerful because it requiresvery little domain knowledge and trains the statisticalnetwork with nominal sensor data. Another artificial

Deep Space 1 Technology Validation Report—Beacon Monitor Operations Experiment
3
intelligence (AI) method produces empirical transforms thathave a heritage in previous AI research at JPL in selectivemonitoring. Once computed onboard, these act as virtualsensors. The current transforms for DS1 compute high, low,and average values, and first and second derivatives. Alarmlimits can be placed on these transforms and also serve as aninput to the ELMER adaptive-alarm limits. Additionaltransforms, if desired, can easily be defined and uplinked tothe spacecraft as the mission progresses.
2.2 Key Technology Validation Objectives at LaunchThe primary validation objective was to verify that the twosubsystems (tone and summarization) were fully deployedand operating as expected. This was accomplished through aseries of experiments to test the basic functionality of thedeployed system. An additional validation objective was toevaluate the operational effectiveness of using thetechnology on future missions and on DS1 in the extendedmission phase.
Validation objectives were captured in a signed TechnologyValidation Agreement between the BMOX Team and theDS1 project.
2.2.1 Objectives Prior to Experiment Turn-on—1. Test summarization algorithms and ground visualiza-
tion environment using representative spacecraft data(Topography Experiment (TOPEX/Poseidon)) prior toDS1 testbed data availability
2. Provide unit-test verification test runs in “Papabed” andTestbed environments for test of all BMOX flight soft-ware capability
3. Verify that the tone detector can automatically detectweak signals using schedule and predicts information
2.2.2 Expected In-flight Observables—1. Tones detected at DSS 13 during experiment activities,
conducted periodically throughout the prime mission2. Tone message delivery to JPL3. Engineering data summaries downlinked during sched-
uled DS1 project telemetry passes4. Characterization of tone system behavior with mission
distance5. Demonstration of the ability to detect spacecraft
anomalies, map to Beacon tones, and detect the toneson the ground in a timely manner
6. Produce summary data that provides value-added in-formation if Beacon monitoring were to be used as theprimary mode of operations
7. Characterization of DS1 staffing level for routine op-erations and a comparison of that staffing level to theexpected level of support required in performing Bea-con operations
8. Detailed analysis of antenna tracking time with andwithout Beacon operations
9. Assessment of the number of mission anomalies orevents requiring ground intervention
Success Criteria (Quantifiable/Measurable Goals):
2.2.3 Prior to Experiment Turn-on—1. Tones detectable at DSS 13 throughout the primary
mission phase2. Adaptive summaries of spacecraft health information
that result in downlink bandwidth savings over tradi-tional downlink approaches
3. Telecom system capable of generating X-band tonesper Small Deep Space Transponder specifications
2.2.4 In-Flight—1. Determination of the size of engineering data summa-
ries required to adequately analyze spacecraft condi-tions when the tone indicates that ground intervention isrequired
2. Tone detection probability of 95% or greater3. Onboard tone selection accuracy of 95% or better for
urgent conditions4. Message delivery latency less than 1 hour5. Major (urgent) event capture in summary data 90% or
better using traditional alarm limits, 70% or better usingadaptive alarm limits (after initial checkout period)
6. Summary data sufficient for determining correctiveactions at least 75% of the time
7. Ability to display summary data within 2 hours ofdownlink data available to DS1 project
8. Determine, through operational experiments, that Bea-con operations will reduce routine operations cost onDS1 by at least 25%
9. Determine, through operational experiments, the exactlevel of expected savings in operations-staffing cost andantenna-tracking cost on future JPL missions.
2.3 Expected Performance EnvelopeTable 2 illustrates the full set of validation objectives andthe weighting of each in computing the percent validated atany point during the mission and includes brief descriptionsof the experiments that were conducted and the associatedsuccess criteria.

Deep Space 1 Technology Validation Report—Beacon Monitor Operations Experiment
4
Table 2. BMOX Validation SummaryExperiments Goal Success Criteria Validation % Antenna When How many
tone passesPass Dura-
tion, hr1. Engineering Summary Data Gen-
eration & Visualization, and ToneSelection
50%1.1 Data Generation and Visualization
– Functional checkoutDemo end-to-end functionality of on-board data summarization system.
Summarization algorithms work as expectedduring DS1 mission operations. 25% HGA Starting late
Feb., 99(Regular
DS1 Telem.)Depends onbandwidth
1.2 Data Generation and Visualization– Detailed performance verifica-tion
Performed detailed analysis of allfeatures of the software.
Summarization data successfully determinesspacecraft anomalies with enough detail forspacecraft engineers to respond appropriately.
15% HGA Jul. – Dec.,99
(RegularDS1 Telem.)
Depends onbandwidth
1.3 Tone Selection
Demo FSW functionality to set andreset the tones and meaningful map-ping from spacecraft health to ur-gency-based request.
Tones are set as a result of a spacecraft dataout-of-limits condition. Parameter file can beeasily updated and uploaded. Tones selectoris reset.
10% HGA orLGA
Apr. – Dec.,99
Some te-lemetry,
some mid-week
1
1.4 Final analysis & report generationAnalyze and document results, les-sons learned, and as-flown design ina final report.
The software system provides a viable meansfor conducting spacecraft-initiated operationson future space missions.
Not included invalidation
2.Tone Trans. & Detection 40%2.1 SDST functionality checkout Verify that the SDST can correctly
generate Beacon tones.SDST generates and transmits the 4 Beacontones, as instructed via uploaded commands. 20% HGA Jan., 99 1 2.5
2.2 Tone Calibration - X
Calibrate Beacon frequency & tonedetector parameters, and verify pre-dicts. Establish the lowest thresholdand the longest integration time pos-sible.
Successfully detect Beacon tones and obtainfrequency uncertainty estimates. 10% HGA or
LGAFeb. - Mar.,
99 4 1
2.3 Tone Detection - LGA Demonstrate weak-signal detection. Detect signal with power level 5-10 dB Hz. 5% LGA orHGA Mar., 99 1 1
2.4 Tone Detection - Ka Obtain Ka-band Beacon signal char-acteristics.
Successfully detect and record Ka-Beaconsignal. 5% HGA Mar. – Apr.,
99 1 1
2.5 Detailed analysis & report genera-tion
Analyze and document tone-transmission and detection systemresults in a final report.
Beacon signaling system provides a viablemeans for conducting spacecraft-initiated op-erations on future space missions.
Not included invalidation
3.Multi-mission Ground Support 10%3.1 Functional demo of tone notifica-
tion processDemonstrate a low-cost and reliableprocess to detect and deliver Beaconmessages in a realistic environment.
The tone detector detects and delivers Beaconmessages within 1/2 hr after the Beacon tonepass.
10% Feb. - Mar.,99
Use passesfrom 2.2above
3.2 DSN Track Automation
Demonstrate viable demand-basedDSN antenna scheduling schemesand methods for automating the tonedetection process.
Beacon- triggered DSN passes can be suc-cessfully scheduled using a real DSN stationschedule.
Optional for ex-tended mission
4. Ops Concept Assessments N/A
4.1 Effectiveness Assessment Produce a final report documentingresults of cost benefit analysis.
Quantify future mission-tracking cost and per-sonnel cost savings for Beacon operations.
Not included invalidation
4.2 Perform Beacon operations duringDS1 prime mission operations
Evaluate effectiveness through Bea-con ops for DS1 ops benefit.
Beacon ops is mature enough to support DS1extended mission.
Optional post-validation activity
4.3 Perform Beacon operations duringDS1 extended mission
Provide updates to flight software andcontinue performance assessment.
Demonstrated ops-cost savings during DS1extended mission.
Optional for ex-tended mission

Deep Space 1 Technology Validation Report—Beacon Monitor Operations Experiment
5
2.4 Detailed Description2.4.1 Tone Experiment Detailed Description—The tonemonitoring technology consists of generation, transmission,and detection of the tone signals. The primary requirementwas to transmit tones in X-band; however, Ka-band wastested to help pave the way for future missions that may usea Ka-band transponder. The experiments were alsoconstructed so that detection of weak signals, such as from amission to Pluto, could be validated. Finally, tone-messagehandling and reporting and overall low-cost operation of thetone system was assessed.
There are four tone signals. Each tone uniquely representsone of the four urgency-based Beacon messages. For adescription of the tone meanings, refer to Table 1.
BMOX was designed so that the urgent Beacon tones aresent when the spacecraft fault protection puts the spacecraftin standby mode. This condition occurs when the faultprotection encounters a fault that it cannot correct. Standbymode halts the current command sequence, including IPSthrusting. The software to control this condition wasonboard the spacecraft but never enabled.
During the DS1 tone experiment, the Beacon tone was sentat prescheduled times for about 30 minutes. The Beacontone was not operated continuously because DS1 requires asmuch power as possible for IPS thrusting and the tonetransmission reduces the power available for thrusting.
The tone is sent using the DS1 Small Deep SpaceTransponder (SDST). The signal structure is shown inFigure 2. A pair of tones centered about the carrierrepresents each message. These tones are generated byphase-modulating the RF carrier by a square-wavesubcarrier using a 90-degree modulation angle. Thefrequency carrier (Fc) is completely suppressed. Theresulting downlink spectrum consists of tones at oddmultiples of the subcarrier frequency above and below thecarrier. For the DS1 experiment, the four-subcarrierfrequencies (f1, f2, f3, and f4) are 20, 25, 30, and 35 kHz,respectively. Different frequency allocations can beassigned to different missions. The monitoring system isdesigned to achieve a low-detection threshold. The goal is toreliably detect the monitoring messages with 0 dB-Hz total-received-signal-to-noise-spectral-density ratio (Pt/No) using1000 seconds observation time.
The Beacon message is first received and decoded by theGoldstone site and subsequently transmitted to a signaldetector at JPL. Next, the Beacon message is forwarded toDS1 Mission Operations and other end users, including theDemand Access Scheduler, using e-mail or pagers.
The signal detector contains four tone detectors, one foreach message. To ensure proper signal detection, the band-
width of each tone detector must be sufficiently large toaccommodate the frequency uncertainty and frequency driftof the downlink frequency: i.e., the Beacon tones for a givenmessage will not drift outside of the passband of thedetector for that message. The FFT (Fast Fourier Transform)is employed to compute the energy of all spectral pairshaving spacing corresponding to the four Beacon signals.Because of oscillator instability, Fourier transforms cannotbe produced over long time intervals. The total observationtime is divided into short intervals. FFTs are first performedover these short intervals and then incoherently combinedafter the frequency drift has been removed. The maximumof the outputs of the four tone detectors is then selected andcompared against a pre-determined threshold to determinewhich message has been received. A block diagram for thesignal detector and the message decoder is shown in Figure3.
r(t)D/C MAX
{Xi}
Tone Det.(Msg. 1)
X1
Tone Det.(Msg. 2)
X2
Tone Det.(Msg. 3)
X3
Tone Det.(Msg. 4)
X4
Xi <
thr
esho
ld?
Yes
No
Msg i
No Signal
r(t)
Figure 3. Monitoring Signal Detector and MessageDecoder
2.4.1.1 Tone Transmission and Detection Experiment—Thefour Beacon messages are represented by four pairs oftones; these tones will be generated by modulating thedownlink carrier with an appropriate subcarrier using a 90-degree modulation angle. The four subcarriers selected torepresent the four Beacon messages are:
Beacon Message Subcarrier Frequency, KHzNORMAL 20INTERESTING 25IMPORTANT 30URGENT 35
The DS1 spacecraft is equipped with two transmitters: X-band and Ka-band. When Beacon tones are beingtransmitted via one of the two links, no telemetry can besent over the same link. However, DS1 can transmit Beaconsignals using one link (e.g., X-band) and simultaneouslydownlink telemetry using the other link (e.g., Ka-band).
The first tone pass was used to verify the functionality of theSmall Deep Space Transponder (SDST). Four commandswere sent directly to the SDST software manager, eachrepresenting a different tone. The Beacon flight software

Deep Space 1 Technology Validation Report—Beacon Monitor Operations Experiment
6
was not used during this test. The tones were detected on theground beginning in January, 1999.
The next part of the experiment used four Beacon passes tocalibrate the signal and compare against prediction. A set ofBeacon tone states was loaded into the command sequenceon the spacecraft. Beacon tones were then generatedonboard, transmitted to the ground, and detected by DSS 13at Goldstone. The detector and tone frequencies werecalibrated, predicts were verified, and detector parameterswere determined. In the first three tests, the Beacon tonestates were pre-selected, but unknown to the tone detectionpersonnel. In the last test, a tone was generated by theonboard Beacon flight software. These tone passes occurredbetween February and April, 1999. This set of four tonepasses was the minimum required to calibrate the detectionsystem and validate its performance.
All Beacon passes require dedicated use of either the LGAor HGA during a Goldstone pass. Telemetry and Beaconsignals cannot be transmitted simultaneously over the samecommunication link (of the same frequency, X- or Ka-band); therefore, Beacon passes were scheduled toaccommodate the DSN telemetry passes. In addition to theabove calibration-tone experiments, two additionalexperiments were scheduled to test the performance of theBeacon-tone detector using the Ka-band frequency andusing the X-band frequency in a weak-signal regime. TheKa-band experiment was identical to the X-band experimentexcept for the frequency. The purpose of the weak-signalX-band experiment was to determine the threshold at whichthe signal can no longer be detected. These two experimentswere scheduled to occur during March–April, 1999.
2.4.1.2 Multi-mission Ground Support Experiment—Theobjective of the Multi-mission Ground Support Experimentwas to demonstrate a low-cost, reliable process to deliverBeacon messages to the flight project within a reasonableamount of time. For the DS1 Beacon experiment, this timewas defined to be less than 30 minutes. The Beacon tonepasses from the tone transmission experiments were used inthis experiment. During these passes, Beacon messageswere generated, transmitted, and subsequently detected bythe ground station (DSS 13). The detected messages weredelivered to the BMOX team at JPL via e-mail or pager.Post-Beacon pass telemetry was used to verify the correcttransmission times.
2.4.2 Data Summarization Detailed Description―If theBeacon tone indicates that tracking is required, the onboardsummarization system provides concise summaries of allpertinent spacecraft data since the previous contact. Thesummarization system performs three functions: datacollection and processing, mission activity determination,and episode identification. The data collection sub-routinereceives data from the engineering telemetry system via a
function call and applies summary techniques to this data,producing summary measures for downlink to the ground.The mission activity sub-routine determines the overallspacecraft mode of operation. This determination is used tochoose the appropriate data and limits monitored by theepisode sub-routine. The mission activity is intended to beexclusive. When a new mission activity starts, the previousmission activity is assumed to have ended. The episode sub-routine combines summary and engineering data receivedinternally from the data-collection sub-routine with themission activity received from the activity sub-routine andcompares the data with mission-activity-specific alarmlimits. It is necessary to use the mission activities todetermine which data to use for episode identification and toidentify the limits of these data. If the limit is exceeded, thesub-routine spawns a new episode and collects past relevantdata from the data collection sub-routine. The past datacollected will be one-minute summaries that go back in timeas far as the user has defined. (Therefore, a five-minuteepisode would contain summaries starting five minutesbefore the episode to five minutes after the episode.) At theend of the episode, the sub-routine outputs data to thetelemetry subsystem for downlink.
Three different types of summarized data are producedonboard: overall performance summary, user-definedperformance summary, and anomaly summary. Six differenttelemetry packets have been defined to contain thisinformation (see Table 3. Taken as a whole, the telemetrypackets produce summary downlinks that are used to enablefast determination of spacecraft state by ground personnel.The summary data is prioritized in the downlink so that themost important data is sent first (Figure 4). The firsttelemetry sent is a summary of events since the previousdownlink. Next, the episodic data, the nominal data, and,finally, the user performance are sent.
The performance summaries are generated at regularintervals and stored in memory until the next telemetry-round contact. They are computed by applying standardfunctions, such as minimum, maximum, mean, firstderivative, and second derivative, to the data. User-definedsummary data can provide detailed information on aparticular subsystem and are created at the user’s discretion.Anomaly summary data (episodes) are created when the rawand summarized data violate high or low limits. These limitsare determined by the subsystem specialist and stored in atable onboard the spacecraft. The limit tables are based onthe current mission activity.
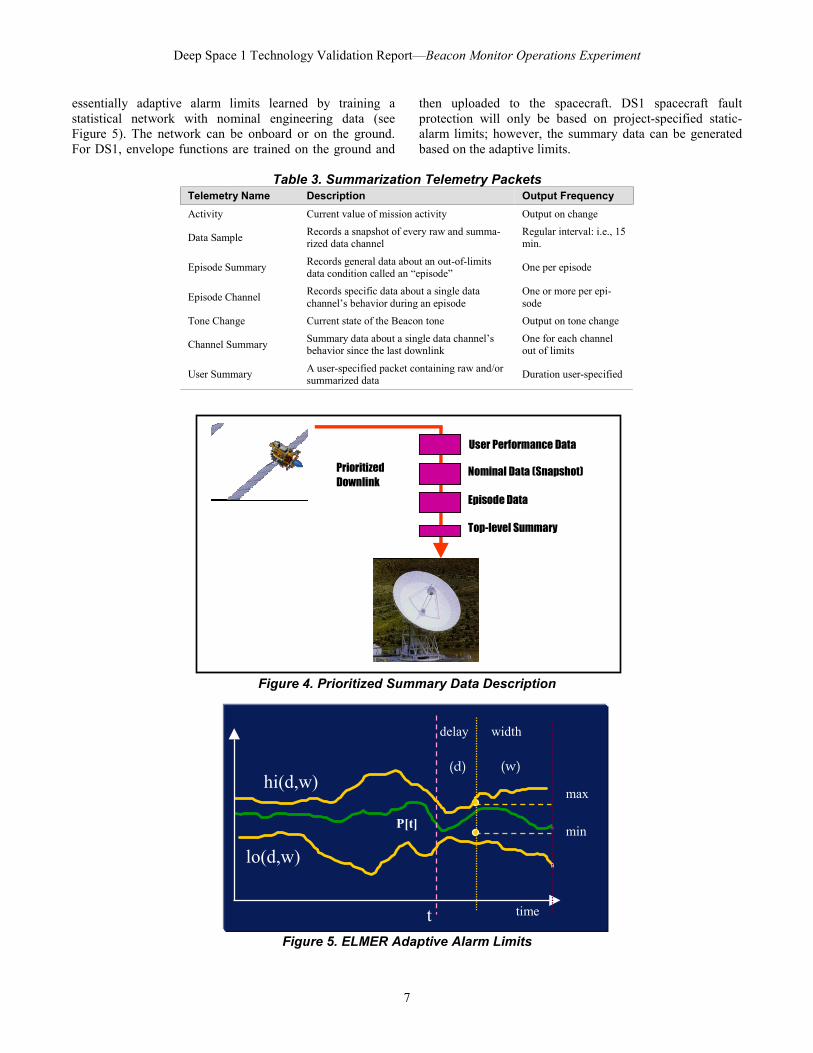
The software also has the capability to use AI-basedenvelope functions instead of traditional alarm limits. Thissystem, called Envelope Learning and Monitoring usingError Relaxation (ELMER), provides a new form of eventdetection will be evaluated in addition to using the project-specified traditional alarm limits. Envelope functions are
Deep Space 1 Technology Validation Report—Beacon Monitor Operations Experiment
7
essentially adaptive alarm limits learned by training astatistical network with nominal engineering data (seeFigure 5). The network can be onboard or on the ground.For DS1, envelope functions are trained on the ground and
then uploaded to the spacecraft. DS1 spacecraft faultprotection will only be based on project-specified static-alarm limits; however, the summary data can be generatedbased on the adaptive limits.
Table 3. Summarization Telemetry PacketsTelemetry Name Description Output FrequencyActivity Current value of mission activity Output on change
Data Sample Records a snapshot of every raw and summa-rized data channel
Regular interval: i.e., 15min.
Episode Summary Records general data about an out-of-limitsdata condition called an “episode” One per episode
Episode Channel Records specific data about a single datachannel’s behavior during an episode
One or more per epi-sode
Tone Change Current state of the Beacon tone Output on tone change
Channel Summary Summary data about a single data channel’sbehavior since the last downlink
One for each channelout of limits
User Summary A user-specified packet containing raw and/orsummarized data Duration user-specified
Top-level Summary
Episode Data
Nominal Data (Snapshot)
User Performance Data
PrioritizedDownlink
Figure 4. Prioritized Summary Data Description
Figure 5. ELMER Adaptive Alarm Limits
max
widthdelay
hi(d,w)
lo(d,w)minP[t]
(w)(d)
timet

Deep Space 1 Technology Validation Report—Beacon Monitor Operations Experiment
8
The sampler module and its related data-gathering modulecurrently consist of 3038 lines of source code and 222 KBof memory on the Power PC series processors. Activitydetermination is a rare event and processing time isnegligible. The once-per-wake-up processing time for DS1averages 30 ms.
2.5 Technology InterdependenciesDS1 BMOX was designed to have minimal impact on theoperation of the baseline DS1 mission. There are, however,some important interdependencies to note for futuremissions that may be interested in deploying the technology.These are summarized as follows:
• The transponder should be capable of transmitting bea-con tone signals. The Small Deep Space Transponder(SDST) has this capability, as does the Space Trans-ponding Modem (STM).
• The algorithms used for anomaly detection within theSummarization System should be the same as thoseused for fault detection within the fault-protection sub-system. Otherwise, summary data may not capture therelevant data.
• Bandwidth-constrained missions will likely have moreof a use for tone monitoring.
• Operationally-constrained spacecraft designs make un-attended operations difficult, adding cost and decreas-ing the utility of Beacon operations.
2.6 Test Program2.6.1 Ground Test—A number of system-level tests/demonstrations were conducted throughout the developmentprocess to validate the design concept and hardware/software interfaces. These tests/demonstrations were alsoconducted to satisfy project-related requirements.
2.6.1.1 SDST/Tone Detector Compatibility Tests—The firstmajor test was to validate the compatibility between the tonedetector and the SDST. Beacon signals were generated bythe SDST (engineering model) in the radio laboratory inBuilding 161. The signals were transmitted to a test facilityin Woodbury, where the signals were down-converted to300 MHz IF and recorded by the Full Spectrum Recorder(FSR). The recorded signals were processed by the tone-detection algorithm installed in the FSR.
An example of the detection results is shown in Figure 6and Figure 7 using 20 KHz as a signal frequency. Figure 6gives the Fourier spectrum of a 1-sec snapshot of themonitoring signal before being processed by the detector:i.e., the spectra of the input signals to the four tonedetectors. Figure 7 gives the Fourier spectra of the outputsof the four tone detectors after aligning, summing andaveraging over 10 FFTs, each of 1-sec duration. Thehorizontal line is the detection threshold corresponding to agiven false-alarm probability. As shown in the figure, thealigning and summing process significantly reduces thenoise fluctuation and enhances signal detection.
Figure 6. 1-sec Fourier Spectra of the Input Signals to the Four-Tone Detectors

Deep Space 1 Technology Validation Report—Beacon Monitor Operations Experiment
9
Figure 7. Fourier Spectra of the Output of the Tone-Detectors after Aligning and Summing(and averaging) 10 FFTs of 1-sec Each
The recorded data was subsequently and successfully usedin a concept demo, which is one of the requirementsimposed on technologies by DS1. During the conceptualdemo, segments of the previously recorded SDST Beaconsignal data were selected for the tone detector to performreal-time detection. The detector, located in Building 111,was remotely operated from the SMOCC room in Building301, where the concept demo was given. Detection resultswere sent to the SMOCC room via a network connectionand displayed on a projection screen in real-time. Segmentsof the recorded data were selected for the demo and the tonedetector successfully detected the signals and displayed thedetection results.
A second compatibility test was performed with the flighttransponder, during which the spacecraft was in the thermalvacuum chamber and the tone detector was transported tothe Telecom Development Laboratory (TDL). The SDSTwas commanded to send Beacon tones one at a time to theTDL using a fiber-optic link. The signal was demodulatedand down-converted to IF at the TDL. The received signalwas displayed on a spectrum analyzer. The observed spectraconfirmed that the SDST had correctly generated andtransmitted all monitoring signals as commanded. Inaddition, the received monitoring signals were fed to thetone detector, where they were digitized, recorded, andsubsequently detected. These tests revealed that there are nointerface or compatibility issues between the SDST and thetone detector and ensured that they would work smoothly asa tone system.
2.6.1.2 Tone Detection System Test―In addition to beingable to detect very weak signals, it is envisioned that anoperational tone system would be capable of schedule-driven, predicts-driven, fully-automated tone detection andmessage delivery. This would lower the operations cost,which is critical if this technology were to be employed asan operational capability. The original DS1 experiment planwas to leverage on the DST technology to demonstrate in-flight such a capability. A series of system tests wasdesigned and conducted in the TDL to demonstrate (1)predicts generation capability, (2) DST/Tone detectorinterface and file transfer, and (3) automated detection usingfrequency predicts. Frequency predicts were generated bythe DST controller using a SPK file obtained from the DS1Project database. The predict file along with a trigger filewere then sent to the tone detector and were subsequentlyused to detect the TDL-simulated Beacon signals. Twoautomated Beacon detection demonstrations were conductedby using simulated spacecraft tones at TDL. DS-T-generated frequency predicts and a trigger file were used toinitiate the detection of a scheduled pass. The detectordetected Beacon signals at the 7 dB-Hz power signal-to-noise level using 10-s integration time with a probability offalse detection of 0.01. BMOX team members, Section 331engineers, and DS1 management attended this demo. Itfulfilled the pre-launch readiness requirement. This test alsopaved the way for a subsequent in-flight demo.
2.6.2 Flight Test―The test program consisted of executingthe experiments described in Section 2.3. Testing began in

Deep Space 1 Technology Validation Report—Beacon Monitor Operations Experiment
10
January, 1999 and continued through the end of the primemission in September, 1999. Table 4 depicts the flight-validation schedule.
3.0 TECHNOLOGY VALIDATION SUMMARY
The technology was declared fully validated in July, 1999,after both the summarization and tone systems were fullydeployed and tested as described in Section 2. The overallsystem performed as expected and was considered asuccess.
3.1 Tone Experiment ResultsA series of experiments were run to test the end-to-end tonedelivery system. These experiments were designed toincrementally test additional capability for the Beacon-tonesystem. Prior to launch, the ability of the SDST to generateBeacon tones was tested by the telecom engineers. A similartest was performed on the spacecraft several times afterlaunch. This test was called “X-tone” because it tested thecapability to send the Beacon tones using X-bandtransmission. The X-tone test, expanded to use a series oftones to test the ground detection system, was repeatedseveral times throughout March and April, 1999. The datesof these and other tests are listed in Table 5.
The ability of the software to select tones and transmit themin DS1 telemetry was tested on February 26, 1999. This test,called b-tone, consisted of ground commands that set theBeacon tone during a downlink pass. The tone was verifiedin regular DS1 telemetry but was not transmitted to the tonedetector. Each tone was verified during the b-tone test. Inaddition, the tone-reset command was tested.
The next test to run onboard DS1 was the b-transmit test.This test involved setting the Beacon tone using informationfrom the software on board, then transmitting the tone usingthe SDST. The tone was received at the DSS 13 antenna and
forwarded to the tone detector at JPL. No advanceknowledge of the commanded tone was given to the grounddetection engineer. After the tone was detected, it wasdelivered to other members of the Beacon team in an e-mailmessage. The b-transmit test was run three times in April,1999.
The last tone test to be run was the Ka-tone test. This testwas identical to the X-tone test except that it used the Ka-band transmitter to send the Beacon tone. This test was runin April, 1999.
3.2 Data Summarization ResultsThe data summarization was first turned on February 19,1999. The Beacon team determined the limits applied to theengineering data for testing the summarization capability.The limits were set just outside of the minimum andmaximum value seen for the data since launch. Shortly afterthe first turn-on, several of the data channels went intoepisode (out-of-limits) condition. Upon further inspection, itwas determined that many limits were based on engineeringunits (EU), but much of the data was being stored using datanumbers (DN) in EH&A. The data summarization wasturned off after several hours, and the initialization file (alsocalled sampler init file, or SIF) was updated with DN-basedlimits.
On March 8, 1999, the data summarization was turned backfor several hours. A few channels went into alarm; however,the number was reduced from the previous test. Inspectionof the data revealed negative values for some eight-bitsensors. This was impossible because all eight-bit sensorsshould range from 0 to 255. After careful debugging in theDS1 test bed, an error was found in the DS1 flight software.It was discovered that when data are passed from theoriginator to EH&A, EH&A converts the data to its owninternal double-precision format as though it were 8 bits andsigned. This results in the values from 0 to 127 being
Table 4. BMOX Validation Schedule and MatrixJan Feb Mar Apr May Jun Jul Aug Sep
SDST CheckoutTone CalibrationTone NotificationData Summarization -functional CheckoutWeak Signal DetectionKa-Band DetectionSoftware Update & TestingData Summarizationperformance verificationExtended Mission Planning

Deep Space 1 Technology Validation Report—Beacon Monitor Operations Experiment
11
Table 5. List of Tone ExperimentsDate Experiment Type Results
Jan 6 X-tone, 20, 30, 25, & 35 kHzTones found in this order after accounting for 20-second offset in spacecraft inter-nal time. Detection time = 5 min. Frequency offset (FRO) = -4.25kHz, (high gainantenna)
Feb 4 X-tone, 35 & 20 kHz Noisy and stable sub-carriers used with low modulation indexes from low gainantenna. All successfully detected. FRO = -1.98kHz
Feb 26 B-tone & X-tone Software tone test. All four tones were commanded and transmitted through regulartelemetry.
Mar 3 X-tone, 35 & 20 kHz
Antenna computers down and wind speeds halted antenna several times and early,but several detections were successful at very low levels.FRO=1.25 kHz:
20.0001 kHz, DN=3, Pd/N0=8.8, 10 sec,35.0013 kHz, DN=2, Pd/N0=4.2, 15 sec.
Mar 18 X-tone, 30, 20, 25, & 35 kHz X-tone successful. After 4.4 kHz carrier offset was found and applied. Spacecrafttime found to be 10 seconds later than predicted. IPS was on.
Mar 24 X-tone X-tone semi-successful. X-tones found but wrong frequencies because carrierpredicts were off by 4.5 kHz and not entered in FSR.
Apr 7 X-tone, 20, 25, 30, & 30 kHz X-tone successful. Station needs 45 minutes pre-cal vs. 30. FRO=5.0 kHz.
Apr 13 B-transmit & X-tone, 20, 25,30, & 35 kHz
B-transmit successful, 25 kHz tone, needed visibility of carrier before carrier sup-pression to get correct FRO of 5.5 kHz. X-tone was also successful.
Apr 19 Ka-toneThe FSR at DSS 13 tracked the Ka carrier but the Ka-tone sequence did not gettransmitted to the S/C as the auto-nav processing took longer than expected.FRO=0.0 (3-Way).
Apr 20 B-transmit B-transmit successful, detection code found 25 kHz tone, needed visibility of car-rier to find correct FRO of 6.0 kHz.
Apr 26 Ka-tone, 20, 25, 30, &35kHz
Ka-tone was successful for the sequence that was activated. Detection of 20 kHztone at DN=1 was 4.5 Pd/N0 for 15 sec. FRO=9.9 kHz (wrong up-link freq. inpredicts).
Apr 27 B-transmit Detection code found 25 kHz tone, FRO of 6.9 kHz was used to center the signal.
represented correctly, and the values from 128 to 255 beingrepresented as -128 to -1, respectively. EH&A apparentlydoes not have a data-type code for unsigned 8-bit integers.The effect of this problem was that limits were harder (andsometimes impossible) to specify. With a new set of rules, itwas possible to create a SIF that would work around thisproblem for some of the data. If both high and low limitswere 128 or greater, they had to be converted by subtracting256. However, if the low limit was 127 or less and the highlimit is 128 or greater, the limits won’t work. Sensor valueswith both limits less than 127 could remain unchanged.With these rules, another SIF was created and uploaded toDS1. Data summarization was restarted on March 22, 1999.Everything appeared to operate correctly in datasummarization. A few data channels went into episodecondition. It was determined that temperature sensors weredrifting colder due to DS1 moving away from the sun. Thelimits were updated and a new SIF was uplinked.
Data summarization ran smoothly on and off during themonth of April and May, with minor modifications to theSIF due to noisy channels. During this period, a new versionof the Beacon FSW was developed and tested. This version
included a work-around for the limitation of EH&A datadescribed above. In addition, the following new featureswere added:
• The criteria for determining mission activity was pa-rameterized in the SIF
• Episodes will now end if a new SIF is loaded• Additional protection for divide-by-zero conditions• SIFs can now be loaded from EEPROM or RAM• User-data packets can now have start and stop times
associated with themThe new version was started up on June 15, 1999. A newSIF was included with limits determined by the DS1spacecraft engineers. Since that time, data summarizationhas needed a few updates due to false alarms. There areseveral reasons for these false alarms. The Beacon FSW isable to sample the data once per second. This is a muchhigher rate than the data sent to the ground for analysis.Because of the higher rate, the FSW is able to see eventsthat are normally missed on the ground. These events havebeen confirmed by correlating with fault-protectionmonitors that capture maximum excursions on the samesensors.

Deep Space 1 Technology Validation Report—Beacon Monitor Operations Experiment
12
Another reason for false alarms has been activities such asoptical navigation (OPNAVs) that move power and thermalsensors outside their normal ranges. The subsystemengineers respond, “Yes, these events take the sensorsoutside their normal ranges, and yes, this is expectedbehavior.” So where does the Beacon team set the limits?Since the Beacon data summarization is context sensitive, anew “mission activity” for OPNAVs could be created withits own set of limits. An OPNAV activity consists of severalspacecraft turns, with picture taking occurring at each target.This is similar to a maneuver. With this in mind, themission-activity determination criteria for maneuvers hasbeen changed to include optical-navigation activities. Thiswill also make the maneuver activity determination morerobust. Prior to this change, switching to maneuver activitywhen DS1 was actually firing thrusters was only used tochange the velocity. Maneuvers involve turning to athrusting attitude and turning back after the thrusting. Now,the maneuver activity includes these turns and theirrespective settling times as well. This makes sense becauseit is during this entire period that power and thermal sensorsmay deviate from their nominal cruise values. This changewas uplinked in early September, 1999. The current list ofengineering data being monitored is listed in Appendix A. Asummary of this list is contained in Table 6.
Table 6. Summary of Engineering Data MonitoredSubsystem Number of Channels
Attitude Control 8Fault Protection 1Navigation 1Other 2Power 22Propulsion 1Telecommunications 6Temperature (all subsystems) 35
Beacon data summarization has been an evolving processrequiring several limit refinements from the spacecraft team.This should be expected in the development of any datasummarization system. This process is very similar whenany new mission launches. For the first several months,ground alarms are updated as the flight team learns abouthow the spacecraft really operates. The ground-testingactivities give a good first cut at setting alarm levels;however, the spacecraft never operates exactly as it did intest. Implementing context-sensitive limits is a similarprocess. Engineering data limits are no longer set based onthe worst case. Now the worst case can be viewed based onthe spacecraft activities. This should ensure more accuratediscovery of anomalies.
One activity that produced important results involvesanalyzing summary-system performance on DS1 anomaliesto date. Although capabilities were limited due to onboard
memory restrictions, preliminary results when runningELMER on historical data are showing that adaptive alarmthresholds can track gradual trending of sensor data muchtighter than the current DS1 static alarm limits. This is seenin monitoring the gradual drift in eight solar-array-temperature sensors, one of which is shown in Figure 8.Comparing traditional limits with ELMER limits during the81 days of operations, ELMER limits track actual spacecraftperformance much more precisely than static limits, whichwould be off the scale of this chart.
Another validation exercise has confirmed thatsummarization can capture subtle, yet important spacecraftepisodes. In ground tests, ELMER detected an unexpectedheater turn-on that occurred when the solar panels went off-axis during a spacecraft maneuver. Since ELMER trainsacross multiple parameters using nominal data, thesummarization system detected this event without explicit apriori knowledge of the scenario. This data is shown inFigure 9.
ELMER has been running onboard with only 10 sensors, alltemperature. This limitation is primarily due to limitedonboard memory. There have only been three ELMER limitviolations (episodes) during the primary mission. Two haveoccurred during OPNAV events and can be explained by thetemperature excursions associated with spacecraft turns.These are basically “false alarms.” The third episode has notyet been explained. The ELMER limit functions weredeveloped after training on data from the first four monthsof the mission. It is hoped that additional training onspacecraft data since February will correct these falsealarms in an extended mission. There will be additionalELMER limit functions added in an extended mission aswell.
3.3 Operational Effectiveness AssessmentThe experiment afforded insights into the operational costsavings that a future mission might realize. Computing costsavings for DS1, however, was not possible in the primemission because Beacon technology was not usedoperationally by the mission. Although not specified in anyplans, the best measure of the effectiveness of thetechnology turned out to be the interest expressed by theDS1 team in using it for the extended mission phase. InAugust, 1999, work began with the DS1 team to help infusethe technology into the planned two-year extended missionto two additional target bodies. The technology was seen asa way to contend with the severe cost constraints thatextended missions face. Luckily, one of the BMOX designobjectives was to deploy the technology experiment in amanner that would allow the mission to use it oncevalidated.
There were many important results on how to design,implement, and operate Beacon-monitor operations systems

Deep Space 1 Technology Validation Report—Beacon Monitor Operations Experiment
13
on future missions. The entire end-to-end experience ofworking with a flight project team to field this experimentresulted in uncovering important design considerations andlessons learned that will be useful to future missions thatplan to use the technology. These are described in theremainder of this section.
3.3.1 Data Processing Issues—Beacon summary data wasdelivered to the Beacon team through an automated batch
script that queried the data each night. The data was placedin a public directory and then processed by the Beacon teamthe next morning. The processing was a simple task, but wasnot automated because data summarization was frequentlyturned off for days to weeks at a time. During DS1’sextended mission, data summarization should be oncontinuously and, therefore, the data processing should beautomated.
Figure 8. Tracking of Adaptive Alarm Limit to DS1 Solar Array Temperature
Figure 9. Battery Temperature Episode Detection

Deep Space 1 Technology Validation Report—Beacon Monitor Operations Experiment
14
The database used to store Beacon summary data wascreated specifically for the Beacon task. Because summarydata is not easily formatted for commercial databases, it wasdecided to develop a DS1 database. In hindsight, this wasthe wrong decision. It has been very difficult to maintain acustom database. The users do not have good visibility intothe database if the tools are not working correctly. Changesto the database take a programmer to change the codeinstead of running a tool that would be provided with acommercial database. In addition, commercial databaseshave built-in query features that are easy to set-up and use.There were instances in which data was requested, but itcould not be provided in a timely fashion. Also, customrequests such as one for all episodes involving a specificchannel could not be provided. The limitations of using acustom database hindered the operational effectiveness ofBeacon.
3.3.2 Data Summarization Software Enhancements—Thedata summarization software was not relied upon fordetermining spacecraft state. Although the algorithms andreturned summary data seemed adequate, there were severalsuggestions made by the Beacon personnel and flight teamfor further enhancements. Some of these suggestions will beincorporated into the M7 version of the flight software to beuploaded during DS1 extended mission operations.
The episode data was lacking depth because it only providedten samples, each separated by two minutes. The long timebetween samples was set to ensure that Beacon summarydata would not overflow the telemetry buffer in the event ofrepeated episodes on a single channel. For the M7 version ofthe software, the number of samples is being changed to 20and the user will be allowed to set the number of times achannel can go into episode before it stops producingepisode packets. With these changes, the sample intervalcan be set much shorter. In fact, a six-second-sampleinterval will be used. This will give the episodes morevisibility while not overloading the telemetry buffer withfalse alarms. Making a change and adding all data onchange-to episodes was considered; however, the DS1project only wanted very minor software changes in M7.
During the course of operations, the initialization file withthe episode limits was changed and uplinked many times.Many times the changes only involved one or two limits inthe file. Because the file is on the order of 15 kilobytes,there were periods of low communications bandwidth whenit would take several minutes to uplink the file using thelow-gain antenna. Operationally, it is much easier to have acapability to update limits without sending out the entireinitialization file.
The flight team made a few suggestions for improving theusefulness of the summary data. The derivative summaryfunctions, but one of the subsystems suggested that integrals
be added to the summary functions. Several other flight-team members suggested adding different persistence foreach episode limit check. Currently, there is a globalpersistence parameter that applies to all episodes. Thischange will be implemented in our M7 software release.Another suggestion was to add a sample rate to user-performance packets.
Two capabilities that fault-protection monitors have thatshould be present in Beacon are conditional monitors andmaximum excursion tracking. Conditional monitors enablethe user to check multiple sensors based on the values of thesensors. The DS1 fault protection software also has thecapability to track and save the minimum and maximumvalues for sensors. The summarization software will onlytrack these values if the sensor goes into an episodecondition. This may be important data for future missionsrelying on summary data even though the sensors are notoutside their limits. As mentioned in the Lessons-Learnedsection, there should be tighter integration between theBeacon software and the fault-protection software.
3.3.3 Reporting Results to the Flight Team—A set of toolsfor examining the summary data was developed. These toolswere only located on the Beacon team workstation. Sincelaunch, some web-based tools were developed to access thesummary data. These tools have made it easier to report theresults to the flight team, but are very limited in theircapabilities. These tools will be improved during extendedmission. The goal is to make the data easily accessible to theflight-team users. Easy access to the Beacon data is veryimportant for making the technology operationally effective;unfortunately, access was not available during the DS1primary mission.
3.3.4 Automation of Tone Detection—Tone-detectionautomation is proceeding as an activity in support of DS1Extended Mission and was not an objective of the as-launched system. Tone-detection automation was anobjective prior to the TMOD redirection wherein BMOXantenna support was changed from DSS 26 (whichsupported automated demand-access antenna operations) toDSS 13. Full automation involves automatic-predictsgeneration, automatically running scripts to perform toneacquisition, detection, and automatic tone-messagereporting. Tone-message reporting can, in fact, be quiteelaborate, where the autonomous-reporting system expectsconfirmation from users that tones were received. If not, afully automatic reporting system would have a roster of theteam members and would keep contacting people until thetone message was acknowledged. The lessons learned fromconducting tone-detection operations during the mission isthat tone acquisition is highly amenable to automation andwould substantially lower the cost of performing Beaconoperations. Automatic-predicts generation would also serve

Deep Space 1 Technology Validation Report—Beacon Monitor Operations Experiment
15
other users of DSS 13 and would support broader DSS 13automation objectives.
3.3.5 Cost Savings from Using Beacon―Part of future workin Beacon technology involves infusing the Beacontechnology into DS1 mission operations as an end-to-endsystem. Technology infusion is not an easy task andtraditionally has not been done well. DS1 will benefit fromthis work by reducing the amount of tracking time used.
In extended mission, DS1 will have two tracking passes perweek, an 8-hour, high-gain pass on Mondays, and a 4-hourmid-week pass to check spacecraft status. Utilizing Beacon,the DS1 project will not have to use a 4-hour mid-weekDSN pass to check spacecraft status. It can use a 30-minute(or less) Beacon pass that actually provides them withadditional information over a carrier-only pass. In addition,the frequency of eight-hour telemetry passes can be reducedand 30-minute Beacon passes substituted. The number of 8-hour telemetry passes that can be eliminated has not beendetermined, but DS1 expects it could be as many as everyother pass. In this case, there would only be two eight-hourtelemetry passes each month and four 30-minute Beaconpasses each month. The overall savings for this case aresummarized in Table 7. This results in savings of 30 hoursof DSN tracking time or $18,248 per four-week period. Thisdoes not include the substantial savings of mission-engineering-labor costs of performing routine telemetryanalysis.
The benefits of infusing a regular Beacon operationtechnology on DS1 are apparent in the cost savings ofreduced-DSN utilization. In addition, the four-hour mid-week passes are replaced with 30-minute Beacon passes thatcontain additional status information. Future missions willbenefit from the experience of a flight mission using aregular Beacon tone for an extended period of time. Thisincludes the experience of scheduling the DSN for Beaconoperations as well as the success of the Beacon tone systemin relaying the spacecraft status to the ground. Newmissions that could benefit from this technology includeST-4, Pluto Express, Europa Orbiter, and MDS. Each ofthese missions is planning on using either part or all of theBeacon operations technology. The continuation of work onthe Beacon technology by revising the operations conceptwill add value to these mission customers. In addition, the
operations procedures for using the Beacon technology canbe fully developed.
Demand-access scheduling of DSN antennas is anotherimportant feature of an operational Beacon system.Scheduling antennas based on demand rather than a pre-negotiated agreement is important to the success of thistechnology within the DSN. During the DS1 extendedmission, there is no funding to demonstrate automatedscheduling of antenna resources. If a Beacon tone isreceived that requires contacting the DS1 spacecraft, it willbe necessary to manually request a station pass. Until theDSN changes their scheduling paradigm, it will be difficultto implement demand-access scheduling.
3.4 Lessons Learned3.4.1 Ion Propulsion Missions—The utilization of the ionpropulsion system (IPS) (also called solar-electricpropulsion) on DS1 offers an additional advantage in usingBeacon monitoring. The IPS provides continuous thrust formuch of the cruise phase. The operational margin for IPSthrusting represents the duration for which IPS could be offand still allow the spacecraft to reach the target asteroid.Due to the low thrust associated with IPS and because actualthrusting did not start until several weeks after launch, theoperational margin is only a few weeks. Telemetry-downlink passes are becoming less frequent as the DS1mission progresses. Eventually, there will only be onetelemetry pass per week. If the spacecraft experiences aproblem that requires the standby mode, the IPS engine willbe shut down. It could be up to one week before the flightteam has visibility to that standby mode. Using the Beacon-tone system during the periods between scheduled-telemetrydownlinks can be a cost-effective way to decrease missionrisk because it reduces the likelihood of losing thrustingtime and not making the intended target. Other future IPSmissions have taken note of this fact and requested Beacon-tone services to lower their mission risk.
3.4.2 Software Testing—It was decided to redesign the DS1flight software about 18 months before launch. Thisdecision greatly compacted an already full schedule tocomplete the software. As a result, the testing of all non-essential software functions was delayed until after launch.The Beacon experiment was considered a non-essentialpiece of software and, therefore, was only tested pre-launch
Table 7. Tracking Cost Per Month (34m BWG, 2 contacts per week)Monthly cost: DS1 Operations
without BeaconMonthly Cost: DS1 Operations
with BeaconMonthlySavings
8-hour telemetry passes $19,465 $9,7334-hour carrier only passes $9,733 not applicableBeacon tone passes not applicable $1,217Total $29,198 $10,950 $18,248
* assuming reduction of two 8-hour telemetry passes per month

Deep Space 1 Technology Validation Report—Beacon Monitor Operations Experiment
16
for non-interference with the other flight software. Inpost-launch testing, a few problems were discovered thatprevented the Beacon software from starting until a newversion could be uploaded. These problems related todifferences between the flight-hardware based testbed anda simulated-hardware testbed. This is the age-old lessonlearned by performing system testing on the softwareprior to use. But even beyond that, it is important to runtests on the actual hardware-based testbed. Unfortunately,the DS1 schedule would not allow this until post launch.
3.4.2 Fault Protection Integration—Before the softwareredesign, the Beacon software was tightly integrated withthe DS1 fault-protection software. The decision was madeafter the redesign to de-couple the two pieces of software.Previously, the fault-protection monitors triggered theBeacon tones. After the redesign, the mapping of faults totones was performed using two different methods. Allspacecraft standby modes are now mapped to the urgentBeacon tone. The interesting and important Beacon tonesare mapped using Beacon software-determined limits. De-coupling the fault protection software from the Beaconsoftware gives this organization maximum flexibility todetermine what sensors to monitor. Unfortunately, ouralgorithms for determining faults are not nearly assophisticated as the fault-protection monitors. Thesemonitors can look at many different values based onconditional logic before determining what fault hasoccurred. Future spacecraft designed to use Beaconoperations should plan on completely integrating theBeacon tone software with the fault-protection software.
3.4.4 Beacon Signal Frequency Stability—The signalsused for Beacon monitor are characterized by threethings: (1) the signal strength can be extremely low, (2)the initial tone frequencies, which are derived from anonboard auxiliary oscillator, are not known exactly, and(3) the tone frequencies are constantly drifting. The tonedetector is designed to detect these types of signals with ahigh level of confidence. The maximum-frequencyuncertainty and the maximum-frequency drift rate for thetone detector were established using a Galileo sparetransponder. An operational issue was encountered withthe DS1 Beacon experiment: How and to what extent canthe auxiliary oscillator’s temperature be stabilized beforethe start of a Beacon pass? Stabilizing the temperaturewill reduce the frequency uncertainty and frequency drift,making it easier for the tone detector to detect the Beaconsignal. Based on data provided by the DS1 telecompersonnel, the auxiliary oscillator temperature canundergo a wide range of changes after an OPNAVmaneuver. This results in a very large frequencyuncertainty and a very high rate of change (>6 Hz/sec),both of which would exceed the limits of the tone detector(when the signal level is low).
One solution to the OPNAV-related problem is to wait for thetransponder temperature to stabilize. Studies by the DS1telecom personnel indicated that about four hours are neededfor the transponder temperature to stabilize after running theOPNAV activity. This operational constraint would not havemuch impact on the spacecraft and is believed to be thesimplest, lowest-cost solution to this problem. This procedureis recommended to improve weak-signal detection for DS1and future missions using Beacon Monitor.
During the DS1 tone experiments, the initial frequencyuncertainty was much larger than expected. A bias wasmanually introduced to keep the received signal in therecorded band. Without the bias, the frequency might beoutside the recorded band. In an automated detection mode, itis necessary to record at least 3 times the current bandwidth,unless a better way to predict the frequency can be found. Onepossibility is to make use of the auxiliary-oscillator frequencyvs. temperature-calibration table to improve frequencyprediction.
3.4.5 Downlink Carrier Phase Noise—Post analyses of thereceived-signal frequency indicated that the phase noise of thedownlink carrier was fairly significant. This would result indetection loss. Analyses should be performed to estimate theimpact of this phase noise on detector performance and tofactor this into future detection experiments.
3.4.6 Spacecraft Clock Accuracy—During one of theexperiments, it was observed that the actual tone switchingtimes did not seem to agree exactly with the predictedswitching times. This led to the discovery by the DS1 teamthat there was an error of 18 to 19 seconds in the SCLK/SCETconversion.
3.4.7 DSN Equipment Issues—A couple of tone passes werenot successful due to DSS 13 weather and equipment. In oneexperiment, the spacecraft started transmitting tones before itrose above the horizon of DSS 13. In another case, ascheduled pass was cancelled due to spacecraft activities.While the overall tone experiments have been very successful,future experiment plans should allow for this kind ofcontingency.
3.4.8 Beacon Operations Paradigm—The Beacon softwaremakes determinations of spacecraft anomalies. The datasummarization component of Beacon attempts to summarizerelated data from these anomalies. These determinations arebased upon high and low limits on sensor data. It is importantto involve the spacecraft subsystem engineers in thedetermination of which data to monitor and the setting of thelimits on these data. They are the personnel most familiar withthe operational characteristics of each subsystem and,therefore, should be determining interesting and faultconditions for their subsystem. Also, by involving them in thedata summarization definition, they will become better

Deep Space 1 Technology Validation Report—Beacon Monitor Operations Experiment
17
acquainted with the Beacon software and will be moreinclined to use it during crisis situations.
Ground-alarm limits on telemetry are generally set usingthe worse possible state of each data channel. Thispractice can hide problems with the spacecraft if thealarm limits are set at wide boundaries. Beacon datasummarization offers context-sensitive limits. In the caseof DS1, limits can be set for cruise, downlink, IPSthrusting, maneuver, and standby modes. Spacecraftoperations personnel are not accustomed to working withsummarized-engineering telemetry or context-sensitivelimits. When data limits were requested, generally one setof limits was received with instructions to apply them toall mission activities. Setting limits like this does notutilize the capabilities of the Beacon data summarization.For future implementations of Beacon, it will beimportant to educate the flight team about Beacon’scapabilities early in mission design. Beacon datasummarization should also be used during spacecrafttesting to familiarize operators with the technology. Thiswill help ensure reliance on Beacon data during themission.
3.4.9 Systems Engineering—As previously mentioned,there were problems with false-episode alarms due tomission activities such as Optical Navigations, cameracalibrations, etc. It is important to carefully define each ofthe mission activities and how they are related toengineering data. In the DS1 case, the maneuver activitywas defined to only occur when the thrusters were firing.Since maneuvers also involved turning the spacecraft, itwas important to include all events that turned thespacecraft in our maneuver-mission-activity criteria. Oncemission activities are carefully defined, then episodelimits for those activities can be developed.
4.0 TECHNOLOGY APPLICATION FOR FUTUREMISSIONS
There are essentially three paths to future work in thisarea. One is continuing to follow the technology-development roadmap for AI-based onboard-summarization methods. In the coming year, this involvesalso investigating the notion of summarizing spacecraftdata in order to create a comprehensive onboard archivein addition to downlinking summary telemetry. Missionsto Europa and Pluto only plan to downlink about 5% ofthe total volume of engineering data. The summarizationalgorithms developed for DS1 form a good foundation forinvestigating how to intelligently capture the mostimportant data in order to maintain an adaptive long-duration onboard archive. This archive may serve as aninput to other onboard-autonomy software or it may justbe available for downlink if ground personnel require
additional insights into past-spacecraft activity. In addition topursuing this archiving concept, there are many, many newautomated data-analysis methods to investigate for use inonboard summarization systems. This will also be researchedin the coming year.
The second thrust has to do with future mission deployments.After the DS1 Extended Mission, the next mission customer isthe Europa Mission. Europa is the first mission funded by theJPL Outer Planets/Solar Probe program and currently has aplanned launch in 2003. New versions of flight software forsummarization and tone selection will be developed in thecoming year and will be compatible with the JPL MissionData System architecture. This architecture is currentlybaselined for the Europa mission. MDS-compliant softwareprototypes that build on lessons learned from the DS1experiment will be delivered to the Europa mission inNovember, 2000. More generally, the technology is useful to abroad range of deep-space missions. In this era of faster,better, cheaper, there are many advantages to using this typeof operations approach instead of more traditional operations.Earth-orbiter missions have different requirements, but canbenefit from having Beacon-based adaptive operations. TheBeacon-monitor team has long standing ties to StanfordUniversity, Santa Clara University, and the University ofColorado, all of which are developing Beacon-basedoperations concepts and systems for Earth-orbiting missions.
There is another proposed Beacon concept for an Earth-trailing spacecraft (SIRTF) that involves using one tone.SIRTF plans to track every 12 hours, but would like to haveBeacon tracking every 2 hours. The idea is that the spacecraftwould only send a Beacon tone if it had a problem. Thepossible Beacon detections are 1) help tone or 2) no detection.Normally, the spacecraft would be busy doing observations;however, if it had a problem it would turn to Earth point andstart transmitting a carrier signal. This Beacon signal couldshorten the anomaly response time from 12 hours to amaximum of 2 hours. This requires no modification to thealready-designed spacecraft since there is no need todistinguish fine levels of urgency. SIRTF managementconsiders this important because their design does not includea transponder that supports Beacon tones. There is onedrawback with this operation. When the tone detector fails todetect a Beacon signal, one can not tell whether (1) thespacecraft is fine and no Beacon has been transmitted or (2)the spacecraft has an anomaly and fails to transmit.
The third thrust involves development of the ground-systeminfrastructure for conducting Beacon operations. The NASASpace Operations Management Office (SOMO) and the JPLTelecommunications and Mission Operations Directorate havehigh-level objectives to support Beacon monitoring on futuremissions. The exact scope and implementation of this multi-mission support has not yet been worked. In the meantime,tone detection for the DS1 Extended Mission is being

Deep Space 1 Technology Validation Report—Beacon Monitor Operations Experiment
18
supported through special arrangements with theexperimental DSS 13 ground station. A more generictone detection system needs to be implemented if theDSN antennas will support Beacon-monitor missions. Inaddition, the full benefit of adaptive operations requiresdemand-based scheduling of DSN antennas. This is also ahigh-level objective for the DSN.
5.0 ACKNOWLEDGMENTS
Acknowledgments fall into three categories. Thisexperiment would not have been possible without thededicated support of the BMOX Team Members:
E. Jay Wyatt – Principal InvestigatorRobert L. Sherwood – Flight Operations LeadMiles K. SueHenry B. HotzSusan G. FinleyAlan P. SchlutsmeyerTim FogartyJohn Szijjarto
In addition to the core team, several members of the DS1team had a substantial impact on the quality of theexperiment:
Dave LehmanMarc RaymanPhil VarghesePam ChadbourneDavid Morabito
The following program management and project staff alsoprovided critical support throughout development andoperations:
John Carraway – Outer Planets/Solar Probe MissionOperations LeadRichard Doyle – Division 36 ManagerGuy Man – New Millennium Program Autonomy IPDTManagerPeter Shames – TMOD Mission Services TechnologyProgram ManagerLarry Teitlebaum – DSS 13 Manager
This work was funded by the Automony Program andTMOD Technology Program at the Jet PropulsionLaboratory. The research described in this paper wascarried out at the Jet Propulsion Laboratory, California
Institute of Technology, under a contract with the NationalAeronautics and Space Administration.
6.0 LIST OF REFERENCES
Doyle, R. et al., “Autonomy and Software Technology onNASA’s Deep Space One,” IEEE Intelligent SystemsMagazine, May/June 1999.
Wyatt, E. J., et Al., 1999, “Flight Validation of On-DemandOperations: The Deep Space One Beacon Monitor Opera-tions Experiment,” Fifth International Symposium on Arti-ficial Intelligence, Robotics, and Automation is Space,Noordwijk, The Netherlands.
Sherwood, R., et al., 1999, “Lessons Learned During Imple-mentation and Early Operations of the DS1 Beacon Moni-tor Experiment,” Third International Symposium on Re-ducing the Cost of Ground Systems and Spacecraft Opera-tions, Tainan, Taiwan.
Wyatt, E. J., et Al., 1998, “Beacon Monitor Operations on theDeep Space One Mission,” Fifth International Symposiumon Space Mission Operations and Ground Data Systems,Tokyo, Japan.
DeCoste, D., 1997, “Automated Learning and Monitoring ofLimit Functions,” International Symposium on ArtificialIntelligence, Robotics, and Automation in Space, Tokyo,Japan.
Wyatt, E. J., et al., 1997, “An Overview of the Beacon Moni-tor Operations Technology,” International Symposium onArtificial Intelligence, Robotics, and Automation in Space,Tokyo, Japan.
Rayman, M. and D. Lehman, 1997, “Deep Space One:NASA’s First Deep-Space Technology Validation Mis-sion,” 48th International Astronautical Congress, Turin, It-aly.
Sherwood, R., et al., 1997, “Flight Software Implementationof the Beacon Monitor Experiment On the NASA NewMillennium Deep Space 1 (DS1) Mission,” Second Inter-national Symposium on Reducing the Cost of SpacecraftGround Systems and Operations, Oxfordshire, UK.
Chien, S., et al., 1997, “Resource Scheduling for a Network ofCommunications Antennas,” Proceedings of the IEEEAerospace Conference, Aspen, CO.
Staehle, R. L., et al., 1996, “Pluto Express: Advanced Tech-nologies Enable Lower Cost Missions to the Outer SolarSystem and Beyond,” International Low Cost PlanetaryMissions Conference, Laurel, MD.
Wyatt, E. J. and J. B. Carraway, 1995, “Beacon MonitoringApproach to Spacecraft Mission Operations,” First Inter-national Symposium on Reducing the Cost of SpacecraftGround Systems and Operations, Oxfordshire, UK.

Deep Space 1 Technology Validation Report—Beacon Monitor Operations Experiment
19
Appendix A. List of Telemetry Channels and NamesChannel # Description
A-0259 ACS_TELEM_ALLOCATED_ENTRY_59 xA-0534 ACS_TELEM_ALLOCATED_ENTRY_363 xA-0563 ACS_TELEM_ALLOCATED_ENTRY_117 xA-0762 ACS_TELEM_ALLOCATED_ENTRY_149 xA-1619 ACS_TELEM_ALLOCATED_ENTRY_182 xA-1621 ACS_TELEM_ALLOCATED_ENTRY_184 xA-1622 ACS_TELEM_ALLOCATED_ENTRY_188 xB-2014 FSC_IPCU_VME_N15_SUP_VOLT_MEAS xB-2040 FSC_BTF_SOFTWARE_VERSION_MEAS xB-4001 FSC_RAD6000_TEMP_MEAS xB-4004 FSC_UDL_OSC_TEMP_MEAS xD-0900 DWN_PRYOR_STATE_0F-0692 FPR_SYMPTOM_SUMMARY1F-1098 MON_ACS_INFO_EHA_MDC_STATE xG-4001 FSC_PEPE_TEMP1_MEAS xG-4002 FSC_PEPE_TEMP2_MEAS xG-4003 FSC_PEPE_CALORIMETER_TEMP_MEAS xI-4002 FSC_MICAS_OPT_BENCH_NXNZ_TEMP_MEAS xI-4003 FSC_MICAS_OPT_BENCH_PYNZ_TEMP_MEAS xI-4004 FSC_MICAS_M1_MIRROR_TEMP_MEAS xI-4006 FSC_MICAS_OPT_BENCH_CUBE_TEMP_MEAS xI-4007 FSC_MICAS_IR_DET_TEMP_MEAS xI-4008 FSC_MICAS_UV_DET_TEMP_MEAS xI-4010 FSC_MICAS_COVER_MECH_TEMP1_MEAS xN-0141 NAV_EHA_WHICH_MACHINE_RUNNING xO-4001 FSC_UPPER_BUS_TEMP1_MEAS xO-4002 FSC_UPPER_BUS_TEMP2_MEAS xP-0020 FSC_BATTERY_1_SOC xP-0022 FSC_BATTERY_2_SOC xP-2002 FSC_BATTERY_VT_MODE_MEAS xP-2010 FSC_BATTERY_MID_VOLT_1_MEAS xP-2011 FSC_BATTERY1_CURRENT_MEAS xP-2020 FSC_BATTERY_MID_VOLT_2_MEAS xP-2021 FSC_BATTERY2_CURRENT_MEAS xP-2030 FSC_SCARLET_VOLT_MEAS xP-2031 FSC_SCARLET_VAL_MOD_CUR_1_MEAS xP-2032 FSC_SCARLET_VAL_MOD_VOLT_1_MEAS xP-2040 FSC_SCARLET_WING1_CUR_MEAS xP-2050 FSC_SCARLET_WING2_CUR_MEAS xP-2060 FSC_PDU_ESS_BUS_CUR_MEAS xP-2061 FSC_PDU_ESS_BUS_VOL_MEAS xP-2062 FSC_PDU_NEB1_CUR_MEAS xP-2063 FSC_PDU_NEB1S_CUR_MEAS xP-2064 FSC_PDU_NEB2_CUR_MEAS xP-2065 FSC_PDU_NEB3_CUR_MEAS xP-2070 FSC_PDU_RELAY_FET_STATUS_WORD0_MEAS xP-2071 FSC_PDU_RELAY_FET_STATUS_WORD1_MEAS xP-2072 FSC_PDU_RELAY_FET_STATUS_WORD2_MEAS xP-4011 FSC_BATTERY_TEMP1_MEAS xP-4021 FSC_BATTERY_TEMP2_MEAS x

Deep Space 1 Technology Validation Report—Beacon Monitor Operations Experiment
20
Channel # DescriptionP-4022 FSC_BATTERY_CHARGE_TEMP_MEAS xP-4041 FSC_SCARLET_WING1_VAL_TEMP1_MEAS xP-4042 FSC_SCARLET_WING1_VAL_TEMP2_MEAS xP-4043 FSC_SCARLET_WING1_VAL_TEMP3_MEAS xP-4044 FSC_SCARLET_WING1_VAL_TEMP4_MEAS xP-4045 FSC_SCARLET_WING1_VAL_TEMP5_MEAS xP-4046 FSC_SCARLET_WING1_VAL_TEMP6_MEAS xP-4047 FSC_SCARLET_WING1_VAL_TEMP7_MEAS xP-4048 FSC_SCARLET_WING1_VAL_TEMP8_MEAS xP-4051 FSC_SCARLET_WING2_VAL_TEMP1_MEAS xP-4052 FSC_SCARLET_WING2_VAL_TEMP5_MEAS xT-0001 FSC_SDST_XPDR_STATE_MEAS xT-0014 FSC_SDST_X_PWR_MEAS xT-0024 FSC_SDST_EXCITER_SPE_MEAS xT-2015 FSC_PDU_SDST_CUR_MEAS xT-2016 FSC_PDU_KASSPA_CUR_MEAS xT-2017 FSC_PDU_XSSPA_CUR_MEAS xT-4002 FSC_XSSPA_TEMP_MEAS xV-2005 ACS_N2H4_TANK_PRSS_MEAS xV-4001 FSC_PROP_MOD_TEMP1_MEAS xV-4002 FSC_PROP_MOD_TEMP2_MEAS xV-4003 ACS_N2H4_TANK_TEMP1_MEAS xV-4011 ACS_RCS_CLUSTER1_TEMP_MEAS xV-4012 ACS_RCS_CLUSTER1_CAT_TEMP_MEAS xV-4021 ACS_RCS_CLUSTER2_TEMP_MEAS xV-4022 ACS_RCS_CLUSTER2_CAT_TEMP_MEAS x

Deep Space 1 Technology Validation Report—Beacon Monitor Operations Experiment
21
Appendix B. DS1 Technology Validation Power On/Off Times
Date Experiment TypeJan. 6, 1999 X-tone, 20, 30, 25, & 35 kHzFeb. 4, 1999 X-tone, 35 & 20 kHzFeb. 19, 1999 Data Summarization turned on
Feb. 26, 1999 B-tone & X-tone
Mar. 3, 1999 X-tone, 35 & 20 kHzMar. 8, 1999 Data Summarization turned onMar. 18, 1999 X-tone, 30, 20, 25, & 35 kHzMar. 22, 1999 Data Summarization turned onMar. 24, 1999 X-toneApr. 7, 1999 X-tone, 20, 25, 30, & 30 kHzApr. 13, 1999 B-transmit & X-tone, 20, 25, 30, & 35 kHzApr. 19, 1999 Ka-toneApr. 20, 1999 B-transmitApr. 26, 1999 Ka-tone, 20, 25, 30, & 35kHzApr. 27, 1999 B-transmitJune 1999 -May 2000
During this period, beacon tone passes were donejust about every week and data summarizationwas left on continuously.