battery testing, analysis and · pdf filecomputer aided engineering of batteries . fy 2013...
TRANSCRIPT
FY 2013 Annual Progress Report cxv Energy Storage R&D
Battery Testing, Analysis and Design Cost Assessments and Requirements Anlysis
Battery Testing Activities
Computer Aided Engineering of Batteries


FY 2013 Annual Progress Report 117 Energy Storage R&D
IV. Battery Testing, Analysis, and Design The Battery Testing, Analysis, and Design activity supports several complementary but crucial aspects of the battery
development program. The activity’s goal is to support the development of a U.S. domestic advanced battery industry whose products can meet electric drive vehicle performance targets. Within this activity, battery technologies are also evaluated according to USABC Battery Test Procedures. The manuals for the relevant PEV and HEV applications are available online. A benchmark testing of an emerging technology can be performed to remain abreast of the latest industry developments. High-level projects pursued in this area include the following topics:
Cost Assessments and Requirements Analysis. o Cost modeling. o Secondary and other energy storage use and life studies. o Analysis of the recycling of core materials. o Requirements analysis for PEVs and HEVs.
Battery Testing Activities. o Performance, life and abuse testing of contract deliverables. o Performance, life and abuse testing of laboratory and university developed cells. o Performance, life and abuse testing of benchmark systems from industry. o Thermal analysis, thermal testing and modeling. o Development of new test procedures. o Maintenance of current test procedures.
Computer Aided Engineering of Batteries. o development of tools for computer aided engineering of batteries.
The rest of this section lists the projects which were active for the above three key areas during FY 2013.
Energy Storage R&D 118 FY 2013 Annual Progress Report
IV.A Cost Assessments and Requirements Analysis
IV.A.1 Core BatPac Development and Implementation (ANL)
Kevin G. Gallagher, Paul A. Nelson, Shabbir Ahmed & Dennis W. Dees Argonne National Laboratory 9700 South Cass Avenue Argonne, IL 60439-4837 Phone: (630) 252-4473; Fax: (630) 972-4520 E-mail: [email protected] Collaborators: Ira Bloom, Argonne National Laboratory Wenquan Lu, Argonne National Laboratory Dan Santini, Argonne National Laboratory Fritz Kalhammer, Electric Power Research Institute Satish Rajagopalan, Electric Power Research Institute Joe McDonald, U.S. Environmental Protection Agency Aymeric Rousseau, Argonne National Laboratory Ram Vijayagopal, Argonne National Laboratory Start Date: October 2012 Projected End Date: September 2016
Objectives
The objective of this task is to develop and utilize efficient simulation and design tools for advanced lithium-ion batteries capable of predicting precise overall and component weights and dimensions, as well as cost and performance characteristics.
Technical Barriers
The primary technical barrier to commercialization is the development of a safe cost-effective PHEV battery with a 40 mile all electric range that meets or exceeds all performance goals. The major challenge specific to this project is accurately predicting the impact of promising new battery materials on the performance and cost of advanced full-size lithium-ion batteries for transportation applications.
Technical Targets
Develop model for calculating total battery mass, volume, & cost from individual components.
Predict methods & materials that enable manufacturers to reach the necessary goals.
Evaluate the interplay between performance and cost for advanced materials, such as anodes and cathodes, on total battery pack cost.
Support policy making process of U.S. Government.
Document and publicly distribute the model.
Accomplishments
Distribution of BatPaC v2.1 and revised supporting 100+ page report began on November 15, 2012 from the website www.cse.anl.gov/batpac. Over 600 independent downloads have occurred in FY2013 including those by major commercial entities, universities, and laboratories. This is more than double the number of downloads in the FY2012 for the previous version BatPaC v1.1.
Continued to support the EPA and DOT in refining BatPaC to enable use in the 2017-2025 rule making process for CAFE and GHG regulations. Identified and initiated critical BatPaC development pathway to support mid-term review of rule.
Continually interacted with EERE-VTO program participants to quantify the effect of materials development on cost. Particular focus was to support the ABR Voltage Fade program.
Validated critical design parameter target voltage efficiency at rated power by combing a two-time constant performance model into the Autonomie vehicle simulation tool. Heat generation under drive cycle conditions and net-present value of battery was determined for a number of cases.
Supported the U.S. Competitiveness program, PAINT learning curve initiative, IEA activities, and life cycle analysis for transportation batteries.
Gallagher – ANL IV.A.1 Core BatPac Development and Implementation
FY 2013 Annual Progress Report 119 Energy Storage R&D
Introduction
The penetration of lithium-ion (Li-ion) batteries into the vehicle market has prompted interest in projecting and understanding the costs of this family of chemistries being used to electrify the automotive powertrain. Additionally, research laboratories throughout the DOE complex and various academic institutions are developing new materials for Li-ion batteries regularly. The performance of the materials within the battery directly affects the end energy density and cost of the integrated battery pack. The development of a publicly available model that can project bench-scale results to real world battery pack values would be of great use. The battery performance and cost (BatPaC) model, represents the only public-domain, peer-reviewed model that captures the interplay between design and cost of Li-ion batteries for transportation applications. Moreover, BatPaC is the basis for the quantification of battery costs in U.S. EPA and NHTSA 2017-2025 Light-Duty Vehicle Technical Assessment. This assessment is then used to determine what mileage (i.e., for CAFE) and CO2 emission standards are optimal from a cost-benefit analysis.
Approach
BatPaC is the product of long-term research and development at Argonne through sponsorship by the U.S. Department of Energy. Over a decade, Argonne has developed methods to design Li-ion batteries for electric-drive vehicles based on modeling with Microsoft® Office Excel spreadsheets. These design models provided all the data needed to estimate the annual materials requirements for manufacturing the batteries being designed. This facilitated the next step, which was to extend the effort to include modeling of the manufacturing costs of the batteries. The battery pack design and cost calculated in BatPaC represent projections of a 2020 production year and a specified level of annual battery production, 10,000-500,000. As the goal is to predict the future cost of manufacturing batteries, a mature manufacturing process is assumed. The model designs a manufacturing plant with the sole purpose of producing the battery being modeled. The assumed battery design and manufacturing facility are based on common practice today but also assume some problems have been solved to result in a more efficient production process and a more energy dense battery. Our proposed solutions do not have to be the same methods used in the future by industry. We assume the leading battery manufacturers, those having successful operations in the year 2020, will reach these ends by some means.
Establishing the validity of the model calculation is important in justifying the conclusions drawn from
exercising the model. The design assumptions and methodologies have been documented and reported in a number of formats. The most notable of those is the 100+ page public report that accompanies the model at the BatPaC webpage. The report and model have been subjected to a public peer-review by battery experts assembled by the U.S. Environmental Protection Agency as well as many private reviews by vehicle original equipment manufacturers (OEMs) and cell suppliers. Changes have been made in response to the comments received during the peer-reviews. The peer-review comments are publicly available. The battery pack price to the OEM calculated by the model inherently assumes the existence of mature, high-volume manufacturing of Li-ion batteries for transportation applications. Therefore, the increased costs that current manufacturers face due to low scale of production, higher than expected cell failures in the field, and product launch issues are not accounted for in the calculation. BatPaC is the only model that has all of the following attributes: freely available, transparent in methodology and assumptions, links performance and cost, and uses a bottom-up approach.
Results
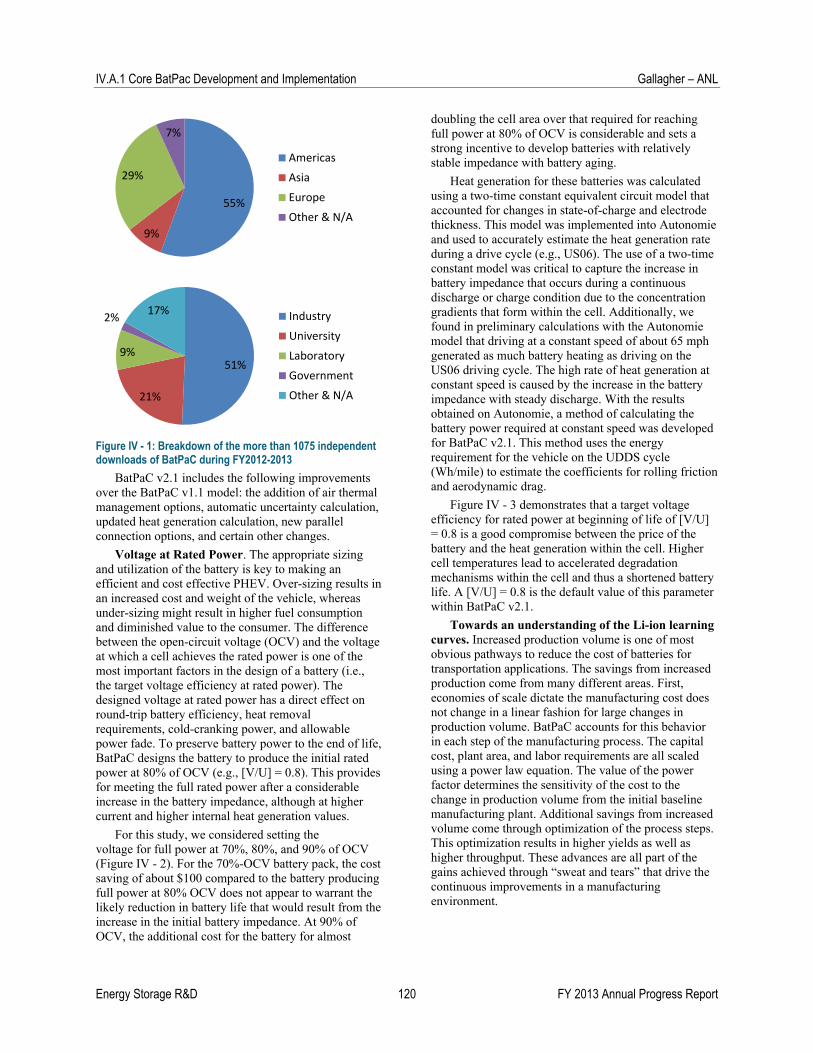
Distribution of BatPaC v2.1. The first version of BatPaC with supporting documentation was distributed on November 1st, 2011. The updated BatPaC v2.1 with improved documentation was released on November 15th, 2012. Since the 2011 release date, more than 1,075 independent downloads have occurred worldwide. The breakdown of these downloads is shown in Figure IV - 1. The majority of downloads took place within the United States. Industrial users, from high profile start-ups to world leading large cap companies, make up the largest percentage of downloads. The registered users in FY2013 were dispersed geographically and organizationally similar to that in FY2012 even though the number of downloads have more than doubled in FY2013. We note that no software lock is placed on the model meaning that once it is downloaded, it may be shared freely. Therefore, the likely number of owners of the model is higher than the number of downloads.
IV.A.1 Core BatPac Development and Implementation Gallagher – ANL
Energy Storage R&D 120 FY 2013 Annual Progress Report
Figure IV - 1: Breakdown of the more than 1075 independent downloads of BatPaC during FY2012-2013
BatPaC v2.1 includes the following improvements over the BatPaC v1.1 model: the addition of air thermal management options, automatic uncertainty calculation, updated heat generation calculation, new parallel connection options, and certain other changes.
Voltage at Rated Power. The appropriate sizing and utilization of the battery is key to making an efficient and cost effective PHEV. Over-sizing results in an increased cost and weight of the vehicle, whereas under-sizing might result in higher fuel consumption and diminished value to the consumer. The difference between the open-circuit voltage (OCV) and the voltage at which a cell achieves the rated power is one of the most important factors in the design of a battery (i.e., the target voltage efficiency at rated power). The designed voltage at rated power has a direct effect on round-trip battery efficiency, heat removal requirements, cold-cranking power, and allowable power fade. To preserve battery power to the end of life, BatPaC designs the battery to produce the initial rated power at 80% of OCV (e.g., [V/U] = 0.8). This provides for meeting the full rated power after a considerable increase in the battery impedance, although at higher current and higher internal heat generation values.
For this study, we considered setting the voltage for full power at 70%, 80%, and 90% of OCV (Figure IV - 2). For the 70%-OCV battery pack, the cost saving of about $100 compared to the battery producing full power at 80% OCV does not appear to warrant the likely reduction in battery life that would result from the increase in the initial battery impedance. At 90% of OCV, the additional cost for the battery for almost
doubling the cell area over that required for reaching full power at 80% of OCV is considerable and sets a strong incentive to develop batteries with relatively stable impedance with battery aging.
Heat generation for these batteries was calculated using a two-time constant equivalent circuit model that accounted for changes in state-of-charge and electrode thickness. This model was implemented into Autonomie and used to accurately estimate the heat generation rate during a drive cycle (e.g., US06). The use of a two-time constant model was critical to capture the increase in battery impedance that occurs during a continuous discharge or charge condition due to the concentration gradients that form within the cell. Additionally, we found in preliminary calculations with the Autonomie model that driving at a constant speed of about 65 mph generated as much battery heating as driving on the US06 driving cycle. The high rate of heat generation at constant speed is caused by the increase in the battery impedance with steady discharge. With the results obtained on Autonomie, a method of calculating the battery power required at constant speed was developed for BatPaC v2.1. This method uses the energy requirement for the vehicle on the UDDS cycle (Wh/mile) to estimate the coefficients for rolling friction and aerodynamic drag.
Figure IV - 3 demonstrates that a target voltage efficiency for rated power at beginning of life of [V/U] = 0.8 is a good compromise between the price of the battery and the heat generation within the cell. Higher cell temperatures lead to accelerated degradation mechanisms within the cell and thus a shortened battery life. A [V/U] = 0.8 is the default value of this parameter within BatPaC v2.1.
Towards an understanding of the Li-ion learning curves. Increased production volume is one of most obvious pathways to reduce the cost of batteries for transportation applications. The savings from increased production come from many different areas. First, economies of scale dictate the manufacturing cost does not change in a linear fashion for large changes in production volume. BatPaC accounts for this behavior in each step of the manufacturing process. The capital cost, plant area, and labor requirements are all scaled using a power law equation. The value of the power factor determines the sensitivity of the cost to the change in production volume from the initial baseline manufacturing plant. Additional savings from increased volume come through optimization of the process steps. This optimization results in higher yields as well as higher throughput. These advances are all part of the gains achieved through “sweat and tears” that drive the continuous improvements in a manufacturing environment.
55%
9%
29%
7%
Americas
Asia
Europe
Other & N/A
51%
21%
9%
2%17% Industry
University
Laboratory
Government
Other & N/A

Gallagher – ANL IV.A.1 Core BatPac Development and Implementation
FY 2013 Annual Progress Report 121 Energy Storage R&D
Figure IV - 2: Effects of target voltage efficiency (% OCV) at rated power on total cost to OEM for PHEV10 batteries with LMO-G electrodes and energy requirement of 200 Wh/mile
Figure IV - 3: Effects of target voltage efficiency (% OCV) at rated power on total cost to OEM for PHEV10 batteries with LMO-G electrodes and energy requirement of 200 Wh/mile. The secondary axis shows estimated maximum cell center temperature while driving the US06 drive cycle or continuous discharge at 65 mph
A potential learning curve resulting from increased volume and yield improvements is shown in Figure IV - 4. This simplified curve neglects the cost of underutilized equipment and improvements in yield at the individual process step. It only shows the effects of a plant designed to produce the number of batteries in question and the role of cell yield through the formation cycling step. Nevertheless, it is clear how increased production volume and yields lead to significantly lower battery prices to the OEM.
BatPaC assumes that the manufacturing facility produces only the type of battery being studied with the model. In practice, a battery plant will likely produce multiple battery sizes to gain economies of scale and meet customer needs for different vehicle powertrains (i.e., HEV, PHEV, EV). We estimate in Figure IV - 5, an approximation of the savings that may be realized by a plant that combines a mix of batteries into their production line. The key design constraint is to maintain the same geometry of the individual layers that make up the cell. The capacity of the cell can simply be increased by increasing electrode loading (i.e., thickness) and/or stacking additional layers increasing the cell thickness. Utilizing the same coaters, slitters, and stackers will result in significant savings compared to producing these four different batteries on their own equipment. We will build on this estimation to gain a better understanding of flexible manufacturing facilities in FY2014.
As production volumes increase and manufacturers gain more experience, increased rates at the individual process steps will be realized through engineering efforts to improve process center throughput. These increased rates will likely be obtained through design-of-experiments studies that identify optimal operating conditions to maintain yield and reliability even at increased processing rates. In the creation of the BatPaC baseline plant, we have assumed these advances have removed the largest bottlenecks found in contemporary battery production facilities (e.g., improved electrode stacking speed and coater throughput).
Figure IV - 4: Potential learning curve considering yield improvements in the cell formation cycling step and increased benefits of scale from going to larger production volumes
1,800
2,000
2,200
2,400
2,600
2,800
3,000
20 40 60 80 100
Battery Cost ($)
Battery Power Rating (kW)
90% OCV (Full Power)
80% OCV
70% OCV
0
5
10
15
20
25
30
35
40
45
2000
2050
2100
2150
2200
2250
2300
2350
2400
65 75 85 95
Maxim
um cell center temperature, C
Total battery cost to OEM
, $
Voltage Efficiency at Rated Power
Total Cost
Temp

IV.A.1 Core BatPac Development and Implementation Gallagher – ANL
Energy Storage R&D 122 FY 2013 Annual Progress Report
Figure IV - 5: Price to OEMs for battery packs of different types produced in dedicated plants (shown as lines) and in a combined plant with a total production of 235,000 batteries (shown as dots)
Conclusions and Future Directions
The first public distribution of BatPaC began in November 2011 and has since resulted in over 1,075 unique downloads from leading companies, universities and research laboratories around the world. We have successfully supported the 2017-2025 EPA/DOT GHG and CAFE rule making process. An updated version of BatPaC was publically released in mid-November 2012 and includes many value added features.
The target voltage efficiency at rated power, a key design constraint in BatPaC, was validated through a combined BatPaC, electrochemical model, and vehicle simulation to compare heat generation and the net present value of plug-in hybrid electric vehicles. Next year, we look forward to examining the effect of designed electrode thickness and tradeoffs between cost and cycle life. This work will be completed in collaboration with the CAMP group at ANL (formally the Cell Fabrication Facility). The focus of future BatPaC development will continue to be based on meeting the needs of the EPA and DOE-EERE.
FY 2013 Publications/Presentations
1. P. A. Nelson, K. G. Gallagher, I. Bloom, and D. W. Dees “Modeling the Performance and Cost of Lithium-Ion Batteries for Electric Vehicles, Second Edition” Chemical Sciences and Engineering Division, Argonne National Laboratory, ANL-12/55, Argonne, IL USA (2012).
2. K. G. Gallagher and P. A. Nelson “Battery Performance and Cost (BatPaC): Modeling the energy density and cost of Li-ion batteries for use in transportation applications” National Research Council Workshop on Issues in Estimating Costs on Fuel Economy Improvements under Future CAFE regulations, Washington, DC USA, March 27, (2013).
3. K. G. Gallagher and P. A. Nelson “Battery Performance and Cost Modeling” Advanced Automotive Battery Conference, Pasadena, CA USA, February 4 – February 8, (2013).
4. D. J. Santini, Y. Zhou, N. Kim, K. G. Gallagher, and A. Vyas, “Deploying Plug-in Electric Cars Which are Used for Work: Compatibility of Varying Daily Patterns of Use with Four Electric Powertrain Architectures”, Transportation Research Record, 13-4925 (2013).
5. P. A. Nelson, R.Vijayagopal, K. G. Gallagher, and A. Rousseau “Sizing the Battery Power for PHEVs Based on Battery Efficiency, Cost and Operational Cost Savings” Electric Vehicle Systems 27, Barcelona, Spain, Nov. 17-20, (2013).
6. D. J. Santini, T.S. Stephens, N. Kim, Y. Zhou, and K. G. Gallagher “Cost Effective Annual Use and Charging Frequency for Four Different Plug-in Powertrains” SAE 2013 World Congress, 2013-01-0494 Detroit, MI USA, Apr. 16-18, (2013).
7. D. J. Santini, Y. Zhou, N. Kim, K. G. Gallagher, and A. Vyas, “Deploying Plug-in Electric Cars Which are Used for Work: Compatibility of Varying Daily Patterns of Use with Four Electric Powertrain Architectures” 92nd Annual Meeting of the Transportation Research Board, TRB13-4925, Washington, DC USA Jan. 13-17, (2013).
8. K. G. Gallagher “Promises and Challenges of Lithium- and Manganese-Rich Transition-Metal Layered-Oxide Cathodes” DOE Merit Review, Washington D.C. USA, May 13 – May 17, (2013).

FY 2013 Annual Progress Report 123 Energy Storage R&D
IV.A.2 Battery Ownership Model: A Tool for Evaluating the Economics of Electrified Vehicles and Related Infrastructure (NREL)
Jeremy Neubauer National Renewable Energy Laboratory 15013 Denver West Parkway Golden, Colorado 80401-3393 Phone: (303) 275-3084 E-mail: [email protected] Collaborators: Eric Wood, Kandler Smith, Aaron Brooker, and Ahmad Pesaran National Renewable Energy Laboratory Start Date: FY2009 Projected End Date: FY2014
Objectives
Identify cost-optimal electric vehicle (EV) use strategies and pathways capable of achieving national oil displacement goals in support of the DOE’s EV Everywhere Grand Challenge.
Evaluate various business models and impact of other factors such as driving patterns, geography, battery wear, and charge profiles using the National Renewable Energy Laboratory (NREL)-developed Battery Ownership Model (BOM).
Technical Barriers
The economics of plug-in electric vehicles (PEVs) are highly sensitive not only to vehicle hardware and fuel costs, but also to infrastructure costs, driving patterns, all-electric range, battery wear, charging strategies, third-party involvement, and other factors. Proper analysis requires a detailed, comprehensive, systems-level approach.
The broad range of complex EV usage strategies proposed, including battery leasing, battery swapping, fast charging, opportunity charging, vehicle-to-grid service, battery second use, etc., presents a large number of scenarios to assess.
Battery life is typically a major factor in the total cost of ownership of EVs, but accurate modeling of battery degradation under the
complex and varied conditions of potential automotive use is challenging.
Economics are highly sensitive to vehicle drive patterns; thus, different drive patterns require different use strategies to minimize cost. Drive pattern data sufficient for economic analysis is also in short supply.
Technical Targets
Quantify the total cost of ownership of EVs when complex usage scenarios and business models are employed.
Understand how battery performance, life, and usage affect cost and other engineering parameters.
Design use strategies that achieve cost parity between EVs and gasoline-powered conventional vehicles (CVs).
Accomplishments
Analyzed the economics of service providers offering fast charge infrastructure access; found that the total cost to the consumer is similar to that of battery swapping service plans.
Quantified variations in driver aggression and developed a drive cycle that can be employed to project median aggression vehicle efficiency across multiple powertrains.
Assessed the impact of climate, cabin heating, ventilating and air conditioning (HVAC), and battery thermal management on EV utility. Identified cabin heating loads as the primary source of utility reduction in cold climates, and saw that the added electrical load of battery cooling systems can offset their reductions in battery degradation.
Simulated multiple charging infrastructure deployments to investigate their impact on EV utility. Found that level 1 home chargers are nearly as good as level 2 home chargers; work chargers add little to overall utility on average; and when widely available, level 2 public chargers provide nearly as much added utility as DC fast chargers.

IV.A.2 Battery Ownership Model Tool Neubauer – NREL
Energy Storage R&D 124 FY 2013 Annual Progress Report
Introduction
The eventual goal of the DOE’s EV Everywhere Grand Challenge is to have 5-passenger EVs that are on par with convential vehicles based on performance and cost by 2022. Battery cost reduction; widespread charging infrastructure, etc. are essential to meet this goal. Until that happens, the EV market needs to become acceptable to various consumers through differenet business strategies. Wide-scale consumer acceptance of alternatives to CVs such as hybrid electric vehicles (HEVs), plug-in hybrid electric vehicle (PHEVs), and EVs will depend at least in part on their cost effectiveness and their functionality, including driving range and ease of refueling. The present state of technology presents challenges in each of these areas when traditional ownership and usage models are employed. However, a number of advanced technical and business strategies have been proposed to enable the transition to these alternative powertrain technologies, including the electric utility utilization of the vehicle batteries as a distributed resource; battery leasing by a service provider who takes on the risk and upfront cost of battery ownership; public infrastructure development to recharge EVs while parked; fast-charge and/or battery swap stations that effectively extend EV range; and alternative car ownership models that allow users to own a EV but rent other vehicles for long-distance excursions. Each strategy has unique implications to the vehicle design, operating characteristics, and battery life. Accordingly, it can be challenging to compare different system options on a consistent basis to assess their ability to support the consumer adoption of such advanced vehicles.
To address this issue in search of cost-optimal EV use strategies, NREL has developed a computer tool called the Battery Ownership Model (BOM).
Approach
The purpose of the BOM is to calculate the utility and total cost of vehicle ownership under various scenarios of vehicle and component cost, battery and fuel price forecasts, driving characteristics, charging infrastructure cost, financing, and other criteria—including advanced business and ownership models. The vehicle economics that are considered include vehicle purchase, financing, fuel, non-fuel operating and maintenance costs, battery replacement, salvage value, and any costs passed on by a third-party such as a service provider to account for the installation, use, and availability of infrastructure.
Through FY 2012 the BOM was developed to account for real-world daily driving distance distributions, the sensitivity of battery degradation to
variances in usage and vehicle design, the cost of an EV’s limited range, and the inclusion of service providers providing battery swapping and fast charging services. Studies were completed on the sensitivity of PHEV and EV economics to drive patterns, charge strategies, electric range, and other operational considerations under traditional ownership schemes and when battery swapping service providers were available.
In FY 2013, we applied this version of the BOM to the analysis of a service provider that offered fast charge services. This study closely mirrored the battery swapping study of FY 2012; the results are described briefly below. Subsequently, the BOM received a major overhaul that included addition of the following features:
Increased resolution of daily travel histories to the individual trip level, including identification of destination type.
Developed an upgraded EV infrastructure model that considers location of the vehicle and time of day and enables consideration of level 1, level 2, and fast charging, as well as electric roadways.
Added range estimation algorithms and driver decision criteria to model travel decision choices for EVs.
Developed models for variable driver aggression to correlate energy consumption rates with trip speed and driver type.
Upgraded the battery model to account for current, voltage, and thermal response to improve accuracy of driving and charging simulations.
Added vehicle cabin thermal model, including cabin HVAC systems, and external climate data to better simulate the impact of cabin thermal response on battery temperature and auxiliary loads.
These new capabilities were used to study the sensitivity of vehicle efficiency to driver aggression, develop a drive cycle that consistently represents vehicle efficiency observed in real-world driving across varying degrees of vehicle electrification, and study the impact of climate, vehicle auxiliary loads, battery thermal management, and charging strategies on EV utility.
Results
Fast Charging Study. Using the FY 2012-developed BOM, we assessed the economics of a service provider offering access to fast chargers. This study paralleled the FY 2012 battery swapping study, beginning with identification of likely subscribers and their driving patterns, calculating their service usage

Neubauer – NREL IV.A.2 Battery Ownership Model Tool
FY 2013 Annual Progress Report 125 Energy Storage R&D
statistics when under a service plan, quantifying infrastructure requirements and service fees for multiple deployment scenarios, and then comparing individual driver economics to traditional ownership scenarios of EVs and CVs.
Our ultimate findings on driver economics are shown in Figure IV - 6. Interestingly, they are nearly identical to those of the battery swapping study, indicating that while an EV operated under such a service plan in a single-vehicle household may likely be more cost effective than direct ownership of an EV, it is unlikely to be more cost-effective than direct ownership of a CV. Although it was expected that the fast charge scenario would improve driver economics due to reduced infrastructure costs relative to the battery swapping case, we found that the longer duration of a range extension event under the fast charge scenario (~30 minutes vs. ~3 minutes) required the service provider to deploy a much larger number of fast charge stations than battery swap stations to provide the same level of range extension availability to its customers. This counteracted the decreased cost of range extension hardware at the per-site level and resulted in nearly identical total infrastructure costs.
Figure IV - 6: Fraction of driver patterns where a fast charge service plan EV is more cost effective than direct ownership of an EV without fast charger access
Given the similarity in cost, but increased driver convenience of battery swapping, we hypothesize that a battery swapping service plan would be more successful than a fast charge service plan. However, it is unlikely that either option could compete well on a strictly economic basis with direct ownership of a CV.
Driver Aggression. Assessing the potential benefits of HEVs, PHEVs, and EVs is complicated by the driving habits of the operator, as vehicle efficiency is sensitive to driver aggression. Quantifying the impact of driver aggression first requires an understanding of the variation of aggression within large, real-world drive datasets. For this we collected and analyzed 2,154
unique 1- to 2-day-long vehicle records and assessed speed, acceleration, and kinetic intensity statistics.
Next, we applied high-fidelity vehicle simulation to each of these vehicle records and four standard drive cycles of four different light-duty vehicles: a CV, an HEV, a PHEV, and a EV. We found that normalized energy consumption rates can vary substantially around the mean in response to aggression, from -20% to +50%.
We also found that commonly used drive cycles (UDDS, HWFET, LA92, and US06) inconsistently represent various levels of aggression across all four powertrains. For example, in a CV, the fuel consumption predicted by US06 only slightly overestimates the median aggression fuel consumption. However, in an EV, US06 very significantly overestimates the median aggression electricity assumption value. To rectify this issue, we developed the drive cycle shown in Figure IV - 7 that closely predicts median aggression fuel consumption regardless of powertrain type.
Climate, Cabin HVAC, and Battery Thermal Management. Following completion of the FY 2013 updated BOM, we studied the effects of climate, cabin HVAC, and battery thermal management on EV utility. We modeled 10 years of vehicle operation under numerous scenarios as described in Table IV - 1.
Figure IV - 7: Representative drive cycle produced from 2,154 vehicles using DRIVE

IV.A.2 Battery Ownership Model Tool Neubauer – NREL
Energy Storage R&D 126 FY 2013 Annual Progress Report
Table IV - 1: Design of experiments for thermal analyses
Parameter Values Simulated
Aggression Low, Normal, and High
Climates Phoenix, AZ; Los Angeles, CA; Minneapolis, MN
Cabin HVAC No HVAC; A/C + positive temperature coefficient (PTC) heater; A/C + heat pump
Cabin Preconditioning
With and without
Battery Thermal Management
Passive; stand-by electrical heater; key-on refrigerant cooling; key-on and stand-by refrigerant cooling; stand-by refrigerant cooling
Our findings suggest that, in the absence of cabin HVAC loads, variations in climate have little effect on EV utility in year one. However, warm climates can significantly increase battery degradation rates, thereby impacting vehicle utility later in life. Once HVAC loads are considered, we find that the additional demand on the battery from air conditioning and heating systems can notably reduce both year one and year ten utility. PTC heater loads in cold climates have the largest impact; upgrading to a more efficient heat pump based system appears worthwhile.
As we did not see significant decreases in vehicle utility in cold climates due to increased battery resistance, the addition of a stand-by electrical heater to keep the battery warm showed no ability to improve vehicle utility. And while there was room for a battery cooling system to decrease degradation and improve year ten utility, we generally found that the increased load of key-on battery cooling systems had the opposite effect, resulting in slightly decreased utility.
Cumulatively, accurate accounting of trip distributions, driver aggression, climate, and cabin and battery thermal management yielded average utility factors that varied from 83% in the best case to 55% in the worst case (across a sampling of likely EV driver trip histories). The latter value implies that estimates of EV utility that do not account for these effects could be overestimating utility by nearly a factor of 2, thereby stressing their importance in continued analyses.
Charging Infrastructure. We also investigated the impacts of home, work, public, and on-road power transfer on the utility of a 75-mile EV. Our simulations included consideration of level 1 (120V, 15A AC) and level 2 (240V, 32A AC) at-home charging, level 1 and 2 at-work charging, level 1, 2, and 3 (50 kW DC) public charging, and electrified roadway options (see Figure IV - 8). At-home charging considered cases with and without timing restrictions; all other charging scenarios assumed chargers available 24/7. The electric roadway
power value was set such that battery state of charge remained constant when on an electrified roadway due to limitations with our available dataset.
Comparisons of at-home charging revealed that level 1 charging, when unencumbered by time-based use limits, yields nearly as much utility as level 2. This implies that level 2 chargers are not a prerequisite for EV ownership and can thereby reduce the total cost to consumers.
Somewhat surprisingly, we also found that the addition of at-work chargers had only a small impact on utility for drivers classified as “commuters,” who were most likely to benefit from the added infrastructure. We hypothesize that this is due to the fact that most long travel days that can benefit from additional charging infrastructure are either not workdays, or that the additional travel is longer than the increase in range provided by a work charger alone.
When we explored pairing level 1 home charging with ubiquitous public charging (but no charging at work), we found that the year 10 achievable VMT could be increased by 1,200 miles, resulting in an average utility factor of 93%. This corresponded to a decrease in average annual tours not taken from approximately 20 to less than five. Interestingly, when public chargers are always available to the EV driver, the additional benefit of access to 50-kW fast chargers over level 2 chargers is marginal.
Figure IV - 8: Effect of ubiquitous public charging on achievable VMT and tours not taken
Conclusion and Future Directions
In FY 2013, we made significant upgrades to the BOM to expand our consideration of driver habits, battery thermal response, and auxiliary loads. We applied these new capabilities to study the impacts of driver aggression, climate, cabin HVAC, battery thermal management, and charging infrastructure on EV utility.

Neubauer – NREL IV.A.2 Battery Ownership Model Tool
FY 2013 Annual Progress Report 127 Energy Storage R&D
These investigations have highlighted the need to improve standard drive cycles and have pointed towards vehicle configurations and charge infrastructure deployments that can optimize EV utility.
In future work, we plan to upgrade our battery model to a multi-cell model, which will enable investigations of the impact of thermal gradients and electrical imbalance within a pack. We will also upgrade our handling of fast charge and battery swapping events, such that we can consider the impacts where such infrastructure is installed. We may consider impact of car-sharing and rentals if resources and times permit.
FY2013 Publications/Presentations
1. Neubauer, Jeremy, and Ahmad Pesaran, “A Techno-Economic Analysis of BEVs with Fast Charging Infrastructure,” EVS27, November 2013 (pending).
2. Neubauer, Jeremy, Eric Wood, and Ahmad Pesaran, “Analysis of Range Extension Techniques for Battery Electric Vehicles,” DOE milestone report, July 2013.
3. Neubauer, Jeremy, and Eric Wood, “Accounting for the Variation of Driver Aggression in the Simulation of Conventional and Advanced Vehicles,” SAE 2013 World Congress and Exhibit, April 2013.
4. Neubauer, Jeremy, and Ahmad Pesaran, “A Techno-Economic Analysis of BEV Service Providers Offering Battery Swapping Services,” SAE 2013 World Congress and Exhibit, April 2013.
5. Neubauer, Jeremy, and Ahmad Pesaran, “Analysis on Kinetic Intensity, Climate, Vehicle Ancillary Loads, and Battery Thermal Management,” DOE Milestone Report, March 2013.

Energy Storage R&D 128 FY 2013 Annual Progress Report
IV.A.3 PEV Battery Second Use (NREL)
Jeremy Neubauer National Renewable Energy Laboratory (NREL) 1617 Cole Boulevard Golden, CO 80401 Phone: (720) 989-1919 E-mail: [email protected] Collaborators: Andy Burke, University of California, Davis Mike Ferry, California Center for Sustainable Energy John Holmes, San Diego Gas & Electric Omo Velev, Aerovironment Byron Washom, University of California, San Diego Brett Williams, University of California, Berkeley Start Date: February 2009 Projected End Date: Projected September 2014
Objectives
Identify, assess, and verify sustainable applications for the second use of plug-in electric vehicle (PEV) lithium-ion (Li-ion) traction batteries after their end of useful life in a vehicle.
Collaborate with industry through cost-share subcontracts to demonstrate and evaluate the potential of battery second use in real applications.
Technical Barriers
PEV end-of-service burdens (battery recycling, disposal) could impede PEV deployment. Re-using PEV batteries in secondary applications and delaying recycling can shift these burdens away from the automotive industry.
Finding suitable second-use applications for the large quantity of used PEV batteries that could become available from automotive markets.
Assessing the value of post-automotive applications for PEV batteries is challenged by uncertain electrical demands, complex and difficult-to-assess revenue streams, and prohibitive regulatory structures.
The processes of repurposing PEV batteries are yet to be identified and could have a major
impact on the viability of second use strategies.
Battery degradation in both automotive and post-automotive use is notoriously difficult to ascertain, yet has a strong impact on the potential profitability of secondary use strategies.
Technical Targets
Identify and demonstrate sustainable second use applications for PEV Li-ion traction batteries.
Devise optimized use strategies for automotive traction batteries to facilitate their second use, maximizing their value and reducing cost to the automotive consumer and also preventing premature recycling of otherwise useable batteries.
Accomplishments
Subcontract with California Center for Sustainable Energy (CCSE) and partners has resulted in an in-field test-bed for second-use batteries and has begun testing used batteries in our identified second-use applications to demonstrate viability and quantify long term degradation.
Constructed an analysis framework for analyzing the second use of advanced automotive batteries, addressing repurposing costs, sale price, automotive discounts, and second use applications.
Applied the framework to a Li-ion PEV battery second use analysis that has highlighted the need for efficient repurposing strategies, identified a promising market for repurposed batteries, and began to quantify the potential of second use strategies to affect the cost of energy storage to both automotive and secondary markets.
Discussed partnership with BMW to support and assess deployment of a large pre-commercial stage second-use energy storage system.
Introduction
Accelerated market penetration of PEVs as targeted by the DOE’s EV Everywhere Grand Challenge is

Neubauer – NREL IV.A.3 PEV Battery Second Use
FY 2013 Annual Progress Report 129 Energy Storage R&D
presently limited by the high cost of Li-ion batteries. It has been estimated that more than a 50% reduction in battery costs is necessary to equalize the current economics of owning PEVs and conventionally fueled vehicles. Further, both vehicle manufacturers and consumers are concerned about end-of-service costs associated with proper handling of the battery.
One strategy that can positively affect both topics is battery second use – allocating a retired automotive battery to other applications where it may still have sufficient performance to be valuable. By extracting additional services and revenue from the battery in a post-vehicle application, the total lifetime value of the battery is increased. This increase could be credited back to the automotive consumer, effectively decreasing automotive battery costs. Further, it transfers the cost of battery recycling or disposal from the automotive community to the second use industry.
There are several current and emerging applications where PEV battery technology may be beneficial. For example, the use of renewable solar and wind technologies to produce electricity is growing, and their increased market penetration can benefit from energy storage, mitigating the intermittency of wind and solar energy. New trends in utility peak load reduction, energy efficiency, and load management can also benefit from the addition of energy storage, as will smart grid, grid stabilization, low-energy buildings, and utility reliability. The prospect of extremely low-cost energy storage via second use batteries is attractive to these industries.
Approach
This effort investigates the application of used Li-ion PEV batteries to utility and other applications. The major technical barriers to success are second-use application selection, long-term battery degradation, and cost of certifying and repurposing automotive batteries.
To address these barriers, NREL has partnered with a team of hardware providers, utilities, and academic institutions led by the CCSE. This team is a testimony to the interest of industry in second use as it has brought a 50% cost share (amounting to more than $600,000) to the effort with support from the California Energy Commission. Our team has worked collaboratively to perform techno-economic analyses, acquire aged batteries, and set up in-field and laboratory experiments to evaluate the performance and longevity of second use batteries as discussed below. Success of the project is measured by the completion of long-term testing and the determination of used battery value.
Results
Second-Use Battery Availability. To guide subsequent investigation of relevant second-use battery applications and value, it is worthwhile to project the availability and state of health of used automotive batteries. From a detailed Battery Ownership Model analysis, we found that it is generally not economically advantageous for PEV owners to replace their batteries prior to the end of life of the vehicle. Assuming an average vehicle life of 15 years and total battery lifetime of 20 years leaves a conservative 5-year second-use lifetime estimate. Using these values along with a spectrum of PEV deployment scenarios yields the projection of functional second-use batteries in Figure IV - 9. Note that the mean scenario predicts more than 20 GWh of second-use energy storage could be available by 2030.
Stationary Applications Analysis. The preceding projection of used battery availability suggests that an extremely large market must be found to absorb such a large quantity of energy storage capacity. This, along with expected performance capabilities, price levels, and industry trends, motivates investigating stationary storage applications. An assessment of grid-based secondary use applications accounting for the value of service, the expected limitations of repurposed automotive batteries, and the costs of the balance of system necessary to provide said service, suggests that area regulation, electric service power quality and reliability, and transmission and distribution upgrade deferral offer considerable value, as seen in Figure IV - 10.
Figure IV - 9: Projected amount of functional second-use battery energy storage available. High, mean, and low scenarios correspond to different PEV deployment rates

IV.A.3 PEV Battery Second Use Neubauer – NREL
Energy Storage R&D 130 FY 2013 Annual Progress Report
Figure IV - 10: Preliminary analysis results show multiple applications that could profitably employ second-use batteries
However, market potential may be an issue for these applications. Area regulation—a service intended to balance the supply of and demand for energy on a relatively fast time scale—is an inherently small market. While the regulation market is expected to change in response to the increased penetration of renewables on the grid, as well as changing consumer load profiles, it is not expected by itself to fully support the supply of used PEV batteries. Power quality and reliability is a high-value end-user market that is well established today (e.g., uninterruptible power supplies) and is growing. While the market is larger than that of area regulation (in terms of GWh) and there are synergies with other behind-the-meter applications, by itself this application cannot absorb the full quantity of second-use batteries expected. Similarly, the projected need for transmission upgrade deferral—using energy storage to reduce peak loads on transmission assets with projected overloads, enabling the upgrade or replacement of such assets to be deferred—is small in comparison to anticipated battery supplies.
While our analysis predicts that these markets are insufficiently deep to support the expected quantity of used PEV batteries available in the long run, they are nonetheless important to study as they may be the first applications targeted by the earliest available second-use batteries. Further, they will potentially play a role in the long run as secondary applications aggregated with some primary application to increase the value that individual storage systems will capture.
Our current expectation is that second-use batteries should be deployed in a distributed fashion with peak-shaving as their primary service, reaping their value from reducing peak power loads on grid assets. Peak-shaving can take place in many forms, be it behind the meter as demand charge reduction, by a utility to reduce generation capacity requirements, etc. Value is generated primarily by reducing or eliminating the need for other, more expensive hardware investments. While
this created value is often significantly less than that achievable with the three high value applications discussed previously, this market is much larger and more likely capable of absorbing the quantities of second-use batteries expected.
Repurposed Battery Costs. To assess if second-use batteries can be deployed as peak-shaving assets cost-effectively, it is important to estimate the cost at which a battery can be repurposed and sold. Using a bottom-up approach that considers all labor, capital equipment, facility needs, required rate of return by the operating entity, and many other factors, we calculate the cost of repurposing used PEV batteries as a function of the size of the module being processed and the frequency of occurrence of irreparable cells (cell fault rate). Some example results of this process are shown in Figure IV - 11.
Our results imply that the technician labor and costs of capitol are the most significant cost elements of repurposing activities. These sensitivities have two considerable implications: first, the effect of technician labor rules out the possibility of labor-intensive repurposing operations (such as addressing individual instances of faulty cells). This requires that facilities repurpose modules or packs and creates large variations in repurposing costs due to the interplay of module size and cell fault rate. Efficiencies of scale encourage repurposing larger modules, but larger modules also mean more waste when a faulty cell is identified.
The sensitivity to cost of capital (e.g., return on investment requirements, cost of debt) makes repurposing costs a strong function of the price at which a repurposing facility can sell the repurposed batteries. To address this, we evaluate both high- and low-price approaches.
Figure IV - 11: Projected second-use battery repurposing cost for a repurposed battery selling price of $132/kWh
In the high-price approach, we assume that repurposed PEV batteries are priced competitively with newly manufactured Li-ion batteries. Accounting for the anticipated future decline in new battery prices,

Neubauer – NREL IV.A.3 PEV Battery Second Use
FY 2013 Annual Progress Report 131 Energy Storage R&D
degraded battery health at automotive retirement, and a repurposed product discount factor, we can then forecast anticipated repurposed battery sale prices (Figure IV - 12). The possible variations in the aforementioned inputs—particularly for future battery prices—lead to significant uncertainty in the results, but in all cases the expected cost of repurposed batteries to grid or other applications is low.
Figure IV - 12: Projected repurposed battery selling price, competitive pricing scenario
Note that the high-cost approach results in a small but not insignificant salvage value for the automotive battery owner in most cases. However, with repurposed battery prices mostly above $100/kWh, it may be difficult to cost-effectively provide peak-shaving services at a large enough scale to consume the number of available used PEV batteries. If a market that values repurposed PEV batteries greater than our calculated selling price, then the use of a competition-based price model is in error.
Alternatively, in the low cost approach, we assume that an overabundance of used PEV batteries is present and seek to calculate the lowest economically feasible repurposed battery selling price (see Figure IV - 13). To do so, we set the used battery buying price equal to the assumed cost of removing the batteries from the vehicle, such that the net cost (value) of second use to the automotive owner is zero. This removes economic disincentives for the automotive owner, minimizes the price paid for batteries by the repurposing facility, and thereby minimizes the repurposing cost and selling price of repurposed batteries.
Figure IV - 13: Repurposing cost and repurposed battery selling price for the low cost scenario
We find that the minimum repurposed battery selling price in this scenario is approximately $40/kWh. This is highly encouraging, as it is probable that peak-shaving applications could be performed cost effectively at a large scale when batteries are available at this price point.
Validating Second Use Viability. Based on these findings, it is our anticipation that large supplies of second-use batteries will suppress repurposed battery selling prices until a suitably large market is found that adequately values this resource. We believe this market will be peak-shaving services on the grid. Secondary services, such as area regulation, power quality, power reliability, and asset deferral will likely be paired with this service to increase value (and may serve as primary applications in early second-use battery deployments).
To enable this market for second-use batteries, it is necessary to demonstrate the capability of such batteries to adequately provide these services. In particular, quantifying system response in real-world scenarios and validating the longevity of these batteries in these applications are critical.
To this end, we have acquired numerous aged automotive battery packs spanning multiple Li-ion chemistries, including iron phosphate, nickel manganese cobalt, and manganese oxide cathodes, and graphite, hard carbon, and lithium titanate anodes. Acceptance testing to quantify basic battery performance and state of health has been completed, as have short-term application tests for peak shaving, area regulation, and power reliability services. Furthermore, a long-term field test site on the University of California – San Diego microgrid has also been completed. Control strategies to provide real-time peak shaving services for select sites on campus have been completed, and real-time testing has been initiated. As testing continues, we will begin to assess the degradation characteristics of second-use batteries, and learn more about optimizing deployment strategies for this resource.
In parallel, NREL has initiated laboratory life tests to further characterize second-use battery degradation. Included is a 10-kW pack that has been substantially cycled to an automotive use duty cycle and that has been

IV.A.3 PEV Battery Second Use Neubauer – NREL
Energy Storage R&D 132 FY 2013 Annual Progress Report
disassembled to the cell level. Cells from this pack are being tested individually to provide insight into the variation in degradation across a single battery pack, as well as the response of cells to different duty cycles. Four ~4-kWh modules have also been acquired following extensive automotive cycling to the same state of health, albeit via different conditions (temperatures and number of cycles). A life test has been designed and initiated for these modules to answer the question of whether simple state data or full pack history data are necessary at the point of repurposing to quantify a battery’s value.
Conclusions and Future Directions
NREL has created a detailed framework for analyzing the second use of advanced automotive batteries, addressing repurposing costs, sale price, automotive discounts, and second use applications. The applications of this framework to Li-ion PEV batteries has highlighted the need for efficient repurposing strategies, and identified a promising market for repurposed batteries.
The major uncertainty that remains is the longevity of repurposed batteries in post-automotive applications. To address this matter, NREL has acquired aged batteries, developed a long-term field test site and strategy, and initiated long-term testing via a subcontract with CCSE through a 50-50 cost share partnership with industry. NREL has also acquired additional aged batteries for on-site laboratory testing. These efforts will be the focus of continued project work in FY 2014. Additionally, we will be working with
Southern California Edison to evaluate the potential of second use batteries in community energy storage applications, and with BMW to demonstrate a pre-commercial second-use battery system.
FY 2013 Publications/Presentations
1. Ferry, Mike, William Torre, Jeremy Neubauer, and Peter Dempster, “Second-Life Applications for PEV Battery Systems: Early Testing to Early –Commercialization,” EESAT, October 2013.
2. Neubauer, Jeremy, et al., “Analyzing the Effects of Climate and Thermal Configuration on Community Energy Storage Systems,” EESAT, October 2013.
3. Neubauer, Jeremy, and Mike Simpson, “Optimal Sizing of Energy Storage and Photovoltaic Power Systems for Demand Charge Mitigation,” EESAT, October 2013.
4. Neubauer, Jeremy, and Ahmad Pesaran, “Uncertainties and Challenges for Battery 2nd Use Strategies,” The Battery Show, September 2013.
5. Neubauer, Jeremy, and Ahmad Pesaran, “Analysis of Community Energy Storage as a BEV Battery Second Use Application,” 2013 DOE Milestone Report.
6. Neubauer, Jeremy and Ahmad Pesaran, “Analysis and Testing of Plug-In Electric Vehicle Batteries in Second Life Applications,” The 30th International Battery Seminar and Exhibit, March, 2013.

FY 2013 Annual Progress Report 133 Energy Storage R&D
IV.A.4 Battery Life Trade-Off Studies (NREL)
Kandler Smith National Renewable Energy Laboratory 1617 Cole Boulevard Golden, CO 80401 Phone: (303) 275-4423 E-mail: [email protected] Start Date: FY08 End Date: FY13
Objectives
Develop physics based battery life prediction models that quantify battery longevity over a range of real-world temperature and duty-cycle conditions.
Extend cell life models to pack-level, capturing impacts of temperature non-uniformity, cell performance and aging variability on system lifetime.
Perform trade-off studies to quantify potential battery lifetime extension and cost reduction achievable via advanced systems, controls and operating strategies for electric-drive-vehicle (EDV) battery packs.
Technical Barriers
Multiplicity of degradation modes (10+) faced by Li-ion battery cells in automotive environment.
Lack of models and methods to accurately quantify battery lifetime.
Lifetime uncertainty leading to conservative, oversized batteries in order to reduce warranty risk.
Technical Targets
10-15 years battery life for EDVs in disparate geographic environments and duty-cycles.
Battery lifetime predictive models validated against real-world data with less than 10% error.
Thermal and other control systems that reduce cell energy content while still meeting 10-15 year lifetime.
Accomplishments
Developed new life model for the Li-ion graphite/nickel-manganese-cobalt (NMC) chemisty, complementing previous models for graphite/nickel-cobalt-aluminum (NCA) and graphite/iron-phosphate (FeP) chemistries.
Quantified electrochemical-thermal-mechanical fade mechanisms that accelerate capacity loss and lead to sudden end-of-life.
Integrated cell-level life model with multi-cell pack electrical-thermal model, creating pack-level life prediction models that reduce the need for expensive pack aging experiments.
Validated NMC cell- and pack-level aging models under Cooperative Research & Development Agreement (CRADA) with General Motors.
Introduction
Battery aging behavior directly impacts the degree of EDV battery oversizing needed to achieve desired service life across applications and environments. Eliminating extra cost associated with oversizing would positively benefit market acceptance of EDVs. Automotive batteries face large variability in thermal environment and duty-cycle, with 10+ degradation factors that must be considered to predict lifetime. Worst-case cell aging conditions within a multi-cell battery pack drives the need to oversize battery cell energy content.
Physics-based models describing cell- and pack-level aging processes are needed to support engineering optimization of next generation batteries. Cell life models must capture a multiplicity of degradation modes experienced by Li-ion cells, such as interfacial film growth, loss of cycleable lithium, loss of active material, degradation of electronic and ionic pathways, with dependence on temperature, state-of-charge, depth-of-discharge, C-rate and other duty-cycle factors. Pack-level life models must capture effects leading to non-uniform cell aging, including temperature imbalance, cell performance and aging variability, and interaction with balance of plant systems such as cell balancing.

IV.A.4 Battery Life Trade-Off Studies Smith – NREL
Energy Storage R&D 134 FY 2013 Annual Progress Report
Approach
In FY13, NREL’s exising life model framework developed for NCA and FeP chemistries was extended to the NMC chemisty. End-of-life effects were further studied for the FeP chemistry. Cell-level aging models were coupled to pack multi-cell electrical-thermal models to capture limiting mechanisms inherent in complete battery systems including balance of plant effects.
Cell-level life models were based on the life modeling and regression framework previously developed at NREL. The physics based models capture changes in resistance and capacity with lifetime due to factors such as:
Side reactions forming electrode impedance films and consuming Li.
Impedance film fracture and regrowth. Lithium plating at low temperatures. Binder decomposition at high temperatures. Electrolyte decomposition at high temperatures
and voltages. SEI fracture & reformation. Particle & electrode fracture/fatigue/isolation
due to electrochemical-thermal-mechanical cycling.
Separator pore closure due to viscoelestic creep caused by cycling.
Gas pressure build-up. Break-in processes releasing excess Li and
enhancing reaction/transport initially at beginning of life.
Surrogate models for above degradation mechanisms are implemented in NREL’s software framework to be statistically regressed to cell aging data. The rate of each process is coupled to calendar and charge/discharge duty-cycle in an appropriate manner to properly extrapolate lifetime from accelerated aging experiments. During model development, multiple degradation hypotheses can be proposed, guided by knowledge of cell chemistry and cell teardown experiments when available. Mechanism hypotheses are confirmed/refuted based on regression statistics of model versus data.
Results
Accelerating fade leading to sudden end-of-life. Accurate prediction of end-of-life is the most critical factor for analyses of EDV battery lifetime. Mature Li-ion chemistries typically fade in a graceful manner from beginning through the middle of their lifetime. Nearing end-of-life however, performance can sometimes rapidly degrade depending on the aging duty-cycle. From a database of more than 50 aging tests for a 2.3 Ah FeP cell, Figure IV - 14 highlights 13 such conditions where capacity fade accelerates.
A hypothesized model was developed that attributes the acceleration of fade to a change in mechanism. Early in life, capacity is controlled by available-Li. Late in life, capacity is controlled by remaining electrode-active-sites. Rate laws for loss of electrode-active-sites were developed with dependence on:
C-rate (intercalation gradient strains). Depth-of-discharge (bulk intercalation strains). Low temperature (exacerbates Li intercalation-
gradients). High temperature (exacerbates binder
degradation in the composite electrode). Temperature swings with cycling (causing
stress due to differential thermal expansion of components).
Figure IV - 15 shows good agreement of the life model compared to experimental data. Further details are given in [1,2]. At room temperature 1C cycling, the model predicts
83% of capacity fade is caused by cycle depth-of-discharge (bulk intercalation strains).
13% of capacity fade is caused by particle fracture due to C-rate (intercalation gradient strain).
4% of capacity fade is caused by temperature swings encountered by the cell.
These conclusions, to be further investigated in future studies, provide guidance as to the relative importance of different mechanical-coupled fade mechanisms in Li-ion cells.

Smith – NREL IV.A.4 Battery Life Trade-Off Studies
FY 2013 Annual Progress Report 135 Energy Storage R&D
Figure IV - 14: Aging test conditions with apparent sudden acceleration in fade rate nearing end-of-life. Labels indicate the data source, percent depth-of-discharge, discharge & charge C-rate, and temperature
Figure IV - 15: Comparison of experimental data (symbols) with life model predictions (solid black lines) and 95% confidence intervals (dashed purple lines)
Pack-level NMC life prediction. In addition to cell-level aging effects, lifetime of EDV batteries is also impacted by pack-level effects. For accurate life prediction, it is important to capture factors that contribute to non-uniform aging of cells in a multi-cell pack. These include the effect of temperature gradients within the pack and cell non-uniform aging processes.
In FY13, NREL combined previously developed cell and pack models to create a pack-level life prediction tool. The tool was validated using proprietary data shared by GM under a CRADA. First, a cell-level life
model was regressed to aging data for a NMC chemistry Li-ion cell. Next, a cell electrical circuit model was regressed to HPPC data for the same cell and linked to the life model to describe cell performance changes with aging. A pack thermal model was regressed to pack thermal characterization experiments, capturing cell heat generation with drive cycle and heat dissipation through passive and active cooling paths.
Shown in Figure IV - 16, the cell life and electrical models were linked with the pack-level thermal/electrical model to create a predictive tool for

IV.A.4 Battery Life Trade-Off Studies Smith – NREL
Energy Storage R&D 136 FY 2013 Annual Progress Report
pack-level lifetime. The model-based process greatly reduces the need to run pack-level aging experiments, saving substantial cost from the battery engineering development process. The proprietary NMC pack life models are being implemented in NREL’s Battery Ownership model to enhance the fidelity of future technoeconomic analysis of EDV batteries.
Figure IV - 16: Integrated models for battery pack-level life prediction
Conclusions and Future Directions
In FY13, previously developed life models and framework were enhanced to capture
End-of-life effects, namely accelerating fade driven by electrochemical-thermal-mechanical coupled processes.
NMC chemistry cell lifetime, complementing previously developed models for NCA and FeP chemistries.
Pack-level degradation processes including temperature non-uniformity and cell performance and aging variability.
These life models directly support NREL analysis on cost-of-ownership for EDV consumers and fleets, battery 2nd use technoeconomic analysis, thermal management and balance of plant design. The life models are also being applied in ARPA-E AMPED projects developing battery prognostic controls (with Eaton Corporation) and an active balancing system that seeks to eliminate non-uniform cell aging and life extension for multi-cell battery packs (with Utah State and Ford). Versions of the NREL life models have been licensed to external industry and academic partners.
Pending opportunities, future work may enhance the models’ descriptions of cell electrochemical-thermal-mechanical degradation processes and integrate the life models with commercial battery computer-aided engineering software.
FY2013 Publications/Presentations
1. K. Smith, J. Neubauer, E. Wood, M. Jun, A. Pesaran, Models for Battery Reliability and Lifetime: Applications in Design and Health Management, Battery Congress 2013, Ann Arbor, MI; April 15-16, 2013. NREL Report No. PR-5400-58550.
2. K. Smith, J. Neubauer, E. Wood, M. Jun, A. Pesaran, SAE World Congress, Detroit, MI; April, 2013.
FY 2013 Annual Progress Report 137 Energy Storage R&D
IV.A.5 PHEV Cost Effectiveness and Life-Cycle Analysis (ANL)
Danilo J. Santini, J. Dunn, and A. Rousseau Argonne National Laboratory 9700 South Cass Avenue Argonne, IL 60439 Phone: (703) 678-7656; Fax: (630) 252-3443 E-mail: [email protected] Subcontractor: Electric Power Research Institute (2006)
Project Lead: Argonne
Partner: IEA HEV Implementing Agreement Start Dates: 2001 IEA HEV October 2006-09 (EPRI) Projected End Date: ongoing
Objectives
Examine Li-ion electric drive battery chemistries.
Evaluate Li-ion options for AEVs, ER-EVs, PHEVs, & HEVs with parallel, split & series powertrains.
Determine cell power and energy cost trade-offs, by chemistry (for 6 chemistries).
Determine best electric drive system attributes to maximize U.S. electricity-for-gasoline substitution, and fuel use reduction, including HEVs.
Estimate representative real world fuel & electricity use by electric drive vehicles.
Determine likely early U.S. market for plug-in electric drive vehicles.
Estimate WTW emissions and energy use by electric drive vehicle type and pattern of use.
Work with the IEA HEV& EV Implementing Agreement to disseminate, reevaluate, and revise study results in an international context.
Technical Barriers
This project addresses the following technical barriers in the choice of battery chemistry and battery pack configuration in support of maximum market success of electric drive.
A. Initial costs of providing various mixes of power and energy in plug-in hybrid (PHEV) and electric vehicle (EV) batteries.
B. Establishing a cost effective balance/mix of mechanical and electric drive in PHEVs.
C. Achieving battery life cycle net benefits, given probable U.S. gasoline prices, considering trade-offs among: o Initial cost. o Cycle life. o Calendar life. o Energy and power densities.
Technical Targets
Maximization of net present value benefits per kWh of grid electricity used. Evaluate chemistries, powertrains, pack kW and kWh, by target market niche.
Determination of cost effectiveness of battery power and kWh energy storage relative to other powertrain costs and charging infrastructure costs
Determination of fuel saved per kWh used during charge depletion, by chemistry and powertrain type.
Accomplishments
Hosted the 38th Executive Committee (ExCO) meeting of the IEA-HEV-IA and meetings of Task 1, 17 and 19 (April 2013).
Participated in three workshops (in Braunschweig, Germany, at ANL, and at Davos, Switzerland) and co-authored presentations/publications with other task members for Task 15 on plug-in hybrids and Task 19 on life cycle assessment of EVs (initiated in March of 2012).
Contributed to the compilation of a database of EV LCA studies containing more than 60 studies.
On October 22, a joint Task 10 and Task 15 Workshop on Batteries at Extreme Temperatures was held in Montreal Canada, arranged primarily by the Task 10 Operating Agent Jim Barnes. D. Santini attended the workshop on behalf of Task 15.
Task 15 on Plug-in Hybrids was nearly completed.
Two additional SAE World Congress Papers were prepared.
A paper using annual vehicle use data for the metro Atlanta area was submitted for consideration for publication in the Annual

IV.A.5 PHEV Cost Effectiveness and Life-Cycle Analysis Santini – ANL
Energy Storage R&D 138 FY 2013 Annual Progress Report
Transportation Research Board Meeting in January 2013.
Introduction
The market into which the various kinds of battery packs will “fit” (powertrain type, charge depletion strategy, vehicle size and function, driving behavior of probable purchasers, charging costs and availability) have been thoroughly investigated. Reasons for reconsidering and/or adjusting multiple existing technical targets have been discovered. In earlier years, this project focused on accurate estimation of battery pack costs by chemistry. In 2012, the focus was on simulation of a large number alternative plug-in electric hybrid powertrains of various types (parallel, input-split, output split, series) using battery packs with differing peak kW and kWh. Last year’s progress report discussed cost effectiveness results obtained in the January 2013 Transportation Research Board (TRB) paper, which had been originally prepared and submitted in August of 2012.
Approach
This year’s progress report presents an altered perspective, based on total cost of ownership (TCO) estimates obtained in two additional papers prepared subsequent to the TRB paper. TCO is a different methodology than cost effectiveness. Last year’s TRB paper focused only on everyday intra-urban driving, and particularly on vehicles commuting to work, which are about a third of the vehicle population. The TRB paper ignored use of vehicles in intercity travel. The SAE TCO paper considered consumer preferences for intercity travel. It was assumed that the pure AEV would not be used on intercity trips, due to very short range in Interstate highway driving. Costs of use of a substitute gasoline car were considered. Also, though no paper was produced, TCO analyses of prior EPRI vehicle simulations were also internally examined using an approach consistent with the SAE paper.
This year results for incremental costs of powertrain components were separated into battery cost effects and “other” effects (electric machines, inverters, cables, engine size changes, etc.) (see Figure IV - 17). This separation showed that for PHEVs and ER-EVs, powertrain costs other than the battery pack are relatively more important than they are for EVs. ER-EV cost penalties, which were significant, are driven by the cost increase of other components, due to higher kW. Cost of adding kW for the ER-EV battery pack was relatively small.
Figure IV - 17: Contributions to increment in PEV price over CV: battery vs. other powertrain changes
Results
International Energy Agency (IEA) activities. [Note: In this progress report and the final report, the term E-REV or EREV will be changed to ER-EV. This term applies to any vehicle that can operate all-electrically in all conditions when charge depleting, then use a gasoline engine to extend range, however accomplished. It is an “Extended Range Electric Vehicle”. In the Task 15 study the umbrella of this term covers both the input-split powertrain cases and the series powertrain cases. Inconsistencies with prior labels are noted, as necessary. The term AEV (all electric vehicle) is used in Task 15 discussion instead of EV or BEV. IEA Hybrid and Electric Vehicle Implementing Agreement (IEA-HEV-IA) Task 17 & 19 continue to use EV.]
In April of 2013 Argonne hosted the 38th Executive Committee (ExCO) meeting of the IEA-HEV-IA and also hosted meetings of Task 1, 17 and 19 of this Agreement.
During FY 2013, in addition to its continued participation in Task 15 on PHEVs, this project continued its new responsibility for participation in Task 19 on life cycle assessment of EVs (initiated in March of 2012). Jennifer Dunn was the lead Argonne participant. In FY 2013 ANL staff participated in three workshops and co-authored presentations/publications with other task members.
The first workshop, “LCA Methodology and Case Studies of Electric Vehicles” (20 attendees) was in Braunschweig, Germany on December 7, 2012. Key methodological issues in electric vehicle LCA were addressed by reviewing both theory and case studies. Methodology discussion focused on electricity generation mix and pros and cons of using attributional vs. consequential LCA approaches. Proper treatment of co-products was discussed. Recommendations of the ISO 14040 and 14044 standards for LCA were judged rigid and deficient. Other topics were market and

Santini – ANL IV.A.5 PHEV Cost Effectiveness and Life-Cycle Analysis
FY 2013 Annual Progress Report 139 Energy Storage R&D
charging technological uncertainty, policy impacts, and baseline reference points. ANL’s A. Elgowainy gave two presentations, one on LCA at ANL and another on ANL evaluations of PHEVs.
The April workshop at Argonne, titled “Vehicle and Battery Production in LCA of Electric Vehicles,” had 28 attendees from four countries (United States, Germany, Austria, and Switzerland). Industry, academic, and government researchers participated. State of knowledge, best practices, available data, and data gaps for key steps in EV LCA were discussed. J. Dunn and K. Gallagher gave presentations, and Gallagher hosted a group tour of Argonne’s battery R&D facilities. It was agreed that battery assembly and cathode material preparation remain key areas for more in-depth research, but steel, copper and aluminum do not. Dunn was invited to be the Vice Operating Agent for Task 19.
The workshop “Recovery of Critical Metals from Vehicles with an Electric Drivetrain,” was held in Davos, Switzerland on October 9-10, 2013. Though travel restrictions prevented Linda Gaines from attending, her presentation “Can Automotive Battery Recycling Help Meet Critical Material Demand?” was delivered by the Task 19 Operating Agent Gerfried Jungmeier.
Fulfilling an objective of Task 19, Argonne has contributed to the compilation of a database of EV LCA studies containing more than 60 studies.
On October 22, a joint Task 10 and Task 15 Workshop on Batteries at Extreme Temperatures was held in Montreal Canada, arranged primarily by the Task 10 Operating Agent Jim Barnes. D. Santini attended the workshop on behalf of Task 15.
During FY 2013 Task 15 on Plug-in Hybrids was nearly completed. In Nov. 2012 a joint paper by German, French and U.S. Task Experts was presented at the European Electric Vehicle Congress in Brussels. Two U.S. focused spin-off papers making use of Task 15 vehicle simulations and powertrain cost estimates were written and presented, one at the Transportation Research Board Meeting in January and one at the SAE World Congress in April. Since it was close to completion, Task 15 contributed the longest project description among all active Tasks in the 2013 IEA-HEV-IA Report. A draft Task 15 summary report was delivered by Operating Agent D. Santini at the 38th Meeting of the IEA-HEV-IA ExCO, also in April. This purely text write-up was similar to the extended discussion of Task 15 findings published in the IEA-HEV-IA Annual Report. A discussion of selected findings from the SAE World Congress paper on Total Cost of Ownership of various plug-in vehicles was written for a later IEA-HEV-IA website report on recent Task 15 activities. Toward the end of FY13, in preparation for the November 2013 39th Meeting of the
IEA HEV ExCO in Barcelona, D. Santini worked on a final edit of the Task 15 report, incorporating several figures.
Two additional SAE World Congress Papers were prepared. One made use of data on commercially available U.S. PHEVs and EVs, as well as a diesel, a dedicated natural gas vehicle, and a fuel cell vehicle. This paper examined fuel savings and GHG emissions reductions of plug-in vehicles as a function of average speed driven, finding that savings tended to be relatively constant when expressed on the basis of hours of operation. This paper also illustrated that all electric operation of plug-in vehicles, when powered via renewable electricity, would result in about twice the miles of service that would otherwise be obtained if that electricity were instead used to produce hydrogen via electrolysis for use in a fuel cell vehicle. The third SAE Congress paper addressed the value of battery pack power for capture of regenerative braking energy. Using Argonne’s Advanced Powertrain Test Facility data it demonstrated that regenerative braking-energy-capture benefits exist for battery pack power levels up to about 60 kW, but there was essentially no regenerative braking energy benefit of higher battery pack kW.
Finally, a paper using annual vehicle use data for the metro Atlanta area was prepared and submitted for consideration for publication in the Annual Transportation Research Board Meeting in January 2013. This paper provided evidence that the daily distance market segment from the SAE TCO paper where AEVs could be the least cost solution is a very small market niche. In other words, even though the SAE TCO paper found a market niche at $5.00/gallon gasoline where a future unsubsidized EV used only within a metro area would be least cost (high daily driving distances, frequent daily use), the investigation of one metro area (Atlanta) implied that the niche was far smaller than implied by the single day National Household Travel Survey data, which had been used in the prior SAE TCO paper.
Examine Li-ion electric drive battery chemistries. Prior years of analysis had indicated that the LMO-G chemistry was least cost, but that NMC-G was next lowest for battery packs with high energy to power ratios, while also having superiority to LMO-G in Wh/l and Wh/kg. When estimating costs of plug-in vehicles for IEA-HEV-IA Task 15, German country experts chose to use NMC-G, while U.S. country experts used LMO-G. It is understood that a blend of these two chemistries is often being used in practice.
Evaluate Li-ion options for EVs, ER-EVs, PHEVs, & HEVs with parallel, split & series powertrains. The collective implications from the Task 15 papers is that plug-in hybrids with about 60 kW of peak battery pack power and 5-10 kWh of energy storage capacity will be long-term least TCO

IV.A.5 PHEV Cost Effectiveness and Life-Cycle Analysis Santini – ANL
Energy Storage R&D 140 FY 2013 Annual Progress Report
alternatives should gasoline prices rise by about 40% ($5.00/gallon) (see Figure IV - 18). A shortcoming of the analysis is that no 60 kW HEV has been evaluated, but the cost trend in the SAE TCO paper implied increasing TCO as evaluated PHEV pack kWh dropped toward that found in HEVs. Nevertheless, an HEV with 60 peak battery pack kW should be examined to confirm this trend. The cost trends when adding power in HEVs should be determined. Although several powertrain architectures have been investigated, there is not a basis for choosing among them, since there has been no evaluation of the four candidate powertrains for PHEVs holding peak pack power constant at 60 kW, each with energy storage capability from 5-10 kWh.
Figure IV - 18: TCO for one assessed market niche, considering intercity driving at 8.5% and 19% of annual miles. IS = input split, OS = output split. B = blended charge depletion. AEV = all electric vehicle. Range predictions are miles
Determine cell power and energy cost trade-offs, by chemistry. Prior papers on this topic imply important nonlinearities in properties of battery packs, largely having to do with the transition from high power to high energy packs. For high power packs, electrodes are typically thinner than present manufacturing tolerances will allow. Adding energy involves only adding electrode thickness, while copper, aluminum and steel content remain relatively constant. This allows a rapid drop in costs for a transition from HEV power packs to PHEV energy packs (see Figure IV - 19). However, this is limited by allowable electrode thickness, and there are also nonlinear diminishing returns in benefits from added electrode thickness. Once the electrode thickness limits are reached, adding more energy storage capability to the pack involves adding more aluminum, copper and steel. Consequently, the rate of decline of $/kWh cost is much less as one moves from PHEV to AEV.
Determine best electric drive system attributes to maximize U.S. electricity-for-gasoline substitution, and fuel use reduction, including HEVs. Considering the role of international investigations in this study, the question is whether U.S. results discussed under objective 2 are robust across nations. Despite much lower gasoline prices in the U.S., the collaborative study concluded that the only market niche where an input-split plug-in hybrid with 30 km of range was the best solution (longer annual driving distances) was in the U.S. (See Figure IV - 20.)
Figure IV - 19: ANL and DLR Estimates of beginning of life battery pack cost per kWh, by peak pack kW and chemistry

Santini – ANL IV.A.5 PHEV Cost Effectiveness and Life-Cycle Analysis
FY 2013 Annual Progress Report 141 Energy Storage R&D
Figure IV - 20: Percent improvement of PHEV ownership cost (TCO) vs. conventional vehicle, by drivetrain and distance (range predictions are km). Vehicle labeled PHEV70 is a series ER-EV; PHEV30 is an input split PHEV
The differences in the U.S. and European results call into question the robustness of the U.S. results discussed for objective 2. This result suggests further collaborative investigation is desirable to better understand reasons for differences. The European cost estimates also were considerably more optimistic for the series powertrain. Ideally, a more comprehensive cross comparison will be done if a new phase of Task 15 can be agreed to. As in the multiple annual distances evaluated above, details in the SAE TCO paper also indicate that HEVs with 26 kW peak battery pack power are often the least cost solution when daily driving is not adequate to make effective use of PHEV battery pack capabilities. Above average vehicle use is necessary for financial viability of early PHEVs, given present gasoline prices and projected battery costs.
Estimate representative real world fuel & electricity use by electric drive vehicles. One of the interesting attributes of the study was its investigation of PHEVs with different levels of power. The PHEVs simulated by IFP Energies Nouvelles used a parallel powertrain and had a low battery pack power of 30 kW
and high of 42 kW. PHEVs simulated by Argonne with the input split powertrain used power levels of 26 kW and 60 kW. Inspection of the fuel consumption estimates on limited access highways implies that the charge depleting gasoline fuel consumption increased by an order of magnitude with a drop from peak battery pack power of 40 kW down to 26 kW (see Figure IV - 21). At 60 kW U.S. highway gasoline consumption for the input split was zero, but for the European case (higher top speeds) it was about the same as for the 40 kW parallel PHEV. Clearly, if all electric highway operations capability is desired, adequate battery pack power must be provided. A drawback of the 26 kW input split case was very long distances to charge depletion, which can reduce the amount of times per 100 miles that such a vehicle can be depleted and recharged. To illustrate that highway energy consumption is much different than urban and suburban/rural driving, two figures were constructed showing the distance to depletion in the three different driving conditions. The U.S. figure is provided here.
-35
-30
-25
-20
-15
-10
-5
0
5
10
1H
EV
s / P
HE
Vs
cost
ben
efits
rel
ativ
e to
CV
s in
%
HEV PHEV30 PHEV70
HEV PHEV30 PHEV70
HEV PHEV30 PHEV70
Short distances Typical distances Longer distances
GER US GER US GER US
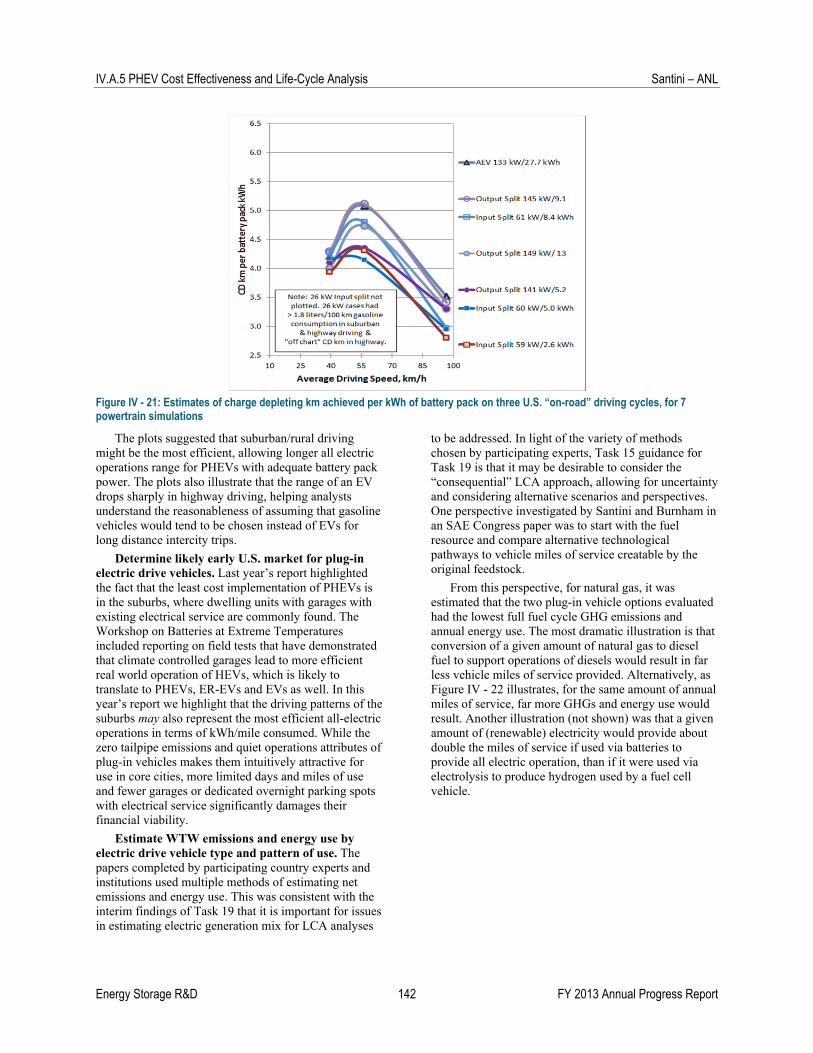
IV.A.5 PHEV Cost Effectiveness and Life-Cycle Analysis Santini – ANL
Energy Storage R&D 142 FY 2013 Annual Progress Report
Figure IV - 21: Estimates of charge depleting km achieved per kWh of battery pack on three U.S. “on-road” driving cycles, for 7 powertrain simulations
The plots suggested that suburban/rural driving might be the most efficient, allowing longer all electric operations range for PHEVs with adequate battery pack power. The plots also illustrate that the range of an EV drops sharply in highway driving, helping analysts understand the reasonableness of assuming that gasoline vehicles would tend to be chosen instead of EVs for long distance intercity trips.
Determine likely early U.S. market for plug-in electric drive vehicles. Last year’s report highlighted the fact that the least cost implementation of PHEVs is in the suburbs, where dwelling units with garages with existing electrical service are commonly found. The Workshop on Batteries at Extreme Temperatures included reporting on field tests that have demonstrated that climate controlled garages lead to more efficient real world operation of HEVs, which is likely to translate to PHEVs, ER-EVs and EVs as well. In this year’s report we highlight that the driving patterns of the suburbs may also represent the most efficient all-electric operations in terms of kWh/mile consumed. While the zero tailpipe emissions and quiet operations attributes of plug-in vehicles makes them intuitively attractive for use in core cities, more limited days and miles of use and fewer garages or dedicated overnight parking spots with electrical service significantly damages their financial viability.
Estimate WTW emissions and energy use by electric drive vehicle type and pattern of use. The papers completed by participating country experts and institutions used multiple methods of estimating net emissions and energy use. This was consistent with the interim findings of Task 19 that it is important for issues in estimating electric generation mix for LCA analyses
to be addressed. In light of the variety of methods chosen by participating experts, Task 15 guidance for Task 19 is that it may be desirable to consider the “consequential” LCA approach, allowing for uncertainty and considering alternative scenarios and perspectives. One perspective investigated by Santini and Burnham in an SAE Congress paper was to start with the fuel resource and compare alternative technological pathways to vehicle miles of service creatable by the original feedstock.
From this perspective, for natural gas, it was estimated that the two plug-in vehicle options evaluated had the lowest full fuel cycle GHG emissions and annual energy use. The most dramatic illustration is that conversion of a given amount of natural gas to diesel fuel to support operations of diesels would result in far less vehicle miles of service provided. Alternatively, as Figure IV - 22 illustrates, for the same amount of annual miles of service, far more GHGs and energy use would result. Another illustration (not shown) was that a given amount of (renewable) electricity would provide about double the miles of service if used via batteries to provide all electric operation, than if it were used via electrolysis to produce hydrogen used by a fuel cell vehicle.
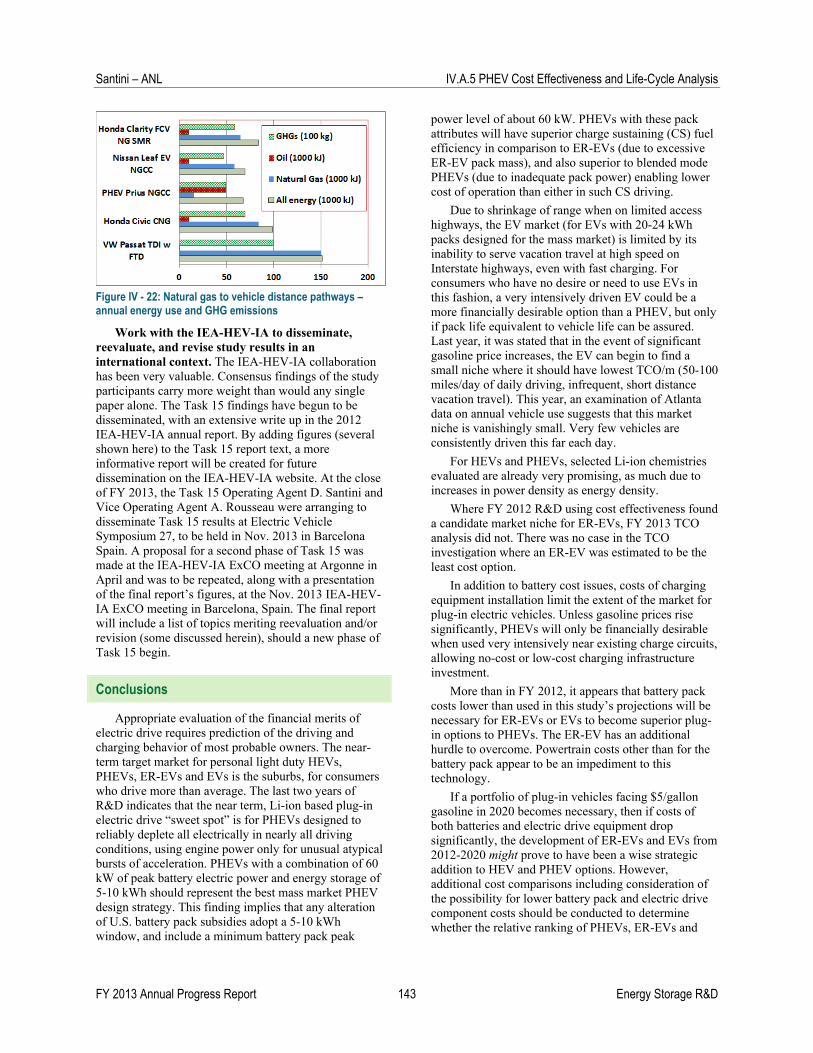
Santini – ANL IV.A.5 PHEV Cost Effectiveness and Life-Cycle Analysis
FY 2013 Annual Progress Report 143 Energy Storage R&D
Figure IV - 22: Natural gas to vehicle distance pathways – annual energy use and GHG emissions
Work with the IEA-HEV-IA to disseminate, reevaluate, and revise study results in an international context. The IEA-HEV-IA collaboration has been very valuable. Consensus findings of the study participants carry more weight than would any single paper alone. The Task 15 findings have begun to be disseminated, with an extensive write up in the 2012 IEA-HEV-IA annual report. By adding figures (several shown here) to the Task 15 report text, a more informative report will be created for future dissemination on the IEA-HEV-IA website. At the close of FY 2013, the Task 15 Operating Agent D. Santini and Vice Operating Agent A. Rousseau were arranging to disseminate Task 15 results at Electric Vehicle Symposium 27, to be held in Nov. 2013 in Barcelona Spain. A proposal for a second phase of Task 15 was made at the IEA-HEV-IA ExCO meeting at Argonne in April and was to be repeated, along with a presentation of the final report’s figures, at the Nov. 2013 IEA-HEV-IA ExCO meeting in Barcelona, Spain. The final report will include a list of topics meriting reevaluation and/or revision (some discussed herein), should a new phase of Task 15 begin.
Conclusions
Appropriate evaluation of the financial merits of electric drive requires prediction of the driving and charging behavior of most probable owners. The near-term target market for personal light duty HEVs, PHEVs, ER-EVs and EVs is the suburbs, for consumers who drive more than average. The last two years of R&D indicates that the near term, Li-ion based plug-in electric drive “sweet spot” is for PHEVs designed to reliably deplete all electrically in nearly all driving conditions, using engine power only for unusual atypical bursts of acceleration. PHEVs with a combination of 60 kW of peak battery electric power and energy storage of 5-10 kWh should represent the best mass market PHEV design strategy. This finding implies that any alteration of U.S. battery pack subsidies adopt a 5-10 kWh window, and include a minimum battery pack peak
power level of about 60 kW. PHEVs with these pack attributes will have superior charge sustaining (CS) fuel efficiency in comparison to ER-EVs (due to excessive ER-EV pack mass), and also superior to blended mode PHEVs (due to inadequate pack power) enabling lower cost of operation than either in such CS driving.
Due to shrinkage of range when on limited access highways, the EV market (for EVs with 20-24 kWh packs designed for the mass market) is limited by its inability to serve vacation travel at high speed on Interstate highways, even with fast charging. For consumers who have no desire or need to use EVs in this fashion, a very intensively driven EV could be a more financially desirable option than a PHEV, but only if pack life equivalent to vehicle life can be assured. Last year, it was stated that in the event of significant gasoline price increases, the EV can begin to find a small niche where it should have lowest TCO/m (50-100 miles/day of daily driving, infrequent, short distance vacation travel). This year, an examination of Atlanta data on annual vehicle use suggests that this market niche is vanishingly small. Very few vehicles are consistently driven this far each day.
For HEVs and PHEVs, selected Li-ion chemistries evaluated are already very promising, as much due to increases in power density as energy density.
Where FY 2012 R&D using cost effectiveness found a candidate market niche for ER-EVs, FY 2013 TCO analysis did not. There was no case in the TCO investigation where an ER-EV was estimated to be the least cost option.
In addition to battery cost issues, costs of charging equipment installation limit the extent of the market for plug-in electric vehicles. Unless gasoline prices rise significantly, PHEVs will only be financially desirable when used very intensively near existing charge circuits, allowing no-cost or low-cost charging infrastructure investment.
More than in FY 2012, it appears that battery pack costs lower than used in this study’s projections will be necessary for ER-EVs or EVs to become superior plug-in options to PHEVs. The ER-EV has an additional hurdle to overcome. Powertrain costs other than for the battery pack appear to be an impediment to this technology.
If a portfolio of plug-in vehicles facing $5/gallon gasoline in 2020 becomes necessary, then if costs of both batteries and electric drive equipment drop significantly, the development of ER-EVs and EVs from 2012-2020 might prove to have been a wise strategic addition to HEV and PHEV options. However, additional cost comparisons including consideration of the possibility for lower battery pack and electric drive component costs should be conducted to determine whether the relative ranking of PHEVs, ER-EVs and
IV.A.5 PHEV Cost Effectiveness and Life-Cycle Analysis Santini – ANL
Energy Storage R&D 144 FY 2013 Annual Progress Report
EVs changes, or PHEVs continue to be estimated to be the least cost option.
Another possibility is that a version of the series ER-EV could be attractive to a U.S. mass market, given its ability to operate all electrically in all charge depleting conditions, yet maintain an option to travel between cities (inefficiently) if necessary. There was a significant divergence in estimated financial viability of this option estimated by European country experts compared to U.S. country experts (Figure IV - 20 – the vehicle labeled PHEV70 is actually a series ER-EV). This difference should be resolved.
FY 2013 Publications/Presentations
Publications
1. Life Cycle Assessment of Electric Vehicles – Key Issues of Task 19 of the International Energy Agency (IEA) on Hybrid and Electric Vehicles (HEV), G. Jungmeier, J.B. Dunn, A. Elgowainy, L. Gaines, S. Ehrenberger, E. D. Özdemir, H.J. Althaus, R. Widmer, Transport Research Arena 2014, Paris.
2. Comparison of Energy consumption and costs of different HEVs and PHEVs in European and American context. A. Rousseau, F. Badin, M. Redelbach, N. Kim, A. Da Costa, D. Santini, A. Vyas, F. Le Berr, H. Friedrich. Presented at the European Electric Vehicle Congress Brussels. Nov. 19-22 2012.
3. Deploying Plug-in Electric Cars Which are Used for Work: Compatibility of Varying Daily Patterns of Use with Four Electric Powertrain Architectures. D. Santini, Y. Zhou, N. Kim, K. Gallagher, and A. Vyas Paper TRB13-4925. Presented at the Transportation Research Board Meeting Jan. 2013 Washington DC. (forthcoming in Transportation Research Record volume 2385, Alternative Fuels and Technologies 2013, pp. 53-60).
4. Reducing Light Duty Vehicle Fuel Consumption and Greenhouse Gas Emissions: The Combined Potential of Hybrid Technology and Behavioral Adaptation. D. J. Santini, and A. J. Burnham (2013). SAE 2013-01-1282 SAE World Congress, Detroit. April 16-18, 2013.
5. Cost Effective Annual Use and Charging Frequency for Four Different Plug-in Powertrains. Santini, D.J. et al SAE 2013-01-0494 SAE World Congress, Detroit. April 16-18, 2013.
6. Analysis of Input Power, Energy Availability, and Efficiency during Deceleration for X-EV Vehicles. E.M. Rask, Henning Lohse-Busch and D.J. Santini
SAE 2013-01-1064 SAE World Congress, Detroit. April 16-18, 2013. Also SAE Int. J. Alt. Power. 2(2):350-361, 2013.
7. Plug-in Hybrid Electric Vehicles (PHEVs) (Task 15). Chapter 5 of Hybrid and Electric Vehicles: The Electric Drive Gains Traction. IEA-HEV Implementing Agreement Report, May 2013. Pp. 33-45.
8. Task 15, PHEVs, writing up report, studying financial viability of PHEVs. D. Santini, IEA-HEV IA website report, Oct. 2013.
Submitted Paper
1. Daytime charging – what is the hierarchy of opportunities and customer needs? A Case Study based on Atlanta Commute Data. D. J. Santini, Y. Zhou, V. V. Elango, Y. Xu, and R. Guensler. Submitted Aug. 4 to be considered for presentation at Jan. 2014 Transportation Research Board Meeting.
Presentations
1. IA-HEV Task 15. Plug-in Hybrid Electric Vehicles. Conclusions, Report Status, and Next Steps. A. Rousseau 37th Executive Committee meeting of the IEA Hybrid and Electric Vehicle Implementing Agreement, Stuttgart Germany Oct. 15-16, 2012.
2. Well-to-wheels Analysis of PHEVs, A. Elgowainy, IEA Task 19 Workshop 1, Braunschweig, Germany (December 7, 2012).
3. Life-Cycle Analysis Methodology for Electric Vehicles, A. Elgowainy, IEA Task 19 Worskshop 1, Braunschweig, Germany, (December 7, 2012).
4. Energy Consumption and Greenhouse Gas Emissions During Automotive Lithium-Ion Battery Production and Assembly. J. Dunn, IEA Task 19 Workshop 2 Argonne National Laboratory, Argonne, IL (April 25, 2013).
5. Can Automotive Battery Recycling Help Meet Critical Material Demand? L. Gaines, IEA Task 19 Workshop 3 Davos, Switzerland (October 9-10, 2013).
6. (being scheduled at end of FY 2013) IA-HEV Task 15. Plug-in Hybrid Electric Vehicles. Phase 1 Findings & Phase 2 Recommendations. D. Santini, 39th Executive Committee meeting of the IEA Hybrid and Electric Vehicle Implementing Agreement, Barcelona Spain, Nov. 14-15, 2013 and A. Rousseau, Electric Vehicle Symposium 27, Barcelona, Spain, Nov. 17-20.

FY 2013 Annual Progress Report 145 Energy Storage R&D
IV.A.6 Battery Production and Recycling Materials Issues (ANL)
Linda Gaines and Jennifer Dunn Center for Transportation Research Argonne National Laboratory 9700 S. Cass Avenue Argonne, IL 60439 Phone: (630) 252-4919, Fax: (630) 252-3443 E-mail: [email protected] Start: Spring 2008 Projected Completion: Ongoing
Objectives
Examine emissions to air, water, and land from acquisition of current and future battery materials.
Analyze active materials production from metals and other precursors.
Identify barriers in development of active material supply chain.
Identify precursors of greatest concern in the supply chain.
Estimate material demands for Li-ion batteries. o Identify any potential scarcities.
Calculate theoretical potential for material recovery.
Evaluate real potential for recovery using current recycling processes.
Determine potential for recovery via process development.
Characterize ideal recycling process. Develop improved process to maximize
material recovery. Determine how each of these factors changes
with battery chemistry (or mixtures of chemistries).
Determine how reuse of batteries will impact recycling processes and economics.
Identify economic and regulatory factors impacting battery recycling.
Formulate actions to make recycling happen.
Barriers
Nickel and cobalt are energy intensive to produce and have significant environmental impacts, but the need to access virgin supplies could be reduced by recycling.
Scarcity could increase costs for battery materials o Recycling could increase effective material
supply and keep costs down. o Current processes recover cobalt, use of
which will decline. o Recycling economics in doubt because of
low prices for lithium and other materials. Material recovered after use may be obsolete. Producers may be reluctant to use recovered
materials. Mixed streams may be difficult to recycle. Process data are not published and may in fact
not be known yet. Future battery chemistry is not determined.
Technical Goals
Estimate energy use/emissions for current material processes.
Estimate energy use/emissions for current battery assembly processes.
Characterize current battery recycling processes.
Estimate impacts of current recycling processes.
Evaluate alternative strategies for additional material recovery.
Develop improved recycling processes. Screen new battery materials for potential
negative impacts from production or problems in recycling.
Accomplishments
Compared critical material demand to supply out to 2050 for maximum penetration of EVs.
Compiled information on environmental burdens of metal production.
Analyzed cradle-to-gate impacts of producing four new cathode materials.
Determined and characterized current production and recycling methods for lithium-ion batteries.
Performed battery production and recycling lifecycle analysis to compare impacts and identify ideal recycling processes.
Determined roles battery chemistry plays in both environmental and economic benefits of recycling.

IV.A.6 Battery Production and Recycling Materials Issues Gaines, Dunn – ANL
Energy Storage R&D 146 FY 2013 Annual Progress Report
Identified institutional factors that can enable or hinder battery recycling.
Presented and published analyses and recycling process comparison.
Established collaboration with Chinese scientists on battery recycling.
Participated in IEA HEV Task 19, SAE, USCAR, and NRC working groups
Introduction
Examination of the production of batteries from raw material acquisition to assembly illuminates the stages of this supply chain that incur the greatest energy and environmental burdens. Recycling of material from spent batteries will be a key factor in alleviating potential environmental and material supply problems. We are examining battery material production, battery assembly, and battery recycling processes that are available commercially now or have been proposed. Battery materials, assembly and recycling processes are being compared on the basis of energy consumed and emissions, suitability for different types of feedstock, and potential advantages relating to economics and scale. We are comparing the potential of several recycling processes to displace virgin materials at different process stages, thereby reducing energy and scarce resource use, as well as potentially harmful emissions from battery production. Although few automotive batteries have been produced to date, work is under way to develop the best processes to recycle these batteries when they are no longer usable in vehicles. Secondary use of the batteries could delay return of material for recycling.
Approach
In our initial work, we developed cradle-to-gate energy consumption and air emissions for electric vehicle batteries with an LiMn2O4 cathode. These data were incorporated into Argonne’s Greenhouse gases, Regulated Emissions, and Energy use in Transportation (GREET) model. We also estimated the maximum reasonable demand for battery materials, based on extremely aggressive scenarios for penetration of electric-drive vehicles. We combined vehicle demand growth with detailed battery designs and looked at how lithium demand might grow world-wide. We also estimated how much material could be recovered by recycling, thus reducing demand for virgin materials. We determined that cumulative world demand for lithium to 2050 would not strain known reserves. Although cobalt supplies, and possibly those of nickel as well, could be significant constraints by 2050, the
envisioned move away from chemistries containing these elements would obviate potential problems.
Now, life cycle analysis (LCA) of batteries with other cathode materials based on detailed process data is being used to further identify potential environmental roadblocks to battery production, and to compare energy savings and emissions reductions enabled by different types of recycling processes. The cathode materials that are the focus of current work are lithium cobalt oxide (LiCoO2), lithium iron phosphate (LiFePO4), nickel manganese cobalt (LiNi0.4Co0.2Mn0.4O2), and an advanced cathode that has been the subject of research at Argonne, 0.5Li2MnO·0.5LiNi0.44Co0.25Mn0.31O2. The anode paired with each of these cathode materials is typically graphite, although we have also developed a preliminary analysis for silicon.
Results
Battery Production. Roughly half of battery mass consists of materials (Cu, steel, plastics, Al) that have been extensively documented in previous analyses. Therefore, our focus was on the active battery materials that are not as well-characterized, and their fabrication into finished cells. Our earliest work emphasized production of the raw materials and their conversion to active materials. In order to understand the impact of our dependence on imported raw materials, we compared energy use and emissions from lithium carbonate production in Chile to domestic production in Nevada. Domestic production was determined to have somewhat greater impacts, but not enough to cause concern. Our focus then shifted to component manufacture and battery assembly, which must be repeated even if recycled materials are used. Previous work on Ni-MH batteries had suggested that these steps could be energy intensive.
Argonne’s LCA of lithium-ion batteries is based upon a model of lithium-ion battery assembly that Nelson et al. developed1. This peer-reviewed model provides an inventory of battery components and describes the equipment and steps involved in assembling these components into a battery at a manufacturing facility. The dry room was found to consume 1.3 MJ/kg battery or 60% of the total manufacturing energy, in the forms of electricity and natural gas. Total energy for the manufacturing stage is estimated to be only 2.2 MJ/kg, compared to over 130 MJ/kg for the material production for a battery with an LiMn2O4 cathode. Therefore, recycling has the potential to save a very large fraction of the total battery production energy. Recycling is even more beneficial when cathode materials contain nickel or cobalt. Cathode materials with these metals have higher cradle-to-gate energy consumption and greenhouse gas (GHG) emissions than LiMn2O4 (30 MJ/kg). The greater energy
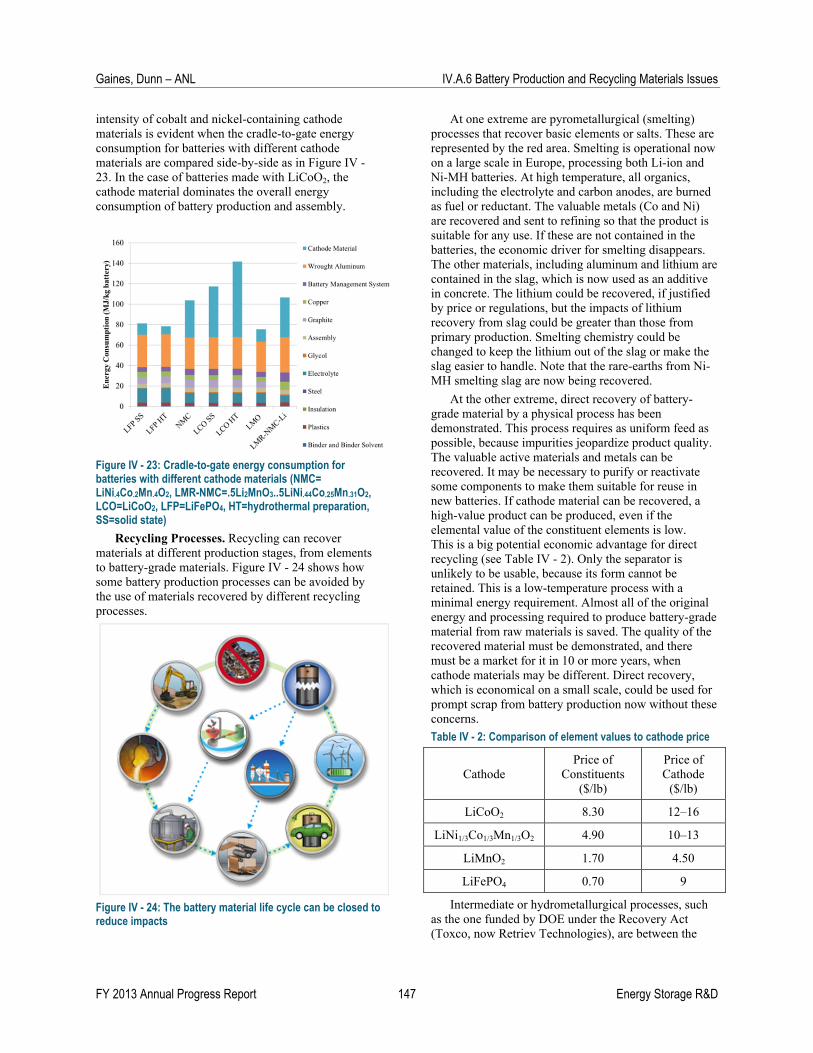
Gaines, Dunn – ANL IV.A.6 Battery Production and Recycling Materials Issues
FY 2013 Annual Progress Report 147 Energy Storage R&D
intensity of cobalt and nickel-containing cathode materials is evident when the cradle-to-gate energy consumption for batteries with different cathode materials are compared side-by-side as in Figure IV - 23. In the case of batteries made with LiCoO2, the cathode material dominates the overall energy consumption of battery production and assembly.
Figure IV - 23: Cradle-to-gate energy consumption for batteries with different cathode materials (NMC= LiNi.4Co.2Mn.4O2, LMR-NMC=.5Li2MnO3..5LiNi.44Co.25Mn.31O2, LCO=LiCoO2, LFP=LiFePO4, HT=hydrothermal preparation, SS=solid state)
Recycling Processes. Recycling can recover materials at different production stages, from elements to battery-grade materials. Figure IV - 24 shows how some battery production processes can be avoided by the use of materials recovered by different recycling processes.
Figure IV - 24: The battery material life cycle can be closed to reduce impacts
At one extreme are pyrometallurgical (smelting) processes that recover basic elements or salts. These are represented by the red area. Smelting is operational now on a large scale in Europe, processing both Li-ion and Ni-MH batteries. At high temperature, all organics, including the electrolyte and carbon anodes, are burned as fuel or reductant. The valuable metals (Co and Ni) are recovered and sent to refining so that the product is suitable for any use. If these are not contained in the batteries, the economic driver for smelting disappears. The other materials, including aluminum and lithium are contained in the slag, which is now used as an additive in concrete. The lithium could be recovered, if justified by price or regulations, but the impacts of lithium recovery from slag could be greater than those from primary production. Smelting chemistry could be changed to keep the lithium out of the slag or make the slag easier to handle. Note that the rare-earths from Ni-MH smelting slag are now being recovered.
At the other extreme, direct recovery of battery-grade material by a physical process has been demonstrated. This process requires as uniform feed as possible, because impurities jeopardize product quality. The valuable active materials and metals can be recovered. It may be necessary to purify or reactivate some components to make them suitable for reuse in new batteries. If cathode material can be recovered, a high-value product can be produced, even if the elemental value of the constituent elements is low. This is a big potential economic advantage for direct recycling (see Table IV - 2). Only the separator is unlikely to be usable, because its form cannot be retained. This is a low-temperature process with a minimal energy requirement. Almost all of the original energy and processing required to produce battery-grade material from raw materials is saved. The quality of the recovered material must be demonstrated, and there must be a market for it in 10 or more years, when cathode materials may be different. Direct recovery, which is economical on a small scale, could be used for prompt scrap from battery production now without these concerns.
Table IV - 2: Comparison of element values to cathode price
Cathode Price of
Constituents ($/lb)
Price of Cathode
($/lb)
LiCoO2 8.30 12–16
LiNi1/3Co1/3Mn1/3O2 4.90 10–13
LiMnO2 1.70 4.50
LiFePO4 0.70 9
Intermediate or hydrometallurgical processes, such as the one funded by DOE under the Recovery Act (Toxco, now Retriev Technologies), are between the

IV.A.6 Battery Production and Recycling Materials Issues Gaines, Dunn – ANL
Energy Storage R&D 148 FY 2013 Annual Progress Report
two extremes. These do not require as uniform a feed as direct recovery, but recover materials further along the process chain than does smelting. If battery materials are treated hydrometallurgically, the lithium is easy to get out, in comparison to pyrometallurgical processing, which traps it in the slag, making it very difficult and expensive to recover. Although the lithium can be recovered (as the carbonate), the high value of the cathode material is not preserved.
Argonne performed a six-month analysis of a hydrometallurgical process developed in Beijing, in collaboration with a visiting Chinese scientist. This process, in contrast to many others, uses no mineral acids, and so produces no toxic wastes. However,
production of the organic acids used instead is somewhat energy-intensive, reducing the benefits of recycling compared to virgin material production. Figure IV - 25 compares estimated energies to produce recycled LiMn2O4 by the intermediate process (Toxco), hydrometallurgically by the Chinese process, and by direct recycling to the energy needed for virgin production from Chile or Nevada. It can be seen that direct recycling has by far the lowest energy requirement. Figure IV - 26 illustrates how production energy for the entire battery can be minimized by the use of recycled metals as well as recycled cathode material.
Figure IV - 25: Energy required to produce cathode material
Figure IV - 26: Energy required to produce battery
Sulfur Emission Reductions by Recycling. Several of the metals used in batteries are smelted from sulfide ores, leading to significant emissions of SOx. These constitute a significant fraction of the vehicle’s life-
cycle emissions (see Figure IV - 27). Recycling produces no such emissions, and thus cathode materials made from recycled materials would have lower production emissions, as can be seen in Figure IV - 28.
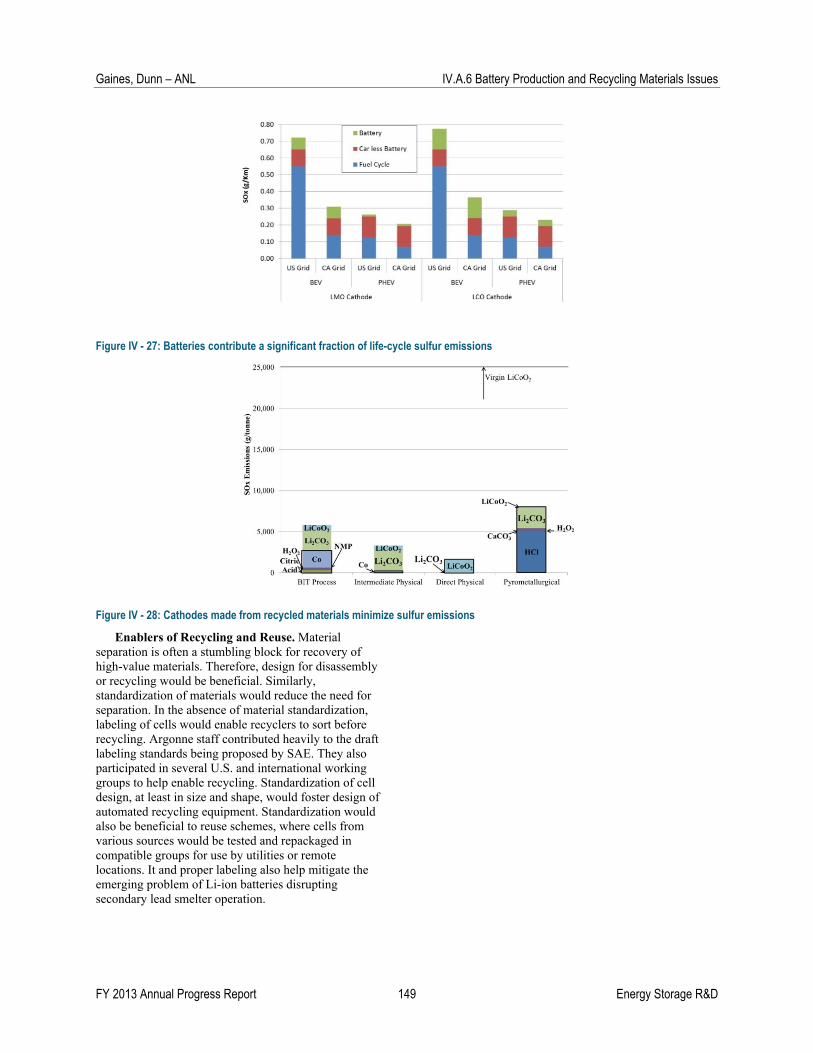
Gaines, Dunn – ANL IV.A.6 Battery Production and Recycling Materials Issues
FY 2013 Annual Progress Report 149 Energy Storage R&D
Figure IV - 27: Batteries contribute a significant fraction of life-cycle sulfur emissions
Figure IV - 28: Cathodes made from recycled materials minimize sulfur emissions
Enablers of Recycling and Reuse. Material separation is often a stumbling block for recovery of high-value materials. Therefore, design for disassembly or recycling would be beneficial. Similarly, standardization of materials would reduce the need for separation. In the absence of material standardization, labeling of cells would enable recyclers to sort before recycling. Argonne staff contributed heavily to the draft labeling standards being proposed by SAE. They also participated in several U.S. and international working groups to help enable recycling. Standardization of cell design, at least in size and shape, would foster design of automated recycling equipment. Standardization would also be beneficial to reuse schemes, where cells from various sources would be tested and repackaged in compatible groups for use by utilities or remote locations. It and proper labeling also help mitigate the emerging problem of Li-ion batteries disrupting secondary lead smelter operation.

IV.A.6 Battery Production and Recycling Materials Issues Gaines, Dunn – ANL
Energy Storage R&D 150 FY 2013 Annual Progress Report
FY2013 Presentations and Publications
Presentations
1. Can Automotive Battery Recycling Help Meet Critical Material Demand? , IEA HEV Task 19 Workshop, (October 9-10, 2013) (during shutdown—script written for surrogate presenter).
2. Recycling of Lithium-Ion Batteries, Plug-In 2013 (Sept. 30-October 2, 2013).
3. Electric Vehicle Battery Recycling: Not for Dummies (for students) (July 17, 2013).
4. To recycle, or not to recycle, that is the question: Insights from life-cycle analysis, Walter Payton College Prep HS (June 6, 2013).
5. Energy Consumption and Greenhouse Gas Emissions During Automotive Lithium-Ion Battery Production and Assembly. IEA Task 19 Workshop 2 (April 25, 2013).
6. Cathode Material Identity’s Influence on the Environmental Impact of Automotive Lithium-Ion Batteries, SAE World Congress (April 18, 2013).
7. Can Automotive Battery Recycling Help Meet Lithium Demand?, invited for American Chemical Society (April 8-11, 2013).
8. Energy and Environmental Impacts of Lithium Production for Automotive Batteries, invited for American Chemical Society (April 8-11, 2013).
9. Cathode Material as the Key to Battery Lifecycle Impacts, U.S. China Battery Working Group, (April 4-5, 2013).
10. Cathode Material Is Key to Evaluating EV Battery Life-Cycle Impacts, 30th International Battery Seminar and Exhibit (March 14, 2013).
11. Well-to-wheels Analysis of PHEVs, IEA Task 19 Workshop 1, (December 7, 2012).
12. Life-Cycle Analysis Methodology for Electric Vehicles, IEA Task 19 Worskshop 1, (December 7, 2012).
13. To recycle, or not to recycle, that is the question: Insights from life-cycle analysis, invited for 2012 Materials Research Society Fall Meeting & Exhibit, Symposium G: Materials as Tools for Sustainability (November 25-30, 2012).
Book Chapter, Papers, Posters, and Fact Sheets
1. Lithium-Ion Battery Environmental Impacts, in Lithium-Ion Batteries: Advances and Applications, Elsevier (to be published 2014)(book chapter).
2. Recovery of Metals from Spent Lithium-ion Batteries with Organic Acids as Leaching Reagents and Environmental Assessment, Journal of Power Sources (February 2013)(paper).
3. Life Cycle Assessment of Electric Vehicles – Key Issues of Task 19 of the International Energy Agency (IEA) on Hybrid and Electric Vehicles (HEV), G. Jungmeier, J.B. Dunn, A. Elgowainy, L. Gaines, S. Ehrenberger, E. D. Özdemir, H.J. Althaus, R. Widmer, Transport Research Arena 2014, Paris (paper).
4. Closing the Lithium-Ion Battery Life Cycle, 6th International Conference on Advanced Lithium Batteries for Automotive Applications (September 9-11, 2013) (poster).
5. Energy and Materials Issues That Affect Electric Vehicle Batteries (May 2013) (fact sheet).
6. How Green is Battery Recycling (October 2012) (fact sheet).
Reference
1. Nelson, P., Gallagher, K., & Bloom, I. (2011). Modeling the performance and cost of lithium-ion batteries for electric-drive vehicles.Argonne National Laboratory.

FY 2013 Annual Progress Report 151 Energy Storage R&D
IV.A.7 Updating USABC Battery Technology Targets for Battery Electric Vehicles (NREL)
Jeremy Neubauer National Renewable Energy Laboratory 15013 Denver West Parkway Golden, CO 80401 Phone: (303) 275-3084 E-mail: [email protected] Collaborators: E. Wood, A. Brooker, and A. Pesaran, NREL C. Bae, Ford R. Elder, Chrysler H. Tataria, General Motors B. Cunningham, U.S. Department of Energy Start Date: FY2012 Projected End Date: FY2013
Objective
Provide analysis to support the EV Everywhere Grand Challenge and the DOE/United States Advanced Battery Consortium (USABC) identification of battery available energy, mass, volume, cost, discharge power, and charge power requirements that will enable broad commercial success of battery electric vehicles (EVs).
Technical Barriers
Current USABC EV battery targets were developed more than 20 years ago. Documentation on their development is scarce, and the necessary vehicle performance for market success has changed since their creation.
Accomplishments
Developed a simulation-based approach to calculate EV battery technology requirements necessary to deliver the vehicle level performance required for commercial success of EVs.
Implemented the process across a range of inputs and provided results to the USABC and to DOE for finalizing inputs and assumptions.
Introduction
EVs offer significant potential to reduce the nation’s consumption of gasoline and production of greenhouse gases as identified in the DOE EV Everywhere Grand Challenge. However, one large impediment to the commercial success and proliferation of these vehicles is limited battery technology. EVs on the market today come with a significant cost premium relative to their conventionally powered counterparts, even after significant federal and state purchase incentives. In addition, the range of the vehicle is typically restricted by limited battery energy to less than 100 miles. Furthermore, when an EV is based upon a platform designed for a conventional powertrain, the size of the battery necessary to achieve this limited range often subtracts from available passenger or cargo volume.
Improvements in battery technology have the capacity to resolve all of these issues. Accordingly, in support of Administration’s EV Everywhere Grand Challenge, DOE’s Vehicle Technology Office, working with USABC and others are directing significant resources towards the development of batteries for EVs. Historically, these developments have been focused towards a set of DOE/USABC EV battery targets developed more than 20 years ago. Documentation providing insight into the development of these targets is exceptionally scarce; thus, the justification for these values is unclear. For this reason, and on the basis that the necessary vehicle performance for market success has changed since the creation of the original targets, there is motivation to develop an updated set of EV battery technology targets.
In 2012, the USABC and DOE began the process of creating a new set of battery technology targets for EVs. It was desired that the requirements be designed to deliver an EV capable of broad market success in support of the EV Everywhere Grand Challenge. To this end, the resources provided by DOE VTO to the National Renewable Energy Laboratory (NREL) were leveraged to supply detailed technical analysis, guided by the insight of the USABC’s vehicle original equipment manufacturers (OEM) on consumer requirements and future technology trends.

IV.A.7 USABC Battery Technology Targets for BEVs Neubauer – NREL
Energy Storage R&D 152 FY 2013 Annual Progress Report
Approach
The objective of this analysis is to support USABC and DOE identification of battery available energy, mass, volume, cost, discharge power, and charge power requirements that will enable broad commercial success of EVs. Working closely with USABC and DOE, NREL has developed a simulation-based approach to achieving this objective.
It begins by first specifying the relevant vehicle-level performance requirements necessary for commercial success; most relevant to this analysis are acceleration and range. Next, we select a vehicle platform with broad market appeal and define its mass and aerodynamic properties using forecasted values for our timeframe of interest. At this point, we calculate the required energy and power to meet our range and acceleration targets, then analyze the charge and discharge power requirements of varying durations
across multiple drive cycles using vehicle simulation software. Finally, we calculate available battery mass and volume, followed by allowable battery cost to provide cost-parity with a comparable conventionally powered vehicle. We leverage OEM input via the USABC throughout to ensure that all assumptions are relevant to the anticipated level of future vehicle technology and market expectations.
Results
At the request of the DOE and USABC, we applied this approach to multiple vehicle platforms (compact car, midsize sedan, and small SUV) and vehicle ranges (150 and 300 miles). For each vehicle platform we defined the total vehicle mass using a vehicle mass factor parameter (the ratio of total EV mass to total conventional vehicle mass) and varied this as well. Some high level results are shown in Figure IV - 29.
Figure IV - 29: Required end-of-life (EOL) pack specific energy and energy density as a function of vehicle range, platform, and mass factor
We have also simulated these configurations to multiple drive cycles to calculate discharge and charge
power requirements. Results for a mid-size sedan with a 1.2 vehicle mass factor are shown in Figure IV - 30.

Neubauer – NREL IV.A.7 USABC Battery Technology Targets for BEVs
FY 2013 Annual Progress Report 153 Energy Storage R&D
Figure IV - 30: Discharge (top) and charge (bottom) power requirements for a mid-size sedan with a vehicle mass factor of 1.2.
In addition, cost requirements were calculated and implications for beginning-of-life cell-level targets were extrapolated. All of this data was presented to USABC to support their target setting process.
Conclusions and Future Directions
This project successfully analyzed EV battery targets and the findings were provided to DOE and USABC. USABC subsequently selected new targets for its EV battery technology development programs using this input, which have been published10. To conclude
10 Please see the EV requirements listed in Chapter II of this report and those listed at the USCAR website (http://www.uscar.org/guest/article_view.php?articles_id=87).
this work, NREL plans to publish on its target analysis process to guide future target-setting efforts.
Energy Storage R&D 154 FY 2013 Annual Progress Report
IV.B Battery Testing Activities
IV.B.1 Battery Performance and Life Testing (ANL)
Ira Bloom, Primary Contact John Basco, Panos Prezas, David Robertson, Lee Walker Argonne National Laboratory 9700 South Cass Avenue Argonne, IL 60439 Phone: (630) 252-4516; Fax: (630) 252-4176 E-mail: [email protected] Start Date: September 1976 Projected End Date: Open
Objectives
Provide DOE, USABC, and battery developers with reliable, independent and unbiased performance evaluations of cells, modules and battery packs.
Benchmark battery technologies which were not developed with DOE/USABC funding to ascertain their level of maturity.
Technical Barriers
This project addresses the following technical barriers as described in the USABC goals [1, 2, and 3]:
(A) Performance at ambient and sub-ambient temperatures.
(B) Calendar and cycle life.
Technical Targets
PHEV Technical Targets
15-year calendar life. 5,000 CD cycles.
Other technical targets exist for EV, HEV and LEESS applications
Accomplishments
Tested battery deliverables from many developers:
HEV and LEESS batteries: Test contract deliverables from A123 Systems (in progress) and Leyden Energy (in progress).
PHEV batteries: Test contract deliverables from Johnson Controls, Incorporated (in progress) and A123 (in progress).
EV batteries: Seeo (complete), Optodot (in progress), 3M (in progress) and DowKokam (in progress).
Benchmark battery technologies for vehicle applications. Test deliverables from Cobasys (in progress), SK Energy (in progress), ActaCell (in progress) and DowKokam (EV; complete).
Compare EV battery test protocols used in the U.S. and in China (Argonne lead; in progress).
Introduction
Batteries are evaluated using standard tests and protocols which are transparent to technology. Two protocol sets are used: one that was developed by the USABC [1, 2], and another which provides a rapid screening of the technology. The discussion below focuses on results obtained using these standard protocols.
Approach
The batteries are evaluated using standardized and unbiased protocols, allowing a direct comparison of performance within a technology and across technologies. For those tested using the USABC methods, the performance of small cells can be compared to that of larger cells and full-sized pack by means of a battery scaling factor [1, 2].
Results
Independently, organizations in the U.S. and China have developed battery testing protocols. Even though these protocols started from the same basic understanding of electrochemistry, the protocols that each country uses reflect differences in philosophy and approach.
In the U.S., ANL and INL and in China, CATARC are collaborating to compare battery testing procedures and methods. The collaboration may establish

Bloom – ANL IV.B.1 Battery Performance and Life Testing
FY 2013 Annual Progress Report 155 Energy Storage R&D
standardized, accelerated test procedures and will allow battery testing organizations to cooperate in the analysis of the resulting data. In turn, the collaboration may accelerate electric vehicle development and deployment. The three steps and progress in this collaborative effort are shown in Table IV - 3.
Table IV - 3. Steps and progress in the collaborative testing effort
Step Status
Collect and discuss battery test protocols from various organizations/countries
Complete
Conduct side-by-side tests using all protocols for a given application, such as an EV
In progress
Compare the results, noting similarities and differences between protocols and test sites
In progress
Initially, the approach to testing was different. The USABC tests focus on pre-competitive experiments using an ideal, family-sized car. In contrast, those from China were centered on how the battery performed in a given automobile.
The tests focused on the EV application. Here, the USABC protocol consisted of a dynamic, constant-power discharge and constant-current charging. The
Chinese protocol consisted of constant-current discharges (C/3 rate) and charges. USABC reference performance test (RPT) consisted of two C/3 capacity cycles, a peak power pulse test at 10% DOD increments and full DST cycle. The cells were characterized using these tests every 50 cycles. In contrast, the Chinese RPT consisted of one C/3 capacity cycle and 10 second discharge pulse at 50% DOD. The RPT is performed every 25 cycles. Both cycle-life protocols terminate discharge at 80% DOD.
The tests were performed using commercially-available cells containing LiFePO4- and graphite-based chemistry. Figure IV - 31 shows the trend in specific power obtained using the Chinese test protocol and measured at ANL and INL. The figure shows that the specific power of the battery decreased with cycling and that the measurements and trends obtained at the two labs were very similar.
Figure IV - 32 shows the change in average, relative capacity using the two test protocols, USABC and Chinese. From the figure, the Chinese protocol produced more capacity fade than the USABC at ANL; there was no significant difference between the protocols at INL; and, at CATARC, the result indicate that the capacity faded more using the Chinese protocol than the USABC. Some of these differences may be due to lot and cell-to-cell variation. Investigation into these differences is still in progress.
Figure IV - 31: Specific power vs. cycle count for cells cycled using the Chinese test protocol at ANL and INL

IV.B.1 Battery Performance and Life Testing Bloom – ANL
Energy Storage R&D 156 FY 2013 Annual Progress Report
Figure IV - 32: Change in average, relative capacity measured using the two test protocols at the three test sites
Conclusions and Future Directions
Testing has been shown to be a useful way to gauge the state of a developer’s technology and to estimate the life of a battery.
For the future, we plan to:
Continue testing HEV contract deliverables. Continue testing PHEV contract deliverables. Continue testing EV contract deliverables. Begin testing LEESS contract deliverables. Continue acquiring and benchmarking
batteries from non-DOE sources. Aid in refining standardized test protocols. Upgrade and expand test capabilities to handle
increase in deliverables. Continue the protocol comparison. Explore other possibilities for test protocol
comparison and, perhaps, standardization with Europe, Japan and China.
List of Abbreviations
HEV: hybrid electric vehicle
PHEV: plug-in hybrid electric vehicle
EV: electric vehicle
LEESS: Low-Energy Energy Storge System
USABC: United States Advanced Battery Consortium (DOE, GM, Chrysler and Ford)
CATARC: China Automotive Technology and Research Center
ANL: Argonne National Laboratory
INL: Idaho National Laboratory
RPT: reference performance test
DST: dynamic stress test, see reference 3.
FY 2013 Publications/Presentations
1. A Comparison of U.S. and Chinese EV Battery Testing Protocols: Results, I. Bloom, D. Robertson, F. Wang, S. Liu, and J. Christophersen, 8th U.S./China Electric Vehicle and Battery Technology Meeting, September 21-22, 2013, Chengdu, China.
2. Effect Of Ultracapacitor-Modified PHEV Protocol On Performance Degradation In Lithium-Ion Cells, Clark G. Hochgraf, John K. Basco, Theodore P. Bohn, And Ira Bloom, J. Power Sources, 246 (2014) 965-969.
References
1. FreedomCAR Battery Test Manual for Power-Assist Hybrid Electric Vehicles, DOE/ID-11069, October 2003.
2. FreedomCAR Battery Test Manual for Plug-In Hybrid Electric Vehicles, June 2010.
3. Electric Vehicle Battery Test Procedures Manual, Revision 2, January 1996.
‐0.02
0.00
0.02
0.04
0.06
0.08
0.10
0.12
0 50 100 150 200 250
Chan
ge in
avg., rel. cap
acity
Cycle time, days
ANL ‐ USABC protocol
ANL ‐ Chinese protocol
INL ‐ USABC protocol
INL ‐ Chinese protocol
China ‐ USABC protocol
China ‐ Chinese protocol
FY 2013 Annual Progress Report 157 Energy Storage R&D
IV.B.2 Advanced Energy Storage Life and Health Prognostics (INL)
Jon P. Christophersen, PhD (PI) Idaho National Laboratory P.O. Box 1625 Idaho Falls, ID 83415 Phone: (208) 526-4280; Fax: (208) 526-3150 E-mail: [email protected] Ira Bloom (Argonne National Laboratory) Ed Thomas (Sandia National Laboratories) John L. Morrison, PhD (Montana Tech) William H. Morrison (Montana Tech) Christopher E. Hendricks (University of Maryland) Sergiy V. Sazhin (INL) Chinh D. Ho (INL) Subcontractor: Montana Tech of the University of Montana Butte, MT Start Date: October 2008 Projected End Date: September 2013 (extended into FY-14)
Objectives
Develop techniques for accurate estimations of state-of-health (SOH) and remaining useful life (RUL) for electrochemical energy storage devices using both offline and online (i.e., in situ) techniques: o Design statistically robust accelerated
aging protocols with identified stress factor interactions for improved offline battery life estimation.
o Develop novel onboard sensor technology for improved online battery diagnostics, prognostics and control.
Technical Barriers
Developing relevant approaches for both offline and online battery life and health prognostics addresses four primary technical barriers: cost, performance, abuse tolerance, and accurate life estimation (i.e., reliability). Successful SOH and RUL estimation techniques enable smarter battery pack designs with reduced weight and cost in addition to optimized power management for enhanced reliability and performance. Battery safety could also be more thoroughly addressed with improved
online sensor technology that rapidly identifies failure mechanisms and helps to prevent catastrophic events. Finally, enhanced SOH and RUL estimations enable smarter decisions about secondary use applications.
Technical Targets
Update the Technology Life Verification Test Manual.
Demonstrate cell-level rapid impedance measurements as a function of depth of discharge (DOD) and cell age.
Enhance existing prototype rapid impedance measurement system (both hardware and software) for module-level testing.
Demonstrate module-level measurements using rapid impedance techniques using combinations of cell strings.
Accomplishments
Published Revision 1 of the Technology Life Verification Testing (TLVT) Manual.
Completed validation study using rapid impedance measurements at various DOD conditions.
Completed design of 50-V hardware and upgraded control software for string-level rapid impedance measurements.
Developed test plan for string-level measurements of cells to determine SOH (cell testing to be performed in FY-14).
Introduction
Improving the accuracy of offline and online battery life estimation is critical for the successful and widespread implementation of battery technologies for various applications including automotive, military, utilities, etc. Offline battery life estimation is important for establishing a technology’s readiness for transition into mass production or to serve as a useful adjunct for warranty determinations. Once a battery technology is deployed, online monitoring is required for advanced management and control to ensure extended performance capability and reduced range anxiety.

IV.B.2 Advanced Energy Storage Life and Health Prognostics Christophersen – INL
Energy Storage R&D 158 FY 2013 Annual Progress Report
Approach
Idaho National Laboratory (INL) has extensive experience with battery performance testing and is uniquely positioned to address advanced energy storage life and health prognostics. INL collaborated with Argonne National Laboratory (ANL) and Sandia National Laboratories (SNL) to develop statistically robust accelerated aging protocols under controlled (i.e., offline) conditions to assess the expected calendar life for automotive applications within one or two years of testing. The automotive battery life targets for the U.S. Advanced Battery Consortium (USABC) are generally 15 years of calendar life with at least 150,000 miles of cycle-life operations.
For Revision 1 of the TLVT Manual, the aging protocols were designed to be more compatible with standardized USABC testing as well as the updated Battery Life Estimator software tool that was completed in FY-12. The software tool uses the TLVT test matrices and default (semi-empirical) life models with Monte Carlo simulations to predict overall life capability at a designated reference condition (e.g., 30°C) within a statistical confidence interval.
INL also collaborated with Montana Tech of the University of Montana to develop a rapid impedance measurement technique for module-level systems up to 50V. The upgraded hardware and control software enable the acquisition of a broad-spectrum impedance measurement within approximately ten seconds or less depending on the frequency range (the excitation signal generally requires at least one period of the lowest frequency, so the measurement duration will increase for lower frequencies if a better definition of the Warburg tail is desired). Although the prototype hardware is a rack-mount system, it could also be re-designed as an onboard sensor for embedded systems.
In addition to completing the prototype hardware and control software, a test plan was developed for string-level testing of commercially-available lithium-ion cells. Due to some unanticipated losses in personnel at INL, testing under this plan was delayed and is expected to start in FY-14. However, the validation study with the 5-V prototype system hardware was completed in FY-13 using Sanyo SA cells. The purpose of this study was to explore the differences in impedance spectra as a function of DOD and aging. Nine cells were calendar-life aged at 50°C with reference performance tests (RPT) every 32.5 days. One group of three cells was subjected to a standard pulse-per-day test followed by a voltage clamp at 60% state of charge (SOC); a second group of three cells was also voltage clamped at 60% SOC with a rapid impedance measurement once per day; the third group was simply clamped at 60% SOC without any daily measurements. RPTs consisted of a standard low-current Hybrid Pulse
Power Characterization (L-HPPC) with a ten-second rapid impedance measurement immediately prior to the pulse profile at each 10% DOD increment. The frequency range for the impedance measurements in all cases was 1638.4 to 0.1 Hz with octave harmonic separation (i.e., 10-second measurements).
Results
Offline Battery Life Estimation. Revision 1 of the Technology Life Verification Test Manual was published in December 2012. It is primarily meant to verify / demonstrate a battery’s readiness for transition to production and is generally expected to be implemented at the cell-level, though module and pack-level technologies could be used as well. In Revision 1, the accelerated aging methodology and test matrices are more synergistic with standardized protocols developed for USABC testing to ensure a smoother transition between prototype cell testing for USABC and pre-production testing.
The TLVT methodology requires both a core- and supplemental-life test matrix. The core-life test matrix design first requires the identification of all relevant wear out mechanisms and associated stress factors that affect battery life. Most of these can be identified from USABC testing and/or knowledge of the cell chemistry. Once identified, a battery life model is developed to account for individual stressors as well as stress factor interactions. An error model is also developed to address cell-to-cell variability. The core-life test matrix is then designed based on the anticipated level of stressor interactions and level of maturity of the life model. Three different levels of matrix designs are discussed in the manual, ranging from a minimal (verification) test matrix to a full-factorial design. Once the core matrix is completed, performance data are primarily simulated using the Battery Life Estimator software tool and then verified with actual cell testing. Due to resource limitations, only a subset of the full matrix may be used for actual cell testing to verify the accuracy of the life and error models. If the test data validate the anticipated results from the models and simulations, then the simulated data can be used to estimate offline battery life capability within a designated statistical confidence limit (e.g., 95% upper and lower confidence).
In addition to the core-life test matrix, a supplemental matrix design is also described in the manual where various assumptions about battery behavior can be verified. For example, a supplemental matrix may include a path dependence study that examines the memory effects of cells, a low-temperature cycling condition, or even periodic cold crank tests during life aging. If results from the supplemental matrix testing reveal weaknesses in the overall life

Christophersen – INL IV.B.2 Advanced Energy Storage Life and Health Prognostics
FY 2013 Annual Progress Report 159 Energy Storage R&D
model, then the model will need to be modified and the core matrix simulation and testing will need to be repeated.
Online Battery Life Estimation. The 50-V rapid impedance measurement system is a significant advancement over previous generations. The hardware included a USB-driven data acquisition system to enable more portability. It also included a digitally isolated voltage feedback system to eliminate the high-voltage DC bias when capturing the sum-of-sines excitation signal. Protection features were added for higher voltages such that it will not excite a test article with a sum-of-sines signal if the terminals are connected backwards. The calibration system was also significantly improved to enable computer controlled automation and now accounts for both the magnitude and phase (previous hardware generations required manual shunt connections and calibrated only the magnitude). Calibration is now performed at each frequency within the sum-of-sines whereas previous techniques were based on an average for all frequencies. In addition to the hardware improvements, the control software was upgraded with significant speed improvement for capturing and processing the response signal and enabling higher frequency resolution in the excitation signals.
This 50-V prototype system will be used for the string-level cell study using commercially-available Sanyo SAX cells. A test plan was developed for this study and consists of the following research questions:
Can the 50-V rapid impedance measurement system be used for string-level diagnostics and prognostics?
How sensitive is the detection of anomalous cells in a string given string length and the cell aging intensity (e.g., temperature)?
The test matrix is shown in Table IV - 4. The cells will be calendar-life aged individually at the designated test temperature and SOC and then assembled into various string combinations for rapid impedance measurements as part of the RPTs.
Table IV - 4: Test group for cell string-level study
Group # of Cells Temperature SOC
A 6 30ºC 60% SOC
B 2 40ºC 60% SOC
C 2 50ºC 60% SOC
Table IV - 5 shows the string combinations of cells for rapid impedance measurements at each RPT. All cells will be subjected to individual impedance measurements and then combined into various cell series and parallel combinations. The 2, 3, and 4-cell series connections will reach approximately 8, 12, and
16 V, respectively, for the impedance measurements. A total of 32 impedance spectrum measurements will be conducted at each RPT. Bolted Anderson connectors will be used in the test fixture design to facilitate series and parallel connections at each RPT without having to disturb the cells within the temperature chambers.
Table IV - 5: String combinations for rapid impedance measurements
Measurement Type
Cells
Single Cell A1, A2, A3, A4, A5, A6, B1, B2, C1, C2
2 Cell Series (same group condition)
A5 in series with A6 B1 in series with B2 C1 in series with C2
2 Cell Parallel (same group condition)
A5 in parallel with A6 B1 in parallel with B2 C1 in parallel with C2
2 Cell Series (different group condition)
A6 in series with B1 A6 in series with C1
2 Cell Parallel (different group condition)
A6 in parallel with B1 A6 in parallel with C1
3 Cell Series (same group condition)
A4, A5, A6 in series
3 Cell Parallel (same group condition)
A4, A5, A6 in parallel
3 Cells Series (different group condition)
A4, A5, B2 in series A4, A5, C2 in series
3 Cells Parallel (different group condition)
A4, A5, B2 in parallel A4, A5, C2 in parallel
4 Cells Series (same group condition)
A1, A2, A3, A4 in series
4 Cells Parallel (same group condition)
A1, A2, A3, A4 in parallel
4 Cells Series (different group condition)
A1, A2, A3, B2 in series A1, A2, A3, C2 in series
4 Cells Parallel (different group condition)
A1, A2, A3, B2 in parallelA1, A2, A3, C2 in parallel
Cell-testing for this string study was delayed due to unanticipated losses in personnel, but is expected to start early in FY-14. However, the 5-V prototype system validation testing activities were concluded in FY-13 with the successful completion of the rapid impedance spectrum measurements as a function of DOD and cell age. The Sanyo cells were calendar-life aged at 50ºC for a total of eight months. Table IV - 6 shows the average capacity and available power at RPT 8 with the corresponding percent-fade for each calendar-life group.
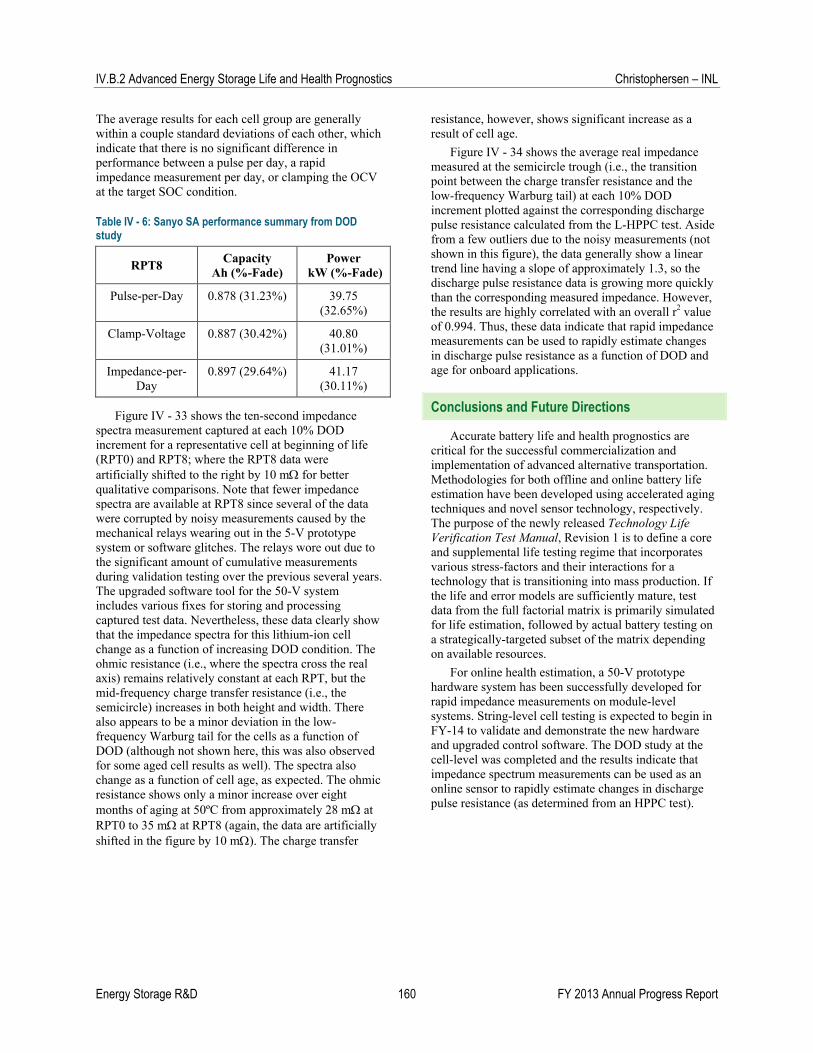
IV.B.2 Advanced Energy Storage Life and Health Prognostics Christophersen – INL
Energy Storage R&D 160 FY 2013 Annual Progress Report
The average results for each cell group are generally within a couple standard deviations of each other, which indicate that there is no significant difference in performance between a pulse per day, a rapid impedance measurement per day, or clamping the OCV at the target SOC condition.
Table IV - 6: Sanyo SA performance summary from DOD study
RPT8 Capacity
Ah (%-Fade) Power
kW (%-Fade)
Pulse-per-Day 0.878 (31.23%) 39.75 (32.65%)
Clamp-Voltage 0.887 (30.42%) 40.80 (31.01%)
Impedance-per-Day
0.897 (29.64%) 41.17 (30.11%)
Figure IV - 33 shows the ten-second impedance spectra measurement captured at each 10% DOD increment for a representative cell at beginning of life (RPT0) and RPT8; where the RPT8 data were artificially shifted to the right by 10 m for better qualitative comparisons. Note that fewer impedance spectra are available at RPT8 since several of the data were corrupted by noisy measurements caused by the mechanical relays wearing out in the 5-V prototype system or software glitches. The relays wore out due to the significant amount of cumulative measurements during validation testing over the previous several years. The upgraded software tool for the 50-V system includes various fixes for storing and processing captured test data. Nevertheless, these data clearly show that the impedance spectra for this lithium-ion cell change as a function of increasing DOD condition. The ohmic resistance (i.e., where the spectra cross the real axis) remains relatively constant at each RPT, but the mid-frequency charge transfer resistance (i.e., the semicircle) increases in both height and width. There also appears to be a minor deviation in the low-frequency Warburg tail for the cells as a function of DOD (although not shown here, this was also observed for some aged cell results as well). The spectra also change as a function of cell age, as expected. The ohmic resistance shows only a minor increase over eight months of aging at 50ºC from approximately 28 m at RPT0 to 35 m at RPT8 (again, the data are artificially shifted in the figure by 10 m). The charge transfer
resistance, however, shows significant increase as a result of cell age.
Figure IV - 34 shows the average real impedance measured at the semicircle trough (i.e., the transition point between the charge transfer resistance and the low-frequency Warburg tail) at each 10% DOD increment plotted against the corresponding discharge pulse resistance calculated from the L-HPPC test. Aside from a few outliers due to the noisy measurements (not shown in this figure), the data generally show a linear trend line having a slope of approximately 1.3, so the discharge pulse resistance data is growing more quickly than the corresponding measured impedance. However, the results are highly correlated with an overall r2 value of 0.994. Thus, these data indicate that rapid impedance measurements can be used to rapidly estimate changes in discharge pulse resistance as a function of DOD and age for onboard applications.
Conclusions and Future Directions
Accurate battery life and health prognostics are critical for the successful commercialization and implementation of advanced alternative transportation. Methodologies for both offline and online battery life estimation have been developed using accelerated aging techniques and novel sensor technology, respectively. The purpose of the newly released Technology Life Verification Test Manual, Revision 1 is to define a core and supplemental life testing regime that incorporates various stress-factors and their interactions for a technology that is transitioning into mass production. If the life and error models are sufficiently mature, test data from the full factorial matrix is primarily simulated for life estimation, followed by actual battery testing on a strategically-targeted subset of the matrix depending on available resources.
For online health estimation, a 50-V prototype hardware system has been successfully developed for rapid impedance measurements on module-level systems. String-level cell testing is expected to begin in FY-14 to validate and demonstrate the new hardware and upgraded control software. The DOD study at the cell-level was completed and the results indicate that impedance spectrum measurements can be used as an online sensor to rapidly estimate changes in discharge pulse resistance (as determined from an HPPC test).
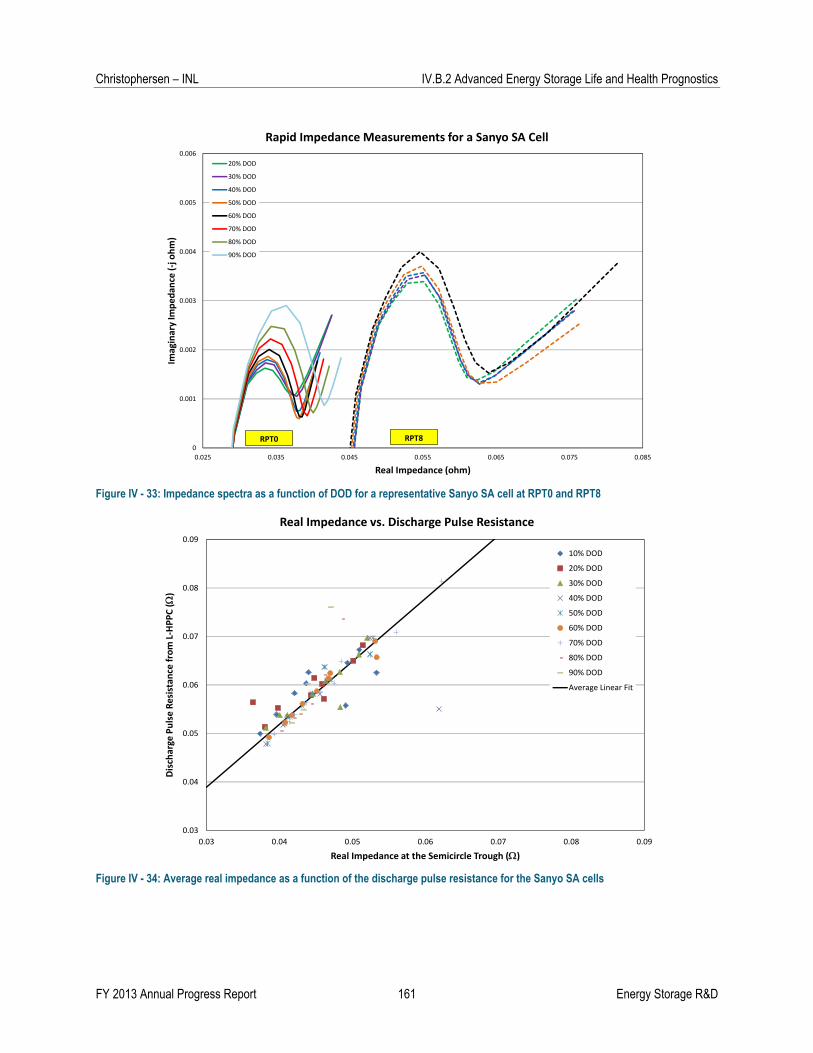
Christophersen – INL IV.B.2 Advanced Energy Storage Life and Health Prognostics
FY 2013 Annual Progress Report 161 Energy Storage R&D
Figure IV - 33: Impedance spectra as a function of DOD for a representative Sanyo SA cell at RPT0 and RPT8
Figure IV - 34: Average real impedance as a function of the discharge pulse resistance for the Sanyo SA cells
0
0.001
0.002
0.003
0.004
0.005
0.006
0.025 0.035 0.045 0.055 0.065 0.075 0.085
Imaginary Im
pedan
ce (‐j ohm)
Real Impedance (ohm)
Rapid Impedance Measurements for a Sanyo SA Cell
20% DOD
30% DOD
40% DOD
50% DOD
60% DOD
70% DOD
80% DOD
90% DOD
RPT0 RPT8
0.03
0.04
0.05
0.06
0.07
0.08
0.09
0.03 0.04 0.05 0.06 0.07 0.08 0.09
Discharge Pulse Resistan
ce from L‐HPPC ()
Real Impedance at the Semicircle Trough ()
Real Impedance vs. Discharge Pulse Resistance
10% DOD
20% DOD
30% DOD
40% DOD
50% DOD
60% DOD
70% DOD
80% DOD
90% DOD
Average Linear Fit

IV.B.2 Advanced Energy Storage Life and Health Prognostics Christophersen – INL
Energy Storage R&D 162 FY 2013 Annual Progress Report
FY 2013 Publications/Presentations
1. Battery Technology Life Verification Test Manual, Revision 1, INL/EXT-12-27920, December 2012.
2. Christophersen, J., Morrison, J., Motloch, C. and Morrison, W., "Long-Term Validation of Rapid Impedance Spectrum Measurements as a Battery State-of-Health Assessment Technique," SAE Int. J. Alt. Power 6(1):2013.
3. Christophersen, J. P., Morrison, J. L., and Morrison, W. H., “Acquiring Impedance Spectra from Diode Coupled Primary Batteries to Determine Health and State of Charge,” Proceedings from the IEEE Aerospace Conference, March 2013.
4. Christophersen, J. P., “Battery Life Estimations for Offline ad Online Applications,” invited presentation for the 2013 Advanced Automotive Battery Conference, Pasadena, CA, February 2013.

FY 2013 Annual Progress Report 163 Energy Storage R&D
IV.B.3 Battery Performance and Life Testing (INL)
Jon P. Christophersen, PhD (PI) Idaho National Laboratory P.O. Box 1625 Idaho Falls, ID 83415 Phone: (208) 526-4280; Fax: (208) 526-3150 E-mail: [email protected] Christopher J. Michelbacher Matthew G. Shirk Clair K. Ashton Taylor L. Bennett Randy L. Bewley Michael C. Evans Chinh D. Ho INL Contract Number: DE-AC07-051D14517 Start Date: September 1983 Projected End Date: Open Contract
Objectives
Provide high fidelity performance and life testing, analysis, modeling, reporting, and other support related to electrochemical energy storage devices under development funded by VTO.
Develop test methodologies and analysis procedures for various alternative vehicle applications in conjunction with the U.S. Advanced Battery Consortium (USABC).
Technical Barriers
The successful adoption of cost-effective, safe, reliable and environmentally sustainable alternative vehicles remains a challenge. Performance and life testing of energy storage devices (e.g., batteries) in a controlled, laboratory environment is a critical component of DOE’s mission to support the development of electric drive vehicle and component technology. Battery testing at the Idaho National Laboratory (INL) addresses all of the primary technical barriers: performance, life, cost, abuse tolerance and reliability. Accumulated test data are used to gauge battery capability relative to the DOE/USABC targets as a function of age as well as for developing battery life and cell-to-cell error models for advanced life and health prognostic tools. Performance and life testing are also useful for battery manufacturers as they develop
lower-cost systems that can still meet the established targets. Finally, fresh and aged test articles are useful for abuse testing and thermal analysis in collaboration with other national laboratory efforts.
Technical Targets
Battery performance and life testing in FY-13 at INL primarily focused on USABC technical targets for power-assist Hybrid Electric Vehicles (HEVs), Plug-in Hybrid Electric Vehicles (PHEV), Electric Vehicles (EV), Low-Energy Energy Storage Systems (LEESS) and 12 V Start/Stop.
Technical targets for each of these automotive applications are available in the on-line manuals located at the USABC website.
Accomplishments
Performance and life testing for USABC Programs: o 264 cells. o 9 modules.
Performance and life testing for Benchmark Programs: o 46 cells. o 14 modules.
Performance and life testing for FOA-2011 Programs: o 18 cells.
Performance and life testing for FOA-ARRA (American Recovery and Reinvestment Act) Programs: o 31 modules.
Published the LEESS Manual and 12V Start/Stop draft Manual.
Completed setup of new 10,000 ft2 battery testing facility with 165 new test channels, and walk-in environmental chambers.
Introduction
Advancing alternative transportation is a top priority within the DOE given its potential to reduce U.S. dependency on oil. The INL Battery Testing Center is a world leader in performance testing and assessment of advanced electrochemical energy storage technologies, primarily for automotive applications, and has been
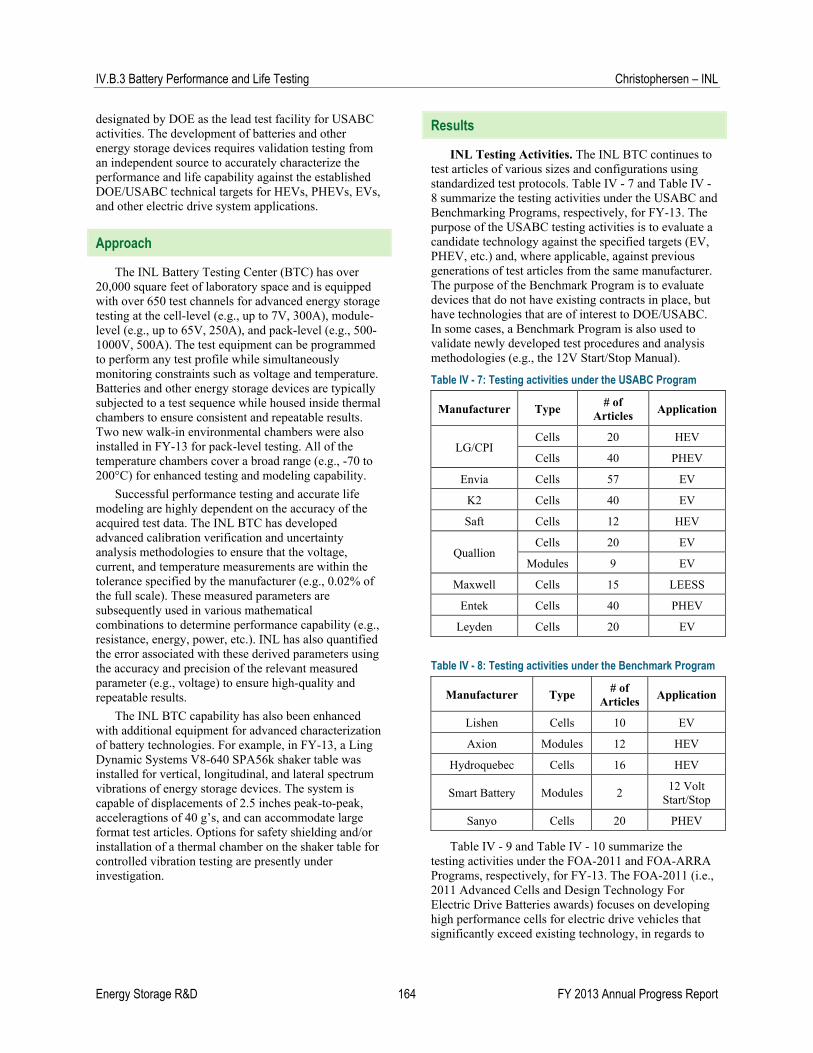
IV.B.3 Battery Performance and Life Testing Christophersen – INL
Energy Storage R&D 164 FY 2013 Annual Progress Report
designated by DOE as the lead test facility for USABC activities. The development of batteries and other energy storage devices requires validation testing from an independent source to accurately characterize the performance and life capability against the established DOE/USABC technical targets for HEVs, PHEVs, EVs, and other electric drive system applications.
Approach
The INL Battery Testing Center (BTC) has over 20,000 square feet of laboratory space and is equipped with over 650 test channels for advanced energy storage testing at the cell-level (e.g., up to 7V, 300A), module-level (e.g., up to 65V, 250A), and pack-level (e.g., 500-1000V, 500A). The test equipment can be programmed to perform any test profile while simultaneously monitoring constraints such as voltage and temperature. Batteries and other energy storage devices are typically subjected to a test sequence while housed inside thermal chambers to ensure consistent and repeatable results. Two new walk-in environmental chambers were also installed in FY-13 for pack-level testing. All of the temperature chambers cover a broad range (e.g., -70 to 200°C) for enhanced testing and modeling capability.
Successful performance testing and accurate life modeling are highly dependent on the accuracy of the acquired test data. The INL BTC has developed advanced calibration verification and uncertainty analysis methodologies to ensure that the voltage, current, and temperature measurements are within the tolerance specified by the manufacturer (e.g., 0.02% of the full scale). These measured parameters are subsequently used in various mathematical combinations to determine performance capability (e.g., resistance, energy, power, etc.). INL has also quantified the error associated with these derived parameters using the accuracy and precision of the relevant measured parameter (e.g., voltage) to ensure high-quality and repeatable results.
The INL BTC capability has also been enhanced with additional equipment for advanced characterization of battery technologies. For example, in FY-13, a Ling Dynamic Systems V8-640 SPA56k shaker table was installed for vertical, longitudinal, and lateral spectrum vibrations of energy storage devices. The system is capable of displacements of 2.5 inches peak-to-peak, acceleragtions of 40 g’s, and can accommodate large format test articles. Options for safety shielding and/or installation of a thermal chamber on the shaker table for controlled vibration testing are presently under investigation.
Results
INL Testing Activities. The INL BTC continues to test articles of various sizes and configurations using standardized test protocols. Table IV - 7 and Table IV - 8 summarize the testing activities under the USABC and Benchmarking Programs, respectively, for FY-13. The purpose of the USABC testing activities is to evaluate a candidate technology against the specified targets (EV, PHEV, etc.) and, where applicable, against previous generations of test articles from the same manufacturer. The purpose of the Benchmark Program is to evaluate devices that do not have existing contracts in place, but have technologies that are of interest to DOE/USABC. In some cases, a Benchmark Program is also used to validate newly developed test procedures and analysis methodologies (e.g., the 12V Start/Stop Manual).
Table IV - 7: Testing activities under the USABC Program
Manufacturer Type # of
Articles Application
LG/CPI Cells 20 HEV
Cells 40 PHEV
Envia Cells 57 EV
K2 Cells 40 EV
Saft Cells 12 HEV
Quallion Cells 20 EV
Modules 9 EV
Maxwell Cells 15 LEESS
Entek Cells 40 PHEV
Leyden Cells 20 EV
Table IV - 8: Testing activities under the Benchmark Program
Manufacturer Type # of
Articles Application
Lishen Cells 10 EV
Axion Modules 12 HEV
Hydroquebec Cells 16 HEV
Smart Battery Modules 2 12 Volt
Start/Stop
Sanyo Cells 20 PHEV
Table IV - 9 and Table IV - 10 summarize the testing activities under the FOA-2011 and FOA-ARRA Programs, respectively, for FY-13. The FOA-2011 (i.e., 2011 Advanced Cells and Design Technology For Electric Drive Batteries awards) focuses on developing high performance cells for electric drive vehicles that significantly exceed existing technology, in regards to
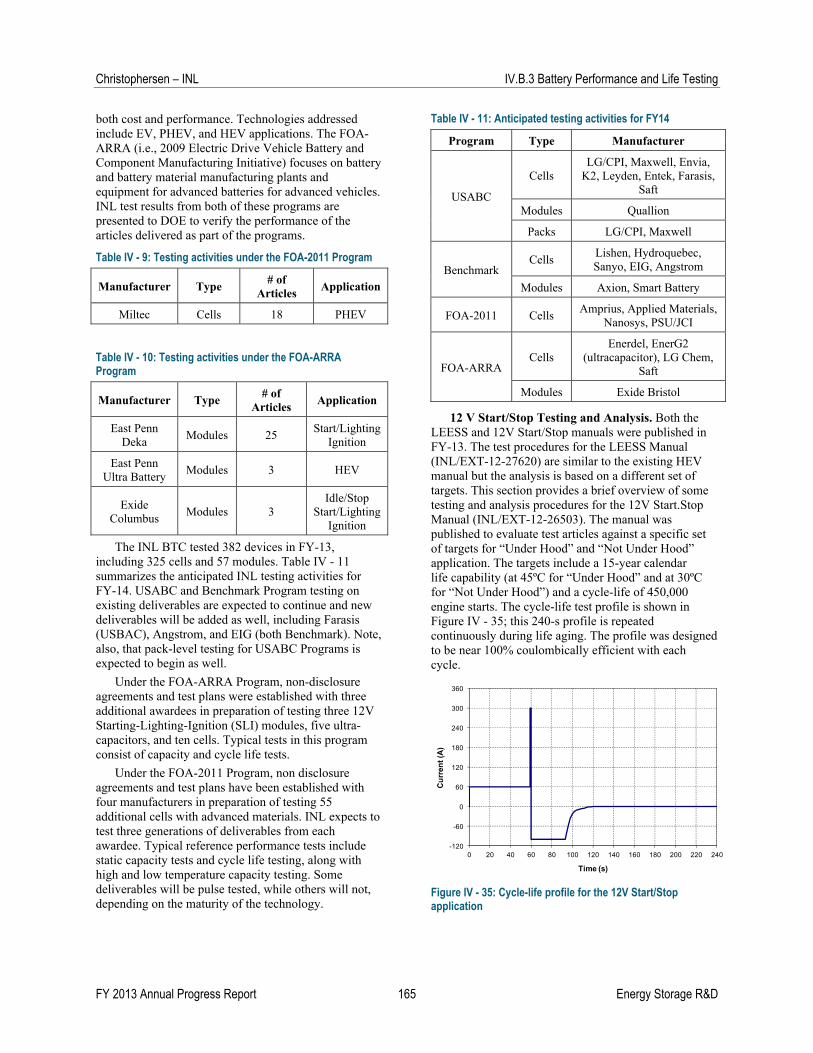
Christophersen – INL IV.B.3 Battery Performance and Life Testing
FY 2013 Annual Progress Report 165 Energy Storage R&D
both cost and performance. Technologies addressed include EV, PHEV, and HEV applications. The FOA-ARRA (i.e., 2009 Electric Drive Vehicle Battery and Component Manufacturing Initiative) focuses on battery and battery material manufacturing plants and equipment for advanced batteries for advanced vehicles. INL test results from both of these programs are presented to DOE to verify the performance of the articles delivered as part of the programs.
Table IV - 9: Testing activities under the FOA-2011 Program
Manufacturer Type # of
Articles Application
Miltec Cells 18 PHEV
Table IV - 10: Testing activities under the FOA-ARRA Program
Manufacturer Type # of
Articles Application
East Penn Deka
Modules 25 Start/Lighting
Ignition
East Penn Ultra Battery
Modules 3 HEV
Exide Columbus
Modules 3 Idle/Stop
Start/Lighting Ignition
The INL BTC tested 382 devices in FY-13, including 325 cells and 57 modules. Table IV - 11 summarizes the anticipated INL testing activities for FY-14. USABC and Benchmark Program testing on existing deliverables are expected to continue and new deliverables will be added as well, including Farasis (USBAC), Angstrom, and EIG (both Benchmark). Note, also, that pack-level testing for USABC Programs is expected to begin as well.
Under the FOA-ARRA Program, non-disclosure agreements and test plans were established with three additional awardees in preparation of testing three 12V Starting-Lighting-Ignition (SLI) modules, five ultra-capacitors, and ten cells. Typical tests in this program consist of capacity and cycle life tests.
Under the FOA-2011 Program, non disclosure agreements and test plans have been established with four manufacturers in preparation of testing 55 additional cells with advanced materials. INL expects to test three generations of deliverables from each awardee. Typical reference performance tests include static capacity tests and cycle life testing, along with high and low temperature capacity testing. Some deliverables will be pulse tested, while others will not, depending on the maturity of the technology.
Table IV - 11: Anticipated testing activities for FY14
Program Type Manufacturer
USABC
Cells LG/CPI, Maxwell, Envia,
K2, Leyden, Entek, Farasis, Saft
Modules Quallion
Packs LG/CPI, Maxwell
Benchmark Cells
Lishen, Hydroquebec, Sanyo, EIG, Angstrom
Modules Axion, Smart Battery
FOA-2011 Cells Amprius, Applied Materials,
Nanosys, PSU/JCI
FOA-ARRA Cells
Enerdel, EnerG2 (ultracapacitor), LG Chem,
Saft
Modules Exide Bristol
12 V Start/Stop Testing and Analysis. Both the LEESS and 12V Start/Stop manuals were published in FY-13. The test procedures for the LEESS Manual (INL/EXT-12-27620) are similar to the existing HEV manual but the analysis is based on a different set of targets. This section provides a brief overview of some testing and analysis procedures for the 12V Start.Stop Manual (INL/EXT-12-26503). The manual was published to evaluate test articles against a specific set of targets for “Under Hood” and “Not Under Hood” application. The targets include a 15-year calendar life capability (at 45ºC for “Under Hood” and at 30ºC for “Not Under Hood”) and a cycle-life of 450,000 engine starts. The cycle-life test profile is shown in Figure IV - 35; this 240-s profile is repeated continuously during life aging. The profile was designed to be near 100% coulombically efficient with each cycle.
Figure IV - 35: Cycle-life profile for the 12V Start/Stop application
-120
-60
0
60
120
180
240
300
360
0 20 40 60 80 100 120 140 160 180 200 220 240
Cu
rren
t (A
)
Time (s)

IV.B.3 Battery Performance and Life Testing Christophersen – INL
Energy Storage R&D 166 FY 2013 Annual Progress Report
Cycle- or calendar-life aging is periodically interrupted (i.e., approximately once a month) for RPTs to gauge overall degradation in the device under test. RPTs include a constant power discharge test and a Hybrid Pulse Power Characterization (HPPC) test. Every fourth reference test, a cold crank test at -30ºC is also included. The HPPC profile for the 12V Start/Stop application is shown in Figure IV - 36 and consists of a 1-second discharge, a 40-second rest, and a 10-s regen step having 33% of the discharge current level. The discharge current is established based on the target
engine-off accessory load (i.e., 750 W) divided by the average voltage and the cell scaling factor. This HPPC profile is repeated at each 10% DOD increment. Note, however, that in this HPPC profile, the regen step restores more capacity than is removed during the discharge step and the extra capacity restored needs to be accounted for when discharging to the next 10% depth-of-discharge increment. The HPPC test is conducted at the reference temperature, which is 30°C for “Not Under Hood” and 45°C for “Under Hood” applications.
Figure IV - 36: HPPC profile for the 12V Start/Stop application
Results from the HPPC are used to directly compare the test article performance with the established targets (e.g., 6 kW discharge pulse power capability and 360 Wh of available energy at the 750W constant power rate). Figure IV - 37 shows the HPPC pulse power capability as a function of energy removed for an example test article scaled by a battery size factor (BSF) of 2.44 (note that this BSF exactly provides a 30% power margin at beginning of life and is for calculation purposes only; the actual BSF should be an integer
value). The 10-second regen power capability (shown in the right-hand y-axis) has been scaled such that the 6 kW discharge and 2.2 kW regen power targets would align in this figure. Unlike a typical HPPC plot for HEV or PHEV applications, the discharge and regen curves do not cross over each other in the 12V Start/Stop application. This means that useable energy must be determined from the discharge pulse power capability curve.
Figure IV - 37: HPPC scaled power vs. energy for the 12V Start/Stop application
-0.5
-0.25
0
0.25
0.5
0.75
1
1.25
0 10 20 30 40 50 60
Time in Profile (s)
Cu
rren
t (r
ela
tiv
e)
DISCHARGE
REGEN
0
2000
4000
6000
8000
10000
12000
0 200 400 600 800 1000 1200
Energy (Wh X BSF)
Dis
char
ge
Po
wer
(W
X B
SF
)
0
500
1000
1500
2000
2500
3000
3500
4000
4500
5000
Reg
en
Po
wer
(W
X B
SF
)
1s Discharge Power Capability
10s Regen Power Capability
BSF = 2.44
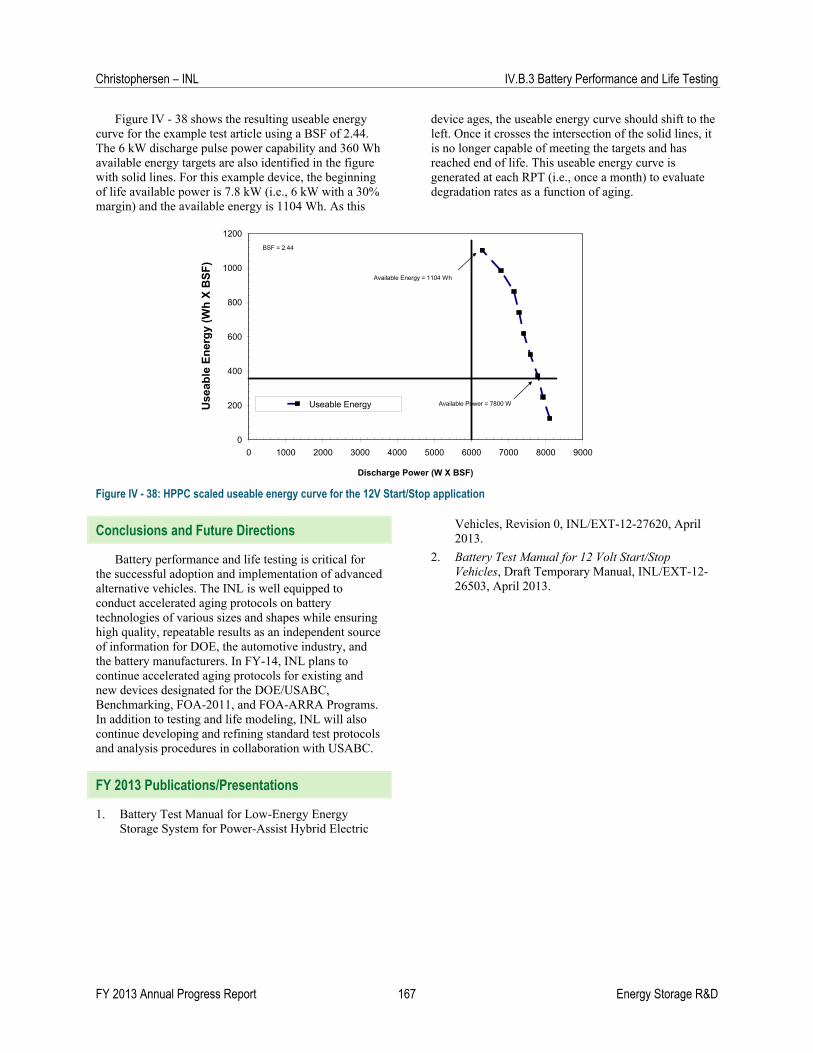
Christophersen – INL IV.B.3 Battery Performance and Life Testing
FY 2013 Annual Progress Report 167 Energy Storage R&D
Figure IV - 38 shows the resulting useable energy curve for the example test article using a BSF of 2.44. The 6 kW discharge pulse power capability and 360 Wh available energy targets are also identified in the figure with solid lines. For this example device, the beginning of life available power is 7.8 kW (i.e., 6 kW with a 30% margin) and the available energy is 1104 Wh. As this
device ages, the useable energy curve should shift to the left. Once it crosses the intersection of the solid lines, it is no longer capable of meeting the targets and has reached end of life. This useable energy curve is generated at each RPT (i.e., once a month) to evaluate degradation rates as a function of aging.
Figure IV - 38: HPPC scaled useable energy curve for the 12V Start/Stop application
Conclusions and Future Directions
Battery performance and life testing is critical for the successful adoption and implementation of advanced alternative vehicles. The INL is well equipped to conduct accelerated aging protocols on battery technologies of various sizes and shapes while ensuring high quality, repeatable results as an independent source of information for DOE, the automotive industry, and the battery manufacturers. In FY-14, INL plans to continue accelerated aging protocols for existing and new devices designated for the DOE/USABC, Benchmarking, FOA-2011, and FOA-ARRA Programs. In addition to testing and life modeling, INL will also continue developing and refining standard test protocols and analysis procedures in collaboration with USABC.
FY 2013 Publications/Presentations
1. Battery Test Manual for Low-Energy Energy Storage System for Power-Assist Hybrid Electric
Vehicles, Revision 0, INL/EXT-12-27620, April 2013.
2. Battery Test Manual for 12 Volt Start/Stop Vehicles, Draft Temporary Manual, INL/EXT-12-26503, April 2013.
0
200
400
600
800
1000
1200
0 1000 2000 3000 4000 5000 6000 7000 8000 9000
Discharge Power (W X BSF)
Use
able
En
erg
y (W
h X
BS
F)
Useable Energy
BSF = 2.44
Available Power = 7800 W
Available Energy = 1104 Wh

Energy Storage R&D 168 FY 2013 Annual Progress Report
IV.B.4 Battery Abuse Testing (SNL)
Christopher J. Orendorff, Josh Lamb, Leigh Anna M. Steele, and William A. Averill Sandia National Laboratories P. O. Box 5800, Mail Stop 0614 Albuquerque, NM 87185-0614 Phone: (505) 844-5879; FAX: (505) 844-6972 E-mail: [email protected] Collaborators: USABC Contractors/TAC Ahmad Pesearan, NREL Jon Christophersen, INL Ira Bloom, ANL Start Date: October 2012 Projected End Date: Ongoing
Objectives
Serve as an independent abuse test laboratory for DOE and USABC.
Abuse test in accordance with the USABC abuse testing manual.
Sucessful testing of all deliverables from developers under USABC contracts.
Test the propensity towards propagation of cell failure through multiple cell batteries.
Evaluate the effect of cell age on abuse response.
Technical Barriers
Abuse tolerance of energy storage devices is identified as a barrier in USABC and DOE battery development programs.
The failure modes for lithium-ion batteries are complex and need to be evaluated for all types of chemistry, design, packaging and systems for PHEV/EV applications.
Lack of understanding of how single cell or cell group failures propagate and what the primary drivers are for different battery designs.
Limited knowledge on how cell level abuse tolerance changes over the age of a cell or battery.
Technical Targets
Perform abuse testing and evaluation of cells and modules delivered from contractors to USABC.
Perform failure propagation testing and evaluation.
Characterize aged cells. Report results to DOE, the USABC, and
contractors to USABC.
Accomplishments
Successful tesing of cell and module deliverables through USABC contracts including: o K2 Energy. o SKI. o Cobasys. o Envia Systems. o Maxwell Technology.
Performed multi-cell pack propagation testing to explore the susceptibility of different battery designs and series/parallel configurations to failure propagation.
Completed the characterization of calendar aged cells to 20% power fade.
Introduction
Abuse tests are designed to determine the safe operating limits of HEV/PHEV energy storage devices. The tests are performed to yield quantitative data on cell/module/pack response to allow determination of failure modes and help guide developers toward improved materials and designs. Standard abuse tests are performed on all devices to allow comparison of different cell chemistries and designs. New tests and protocols are developed and evaluated to more closely simulate real-world failure conditions.
In scaling from the cell to the battery level, it is important to understand safety performance which includes a detailed understanding of cell interactions. Single point failures from a single cell or group of cells can be initiated by a number of triggers including an internal short circuit, misuse or abuse, or a component failure at the battery or system level. Propagation of that single failure event (regardless of the initiation trigger)

Orendorff – SNL IV.B.4 Battery Abuse Testing
FY 2013 Annual Progress Report 169 Energy Storage R&D
through an entire battery, system or vehicle is an unacceptable outcome. Our work focuses on evaluating the propagation of a single cell thermal runaway event through a battery using a variety of design considerations.
Many development efforts directed toward improving safety performance are designed and evaluated using fresh cells. However, it is important to understand how reliable a materials or design improvement will be over time or if there is a “tipping point” somewhere along the age of a battery. Our work is directed toward understanding the effects of cell age on safety performance, themal stability and abuse tolerance.
Approach
Abuse tolerance tests are performed which evaluate the response to expected abuse conditions.
Test to failure of energy storage device. Document conditions that cause failure. Evaluate failure modes and abuse conditions
using destructive physical analysis (DPA). Provide quantitative measurements of
cell/module response. Document improvements in abuse tolerance. Develop new abuse test procedures that more
accurately determine cell performance under most likely abuse conditions.
Possible tests that can be performed cover three main categories of abuse conditions:
Mechanical Abuse o Controlled crush, penetration, blunt rod,
drop, water immersion, mechanical shock and vibration.
Thermal Abuse
o Thermal stability, simulated fuel fire, elevated temperature storage, rapid charge/discharge, thermal shock cycling.
Electrical Abuse o Overcharge/overvoltage, short circuit,
overdischarge/voltage reversal, partial short circuit.
Batteries for failure propagation evaluation are based on both pouch cell and cylindrical cell designs. Pouch cell batteries are built using 3 Ah cells in either a 5-cell series (5S1P) or 5-cell parallel (1S5P) configuration. Cylindrical cell batteries are built using 2.2 Ah 18650 cells in both 10S1P and 1S10P close-packed configuration. Cell failure and thermal runaway are initiated by a mechanical nail penetration into a single cell.
Results
Battery Abuse Testing. The actual USABC testing results are Battery Protected Information and are prohibited from public release. However, representative data is shown below for an overcharge abuse test of a commercial-off-the-shelf (COTS) cell purchased on the open market.
One type of mechanical abuse test that is performed on cell deliverables is the blunt rod test, where a 3 mm diameter steel rod with a rounded tip is pressed into a cell. Figure IV - 39 shows a representative force/displacement curve for a COTS pouch cell subjected to a blunt rod test. At ~4 mm deflection, the cell package was ruptured at ~100 lbf (~450 N). Figure IV - 39 also shows a photograph of the test where the blunt rod is penetrated into the face of the pouch cell. This particular test resulted in a hard short circuit and cell thermal runaway, but did not self ignite.

IV.B.4 Battery Abuse Testing Orendorff – SNL
Energy Storage R&D 170 FY 2013 Annual Progress Report
Figure IV - 39: (top) Force/displacement curve for the blunt rod test of a COTS cell and (bottom) a still photograph of that test showing the orientation fo the blunt rod into the face of the cell
Propagation. There has been significant study of the response of single cells to field and abusive failures, however less attention has been paid to how a battery system responds to the energetic failure of a constituent cell. A single cell failure may be a relatively rare occurance, but the consequence can increase exponentially if these failures routinely propagate through the entire battery. To study this further, we have tested a series of small batteries constructed with COTS cells using 18650 as well as prismatic pouch cells.
Batteries consisting of 3 Ah pouch cells were constructed in fully parallel (1S5P) and fully series (5S1P) configurations. These were stacked together such that the largest area faces of the cells were in contact with each other and the battery tabs were all located on the same side of the pack. Failure initiation was performed on the central cell as well as the outside edge cell. In all cases the failure propagated through the entire battery within roughly the same time frame (50-60 s) and with similar runaway temperatures (600-700°C).
Batteries consisting of 2.2 Ah 18650 cells were constructed in fully parallel (1S10P) and fully series
(10S1P) orientation. The cells were placed in a close-packed configuration and the central cell failed (see Figure IV - 40). The temperature data can be seen in the figure above. The 1S10P pack showed initial propagation to cells near the failed cell soon after the initial failure, ~5 minutes after the initial failure propagation of thermal runaway surges through the remainder of the pack. The 10s1p pack showed some cells near the initial failure joining in thermal runaway; however thermal runaway did not propagate through all cells in the pack. The maximum observed temperatures were also significantly lower than in the parallel pack.

Orendorff – SNL IV.B.4 Battery Abuse Testing
FY 2013 Annual Progress Report 171 Energy Storage R&D
Figure IV - 40: Failure propagation in 1S10P (top) and 10S1P (bottom) 18650 cell batteries
An initial finding of this work shows that the impact of the electrical configuration is minimized when the cells are in strong thermal contact with one another. The prismatic pouch cells have a large area of contact with neighboring cells, allowing for efficient heat transfer during thermal runaway. The cylindrical 18650 cells, even in a close packed configuration, have a relatively limited area of contact with neighboring cells, limiting heat transfer between cells and allowing for impacts from the electrical configuration to become more pronounced.We have also partnered in this work with the battery team at NREL for modeling of cell behavior during runaway. The temperature contour profile they have developed for the 1S5P pouch cell battery during propagation of thermal runaway can be seen in the Figure IV - 41.
Figure IV - 41: NREL model showing temperature contour of 1S5P pouch cell battery during propagation of thermal runaway
Aged Cells. While significant attention has been paid to cell performance over time (capacity fade, available power, etc.) very little is known about how a cell failure, in particular thermal runaway profiles, may change over time. Moreover, with the measurable progress that has been made in cell safety and advanced materials, there is surpisingly very little data on whether or not the improvements observed at the beginning of cell life will continue to have the same positive benefit as these cells age. This is important not only in understanding cell behavior, but also in designing thermal management controls for battery systems. Since these are designed for new or fresh cells in a battery, we must understand how the runaway response may change over cell lifetime and how cell-to-cell variations in thermal response may change over time and also impact the system response.
We have previously studied COTS NMC cells aged to 20% power fade (60°C storage for approx. 60 days). Accelerating rate calorimetry (ARC) results from this work show increased variability in the thermal runaway kinetics and measureably lower onset temperatures for aged cells compared to the control population (Table IV - 12). However, results are widely variable. Fresh cells at 80% SOC were also evaluated by ARC to determine if the runaway response is controlled primarily by stored capacity. Figure IV - 42 shows representative ARC profiles for fresh cells at 100% and 80% SOC and aged cells that show 20% power and capacity fade. The higher rate runaway reaction > 225°C kinetics and total enthalpy of the aged cell and fresh cell at 80% SOC are very similar. This suggests that the higher rate reactions are less impacted by an aging mechanism (at 20% fade) and more governed by capacity. This is consistent with the fact that much of the cell age impacts the negative electrode and its interface with the electrolyte.

IV.B.4 Battery Abuse Testing Orendorff – SNL
Energy Storage R&D 172 FY 2013 Annual Progress Report
Table IV - 12: ARC Results for the COTS NMC Cells
Condition Fresh Cells Aged Cells
SEI breakdown (°C) 93 ± 8 104 ± 7
Cathode onset (°C) 240 ± 3 230 ± 6
Peak rate (°C/min) 221 ± 17 148 ± 37
Figure IV - 42: ARC profiles for a fresh cells at 100% and 80% SOC and a calendar aged cell to 20% fade (80% power retention)
Cells were also subjected to thermal abuse tests to determine if the subtle differences in the ARC response have any notable impact on abuse tolerance. Figure IV - 43 shows the heating rate of representative
fresh and 20% aged cells during a thermal abuse test. While there are some stuble differences in the onset heating rates the response of the fresh and 20% aged cells to thermal abuse are very similar.
Figure IV - 43: Cell heating rates during a thermal ramp abuse test for a fresh cell at 100% SOC and a calendar aged cell to 20% power fade
Conclusions and Future Directions
Testing has continued on larger format cells, modules, and packs for USABC cell developers. This has required careful control and monitoring of tests with the potential of high energy release. This has provided
critical information to cell developers to aid in the development of increasingly abuse tolerant cell chemistries and module designs. This independent testing is also necessary to perform objective evaluations of these various designs and chemistries by the DOE and U.S. automobile manufacturers. Testing

Orendorff – SNL IV.B.4 Battery Abuse Testing
FY 2013 Annual Progress Report 173 Energy Storage R&D
will continue in FY 14 on new module and cell designs from USABC contractors.
Initial work on failure propagation highlights the contributions of battery design, cell format, and configuration to the ability of a single point failure to propagate through a battery. Future work on this project includes evaluating different cell chemistries, passive design changes, and active temperature management. We will also continue to work with our colleagues to model this failure propagation behavior in order to develop a predictive design capability.
Cells calendar-aged to 20% power fade show some measureable changes abuse response kinetics, but very little impact on total runaway enthalpy or any significant performance changes to thermal insult. Future directions for the aged cell abuse response work includes evaluating cells at 20% cycle life fade and comparing cell performance to the fresh cell control population and the calendar aged cells to 20%. In addition, we will study cells that were aged for longer periods of time (>30% fade) and study different cell chemistries to determine the chemistry effect on aging mechanisms.
FY 2013 Publications/Presentations
1. USABC TAC, November 2012.
2. C. J. Orendorff, J. Lamb, K. R. Fenton, and L. A. M. Steele, “Approaches to Evaluating and Improving Lithium-Ion Battery Safety” AABC February 2013.
3. C. J. Orendorff, “Approaches to Evaluating and Improving Lithium-Ion Battery Safety” CU-Boulder, February 2013.
4. USABC TAC, Februrary 2013.
5. USABC TAC, May 2013.
6. USABC TAC, August 2013.
7. J. Lamb, C. J. Orendorff, J. Power Sources 247 (2014) 189-196. “Evaluation of mechanical abuse techniques in lithium ion batteries.”

Energy Storage R&D 174 FY 2013 Annual Progress Report
IV.B.5 Battery Thermal Analysis and Characterization Activities (NREL)
Matt Keyser National Renewable Energy Laboratory 15013 Denver West Parkway Golden, CO 80401 Phone: (303) 275-3876; Fax: (303) 275-4415 E-mail: [email protected] Collaborators: Dirk Long, John Ireland, Shriram Santhanagopalan, GM, Ford, Chrysler, USABC Start Date: October 1, 2009 Projected End Date: Ongoing
Objectives
Thermally characterize battery cells and evaluate thermal performance of battery packs provided by USABC developers.
Provide technical assistance and modeling support to USDRIVE/USABC and developers to improve thermal design and performance of energy storage systems.
Quantify the impact of temperature and duty-cycle on energy storage system life and cost.
Technical Targets
Battery operating temperature from -30°C to 52°C.
Develop a high-power battery technology exceeding 300,000 shallow HEV cycles.
15-year calendar life at 30°C.
Accomplishments
Obtained cells from various USABC battery partners including Actacell, Cobasys, Johnson Controls Incorporated (JCI), Quallion, LGCPI, and SK Innovation.
Obtained infrared thermal images of cells provided by USABC battery developers and identified any areas of thermal concern.
Used NREL's unique calorimeters to measure heat generation from cells and modules under various charge/discharge profiles.
Obtained thermal and electrical performance data of cells under HEV, PHEV, and EV power profiles.
Evaluated thermal performance of a PHEV pack.
Presented results of cell thermal characterization and pack thermal evaluation at USABC/battery developer review meetings.
Introduction
Operating temperature is critical in achieving the right balance between performance, cost, and life for both Li-ion batteries and ultracapacitors. At NREL, we have developed unique capabilities to measure the thermal properties of cells and evaluate thermal performance of battery packs (air- or liquid-cooled). We also use our electro-thermal finite element models to analyze the thermal performance of battery systems in order to aid battery developers with improved thermal designs.
Approach
Using NREL’s unique calorimeters and infrared thermal imaging equipment, we obtain thermal characteristics (heat generation, heat capacity, and thermal images) of batteries and ultracapacitors developed by USABC battery developers and other industry partners. NREL supports the Energy Storage Technical Team by participating in various work groups such as the Actacell, Cobasys, JCI, LGCPI, Quallion, and SK Innovations Work Groups.
Results
NREL’s Calorimeter Development leads to R&D 100 Award. Advanced energy storage devices, such as lithium-based batteries, are very sensitive to operating temperatures. High temperatures degrade batteries faster and pose safety hazards, while low temperatures decrease power and capacity. The Isothermal Battery Calorimeters (IBCs) developed by NREL are the only calorimeters in the world capable of performing the precise thermal measurements needed to make safer, longer-lasting, and more cost-effective batteries for the next generation of electric-drive vehicles (EDVs).
Recently recognized with an R&D 100 Award, the IBCs are the most accurate devices of their kind—able to determine heat levels and battery energy efficiency with 98% accuracy. The IBCs make it possible to precisely measure the heat generated by EDV batteries,

Keyser – NREL IV.B.5 Battery Thermal Analysis and Characterization Activities
FY 2013 Annual Progress Report 175 Energy Storage R&D
analyze the effects of temperature on battery systems, and pinpoint ways to manage temperatures for the best performance and maximum life.
Capable of testing a wide size range of samples, the calorimeters can determine the heat generated by battery cells, modules, sub-packs, and even some full-size packs. The IBCs also evaluate system heat generation, from the individual cells within a module, the inter-connects between the cells, and the entire battery system.
The cell/module version of the IBC has the capacity to test more than 95% of EDV energy storage cells and small modules. The IBCs can also be used to test a variety of cell formats (i.e., pouch, cylindrical, and prismatic), while most other calorimeters on the market are limited to a single format.
The incredible precision of the IBCs can be attributed to patent-pending features that deliver total thermal isolation and highly sensitive temperature readings across a wide range of conditions. NREL has licensed the IBC technology to NETZSCH Instruments North America, LLC., a leading provider of thermal analysis instruments, for commercial production and distribution. The commercially-available IBC-284 being developed by NETZSCH and NREL is shown in Figure IV - 44.
Figure IV - 44: NETZSCH IBC-284
Calorimeter Testing. Figure IV - 45 shows the efficiency of cells tested in FY12/FY13 at NREL. The lithium-ion cells were fully discharged from 100% to 0% SOC under C/2, C/1, and 2C currents. It should be noted that the cells in the figure represent both power and energy cells, and have been developed for the HEV, PHEV, EV, or Low Energy Energy Storage System (LEESS) programs with USABC. The figure shows that most of the lithium-ion cells, A-J, are very efficient over this cycling regime—typically greater than 93%. The range of efficiencies at a 2C discharge rate is between 93% and 97%. A 4% difference in efficiency may not appear to be of concern; however, if one considers a 50 kW pulse from the battery in an electrified advanced vehicle, then a 1% difference in efficiency results in an additional 500 Watts of heat for the pulse duration—taking the example farther, a 4% difference results in 2,000 Watts of additional heat. The efficiency differences between the cells will require the thermal management system to be tailored to the cell thermal characteristics so as not to affect cell cycle life.

IV.B.5 Battery Thermal Analysis and Characterization Activities Keyser – NREL
Energy Storage R&D 176 FY 2013 Annual Progress Report
Figure IV - 45: Efficiency of cells tested at 30°C in NREL’s calorimeter during FY12/FY13
Figure IV - 46 compares the efficiency of a Gen 2 and a Gen 3 cell from the same manufacturer. The cells were discharged under a constant current from 100% to 0% SOC. The efficiency of the Gen 3 cell is slightly below the efficiency its predecessor, the Gen 2 cell, indicating that from an efficiency perspective, the cell design has not improved. However, cells are not typically used over their full capacity range due to life cycle limitations of the cell. In this particular case, the cells will be used from approximately 70% to 30%
SOC. Figure IV - 47 compares the efficiency of the Gen 2 and Gen 3 cells over this usage range. As can be seen from the figure, the efficiencies of the two cells are fairly well matched. Battery manufacturers use the data from the calorimeter to ensure that the cell has the desired efficiency over the usage range while making trade-offs on other aspects of the cell design such as low temperature operation, safety, cost, and ease of manufacturing.
Figure IV - 46: Efficiency of two generations of cells tested at 30°C from 100% to 0% SOC

Keyser – NREL IV.B.5 Battery Thermal Analysis and Characterization Activities
FY 2013 Annual Progress Report 177 Energy Storage R&D
Figure IV - 47: Efficiency of two generations of cells tested at 30°C from 70% to 30% SOC
Figure IV - 48 shows the entropic heat signature of the cell with regards to temperature. The battery in this figure was cycled from 0% to 100% SOC at a very low current. A low current is used to limit the ohmic heating within the cell. As shown in the figure, the battery undergoes endothermic and exothermic heat generation over the cycling range. The figure also shows how temperature affects the entropic signature of the battery during operation—the battery is endothermic at the beginning of the charge for all temperatures above 15°C. Furthermore, the data indicates that the ohmic
losses in the cell dominate at temperatures below 0°C. A closer look at the graph indicates inflection points that correspond to phase changes occurring within the cathode or anode during cycling. Knowing where these phase transitions occur allows the manufacturers and OEMs to cycle their battery outside of these areas so as to increase the cycle life of the battery. Measuring the phase transition requires an extremely accurate calorimeter with a very stable baseline that only NREL’s calorimeters can provide for these large format cells.
Figure IV - 48: Efficiency of two generations of cells tested at 30°C from 70% to 30% SOC
Infrared Imaging. NREL performs infrared (IR) imaging of battery manufacturers’ cells to determine areas of thermal concern. NREL combines the IR imaging equipment with a battery cycler to place the
cells under various drive cycles, such as the US06 charge-depletion cycle for a PHEV, to understand the temperature differences within the cell. We then make recommendations to the battery manufacturers and

IV.B.5 Battery Thermal Analysis and Characterization Activities Keyser – NREL
Energy Storage R&D 178 FY 2013 Annual Progress Report
USABC on how to improve the thermal design of the cell to increase its cycle life and safety.
Figure IV - 49 and Figure IV - 50 show the thermal images of two PHEV cells from different manufacturers at the end of a constant current discharge—the Ah capacities of the cells are within 5% of one another. Each figure contains a thermal image of the cell at the end of the constant current discharge, as well as a plot indicating the horizontal contour lines across the face of the cell—L01, L02, L03, and L04. Figure IV - 49 shows a hot spot in the upper right corner of the cell as well as
a wide spread in temperature across the face of the cell from top to bottom and left to right. Figure IV - 50, on the other hand, shows a very uniform temperature distribution across the face of the cell at the end of discharge. When the cell temperature is uniform and consistent, all areas within the cell age at the same rate, leading to better cycle life. NREL is working with battery developers to understand how these temperature non-uniformities affect the efficiency and cost of the cell over its life.
Figure IV - 49: Thermal image of a cell from manufacturer A under constant current discharge from 100% to 0% SOC

Keyser – NREL IV.B.5 Battery Thermal Analysis and Characterization Activities
FY 2013 Annual Progress Report 179 Energy Storage R&D
Figure IV - 50: Thermal image of a cell from manufacturer B under constant current discharge from 100% to 0% SOC
Pack Thermal Studies. In FY13, NREL evaluated air-, liquid-, and vapor compression-cooled packs for USABC battery developers. We measured the temperature rise and difference between corresponding cells, as well as the voltage of each cell within the pack. Testing is performed at temperatures between -20°C and 30°C with drive cycles pertinent for the battery under test—PHEV or EV. It has been shown that a 2-3% difference in cell temperature can have a 2-3% effect on fuel economy. The higher temperature cells within a pack are also typically more efficient and, therefore, work harder than the cells at lower temperatures—higher temperature cells typically provide more power. If different cells within the pack provide different amounts of energy over time, then the cells age
differently and may cause imbalances within the pack, resulting in possible warranty issues.
Figure IV - 51 shows the average cell temperature in a pack with the cooling system on and off. The pack underwent a US06 charge-depletion cycle followed by a US06 charge-sustaining cycle. The difference in temperature at the end of the charge-depletion cycle between the cooling and no-cooling case is about 1°C. The negligible change in temperature is due to the high thermal impedances between the cooling system and where the heat in the cell is generated. The coefficient of performance (COP) of the cooling system is on the order of 0.10. We are working with the battery manufacturers and OEMs to improve the temperature uniformity of the cells within a pack and the effectiveness of the thermal management system.

IV.B.5 Battery Thermal Analysis and Characterization Activities Keyser – NREL
Energy Storage R&D 180 FY 2013 Annual Progress Report
Figure IV - 51: Average cell temperature in a pack with and without cooling; the pack underwent a US06 CD cycle followed by a US06 CS cycle.
Conclusions and Future Directions
NREL has thermally tested cells, modules, and/or packs from Actacell, Cobasys, LGCPI, Johnson Controls, Quallion, K2, and SK Innovation. We’ve provided critical data to the battery manufacturers and automotive OEMs that can be used to improve the design of cells, modules, and packs, and their respective thermal management systems. The data included heat generation of cells under typical profiles for HEV, PHEV, and EV applications. We found that the majority of the cells tested had a thermal efficiency greater than 93% when cycled under a 2C constant current discharge. During thermal imaging of the cells, we identified areas of thermal concern and helped the battery manufacturers with the electrical design of their cells. Finally, we evaluated multiple packs during FY13 and determined that all aspects of the design need to be
evaluated for the best thermal performance of the pack and the longest life.
In FY14, NREL will continue to thermally characterize cells, modules, and packs for USABC and DOE.
FY 2013 Publications/Presentations
1. Thermal data was shared with the Energy Storage Tech Team and each of the individual battery manufacturers’ work groups.
2. March 2013 DOE Milestone Report, “Thermal Analysis and Characterization of Advanced Lithium-Ion Batteries.”
3. September 2013 DOE Milestone Report, “Thermal Analysis and Characterization of Advanced Lithium-Ion Batteries and Packs.”

FY 2013 Annual Progress Report 181 Energy Storage R&D
IV.B.6 Development of an On-Demand Internal Short Circuit (NREL)
Matt Keyser National Renewable Energy Laboratory 15013 Denver West Parkway Golden, CO 80401 Phone: (303) 275-3876; Fax: (303) 275-4415 E-mail: [email protected] Collaborators: Dirk Long, John Ireland, NASA, Dow Kokam, E-One Moli, Leyden Start Date: October 2009 Projected End Date: September 2014
Objectives
The objective of this effort is to establish an improved internal short circuit (ISC) cell-level test method that:
1. Replicates a catastrophic field failure due to latent flaws that are introduced during manufacturing.
2. Demonstrates the capability to trigger all four types of cell internal shorts.
3. Produces consistent and reproducible results. 4. Allows the cell to behave normally until the
short is activated—the cell can be aged before activation.
5. Establishes test conditions for the cell—SOC, temperature, power, etc.
6. Provides relevant data to validate ISC models.
Technical Targets
It is critical for any new vehicle technology (including advanced energy storage systems) to operate safely under both routine and abuse conditions, which can include conditions of high temperature, overcharge, or crush. Lithium-ion cells need to be tolerant of internal short circuits.
Accomplishments
USABC/NREL continues to make progress towards the development of an on-demand internal short circuit for lithium-ion batteries.
Our internal short circuit emulator does not affect the performance of the battery under test
and can be activated without puncturing or deforming the battery.
The NREL ISC emulator was improved and successfully tested in cylindrical 18650 cells and a large format pouch cell.
Introduction
Battery safety is the key to widespread acceptance and market penetration of electrified vehicles into the marketplace. NREL has developed a device to test one of the most challenging failure mechanisms of lithium-ion (Li-ion) batteries—a battery internal short circuit.
When battery internal shorts occur, they tend to surface without warning and usually after the cell has been in use for several months. While some failures simply result in the cells getting very hot, in extreme cases cells go into thermal runaway, igniting the device in which they are installed. The most publicized failures involved burning laptop batteries, and resulted in millions of recalls, as well as consumer injuries and lawsuits.
Many members of the technical community believe that this type of failure is caused by a latent flaw that results in a short circuit between electrodes during use. As electric car manufacturers turn to Li-ion batteries for energy storage, solving these safety issues becomes significantly more urgent.
Due to the dormant nature of this flaw, battery manufacturers have found it difficult to precisely identify and study it. NREL’s device introduces a latent flaw into a battery that may be activated to produce an internal short circuit. NREL uses the internal short circuit device to better understand the failure modes of Li-ion cells and to validate NREL’s abuse models.
The device can be placed anywhere within the battery, and can be used with both spirally-wound and flat-plate cells containing any of the common Li-ion electrochemistries. Producing a true internal short, the device is small compared to other shorting tools being developed by the industry, and does not rely on mechanically deforming the battery to activate the short, as do most other test methodologies. With the internal short in place, the battery can be used and cycled within normal operating conditions without activating the internal short device. This allows the battery to be aged prior to activation.
The internal short produced by NREL’s device is consistent and is being developed as an analysis tool for

IV.B.6 Development of an On-Demand Internal Short Circuit Keyser – NREL
Energy Storage R&D 182 FY 2013 Annual Progress Report
battery manufacturers and other national laboratories as well as OEMs. This has broad-reaching applications as automakers bring electrified vehicles to market in larger numbers.
Approach
NREL conceptualized and initiated laboratory testing of an internal short that has an insulating wax layer that is wicked away by the battery separator once the melting point of the wax is reached. A graphical representation of the ISC concept is shown in Figure IV - 52.
Figure IV - 52: ISC schematic (not to scale)
A unique feature of NREL’s internal short device is that it has the ability to simulate all four types of shorts within a battery: 1) cathode active material to anode active material, as shown in Figure IV - 53; 2) cathode active material to anode current collector; 3) cathode current collector to anode active material; and 4) cathode current collector material to anode current collector, as shown in Figure IV - 53. Furthermore, the resistance of the short can be tuned to simulate a hard (more energetic) or soft (less energetic) short. Once the
short is activated, the positive and negative components of the battery are internally connected within the cell and an internal short circuit begins.
Results
In FY12, NREL developed a spin coating apparatus to evenly distribute a thin layer of wax across the aluminum disc of the ISC. We performed design experiments on wax type, wax mixture, spin temperature, spin coating speed, amount of wax, and duration of spin coating. After several months of testing and modifying the various input parameters, we were able to attain a uniform coating of wax, approximately 15 μm thick, where the copper puck contacts the wax surface. The thin coating was then tested to determine how much pressure could be applied to the wax without such activation. The pressure tests showed that the ISC could withstand pressures exceeding 780 psi without premature activation, and, using this data, we developed a go/no-go gauge for the ISCs to be placed in cells. Finally, we reduced the burrs on the metal components of the ISC through manufacturing improvements—we did not want to accidently introduce a flaw into the battery that would generate an unwanted internal short.
During FY13, NREL took the improved ISC and incorporated all four types of shorts in an 8 Ah Dow Kokam cell (prismatic stacked pouch). Figure IV - 54 shows the device implanted in the DK 8 Ah pouch cell.
Figure IV - 55 shows the voltage response to all four types of activated ISCs within the DK cell at 10% SOC. NREL’s previous modeling indicated that different types of shorts should exhibit different voltage and temperature responses within the cell. In particular, the cathode and anode materials for most lithium cells have high impedances as compared to the aluminum or copper electrode/collector material. Thus, if the active material is part of the ISC circuit, then the voltage should decay slowly or act as a “soft” short. If there is an aluminum collector to copper collector internal short, then the voltage should drop precipitously, or act as a “hard” short. Figure IV - 55 confirms NREL modeling data, showing that the collector to collector (Al-Cu) short is the most severe.

Keyser – NREL IV.B.6 Development of an On-Demand Internal Short Circuit
FY 2013 Annual Progress Report 183 Energy Storage R&D
Figure IV - 53: Cathode-to-anode ISC (top) and collector-to-collector ISC (bottom) (not to scale)
Figure IV - 54: ISC placed in DK 8 Ah cell; note the actual diameter of the short (Cu puck) is 0.125
Figure IV - 55: Voltage response to various ISC activations in DK 8 Ah pouch cell at 10% SOC

IV.B.6 Development of an On-Demand Internal Short Circuit Keyser – NREL
Energy Storage R&D 184 FY 2013 Annual Progress Report
The collector to collector short, however, only lasted about 50 ms. In order to understand why the voltage recovered after activation, NREL performed a destructive physical analysis (DPA) of the cell. The DK 8 Ah cell has multiple cathode and anode plates stacked in parallel. The ISC is in contact with only one set of these anode/cathode plates. When the ISC is activated, the remaining anode and cathode plates supply current through the aluminum (cathode) and copper (anode) tabs on the plates in contact with the ISC. The individual tabs are not meant for these high
currents. In particular, the aluminum tab has a higher electrical resistance than the copper tab and acts as a fuse. Figure IV - 56 shows a macro image of the melted aluminum tab in question. Once the tab experienced a higher than normal current, the aluminum melted and prevented the current from flowing from the adjacent cathode plates to the ISC, effectively isolating the short circuit.
Figure IV - 56: Melted aluminum tab in DK 8 Ah cell upon activation of collector-to-collector ISC
NREL also performed a number of tests with the 8 Ah DK cells at 100% SOC with variable success. When an ISC is activated, gas generation quickly results. The underlying problem is that the pouch material acts as a balloon when pressurized and prevents the electrical components within the ISC from continuing to make contact. In order to maintain contact with the ISC, we experimented with placing the pouch cell between two rigid aluminum plates, as typically occurs within a battery pack. Initial tests of this type of setup (and others) were positive, and NREL is presently assessing how these new tests work with a larger sample set.
In FY12, NREL showed good progress when combining the ISC with an E-One Moli 18650 cell. In FY13, NREL used these cells to assess if the ISC affected the performance of the cell during cycling and how safety features incorporated into the cell were affected by the type of short. NREL placed a collector-to-collector (Type 4) short and aluminum-to-anode (Type 2) short into the E-One Moli 18650 cell with the standard shutdown separator (PP/PE/PP). The tests on both types of shorts were performed at 100% SOC.
Twenty cells were fabricated for the test—10 cells with a Type 4 ISC and 10 cells with a Type 2 ISC. All 20 cells successfully went through formation and were put through 20 full discharge cycles consisting of a C/2 discharge cycle, a C/10 discharge cycle, and eighteen C/1 discharge cycles. We achieved nominal cycle stability for all 20 cells.
Table IV - 13 shows the Type 4 ISC activation results—7 out of 10 of the ISCs activated when the cell’s temperature was brought to the melting point of the wax at 57°C. Of the seven ISCs that activated, one of the cells went into thermal runaway. Figure IV - 57 shows a plot of the cell temperature after activation of the Type 4 ISC. Cell #2 was the only cell to go into thermal runaway and achieved a maximum temperature of about 710°C. In the remaining six cells, the shutdown separator activated and prevented the cells from going into thermal runaway. The maximum temperature that each of these cells attained was around 120°C, which is the melting point of the polyethylene component of the shutdown separator.

Keyser – NREL IV.B.6 Development of an On-Demand Internal Short Circuit
FY 2013 Annual Progress Report 185 Energy Storage R&D
Table IV - 13: Results from Type 4 ISC implantation in 10 E-One Moli 18650 cells
Figure IV - 57: Temperature response to Type 4 ISC (aluminum-to-copper) implantation in E-One Moli 18650 cells
Table IV - 14 shows the Type 2 ISC activation results—8 out of 10 of the ISCs activated when the cell’s temperature was brought to the melting point of the wax at 57°C. Of the eight ISCs that successfully activated, six of the cells went into thermal runaway. Figure IV - 58 shows a plot of the cell temperature after activation of the Type 2 ISC. The maximum temperature attained by the six cells that went into thermal runaway was between 675°C and 775°C. In the remaining two cells, the shutdown separator activated and prevented the cells from going into thermal runaway.

IV.B.6 Development of an On-Demand Internal Short Circuit Keyser – NREL
Energy Storage R&D 186 FY 2013 Annual Progress Report
Table IV - 14: Results from Type 2 ISC implantation in 10 E-One Moli 18650 cells
Figure IV - 58: Temperature response to Type 2 ISC (aluminum-to-anode) implantation in E-One Moli 18650 cells
From previous test results at lower SOCs, NREL determined that the Type 4 ISC was the most severe, but this appears to be a benefit when a shutdown separator is incorporated into the cell. The Type 4 ISC results in the quickest temperature rise within the cell and causes more of the separator to shutdown faster. In contrast, a Type 2 ISC is more resistive than a Type 4 ISC due to the electrical resistance of the anode. The higher resistance initially delays the temperature rise within the cell and allows for more of the cell’s energy to be dissipated through the ISC—the higher energy eventually overwhelms the separator and allows the cell to go into thermal runaway.
Conclusions and Future Directions
In summary, our goal was to develop an ISC that:
1. Is small, with a low profile, which can be implanted into a Li-ion cell, preferably during assembly.
2. Is triggered by heating the cell above the melting temperature of the phase change material (wax).
3. Can handle currents in excess of 200 amps; this has already been proven in laboratory testing.
4. Has impedance that is consistent and can be selected to simulate a hard or soft short.
5. Can short between any of the battery components within a cell.
NREL’s ISC is the only ISC in development that can be used selectively to connect different components (anode, cathode, aluminum current collector, and copper current collector) within a cell. When different components within a cell are connected, there should

Keyser – NREL IV.B.6 Development of an On-Demand Internal Short Circuit
FY 2013 Annual Progress Report 187 Energy Storage R&D
and will be different outcomes. For instance, directly connecting the anode and cathode within a cell is much less likely to lead to thermal runaway than connecting the aluminum and copper current collectors. The end goal is not to send the cell into thermal runaway when activating the ISC, but to accurately simulate an emergent short.
The internal short device can be used to determine how changes to the battery affect the safety of the battery, either positively or negatively. Furthermore, the internal short can be used as a test methodology to evaluate how a battery would react to a latent defect.
NREL hopes to have the opportunity to continue researching how the type of internal short affects the performance of safety devices incorporated into lithium-ion cells. In the future, NREL hopes to use the ISC to verify the abuse models being developed by battery manufacturers and other national laboratories.
FY 2013 Publications/Presentations
1. 2013 NASA Aerospace Battery Workshop, Alabama.
2. 2013 DOE Milestone Report titled, “Evaluate NREL Improved Version of Internal Short-Circuit Instigator in Large Cells.
3. Presented concept to Underwriter’s Laboratory and USABC ISC working groups.
4. Battery Safety Conference 2013, San Diego, CA.
Energy Storage R&D 188 FY 2013 Annual Progress Report
IV.C Computer Aided Engineering for Batteries
IV.C.1 Computer Aided Engineering for Batteries (NREL)
Ahmad Pesaran National Renewable Energy Laboratory 15013 Denver West Parkway Golden, CO 80401 Phone: (303) 275-4441; Fax: (303) 275-4415 E-mail: [email protected] Collaborators: G.H. Kim, K. Smith, S. Santhanagopalan, NREL S. Pannala, J. Turner, ORNL Subcontract Teams: GM, ANSYS, and ESim EC Power, Ford, JCI, and PSU CD-adapco, Battery Design, JCI, and A123 Start Date: April 2010 Projected End Date: September 2015
Objectives
The overall objective of the Computer Aided Engineering of Batteries (CAEBAT) project is to develop electrochemical-thermal software tools for design and simulation of performance, life, and safety of electric drive vehicle (EDV) batteries. As part of this effort, the NREL objectives are:
Coordinate the activities of CAEBAT for DOE.
Develop battery modeling tools to enhance understanding of battery performance, life, and safety, to enable development of cost-effective batteries for electric drive vehicles.
Collaborate with Oak Ridge National Laboratory (ORNL) in the development of an Open Architecture Software (OAS) platform to link material and battery models developed under DOE Energy Storage R&D.
Disseminate project results to the public and promote collaboration on modeling and software tools within the automotive battery community.
Technical Barriers
Cost, life (calendar and cycle), high performance at all temperatures, and safety are
barriers for widespread adoption of lithium-ion batteries in EDVs.
Large investment and long lead time in cell and pack research, design, prototyping, and test cycle—and repeating the design-build-test-break cycle many times over several iterations—increases production costs.
Lack of advanced computer-aided engineering tools to quickly design and simulate battery packs for EDVs impedes the optimization of cost-effective solutions.
Technical Targets
Develop suites of software tools that enable automobile manufacturers, battery developers, pack integrators, and other end users to design and simulate cells and battery packs in order to accelerate the development of energy storage systems that meet EDV requirements.
Accomplishments
In mid FY11, after a competitive procurement process, NREL entered into subcontract agreements with three industry-led teams to develop CAEBAT tools with 50-50 cost sharing.
Three subcontract teams started the technical work in July 2011: o CD-adapco (teamed with Battery Design
LLC, Johnson Controls-Saft and A123 Systems); NREL technical monitor: Kandler Smith.
o EC Power (teamed with Pennsylvania State University, Johnson Controls Inc., and Ford Motor Company); NREL technical monitor: Shriram Santhanagopalan.
o General Motors (teamed with ANSYS and ESim); NREL technical monitor: Gi-Heon Kim.
In FY13, NREL continued to monitor the technical performance of the three subcontract teams through monthly conference calls, quarterly review meetings, and annual reports with DOE/HQ; quarterly review meetings took place at subcontractor sites, NREL, and DOE/HQ.

Pesaran – NREL IV.C.1 Computer Aided Engineering for Batteries
FY 2013 Annual Progress Report 189 Energy Storage R&D
The three subcontractors have already delivered the first version of their software tools to end users, and are on track to deliver software tools to the industry by the end of their period of performance (specific progress for each subcontract is provided in Sections IV.C.3 – IV.C.5 of this report).
The following are major accomplishments from each team in FY13: o CD-adapco delivered the overall modeling
framework, both electrochemical and thermal, for spirally-wound cells in the computer-aided engineering tool STAR-CCM+; JCI validated the model.
o EC Power developed and delivered improved versions of ECT3D software to Ford, JCI, and NREL for evaluation, and performed localized current distribution measurement in large-format cells for model validation.
o GM and ANSYS delivered the first battery pack-level software tool to team members for evaluation; the team also completed validation of the tool with electrochemical-thermal testing of a 24-cell module.
NREL collaborated closely with ORNL on evaluation of elements of the OAS, such as Battery Input and Battery State (specific progress for ORNL’s work is provided in Section IV.C.2 of this report).
NREL continued its electrochemical-thermal modeling of cells through the multi-physics, multi-scale, multi-domain (MSMD) platform for CAEBAT (this activity is further discussed in Section IV.C.6 of this report); particularly, NREL: o Developed the Discrete Particle Diffusion
Model (DPDM) as an advanced option for the MSMD particle domain model
o Solved solid-phase lithium diffusion dynamics and transfer kinetics in a discrete diffusion particle system with the DPDM
Introduction
In April of 2010, DOE announced a new program activity called Computer-Aided Engineering of Electric
Drive Vehicle Batteries (CAEBAT) to develop software tools for battery design, R&D, and manufacturing. The objective of CAEBAT was to incorporate existing and new models into battery design suites/tools with the goal of shortening design cycles and optimizing batteries (cells and packs) for improved performance, safety, life, and cost. The work would address the existing practices under which battery and pack developers operated—tediously experimenting with many different cell chemistries and geometries in an attempt to produce greater cell capacity, power, life, thermal performance and safety, and lower cost. Introducing battery simulations and design automation at an early stage in the battery design life cycle, would make it possible to significantly reduce product cycle time and cost, thus significantly reducing the cost of the battery. Despite extensive modeling efforts at national laboratories, universities, private companies, and other institutions to capture the electrochemical performance, life, thermal profile, and cost of batteries, including NREL’s development of an electrochemical-thermal model of lithium-ion cells with three-dimentional geometries, these tools were not integrated with a 3-D computer-aided engineering approach, which automotive engineers routinely use for other components. In many industries, including those involved in automotive and combustion engine development, CAE tools have been proven pathways to:
Improve performance by resolving relevant physics in complex systems;
Shorten product development design cycles, thus reducing cost; and
Provide an efficient manner for evaluating parameters for robust design.
DOE initiated the CAEBAT project to extend these improvement pathways to battery CAE tools to the benefit of the entire industry. The CAEBAT project is broken down into four elements, as shown in Figure IV - 59:
Material- and component-level models (developed under the BATT and ABR program elements of DOE Energy Storage R&D).
Cell-level models. Pack-level models. Open architecture software to interface and
link all models, particularly those from national labs

IV.C.1 Computer Aided Engineering for Batteries Pesaran – NREL
Energy Storage R&D 190 FY 2013 Annual Progress Report
Figure IV - 59: Four Elements of the Computer-Aided Engineering for Batteries (CAEBAT) Activity
Since the goal of CAEBAT is to develop suites of software tools for automobile manufacturers, battery developers, pack integrators, and other end users, involvement of the industry (car makers, battery developers, and pack integrators) in the CAEBAT activity, particularly for Elements 2 and 3 (development of cell and pack models), is essential. DOE’s major strategy to address this was to solicit active participation of industry partners in the development of cell and pack software tools from the beginning of the project.
To oversee the successful execution of the CAEBAT program, DOE designated NREL as the overall project coordinator, with the project tasks divided as follows:
Cell-Level Modeling and Pack-Level Modeling: performed by industry, national laboratories, and academia; coordinated by NREL
Open Architecture Software: performed by national laboratories; coordinated by ORNL
In order to engage serious involvement of the industry, NREL, with guidance from DOE, issued a Request for Proposals (RFP) in FY10 for the development of cell and pack battery design tools over a period of three years with 50-50% cost sharing. Teams led by CD-adapco, GM, and EC Power were awarded subcontracts, and the technical work began in July 2011. Additionally, NREL continued development and improvement of 3D electrochemical-thermal models, and collaborated with ORNL on development of open architecture software.
Results
Subcontracts with Industry. Significant progress has been reported by each subcontractor, according to each team’s statement of work, and initial versions of their software tools have been released. More details on GM’s progress may be found in Section IV.C.3 of this report. CD-adapco’s progress is described in Section IV.C.4. Finally, Section IV.C.5 provides details on the progress made by EC Power. A summary of major
accomplishments for each subcontractor is provided below.
CD-adapco.
The project has now delivered the overall modeling framework, both electrochemical and thermal, in the computer-aided engineering tool STAR-CCM+, produced by CD-adapco, Figure IV - 60.
An enhanced electrochemistry model has now been created; this model has been significantly extended to include the effect of concentration dependence of the solid-phase diffusion coefficient and also multiple active materials, as often found in contemporary lithium-ion cell design.
Electrochemical and thermal datasets have been created and validated within the project for spiral cells; these have been created after the provision of cell-specific data from Johnson Controls, Saft; a process to extract unknown electrochemical properties from specific test work has been developed.
The electrochemistry model and resultant datasets have been implemented in STAR-CCM+; this implementation allows the use of parallel computations within the electrochemistry model.
A dataset of contemporary electrolytes modeled by Idaho National Labarotory (INL) has been added to the simulation environment; the dataset contains molarity, conductivity, diffusion coefficient, transport number, activity coefficient, density, and viscosity for twelve electrolyes.
An approach to simulate aging within lithium-ion cells has been formulated, which considers SEI layer growth and associated capacity reduction driven by lithium loss.
CAEBATOverall Project
Element 4Open Architecture
Software
Element 3Battery Pack Level Models
Element 1Electrode/Component
Level Models
Element 2Cell
Level Models

Pesaran – NREL IV.C.1 Computer Aided Engineering for Batteries
FY 2013 Annual Progress Report 191 Energy Storage R&D
Figure IV - 60: Validation of electrochemical-thermal STAR-CCM+ model with 12-cell lithium-ion module
EC Power.
Released two new and improved versions of ECT3D software to Ford, JCI, and NREL
Performed localized current distribution measurement in large-format cell for model validation (Figure IV - 61)
Demonstrated compatibility with ORNL’s Open Architecture Software
Conducted software validation with JCI pack Delivered final safety report Began life testing and data acquisition
Figure IV - 61: Current distribution measurement in large-format cell
GM.
Delivered several cell-level software tools o NREL’s MSMD framework implemented
in FLUENT with three electrochemistry sub-models.
o Cell-level validation completed for ECM and NTGK models, and validation of P2D model in progress.
o Developed user-defined electrochemistry capability allowing users to apply their own models while utilizing FLUENT’s battery framework.
Delivered first pack-level software tool to GM, NREL, and ESim o Auto electrical connection by detecting cell
configurations in the pack. o Built in internal electric circuit model to
speed up potential field convergence in the pack.
Completed cycle life test at room temperature with 30% capacity fade o Cycle life test at elevated temperature in
progress. o Physics-based cycle life model has been
developed. Completed pack-level validation for 24-cell
module (Figure IV - 62) o Full field simulation validated, and
satisfactory comparison with test data obtained.
o System-level model completed and validated compared to full field simulation, and test data and comparisons are satisfactory.
Linear time invariant (LTI) system-level reduced-order model (ROM) approach validated and compared to full field simulation results.

IV.C.1 Computer Aided Engineering for Batteries Pesaran – NREL
Energy Storage R&D 192 FY 2013 Annual Progress Report
Figure IV - 62: Simulated temperature distribution for the 24-cell module
Collaboration with ORNL on Open Architecture Software. NREL and ORNL held regular meetings to discuss the best approach and strategy for the Open Architecture Software (OAS). This included collaboration on the Battery Input, Battery State, wrappers, and translators. CAEBAT subcontractors were engaged with ORNL to understand the standard battery input. Further details on ORNL’s progress may be found in Section IV.C.2 of this report.
Development of Multi-Physics Battery Models at NREL. NREL continued its electrochemical-thermal cell modeling through the multi-physics, multi-scale, multi-domain (MSMD) platform for CAEBAT. The GM team is working with NREL to incorporate the MSMD lithium-ion battery modeling framework in their CAEBAT tools. We expect this approach to lead to more efficient computational time, reducing the time required to run different battery design scenarios. This activity is discussed in Section IV.C.6 of this report.
Conclusions and Future Directions
The CAEBAT subcontract teams continued their progress toward the objectives of their respective programs; monthly technical meetings and quarterly program review meetings were held to monitor technical progress; experimental data are being collected by each team to validate the models, and first versions of cell software tools by each team have been released for partner and NREL evaluation.
Each subcontractor released first (or subsequent) versions of their CAEBAT software tools to selected industry end users for evaluation.
NREL continued electrochemical-thermal modeling of cells through the MSMD and collaborated with ORNL on development of the OAS to link developed and existing models.
In FY14, we will continue to monitor the technical progress of each team through monthly and quarterly meetings to ensure success; we anticipate that software tools will be released to the pubic for purchase and evaluation; we will also continue to collaborate with ORNL on OAS development and example problem performance.
FY 2013 Publications/Presentations
1. A. A. Pesaran, Taeyoung Han, Steve Hartridge, Christian Shaffer, “Annual Progress Report on CAEBAT Subcontracts,” NREL Milestone Report, September 2013.
2. A.A. Pesaran, G.-H. Kim, K. Smith, and S. Santhanagopalan, “Progrss of Computer-Aided Engineering of Electric Drive Batteries,” presented at VTO Annual Merit Review (AMR), May 14-17 2013, Washington, DC. NREL Report No. PR-5400-58202.
3. A.A. Pesaran, Matt Keyser, Gi-Heon Kim, Shriram Santhanagopalan, and Kandler Smith. “Tools for Designing Thermal Management of Batteries in Electric Drive Vehicles.” Presented at the Large Lithium Ion Battery Technology & Application Symposia Advanced Automotive Battery Conference; Pasadena, CA. February 4–8, 2013. NREL Report No. PR-5400-57747.
4. A.A. Pesaran, G-H. Kim, S. Santhanagopalan, and K. Smith, “Update on Computer-Aided Engineering of Batteries for Designing Better Li-Ion Batteries,” presented at the USABC Technical Advisory Comitte Meeting, USCAR, Southfield, MI, August 2013.

FY 2013 Annual Progress Report 193 Energy Storage R&D
IV.C.2 Computer Aided Engineering for Batteries (ORNL)
Brian Cunningham, VTO Program Manager Subcontractor: ORNL John A. Turner, Program Manager Computational Engineering and Energy Sciences Group Oak Ridge National Laboratory Phone: (865) 241-3943; Fax: (865) 241-4811 E-mail: [email protected] Collaborators: S. Pannala, S. Allu, W. Elwasif, S. Simunovic, J. Billings, and S. Kalnaus Start Date: July 2010 Projected End Date: September 2014
Objectives
Develop a flexible and scalable computational framework that can integrate multiple physics models at various scales (battery pack, cell, electrodes, etc.), and provide a predictive modeling tool under the auspices of the CAEBAT program.
Coordinate with partners across the program on requirements and design of the framework so as to preserve the investment in existing models.
Ultimately, the detailed simulation capability will model coupled physical phenomena (charge and thermal transport; electrochemical reactions; mechanical stresses) across the porous 3D structure of the electrodes (cathodes and anodes) and the solid or liquid electrolyte system while including nanoscale effects through closures based on resolved quantities.
The simulation tool will be validated both at the full-cell level and at the battery-pack level, providing an unprecedented capability to design next-generation batteries with the desired performance and safety needs for transportation.
Technical Barriers
Given the complex requirements for development of electrical energy storage devices for future transportation needs, a predictive simulation capability which can guide rapid design by considering
performance and safety implications of different chemistry and materials choices is required. This capability must leverage existing investments and integrate multiple physics models across scales in order to (1) provide feedback to experiments by exploring the design space effectively, (2) optimize material components and geometry, and (3) address safety and durability in an integrated fashion. Such models do not currently exist.
Technical Targets
Develop the computational framework that will integrate existing models and new models developed by different CAEBAT subcontractor teams that span across the battery pack, modules, cells, etc. to provide an integrated design tool to battery manufacturers to optimize performance and safety in an accelerated fashion.
Accomplishments
Released Beta V1a of the CAEBAT-OAS framework together with VIBE (Virtual Integrated Battery Environment), Battery ML (BatML) Schema specifications, battery state, and few examples.
Completed porting of OAS (Open Architecture Software) to Windows.
Revisions to the BatML standard and translators to/from: ANSYS, EC-Power, and AMPERES.
Integrated workflow environment through NiCE: job launch, postprocessing of the results, XML files editing.
Introduction
Computational tools for the analysis of performance and safety of battery systems are not currently predictive, in that they rely heavily on fitted parameters. While there is ongoing experimental research at various length scales around the world, computational models are primarily developed for the lower-length scales (atomistic and mesoscopic), which do not scale to the system-level. Existing models at the macroscopic or system-level are based on electrical circuit models or simple 1D models. The 1D models are limited in their ability to capture spatial variations in temperature, potential in the electrical circuits of the battery cells and
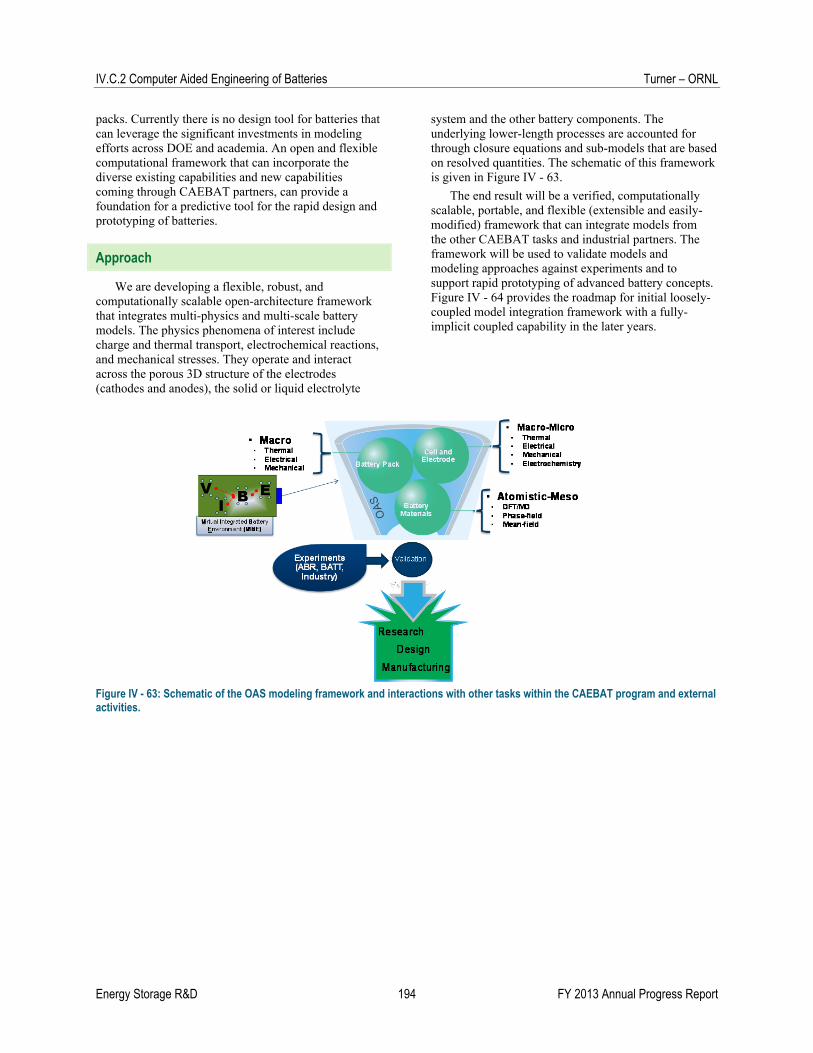
IV.C.2 Computer Aided Engineering of Batteries Turner – ORNL
Energy Storage R&D 194 FY 2013 Annual Progress Report
packs. Currently there is no design tool for batteries that can leverage the significant investments in modeling efforts across DOE and academia. An open and flexible computational framework that can incorporate the diverse existing capabilities and new capabilities coming through CAEBAT partners, can provide a foundation for a predictive tool for the rapid design and prototyping of batteries.
Approach
We are developing a flexible, robust, and computationally scalable open-architecture framework that integrates multi-physics and multi-scale battery models. The physics phenomena of interest include charge and thermal transport, electrochemical reactions, and mechanical stresses. They operate and interact across the porous 3D structure of the electrodes (cathodes and anodes), the solid or liquid electrolyte
system and the other battery components. The underlying lower-length processes are accounted for through closure equations and sub-models that are based on resolved quantities. The schematic of this framework is given in Figure IV - 63.
The end result will be a verified, computationally scalable, portable, and flexible (extensible and easily-modified) framework that can integrate models from the other CAEBAT tasks and industrial partners. The framework will be used to validate models and modeling approaches against experiments and to support rapid prototyping of advanced battery concepts. Figure IV - 64 provides the roadmap for initial loosely-coupled model integration framework with a fully-implicit coupled capability in the later years.
Figure IV - 63: Schematic of the OAS modeling framework and interactions with other tasks within the CAEBAT program and external activities.
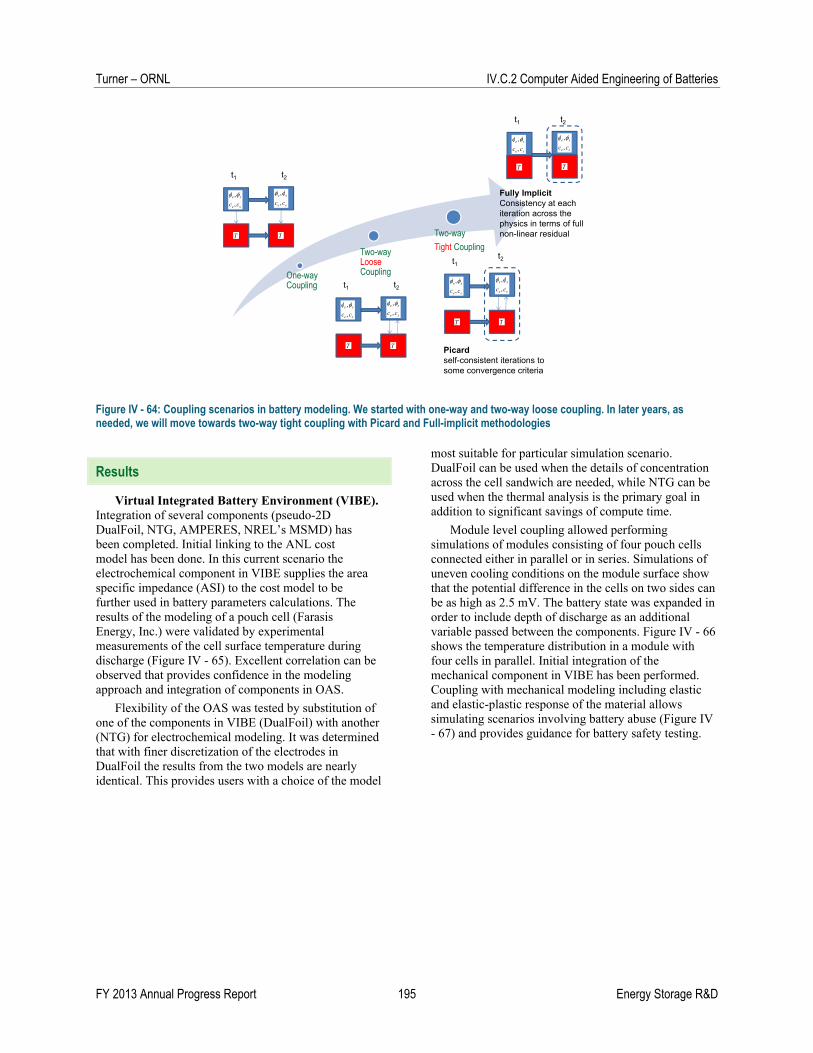
Turner – ORNL IV.C.2 Computer Aided Engineering of Batteries
FY 2013 Annual Progress Report 195 Energy Storage R&D
Figure IV - 64: Coupling scenarios in battery modeling. We started with one-way and two-way loose coupling. In later years, as needed, we will move towards two-way tight coupling with Picard and Full-implicit methodologies
Results
Virtual Integrated Battery Environment (VIBE). Integration of several components (pseudo-2D DualFoil, NTG, AMPERES, NREL’s MSMD) has been completed. Initial linking to the ANL cost model has been done. In this current scenario the electrochemical component in VIBE supplies the area specific impedance (ASI) to the cost model to be further used in battery parameters calculations. The results of the modeling of a pouch cell (Farasis Energy, Inc.) were validated by experimental measurements of the cell surface temperature during discharge (Figure IV - 65). Excellent correlation can be observed that provides confidence in the modeling approach and integration of components in OAS.
Flexibility of the OAS was tested by substitution of one of the components in VIBE (DualFoil) with another (NTG) for electrochemical modeling. It was determined that with finer discretization of the electrodes in DualFoil the results from the two models are nearly identical. This provides users with a choice of the model
most suitable for particular simulation scenario. DualFoil can be used when the details of concentration across the cell sandwich are needed, while NTG can be used when the thermal analysis is the primary goal in addition to significant savings of compute time.
Module level coupling allowed performing simulations of modules consisting of four pouch cells connected either in parallel or in series. Simulations of uneven cooling conditions on the module surface show that the potential difference in the cells on two sides can be as high as 2.5 mV. The battery state was expanded in order to include depth of discharge as an additional variable passed between the components. Figure IV - 66 shows the temperature distribution in a module with four cells in parallel. Initial integration of the mechanical component in VIBE has been performed. Coupling with mechanical modeling including elastic and elastic-plastic response of the material allows simulating scenarios involving battery abuse (Figure IV - 67) and provides guidance for battery safety testing.
One-way Coupling
Two-way LooseCoupling
Two-way
Tight Coupling
se
se
cc ,
,
T
t1 t2
se
se
cc ,
,
T
se
se
cc ,
,
T
t1 t2
se
se
cc ,
,
T
se
se
cc ,
,
T
t1t2
se
se
cc ,
,
T
Picardself-consistent iterations to some convergence criteria
se
se
cc ,
,
T
t1 t2
se
se
cc ,
,
T
Fully ImplicitConsistency at each iteration across the physics in terms of full non-linear residual

IV.C.2 Computer Aided Engineering of Batteries Turner – ORNL
Energy Storage R&D 196 FY 2013 Annual Progress Report
Figure IV - 65: Validation of 4.3 Ah pouch cell modeling (solid lines) with experimental temperature measurements (markers)
Figure IV - 66: Temperature distribution in a module with assymetric cooling
Figure IV - 67: Mechanical abuse of cylindrical cell (electrochemical-electrical-thermal-mechanical components)
OAS Capabilities of DAKOTA optimization toolkit were explored by running a numerical study of the effect of tab placement on cell temperature. 2000 configurations were run within the simulation with geometry parametrization and automated mesh generation. The lowest temperature was determined in the cell configuration where the tabs were placed on the opposite edges; the effect was more pronounced with an increase of the width of the cooled tabs. Example of
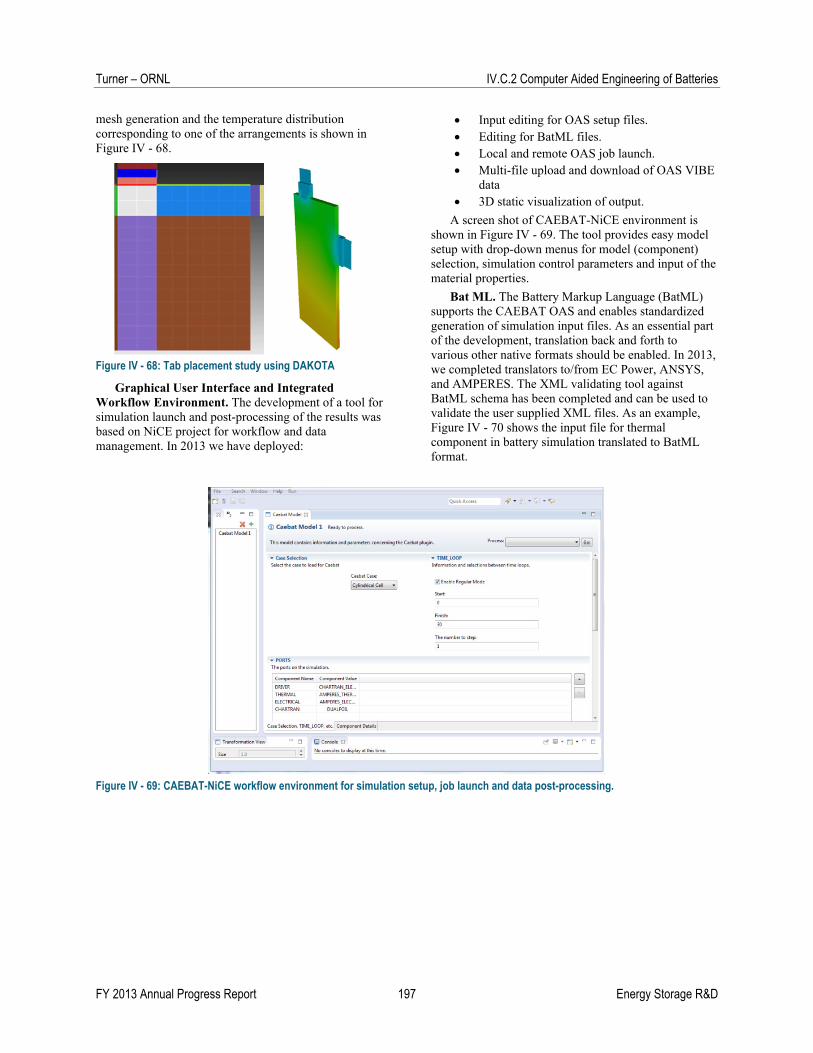
Turner – ORNL IV.C.2 Computer Aided Engineering of Batteries
FY 2013 Annual Progress Report 197 Energy Storage R&D
mesh generation and the temperature distribution corresponding to one of the arrangements is shown in Figure IV - 68.
Figure IV - 68: Tab placement study using DAKOTA
Graphical User Interface and Integrated Workflow Environment. The development of a tool for simulation launch and post-processing of the results was based on NiCE project for workflow and data management. In 2013 we have deployed:
Input editing for OAS setup files. Editing for BatML files. Local and remote OAS job launch. Multi-file upload and download of OAS VIBE
data 3D static visualization of output.
A screen shot of CAEBAT-NiCE environment is shown in Figure IV - 69. The tool provides easy model setup with drop-down menus for model (component) selection, simulation control parameters and input of the material properties.
Bat ML. The Battery Markup Language (BatML) supports the CAEBAT OAS and enables standardized generation of simulation input files. As an essential part of the development, translation back and forth to various other native formats should be enabled. In 2013, we completed translators to/from EC Power, ANSYS, and AMPERES. The XML validating tool against BatML schema has been completed and can be used to validate the user supplied XML files. As an example, Figure IV - 70 shows the input file for thermal component in battery simulation translated to BatML format.
Figure IV - 69: CAEBAT-NiCE workflow environment for simulation setup, job launch and data post-processing.

IV.C.2 Computer Aided Engineering of Batteries Turner – ORNL
Energy Storage R&D 198 FY 2013 Annual Progress Report
Figure IV - 70: Input file for thermal component (AMPERES) translated to BatML
Conclusions and Future Directions
CAEBAT OAS framework core is stable and has been ported to Windows. Components for electrochemical, electrical, and thermal modeling have been successfully integrated and initial coupling to a mechanics model has been done. The framework possesses the ability for exchange of the components and integration of DAKOTA optimization toolkit provides a unique set of instruments to perform parametric sweeps and optimization study. Job launch and results post-processing through NiCE gives users an organized and easy to use workflow environment for battery simulations.
In the following year, we will:
Complete integration of the mechanical component in VIBE.
Extend battery state definition to include battery pack simulations.
Implement additional BatML translators as necessary.
BatML revisions based on community feedback.
Release another version of the standard and associated tools.
Implement two-way coupling in OAS. Finalize post-processing and real-time
manipulation in NiCE. Develop a refined and user-friendly BatML
editing in NiCE.
FY 2013 Publications/Presentations
1. Allu, S., Kalnaus, S., Elwasif, W., Simunovic, S., Turner, J.A., and Pannala, S., 2014, “A New Open Computational Framework for Highly-Resolved Coupled Three-Dimensional Multiphysics Simulations of Li-ion Cells,” Journal of Power Sources, 246, pp. 876-886.
2. Pannala, S., Allu, S., Elwasif, W., Kalnaus, S., Simunovic, S., and Turner, J.A., “Understanding the Effect of Temperature Gradients in Modules on Cell Balance Using Coupled Multi-Physics Modeling Approach With OAS Framework”, ECS 224th Meeting, San Francisco, CA, Oct. 27 – Nov. 1, 2013.
3. Kalnaus, S., Allu, S., Pannala, S., Elwasif, W., Simunovic, S., and Turner, J.A., “Three-dimensional Thermal, Electrical, and Electrochemical Modeling of Li-ion Batteries,” ECS 224th Meeting, San Francisco, CA, Oct. 27 – Nov. 1, 2013.
4. Allu, S., Elwasif, W., Pannala, S., Kalnaus, S., Simunovic, S., and Turner, J.A., “Optimization of tab Placement in Li-ion Battery Using Multi-Physics Simulations,” ECS 224th Meeting, San Francisco, CA, Oct. 27 – Nov. 1, 2013.
5. Simunovic, S., Allu, S., Pannala, S., Kalnaus, S., Elwasif, W., and Turner, J.A., Coupled Multi-Physics Model for Li-ion Battery Cells During Impact,” EUROMAT 2013 – European Congress and Exhibition on Advanced Materials and Processes, Seville, Spain, Sept. 08 – 13, 2013.

FY 2013 Annual Progress Report 199 Energy Storage R&D
IV.C.3 Development of Computer Aided Design Tools for Automotive Batteries (GM)
Dr. Gi-Heon Kim, NREL Technical Monitor Subcontractor: General Motors LLC Dr. Taeyoung Han, Principal Investigator 30500 Mound Road Warren, MI 48090 Phone: (586) 986-1651; Fax: (586) 986-0446 E-mail: [email protected] Subcontractors: ANSYS Inc. and ESIM LLC Start Date: June 2011 Projected End Date: Dec 2014
Objectives
As one of the subcontract teams, support the DOE/NREL Computer Aided Engineering for Batteries (CAEBAT) activity to shorten the product development cycle for EDVs and to reduce the cost associated with the current hardware build and test design iterations.
Provide simulation tools that expand the inclusion of advanced lithium-ion battery systems into ground transportation. Validate advanced lithium-ion battery systems using GM’s six-step model verification and validation approach.
Participate in the Open Architecture Software program led by Oak Ridge National Lab to develop a flexible and scalable computational framework to integrate multiple battery physics sub-models produced by different teams.
Technical Barriers
Existing design tools are not practical for realistic battery pack design and optimization.
Various cell physics sub-models exist, but they have not been integrated in a single framework in commercial code.
Current engineering workstations do not have the computational power required to simulate pack-level thermal response coupled with electrochemistry. System-level analysis or Reduced Order Modeling (ROM) is required to simulate integrated pack-level physics.
However, ROM approaches for battery packs are not well understood.
Collaboration to date has been difficult to achieve since software developer’s commercial code, automaker’s electrification strategies, and battery developer’s cell designs and chemistry represent well-guarded intellectual property.
Technical Targets
Project goals for the GM team are summarized schematically in Figure IV - 71. To be useful to automotive engineers, battery cell and pack design tools should have the following analytical capabilities:
1. Predict optimum cell energy capacity in terms of electrical performance, cooling requirements, life, safety, and cost.
2. Predict battery pack life for various vehicle operating conditions.
3. Predict optimum state-of-charge (SOC) range for maximum life and safety.
4. Evaluate battery pack thermal management by predicting max intra/inter cell temperature difference under various drive-cycles.
5. Ability to provide system simulations with ROM that allows for trade off studies between the cooling cost and the battery pack warrenty cost in the early stage of vehicle development.
6. Ability for a real time system simulations that can lead to BMS deveopement and enhancement.
Figure IV - 71: Project goals for the CAEBAT battery design tool development

IV.C.3 Computer Aided Design Tools for Automotive Batteries Han – GM
Energy Storage R&D 200 FY 2013 Annual Progress Report
Accomplishments
Several software deliverables for the cell level tools. o NREL’s MSMD framework is
implemented in FLUENT with three electrochemistry sub-models.
o Cell level validation was completed for ECM and NTGK models and validation of P2D model is in progress.
o Developed user defined electrochemistry capability that allows users to apply their own models while utilizing FLUENT’s battery framework.
o A detailed release note/tutorial has been provided. Official public release of these tools is scheduled for December 2013 (version 15).
First pack level software tool was delivered to GM, NREL, and ESim o Auto electrical connection by detecting the
cell configurations in the pack. o Built in internal electric circuit model to
speed up the potential field convergence in the pack.
o Code is completely parallelized. Cycle life test at the room temperature
completed with 30% capacity fade. o Cycle life test at an elevated temperature is
in progress. o Physics based cycle life model has been
developed. Pack level validation is completed for a 24-cell
module. o Full field simulation has been validated and
satisfactory comparison with the test data has been obtained.
o System level model was completed and validated compared to the full field simulation and the test data and comparisons are satisfactory.
o Linear Time Invariant (LTI) system level ROM model approach has been validated in comparison with the full field simulation results.
o Demonstration for various driving cycles is in progress
Introduction
DOE established the Computer Aided Engineering for Electric Drive Vehicle Batteries (CAEBAT) activity to develop multi-physic design tools. NREL, with
guidance from DOE, funded three subcontractors including the GM team, to develop software tools for CAEBAT. The principal objective of the GM team is to produce an efficient and flexible simulation tool that predicts multi-physics battery responses for bettery pack thermal management and predicts an optimum cell energy capacity in terms of electrical performance, cooling requirements, life, safety, and cost. GM has assembled a CAEBAT Project Team composed of GM researchers and engineers, ANSYS software developers, and Prof. White of the University of South Carolina and his ESim staff. In partnership with DOE/NREL, the Project Team will interact with the CAEBAT working groups to integrate and enhance existing sub-models, develop cell- and pack-level design tools, and perform experimental testing to validate the tools. The GM team will also create interfaces to enable these new tools to interact and interface with current and future battery models developed by others. NREL has been providing the technical consultations and monitored the overall progress. ORNL has provided the standard for Open Architecture Software (OAS). With a rapid deployment to industry, these project results will contribute to accelerating the pace of battery innovation and development for future electric-drive vehicles.
Approach
The objective of this project is to develop an open, flexible, efficient software tool for multi-scale, multi-physics battery simulation based on the ANSYS Workbench framework. ANSYS is leveraging and enhancing its existing commercial products to provide both field-level (FLUENT) and system-level (Simplorer) capabilities, including novel reduced-order modeling (ROM) methods and with other battery tools through the OAS interface.
ANSYS Battery Design Tool (ABDT) is part of the CAEBAT project funded during 2011-2014 by DOE through NREL, in which ANSYS is teaming with GM and ESim. ABDT is a graphical user interface layer that automates and customizes battery simulation workflow using ANSYS software products.
The essential role of the ABDT is to automate and integrate the ANSYS tools to make the various components emulate battery applications for cell and pack capabilities. ABDT is the newly-developed customization layer that ties the ANSYS building-blocks together to provide a unified, intuitive simulation workflow (Figure IV - 72).

Han – GM IV.C.3 Computer Aided Design Tools for Automotive Batteries
FY 2013 Annual Progress Report 201 Energy Storage R&D
Figure IV - 72: Proposed software architecture for the combined the cell-level, pack-level, and OAS-interface capability
GM engineers and ESim tested the sub-models, cell- and pack-level design tools and evaluated the ABDT tools and provided furhter enhancements. The GM team also built prototypes for a battery module and a pack and performed experimental tests to validate these tools. At the pack level, the tools will be significantly advanced by the development of innovative reduced-order models, derived and calibrated from the cell-level models and carefully validated through experiments.
Results
In 2013, ANSYS delivered several versions of the cell- and pack-level battery simulation tools. First, the ECM model was enhanced to allow using different functions in the charging and discharging processes. Secondly, the electrochemistry model options were expanded and so the user has the capability to customize or develop a new electrochemistry model. The user has the option to specify system voltage, current, power, or C-rate and the battery module is fully coupled with all other ANSYS Fluent models and physics. The validation for the cell level models with ECM and NTGK for LG Chem pouch cell (P1.4 chemistry) was completed. The comparison with the test data for the cell temperatures are satisfactory as shown in Figure IV - 73. Cycle life tests were completed at room temperature and the cycle life test data has been delivered to ESim for cycle life modeling.
Figure IV - 73: Comparison of cell level models with the test data at various C-rates and operating temperatures
The wound cells with continuous tabs can be handled with the capability developed previously for the stacked cell configurations. The wound cell with discrete tabs requires further development. The GM team has developed two approaches to handle the wound cell configurations with discrete tabs. The first approach is based on the MSMD approach and has been extended and demonstrated for the wound cylindrical cell battery design as shown in Figure IV - 74. In this geometry, the electric current cannot conduct radially through layers while thermal temperature can. The second approach introduces the coordinate transform and variable extrusion developed by Esim (Figure IV - 75). This approach significantly reduces the mesh requirements and simulation time.

IV.C.3 Computer Aided Design Tools for Automotive Batteries Han – GM
Energy Storage R&D 202 FY 2013 Annual Progress Report
Figure IV - 74: Simulation results based on MSMD approach
Figure IV - 75: Flowchart for the solution procedure using coordinate transformation
ANSYS has developed and delivered the first version of the ABDT, the Workbench (WB) graphical user interface layer that automates and customizes battery simulations using ANSYS software products. Within WB, the ABDT adds a new Toolbox section named Battery Design Tools. In addition, in the Custom Systems section two entries appear as the top-level templates for battery workflow. These entries, named Battery Cell Multiphysics and Battery Pack Multiphysics, follow the cell and pack organization of the CAEBAT project. Each template can also be further customized as needed, for example by manually adding links for data flow, or including ANSYS DesignXplorer (DX) for parametric exploration, and then store back to the Toolbox under Custom Systems for future use. The user can also display results based on standard visualization capabilities augmented with built-in menu for electrochemistry results.
Figure IV - 76: ABDT Cell Level Design in Workbench
Customized ABDT components typically present one or more tabbed dialogs with data-entry fields with default values already entered (see Figure IV - 76, Figure IV - 77, and Figure IV - 78). In addition, fly-out menus available from a right-click on components in the Project Schematic can be used to access WB-standard utility functions.
Figure IV - 77: Tabbed panel for the P2D sub model
Figure IV - 78: Set cell geometry based on parameterized templates
GM has built a 24-cell module with a liquid-fin cooling system (Figure IV - 79). Thermocouples were located at various places in the module to compare the
Temperature
Contour of φ‐
Current flux
MSMD

Han – GM IV.C.3 Computer Aided Design Tools for Automotive Batteries
FY 2013 Annual Progress Report 203 Energy Storage R&D
full field computational fluid dynamics (CFD) simulations for the 24-cell module (Figure IV - 80). Full CFD model for the 24-cell module was constructed by GM engineers and has been simulated to compare the simulation results with the test data. GM engineers verified the 24-cell module simulations and confirmed that most temperature comparisons are very successful and predictions are within 1°C accuracy (Figure IV - 81 and Figure IV - 82). For the final validation of the pack level tools, activity also has been initiated to leverage the existing battery pack CAE models and test data sets.
Figure IV - 79: A 24 cell module validation test set up for full field simulation against test data for high-frequency pulse charge-discharge
Figure IV - 80: A 24 cell module CFD full field simulation
Figure IV - 81: Simulated temperature distribution for 24 cell module
Figure IV - 82: Comparison of temperatures between the full field simulation and the test data
In System Simulation, ANSYS has developed a layered software approach to balance automation and flexibility. This approach is analogous to the cell-level approach with mesh templates and ABDT. The user has a highly-automated, intuitive interface for building and solving a system-level model of a battery pack using ANSYS system-simulation tool Simplorer, with the option to represent selected items in the pack using CFD models and/or reduced-order models (ROM) derived from CFD. This tool captures the effects of manifold geometry, coolant properties, and flow distribution through the microchannels and produces a look-up-table for mass flow rate distribution among cells to be used in Simplorer system simulations.
In 2013, GM team continued making progress on simulating full battery packs and developing linear and nonlinear ROM. Research and development work has continued on the algorithms for a LTI ROM. In order to validate the LTI ROM with respect to the test data, GM-team engineers constructed the ROM data by building LTI ROMs from a set of pre-generated Fluent step-responses. GM engineers validated the LTI ROM approach for realistic USO6 driving cycles as shown in Figure IV - 83-Figure IV - 86. A highly accurate CFD/thermal model of a 24 cell module was employeed to generate the training data for creating ROMs. The validation of the linear ROM system simulations for the 24 cell module was completed and the predicted temperatures were within 1°C compared to the test data at various cell locations as shown in Figure IV - 87. The GM team has also developed a procedure to obtain empirical parameters from the HPPC test data that performs and predicts accurately the load voltage, and hence the heat generation in cells under various drive-cycles. Heat generation in the tabs and inter-connects are included in the LTI ROM simulations.
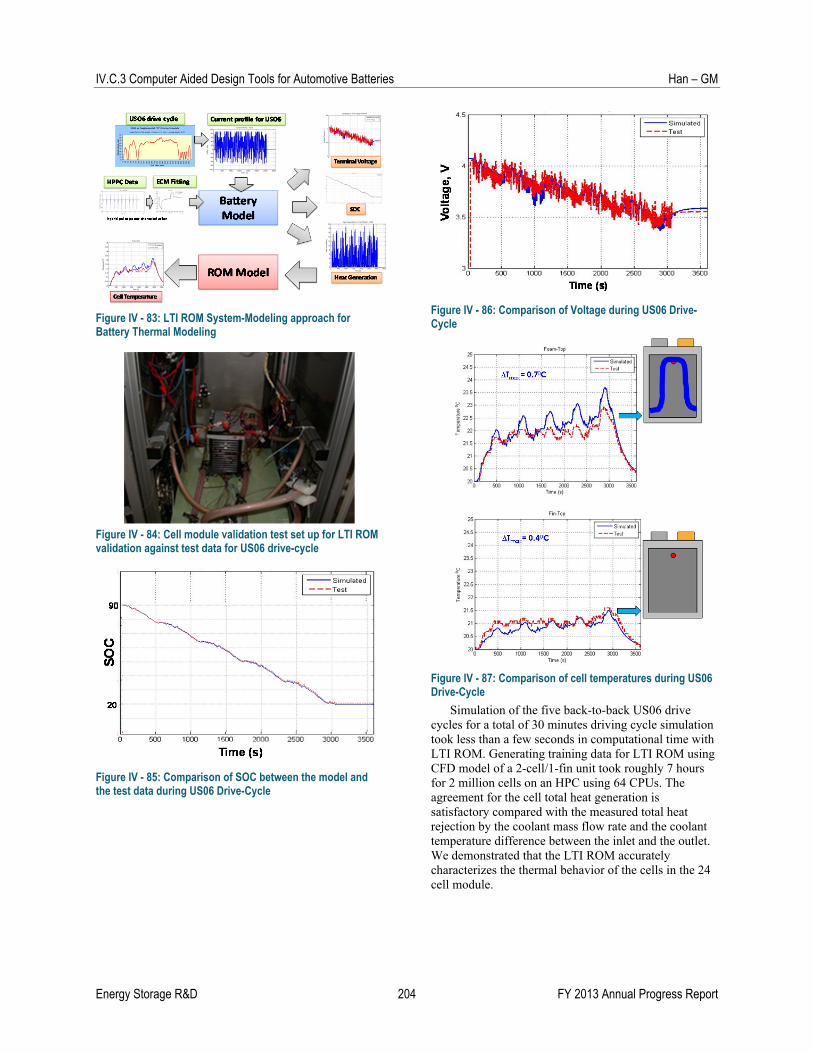
IV.C.3 Computer Aided Design Tools for Automotive Batteries Han – GM
Energy Storage R&D 204 FY 2013 Annual Progress Report
Figure IV - 83: LTI ROM System-Modeling approach for Battery Thermal Modeling
Figure IV - 84: Cell module validation test set up for LTI ROM validation against test data for US06 drive-cycle
Figure IV - 85: Comparison of SOC between the model and the test data during US06 Drive-Cycle
Figure IV - 86: Comparison of Voltage during US06 Drive-Cycle
Figure IV - 87: Comparison of cell temperatures during US06 Drive-Cycle
Simulation of the five back-to-back US06 drive cycles for a total of 30 minutes driving cycle simulation took less than a few seconds in computational time with LTI ROM. Generating training data for LTI ROM using CFD model of a 2-cell/1-fin unit took roughly 7 hours for 2 million cells on an HPC using 64 CPUs. The agreement for the cell total heat generation is satisfactory compared with the measured total heat rejection by the coolant mass flow rate and the coolant temperature difference between the inlet and the outlet. We demonstrated that the LTI ROM accurately characterizes the thermal behavior of the cells in the 24 cell module.

Han – GM IV.C.3 Computer Aided Design Tools for Automotive Batteries
FY 2013 Annual Progress Report 205 Energy Storage R&D
Conclusions and Future Directions
Overall the project is on-track to meet all the objectives and its year two technical progress is consistent with the project plan.
1. Develop non-linear model order reduction methods for the pack level.
2. Extend cell-level models for aging and abuse, multiple active materials.
3. Define pack-level validation requirements for the production battery packs to meet the future capability matrix for pack-level CAE.
4. Build a standard data-exchange interface based on specifications from the OAS Workgroup.
5. Apply battery design tools to future vehicle programs and justify the value of the CAEBAT project.
An updated and validated version of the software will be available from in FLUENT/SIMPLORER ANSYS in July 2014.
Acknowledgement
Supported by Department of Energy, specifically Dave Howell and Brian Cunningham.
FY 2013 Publications/Presentations
1. Xiao Hu, Scott Stanton, Long Cai, Ralph E. White, “Model order reduction for solid-phase diffusion in physics-based lithium ion cell models,” Journal of Power Sources 218 (2012) 212-220.
2. Meng Guo, Ralph E. White, Gi-Heon Kim “A distributed thermal model for a Li-ion electrode plate pair,” Journal of Power Sources 221 (2013) 334-344.
3. Meng Guo, Gi-Heon Kim, Ralph E White, “A three-dimensional multi-physics model for a Li-ion battery,” Journal of Power Source, 240 (2013) 80-94.
4. Saeed Asgari, Xiao Hu, Michael Tsuk, Shailendra Kaushik, “Application of POD plus LTI ROM to Battery Thermal Modeling: SISO Case,” to be presented in 2014 SAE World Congress.
5. Ramesh Rebba, Justin McDade, Shailendra Kaushik, Jasmine Wang, Taeyoung Han, ”Verification and Validation of Semi-Empirical Thermal Models for Lithium Ion Batteries,” to be presented in 2014 SAE World Congress.

Energy Storage R&D 206 FY 2013 Annual Progress Report
IV.C.4 Development of Computer Aided Design Tools for Automotive Batteries (CD-adapco)
Kandler Smith, NREL Technical Monitor Subcontractor: CD-adapco Steve Hartridge CD-adapco, New York 60 Broadhollow Road Melville, NY 11747 Phone: (631) 549-2300; Fax: (631) 549-2654 E-mail: [email protected] Subcontractor: Battery Design LLC 2277 DeLucchi Drive Pleasanton, CA 94588 E-mail: [email protected] Start Date: August 2011 Projected End Date: July 2014
Objectives
As one of the subcontract teams, support the DOE/NREL Computer Aided Engineering for Batteries (CAEBAT) activity.
Provide simulation tools that expand the inclusion of advanced lithium-ion battery systems into ground transporation.
Specifically develop a numerical simulation model which can resolve the appropriate phenomena required to create a coupled thermal and electrochemical response model.
Apply advanced numerical techniques to expedite the solution of the governing fundamental equations within lithium-ion battery cells to enable advanced electrochemical models to be used in module and pack simulations.
Technical Barriers
One of the major challenges of this project is to include the important aspects of the rapidly maturing lithium ion battery simulation field in to an easy to use, widely accepted computer aided engineering tool. This implementation should be flexible and extensible to ensure the methods can move forward as the level of understanding in the fundamental physics evolves.
Another significant challenge is the creation of a modeling concept for spirally wound cells and their underlying architectures. Spiral cells can be grouped into several categories and hence flexible templates were created, the user then provides appropriate data to populate such templates creating a complete electrochemical and thermal cell model. The creation of such electrochemical and thermal templates and overall method is a significant part of this project.
It should also be stated that obtaining some of the modeling parameters used within such electrochemical models has proved a challenge. Part of enhancing the use of such a coupled thermal-electrochemical tool is to present a process to obtain such parameters to users so there is confidence in results obtained from such models.
Technical Targets
Create a spiral cell analysis framework which includes the two electrodes, one positive and one negative, which are wound together to create the spiral jellyroll. This method should resolve the planar electrical/thermal gradients along the length and height of the electrodes as well as the overall performance of the electrode pair.
Validate the created cell simulation models against test work provided by sub-contractors including both cylindrical and prismatic forms of spiral cells as well as power and energy focused chemistry.
Use the validated methods within a larger framework to create simulations of battery modules which include such cells. These methods will be validated against electrical and thermal results from appropriate battery modules.
Accomplishments
The project has now delivered the overall modeling framework, both electrochemical and thermal, as described above in the computer aided engineering tool STAR-CCM+, produced by CD-adapco.
An enhanced electrochemistry model has now been created. The original model is based on the work of Newman et al1. This model has been significantly extended to include the effect of concentration dependence of the solid

Hartridge – CD-adapco IV.C.4 Computer Aided Design Tools for Automotive Battries
FY 2013 Annual Progress Report 207 Energy Storage R&D
phase diffusion coefficient2 and also multiple active materials as often found in contemporary lithium ion cell design.
Electrochemical and thermal datasets have been created and validated within the project for the spiral cells listed below. These have been created after the provision of cell specific data from Johnson Controls Inc. A process to extract the unknown electrochemical properties from specific test work has been developed
The above listed electrochemistry model and datasets have also been implemented in STAR-CCM+. The implementation allows the use of parallel processing. This development addresses one of the major drawbacks often repeated regarding Newman type models which is the runtime of the calculation.
A dataset of contemporary electrolytes has been added to the simulation environment. The dataset contains molarity, conductivity, diffusion coefficient, transport number, activity coefficient, density, and viscosity for 12 electrolyes. All values are concentration and temperature dependent within appropriate ranges.
An approach to simulating aging within lithium-ion cells has been formulated which considers SEI layer growth and associated capacity reduction driven by lithium loss. This model is based on the work of H. Ploehn3.
Introduction
DOE established the Computer Aided Engineering for Electric Drive Vehicle Batteries (CAEBAT) activity to develop multi-physics design tools. NREL, with guidance from DOE, funded three subcontractors including CD-adapco, to develop software tools for CAEBAT. CD-adapco has extended its computer aided engineering code, STAR-CCM+, to analyze the flow, thermal and electrochemical phenomena occurring within spirally wound lithium ion battery modules and packs. This development created additional coding and methods which focus on the electrochemistry analysis of the spirally wound electrodes. This coding has been developed in collaboration with Battery Design LLC who is a sub-contractor to CD-adapco and has considerable experience in the field of electrochemistry modeling. As well as resolving the electrochemistry active regions in a spiral cell the model accounts for the tabbing of the electrode in the overall performance.
The created model has now been applied to the lithium ion cells listed below (see Table IV - 15), excluding the pouch cell where an empirical model has been used. The inclusion of a pouch cell to this project is to provide a control through which one can validate the results for analysis methods on components around the cell itself. The A123 test work includes considerable measurements from the conducting components around the cells to ensure their thermal and electrical effects are also represented correctly.
Table IV - 15: A list of lithium-ion cells used in testing the CD-adapco model
Manufacturer Format Capacity
JCI Cylindrical 7Ah (HP)
JCI Cylindrical 40Ah (HE)
JCI Prismatic 6Ah (HP)
JCI Prismatic 27Ah (HE)
A123 Pouch 20Ah
Approach
Detailed design information was obtained from the cell supplier to describe the dimensions of the electrode, the details of the can and finally, details of the electrode chemistry used in each of the designs. These cell models also used the appropriate electrolyte formulation from the newly integrated dataset provided by K.Gering at INL (also part of this project). Tightly controlled cell level test work was specified to enable the remaining modeling parameters to be extracted. This has now been done for all four spiral cells. The project now has a high level of confidence in the overall process, including cell test work specification and parameter extraction. This is borne out by the validation results presented below.
Results
Electrochemistry results. Once the electrochemistry models were fully defined and confirmed using the controlled cell test work, a validation of the voltage response from the created models was completed. This validation used either a charge-sustaining or charge-depleting load as appropriate for the cell in question and compared with experimentally obtained voltage curves. Validation results are shown below:

IV.C.4 Computer Aided Design Tools for Automotive Battries Hartridge – CD-adapco
Energy Storage R&D 208 FY 2013 Annual Progress Report
Figure IV - 88: Voltage response from the created electrochemical model for the JCI VL6P cell over a 30min drive cycle compared to test work (Voltage scale removed)
The mean error for the VL6P simulation model (Figure IV - 88) over the 30 minutes drive cycle is 9 mv. Similar error levels are seen in the other models (Figure IV - 89, Figure IV - 90)
Figure IV - 89: Voltage response using the electrochemistry model for the JCI VL41M cell over a 30min drive cycle compared to test work (Voltage scale removed)
Figure IV - 90: Voltage response using the electrochemistry model for the PL27M cell over a 30min drive cycle compared to test work (Voltage scale removed)
The above validation work was completed using a ‘lumped’ electrochemistry model. This essentially means a single temperature for the whole cell is assumed. The cell representations were then transferred in to STAR-CCM+ and complex three dimensional models of the cell were created. This model now accounts for the internal anisotropic thermal conductivity of the jelly roll as well as the jelly roll’s thermal interfaces with neightbour components such as mandrels and external cans. The electric conductivity of the current collectors is also included in the model. Figure IV - 91 compares the simulation results for the VL6P electrochemistry model using the lumped model and the 3D model. The mean difference is 8 mV over the 30 minutes drive cycle. Differences are expected within the results due to the 3D model having a distribution of temperature within the jelly roll, hence a differing response. Overall we can conclude that the voltage response of the cell is well captured within both lumped and 3D modelling domains hence engineers can use the same cell data within either modeling framework, lumped or detailed 3D.
Figure IV - 91: Comparison of lumped electrochemistry model vs three dimensional electrochemistry model over a 30min drive cycle (Voltage scale removed)
Thermal results. The thermal validation was completed using the 3D model within STAR-CCM+. Module test work for the VL6P, PL6P & PL27M has now been complete. Figure IV - 92 shows the VL6P 12 module that is used within the module tests. This arrangement is liquid cooled.
Figure IV - 92: VL6P 12 module used for thermal valication of the 3D model within STAR-CCM+
The main thermal validation test used the same drive cycle input condition as used in the lumped model and cell can surface temperatures were monitored.
A high fidelity finite volume model was created within STAR-CCM+ (see Figure IV - 93) including all cell components (jelly rolls, current collection designs, outer cans) as well as current carrying straps and coolant system.
Figure IV - 93: High-fidelity volume model created within STAR-CCM+
A number of thermacouples were located on the cell of interest and the graph below shows one result compared to the appropriate test result. These thermocouples were located on the outer surface of the cell can. The scales have been removed as this is sensitive data.
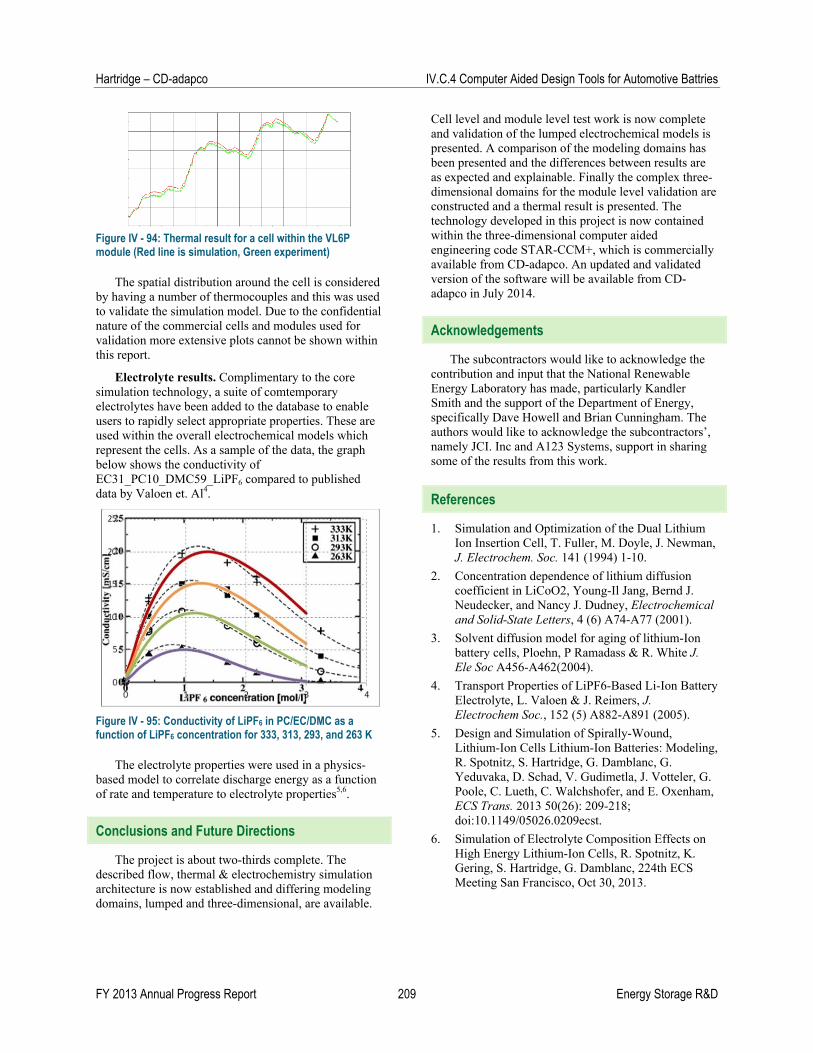
Hartridge – CD-adapco IV.C.4 Computer Aided Design Tools for Automotive Battries
FY 2013 Annual Progress Report 209 Energy Storage R&D
Figure IV - 94: Thermal result for a cell within the VL6P module (Red line is simulation, Green experiment)
The spatial distribution around the cell is considered by having a number of thermocouples and this was used to validate the simulation model. Due to the confidential nature of the commercial cells and modules used for validation more extensive plots cannot be shown within this report.
Electrolyte results. Complimentary to the core simulation technology, a suite of comtemporary electrolytes have been added to the database to enable users to rapidly select appropriate properties. These are used within the overall electrochemical models which represent the cells. As a sample of the data, the graph below shows the conductivity of EC31_PC10_DMC59_LiPF6 compared to published data by Valoen et. Al4.
Figure IV - 95: Conductivity of LiPF6 in PC/EC/DMC as a function of LiPF6 concentration for 333, 313, 293, and 263 K
The electrolyte properties were used in a physics-based model to correlate discharge energy as a function of rate and temperature to electrolyte properties5,6.
Conclusions and Future Directions
The project is about two-thirds complete. The described flow, thermal & electrochemistry simulation architecture is now established and differing modeling domains, lumped and three-dimensional, are available.
Cell level and module level test work is now complete and validation of the lumped electrochemical models is presented. A comparison of the modeling domains has been presented and the differences between results are as expected and explainable. Finally the complex three-dimensional domains for the module level validation are constructed and a thermal result is presented. The technology developed in this project is now contained within the three-dimensional computer aided engineering code STAR-CCM+, which is commercially available from CD-adapco. An updated and validated version of the software will be available from CD-adapco in July 2014.
Acknowledgements
The subcontractors would like to acknowledge the contribution and input that the National Renewable Energy Laboratory has made, particularly Kandler Smith and the support of the Department of Energy, specifically Dave Howell and Brian Cunningham. The authors would like to acknowledge the subcontractors’, namely JCI. Inc and A123 Systems, support in sharing some of the results from this work.
References
1. Simulation and Optimization of the Dual Lithium Ion Insertion Cell, T. Fuller, M. Doyle, J. Newman, J. Electrochem. Soc. 141 (1994) 1-10.
2. Concentration dependence of lithium diffusion coefficient in LiCoO2, Young-Il Jang, Bernd J. Neudecker, and Nancy J. Dudney, Electrochemical and Solid-State Letters, 4 (6) A74-A77 (2001).
3. Solvent diffusion model for aging of lithium-Ion battery cells, Ploehn, P Ramadass & R. White J. Ele Soc A456-A462(2004).
4. Transport Properties of LiPF6-Based Li-Ion Battery Electrolyte, L. Valoen & J. Reimers, J. Electrochem Soc., 152 (5) A882-A891 (2005).
5. Design and Simulation of Spirally-Wound, Lithium-Ion Cells Lithium-Ion Batteries: Modeling, R. Spotnitz, S. Hartridge, G. Damblanc, G. Yeduvaka, D. Schad, V. Gudimetla, J. Votteler, G. Poole, C. Lueth, C. Walchshofer, and E. Oxenham, ECS Trans. 2013 50(26): 209-218; doi:10.1149/05026.0209ecst.
6. Simulation of Electrolyte Composition Effects on High Energy Lithium-Ion Cells, R. Spotnitz, K. Gering, S. Hartridge, G. Damblanc, 224th ECS Meeting San Francisco, Oct 30, 2013.

Energy Storage R&D 210 FY 2013 Annual Progress Report
IV.C.5 Development of Computer Aided Design Tools for Automotive Batteries (EC Power)
S. Santhanagopalan, NREL Technical Monitor Subcontractor: EC Power Chrisitan E. Shaffer, Project Manager 200 Innovation Boulevard State College, PA 16803 Phone: (814) 861-6233; Fax: (814) 861-6234 E-mail: [email protected] Subcontractor: Ford Motor Company Johnson Controls, Inc. Penn State University Start Date: May 2011 Projected End Date: May 2014
Objectives
Develop an electrochemical-thermal coupled model and associated computer code for large-format, automotive Li-ion cells and packs.
Create a novel computational framework that allows for rapid and accurate performance/safety simulations. Algorithms will span across several length scales, ranging from particle size, to an electrochemical unit cell, to a 3D battery, and finally to an entire battery pack. This computational framework will be able to model both wound and stacked cell geometries.
Develop a comprehensive materials database that is critical for accurate modeling and simulation of large-format Li-ion batteries.
Test and validate the developed cell and pack models against a wide range of operating conditions relevant to automotive use, such as extreme temperature operation, complex power profiles, etc.
Technical Barriers
The large format nature of automotive Li-ion batteries presents a unique set of challenges that set them apart from the batteries used in cell phones, laptops, and other consumer goods. For example, high rates of charge and discharge, in combination with the large surface area of the cell, lead to widely varied temperature distributions on the cell and throughout the
packs. This non-uniformity causes a number of serious issues, including poor battery performance, increased degradation effects, potential safety concerns, and the inability to fully utilize the active material inside the battery. Creating actual cells and packs is time consuming and extremely expensive, which makes an efficient, high fidelity simulation tool very desirable.
However, the strongly coupled nature of electrochemical and thermal physics, the relevant scales of a battery cell or pack (ranging from sub-microns to meters), and the need for a comprehensive materials database, makes the creation and development of a Li-ion battery model a unique and challenging task.
Technical Targets
Development of an extensive database of material properties for accurate model input.
Creation of a multi-dimensional, electrochemical-thermal coupled model, complete with an easy to use, intuitive graphical user interface (GUI).
Development of fast, scalable numerical algorithms enabling near real-time simulation of batteries on a single PC, and packs with thermal management systems on a small computer cluster.
Experimental validation of the model and corresponding software.
Accomplishments
Delivered new versions of the large-format software tool, “Electrochemical-Thermal Coupled 3-Dimensional Li-ion Battery Model” (ECT3D) to partners during FY2013. Updates to software include additional safety features/capabilities, enhanced user interfaces, and upgrades based on Ford, JCI, and NREL user feedback.
Property characterization for materials database ~ 80% complete.
Cell in situ current distribution measurements at varying C-rates and temperatures complete; data used for initial validation, additional validation to be performed in final year of project.
Initial life models complete.

Shaffer – EC Power IV.C.5 Computer Aided Design Tools for Automotive Battries
FY 2013 Annual Progress Report 211 Energy Storage R&D
Demonstrated compatibility of ECT3D with Open Architecture Standard being developed by Oak Ridge National Laboratory.
Nine high-impact publications and presentations from the team in FY2013.
Introduction
In order to reduce greenhouse gas emissions and reduce U.S. dependence on foreign oil, the development of hybrid electric, electric, and plug-in electric (HEV, EV, PHEV) vehicles is extremely important. The Li-ion chemistry used in automotive batteries can store large amounts of energy, while maintaining a low weight (relative to other battery chemistries).
The design, build, and testing process for batteries and packs is extremely time consuming and expensive. EC Power’s code, ECT3D, directly addresses the issues related to the design and engineering of these cells. Many technical characteristics of batteries and packs that are critical to battery performance and safety are impossible to measure experimentally.
However, these same characteristics are easily analyzed using ECT3D in a virtual environment. The use of advanced software such as ECT3D allows the design engineer to gain unique insights into the performance of his/her system that would be inaccessible via experimental measurements. Furthermore, the analysis is done completely in a virtual environment, eliminating the need for any physical production of test cells.
Approach
EC Power is developing the large-format, Li-ion battery simulation software, ECT3D to analyze battery cells and packs for electrified vehicles (EV, PHEV, HEV). Team member Penn State University is primarily responsible for performing materials characterization experiments and diagnostic experiments for multi-dimensional validation. The materials characterization experiments will supply data for the extensive materials database being incorporated into ECT3D. Significant progress has been made, and is ongoing in this area.
Industrial partners Ford Motor Company and Johnson Controls, Inc. are currently testing and validating ECT3D to ensure its utility for industrial use. The overarching goal of the project is to produce a world-class, large-format lithium-ion cell and pack design tool that drives innovation and accelerates the design process for electric vehicles and their power systems.
Results
Figure IV - 98 and Figure IV - 97 illustrate a pack simulation investigating the effects of thermal management on cell balancing for a 2.8 kWh battery pack, consisting of a serially connected string of 12 “cell groups”; each cell group contains two cells in parallel. The pack is initially at -10°C and undergoes a 1C discharge, along with heating by warm air pre-heated to 50°C. Figure IV - 97 highlights a current imbalance, as a result of cell 1 remaining substantially colder than its parallel-connected partner, cell 2, during pack heat-up. Such current imbalance will have substantial impact on pack life, safety, and performance.
This pack simulation of 1-hr discharge took only 15 min on an 8-CPU workstation. Only a thermally coupled battery pack model is capable of capturing this type of thermally-driven cell imbalance.
Figure IV - 96: Thermal contours at t=500 sec under cold-start discharge scenario
Figure IV - 97: Current and temperature of cells #1 and #2 (group 1); cell 1: blue, cell 2: red
Figure IV - 98 illustrates some of the ongoing work on intra-cell current measurement and model validation. Specifically, Figure IV - 98 shows the measured normalized current distribution (Ilocal/Iaverage) over the length of an electrode sheet (x/L), vs. depth of discharge (DOD) for a 1C discharge current at 21°C. The results are for a cell with one positive tab and one negative tab with the tabs co-located at x/L = 0. Data for additional temperatures, C-rates, etc., have been gathered, and validation with the model is ongoing. Further details of the cell for which results are shown in Figure IV - 98 can be found in reference [9].
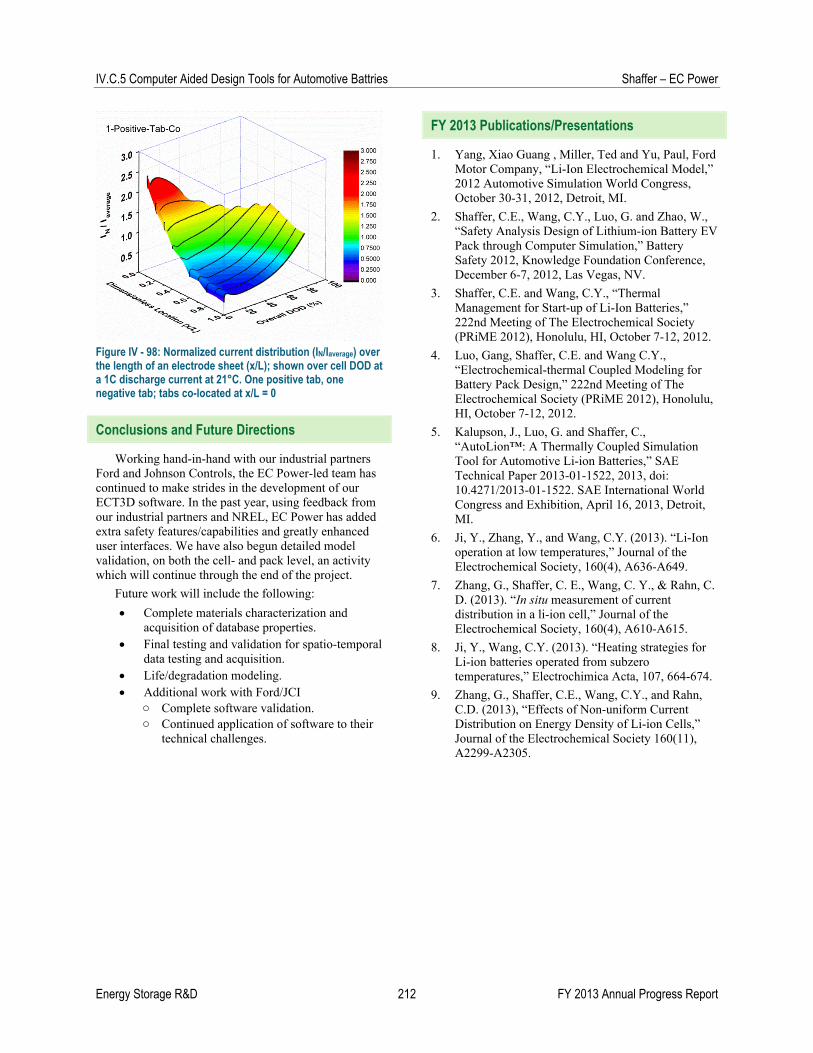
IV.C.5 Computer Aided Design Tools for Automotive Battries Shaffer – EC Power
Energy Storage R&D 212 FY 2013 Annual Progress Report
Figure IV - 98: Normalized current distribution (IN/Iaverage) over the length of an electrode sheet (x/L); shown over cell DOD at a 1C discharge current at 21°C. One positive tab, one negative tab; tabs co-located at x/L = 0
Conclusions and Future Directions
Working hand-in-hand with our industrial partners Ford and Johnson Controls, the EC Power-led team has continued to make strides in the development of our ECT3D software. In the past year, using feedback from our industrial partners and NREL, EC Power has added extra safety features/capabilities and greatly enhanced user interfaces. We have also begun detailed model validation, on both the cell- and pack level, an activity which will continue through the end of the project.
Future work will include the following:
Complete materials characterization and acquisition of database properties.
Final testing and validation for spatio-temporal data testing and acquisition.
Life/degradation modeling. Additional work with Ford/JCI
o Complete software validation. o Continued application of software to their
technical challenges.
FY 2013 Publications/Presentations
1. Yang, Xiao Guang , Miller, Ted and Yu, Paul, Ford Motor Company, “Li-Ion Electrochemical Model,” 2012 Automotive Simulation World Congress, October 30-31, 2012, Detroit, MI.
2. Shaffer, C.E., Wang, C.Y., Luo, G. and Zhao, W., “Safety Analysis Design of Lithium-ion Battery EV Pack through Computer Simulation,” Battery Safety 2012, Knowledge Foundation Conference, December 6-7, 2012, Las Vegas, NV.
3. Shaffer, C.E. and Wang, C.Y., “Thermal Management for Start-up of Li-Ion Batteries,” 222nd Meeting of The Electrochemical Society (PRiME 2012), Honolulu, HI, October 7-12, 2012.
4. Luo, Gang, Shaffer, C.E. and Wang C.Y., “Electrochemical-thermal Coupled Modeling for Battery Pack Design,” 222nd Meeting of The Electrochemical Society (PRiME 2012), Honolulu, HI, October 7-12, 2012.
5. Kalupson, J., Luo, G. and Shaffer, C., “AutoLion™: A Thermally Coupled Simulation Tool for Automotive Li-ion Batteries,” SAE Technical Paper 2013-01-1522, 2013, doi: 10.4271/2013-01-1522. SAE International World Congress and Exhibition, April 16, 2013, Detroit, MI.
6. Ji, Y., Zhang, Y., and Wang, C.Y. (2013). “Li-Ion operation at low temperatures,” Journal of the Electrochemical Society, 160(4), A636-A649.
7. Zhang, G., Shaffer, C. E., Wang, C. Y., & Rahn, C. D. (2013). “In situ measurement of current distribution in a li-ion cell,” Journal of the Electrochemical Society, 160(4), A610-A615.
8. Ji, Y., Wang, C.Y. (2013). “Heating strategies for Li-ion batteries operated from subzero temperatures,” Electrochimica Acta, 107, 664-674.
9. Zhang, G., Shaffer, C.E., Wang, C.Y., and Rahn, C.D. (2013), “Effects of Non-uniform Current Distribution on Energy Density of Li-ion Cells,” Journal of the Electrochemical Society 160(11), A2299-A2305.

FY 2013 Annual Progress Report 213 Energy Storage R&D
IV.C.6 Battery Multiscale Multidomain Framework & Modeling (NREL)
Gi-Heon Kim Senior Researcher National Reneable Energy Laboratory 1617 Cole Boulevard Golden, CO 80401 Phone: (303) 275-4437 E-mail: [email protected] Start Date: May 2011 Projected End Date: September 2014
Objectives
Continue to develop models, methods, and codes in context of the Multiscale Multidomain Framework and Modeling (MSMD), and perform multiphysics battery simulations to enhance knowledge and to help fast adoption of electric drive vehciles.
Develop an advanced option for MSMD particle domain model to address the effects of precisely contolled particulate shapes and sizes.
Technical Barriers
Significant efforts continue to be invested to improve energy-power capability and reliability of batteries by controlling particulate morphology and size, modifying particle surface, or redesigning thermodynamics. However, due to the complex nonlinear interactions across wide ranging scales, it is not straight forward to quantify such improvements for the benefits in device level response.
In conventional macro homogeneous porous electrode model approach, first suggested by Doyle et al., the active material was often assumed to be made up of spherical particles, with diffusion being the mechanism of transport of the lithium. Thanks to the self-balancing nature of LIBs, these macro-homogeneous model approaches have been successfully adopted to represent lithium-ion battery behaviors. However, this approach often suffers difficulties in properly representing complex kinetic/dynamic behavior of many practical systems.
In many practical battery systems, electrode particles are prepared in irregular shapes. However, capturing the diffusion dynamics by directly resolving
the three dimensional irregular geometry of particles is too costly to apply in device level multiscale modeling.
Technical Targets
Provide a methodology quantifying improvements from controlling particulate morphology and size, enhancing particle surface characteristics, and modifying thermodynamics as benefits in battery device level responses.
Provide an advanced particle domain model to effectively represent diffusion dynamics and transfer kinetics in complex transport and kinetics systems.
Accomplishments
Develop Discrete Particle Diffusion Model (DPDM) as an advanced option for MSMD particle domain model.
This model solves solid phase lithium diffusion dynamics and transfer kinetics in a discrete diffusion particle system.
The particles are considered electronically continuous, but ionically discrete.
An arbitrary number of quantized discrete particles can be given as a user input.
Kinetic, transport, and thermodynamic model parameters of each discrete particle can be independently determined.
Introduction
NREL has developed the MSMD model framework, which is an expandable development platform providing a pre-defined but expandable protocol and a generic and modularized flexible architecture resolving interactions among multiple physics occurring in varied length and time scales with various fidelity and complexity. NREL researchers continue to develop models (governing equations and geometries), methods (numerical/analytical solution strategies), and codes (implementation into computer program) in the context of the MSMD, and perform computer simulations to answer scientific and engineering questions to help fast market adoption of electric drive vehicles. In FY12, we focused on development of cell domain models and solution methods applicable to all major cell formats such as stack pouch and wound cylindrical/prismatic

IV.C.6 Battery Multiscale Multidomain Framework and Modeling Kim – NREL
Energy Storage R&D 214 FY 2013 Annual Progress Report
cells. The objective of the FY13 task was to develop an enhanced particle domain model, the Discrete Diffusion Particle Model.
Approach
Well-accepted porous electrode model suggested by Doyle et al. typically treats composite electrode as a homogeneous porous medium without regard to details of its particulate geometry, thus greatly simplifying numerical complexity. The active material was often assumed to be made up of spherical particles, with diffusion being the mechanism of transport of the lithium. Thanks to the self-balancing nature of lithium ion batteries (LIBs), the macro-homogeneous model approaches have been successfully adopted to represent LIB behaviors with only a few characteristic diffusion lengths. However, for better representation of complex kinetic/dynamic interactions critical in certain systems, a more advanced particle model is desired addressing kinetic, transport, and geometric particulate attributes including morphology, size distribution, surface modification, and the use of a composite of active materials. NREL has developed the DPDM for an advanced particle kinetics model as an particle-domain model option of the MSMD. The model solves solid phase lithium diffusion dynamics and transfer kinetics in a discrete diffusion particle system. The particles are considered electronically continuous, but ionically discrete. An arbitrary number of quantized discrete particles can be defined. Kinetic, transport, and thermodynamic model parameters of each discrete particle are independently determined.
The model governing equations are shown below at Eqs [1-6].
Butler-Volmer equation for charge transfer kinetics:
)(exp)(exp)()( ''
,'', s
cs
askosk RT
F
RT
Fii
[1]
)()()( '', sfilmskess URi [2]
caa
skssksseisko ccccki )()()( ,,max,
'', [3]
The Fick’s law of diffusion for solid diffusion in k-th particle:
kssks cD
t
c,
,
[4]
FD
ic
s
kξ
Aksξξ
'',
, n
[5]
The Kirchhoff’s current law for charge conservation:
kvksk
kvksk ξ
A ξ''
kξ
ξ fafaA
dAii ξ
,,,,
s,''
)ξ(
[6]
Results
Significant efforts are being invested to improve performance and life of batteries by controlling electrode particulate characteristics. Once certain electrode materials are produced by suppliers, various battery cells can be made in combination with other components for different cell design targets. After that, the cells become building blocks integrated into larger battery packs operated with different control and management strategies for varied types of electrified vehicles. Therefore, it is important to understand how the changes in physical and chemical characteristics of materials impact on system level performance and life through the complex nonlinear interactions across multiple layers of design and physics. In the present study, solid diffusion length, xs, is selected to investigate distributed particulate characteristics: 0.5 ≤ xs ≤ 5.0 [µm]; number of discrete diffusion particle: N=100; uniform weight (volume) fraction for each bin: fv,k=0.01; electrode chemistry: Lix(NCA)O2; particle geometry: 1D sphere. Other model parameters commonly used for all discrete particles are summarized in the Table IV - 16.

Kim – NREL IV.C.6 Battery Multiscale Multidomain Framework & Modeling
FY 2013 Annual Progress Report 215 Energy Storage R&D
Table IV - 16: Particle-domain model parameters
Figure IV - 99: Particle transfer current density and stoichiometry number evolution during 6-C constant current discharge (N=100)
Figure IV - 99 presents evolutions of particle bulk stoichiometry deviation (left), particle bulk stoichiometry deviation (center), from system average stoichiometry and charge transfer current density (right). During discharge, smaller particles discharge faster than larger ones. As a result, the bulk stoichiometry numbers in small particles grows higher than the system average, while large particle stoichiometry numbers lag behind the system average. Increase rate of surface stoichiometry number of large particles (which is catching up the small particle’s surface stoichiometry) slows down in the middle of discharge where equilibrium potential slope becomes flat. Particle surface stoichiometry tends to converge toward the end of discharge. As a result, small particles suffer larger depth of discharge and large particles experience larger concentration gradient. Transfer current densities are
initially identical in all different size particles. However, the magnitudes start to diverge afterward; larger particles have larger surface current density and the magnitudes keep increasing during discharge.
Figure IV - 100, particle bulk stoiciometry evolution during US06 driving cycles, shows how the environmental and design factors affect the use of active materials in batteries. Batteries made of identically prepared NCA cathode particles (distributed in size between 0.5 µm and 5 µm) were cycled to power 20 minutes of a US06 profile driving of an HEV(left), and a PHEV with 10-mile electric range (right). In the HEV applicaton, particles are cycled near the predetermined SOC range. Small particles are cycled with wider SOC window than large particles. Small particles respond more sensitively to high frequency load variation.
Domain Parameter Value/Model Particle Liy(NCA)O2 Maximum Li capacity, cs,max [mol m-3] 4.90×10⁴
Characteristic diffusion length, Rs [m] Stoichiometry at 0% SOC, x0%, y0% 0.9802 Stoichiometry at 100% SOC, x100%, y100% 0.3171
Reference exchange current density at 100% SOC, io
’’ref [A m-2] 4.0
- activation energy, oiactE [J/mol] 3.0×10⁴
Charge-transfer coefficients, αa, αc 0.5, 0.5 Film resistance, Rfilm [Ω m2] 0.015 Solid diffusion coefficient, Ds [m2 s-1] 3x10-15 - activation energy, sD
actE [J/mol] 2.0×10⁴
Positive electrode, U+ [V]
4136
2345
678910
82015exp613860805811
3691664272647745543475621566344
24681488230561522226381
. x. . - .
x. - x. x. - x. x.-
x. x. - x. x. - x. xU
0 60 120 180 240 300 360 420 480-0.2
-0.15
-0.1
-0.05
0
0.05
0.1
0.15
0.2
0.25
time [sec]
x i - x
avg
smallest particle
largest particle
0 60 120 180 240 300 360 420 4800
0.05
0.1
0.15
0.2
0.25
time [sec]
x s - x
avg
0 60 120 180 240 300 360 420 4800
1
2
3
4
5
6
7
8
time [sec]
i''

IV.C.6 Battery Multiscale Multidomain Framework & Modeling Kim – NREL
Energy Storage R&D 216 FY 2013 Annual Progress Report
Figure IV - 100: Particle stoichiometry number evolution during mid-size sedan HEV (left) and PHEV10 (right) US06 driving (N=100)
Both amplitude and frequency of stoichiometry (lithium concentration) are larger in small particles than in large particles. In PHEV10 application, particle average stoichiometry increases in initial charge depleting stage and stay around predetermined SOC during the rest of charge sustaining mode. Difference in SOC among the particles tends to increase initially and to be reduced during charge sustaining mode. Change of SOC is nearly monotonous in large particles, while SOC in small particles fluctuates. This implies that large particles respond mostly to energy demand and small particles to both power and energy demand from the system. Identical particle sets are used in significantly different patterns for different EV applications. This result emphasizes the importance of capturing such “inhomogeneity” to properly predict a battery’s long-term aging behaviors.
Conclusions and Future Directions
NREL developed the Discrete Particle Diffusion Model (DPDM) as an advanced option for an MSMD particle domain model. We demonstrated model applicability to a study quantifying the impacts of distributed characteristics of electrode particulate attributes. In many practical battery systems, electrode particles are prepared in irregular shapes and lithium transport in solid particulates and kinetics at surfaces of intricate geometry occur in complex relations. We will continue to enhance the model capability and apply it to a general procedure of identifying a reduced order representation of irregular particle electrode system.
FY 2013 Publications/Presentations
1. 2013DOE Annual Peer Review Meeting Presentation.
2. K.-J. Lee, K. Smith, A. Pesaran, G.-H. Kim, “Three dimensional thermal-, electrical-, and lectrochemical-coupled model for cylindrical wound large format lithium-ion batteries”, J. of Power Sources, 241 (2013) 20-32.

FY 2013 Annual Progress Report 217 Energy Storage R&D
IV.C.7 Lithium-Ion Abuse Model Development (NREL)
Shriram Santhanagopalan and Gi-Heon Kim National Reneable Energy Laboratory 1617 Cole Boulevard Golden, CO 80401 Phone: (303) 275-3944 E-mail: [email protected] Start Date: October 2008 Projected End Date: September 2013
Objectives
Build theoretical tools to: o assess safety of large format lithium-ion
batteries. o extend the temperature range for safe
operation at higher rates of charge/discharge – especially at low temperatures – for batteries used in vehicles.
Technical Barriers
Saftey concern for lithium-ion batteries in electric drive vehicles (EDV) is one of the major barriers to wide-spread adoption of EDVs.
The number of design parameters for lithium batteries is large and the interaction among them is complicated, so it is not feasible to experimentally identify the weakest link by conducting tests on a case-by-case basis.
Safety evaluation results for battery packs built with the same material by different manufacturers are very different. The cost associated with building and testing safety in large format cells, modules, and packs is quite high; whenever such data is collected, it is treated as proprietary, thus preventing the use of lessons learned by other battery developers.
Scaling up a battery greatly changes the response of a system developing a defect and its consequent behaviors during fault evolution.
Timely detection of fault signals in large capacity battery systems is extremely difficult.
Technical Targets
Incorporate deformation of cell components and casing into the pressure build-up models developed in FY12.
Develop electrochemical models that can reliably predict the origin of failure and the location of venting of a lithium-ion cell under pressure.
Accomplishments
Built a model for venting of individual lithium-ion cells. This model was tested with parameters from cells of different form-factors.
The model was used to analyze the safety implications for the cell choices made by the United States Army Tank Automotive Research, Development and Engineering Center (TARDEC).
Introduction
In FY13, NREL’s modeling activity to improve lithium-ion battery safety focused on correlating the failure mechanism within an individual cell (e.g., due to an internal short or decomposition of the electrolyte resulting in the formation of gaseous species) to the results observed externally when testing these cells. Testing a fully charged cell yields very different results from those of a discharged cell. For instance, when a cell is subjected to a crush test at low states of charge (SOC) (i.e., 30% or lower), the point of failure of the cell almost always coincides with the point where the external force is supplied. In a fully charged cell, however, the point of failure is typically farther from the location of crush. These differences imply that there is a difference between two cells of identical make, even when these are subjected to the same test procedure – depending on their energy content.
In order to capture such relationships between the energy content of the cells and their failure mechanism, a rigorous thermal-electrochemical model that includes the origin and distribution of pressure within the cell casing was developed. This model is an extension of the results shown in FY12 – the pressure generation due to gas generation during overcharge of a cell was previously shown as a case-study for this model. In the current effort, the mechanical strength of the casing and

IV.C.7 Lithium-Ion Abuse Model Development Santhanagopalan, Kim – NREL
Energy Storage R&D 218 FY 2013 Annual Progress Report
cell components were used to determine the location of cell venting, which eventually follows the accumulation of pressure from the abuse reactions and phase-changes. These results are significant in making the transition from developing a mechanism for abuse of individual cells to analyzing the propagation of failure from one cell to the others within the module.
Approach
The interaction between the electrochemical-thermal response and the mechanical behavior of the cell components was captured using a rigorous jump momentum balance across the interface to calculate the pressure at any given point within the cell. The following expression is a modified form of the abuse-reaction models previously reported by us in FY12:
The force, f i, experienced at any point on the
interface between two components (e.g., the electrode and the separator or the separator and the gaseous species produced by the reactions) is related to the pressure at that point Pi and to the extent of deformation tolerated by the corresponding components. The deformation is tracked using the interface velocity u.
The pressure is comprised of three terms (see Figure IV - 101):
P1
i represents the pressure build-up due to the gas generation reactions, P2
i the pressure due to expansion from evaporation of volatile components and P3
i the restrictions imposed by the mechanical deformation of the individual cell components. The pressure generation models use the first one or two terms, depending on the nature of the problem studied. The interaction between the reactions, heat generation and mechanical deformation is introduced by the use of the P3
i term,
which is computed from stress-strain measurements of the individual components.
Figure IV - 101: Illustration of the interaction between thermal, electrochemical and mechanical components of pressure-generation within a lithium-ion cell
Results
Figure IV - 102 shows the contribution of the individual factors to the overall pressure within the cell, as a function of time, when the cell is subjected to mechanical deformation. As shown, the pressure due to external deformation increases instantaneously – and remains fairly constant through the entire duration of the test. The reaction and vaporization pressures are strong functions of the energy content and temperature of the cell. As the abuse test progresses in time, the relative magnitudes of the different components changes – the deformation term which dominates the pressure value at the beginning of the test, is eventually overcome by the reaction term – at which point the pressure exceeds the threshold for failure. Thus in this instance, when a fully-charged cell is subjected to an external load, or is subjected to a hot-box test, the point of failure is determined by the location within the cell at which the total pressure value – which, as described above, is dominated by the reaction term – exceeds the failure threshold.

Santhanagopalan, Kim – NREL IV.C.7 Lithium-Ion Abuse Model Development
FY 2013 Annual Progress Report 219 Energy Storage R&D
Figure IV - 102: Contribution of the gas-generating reactions, vaporization of volatile components and the mechanical constraint imposed by the casing to the overall pressure-build-up within a lithium-ion cell: the purely mechanical terms dominate the beginning of the test, while kinetic and thermal terms take over with the progression of the abuse reactions
Incorporating this insight into a cell-level model will help improve the predictive capability of the model to determine the location of failure of the cells. For instance, Figure IV - 103 shows results from a purely mechanical approach to simulating cell failure. In this case, literature values report the point of exertion of the force to be the point of failure as well – which is true in the case of cells with no significant contributions to the pressure term from the reaction heats (i.e., only the last term on our pressure-balance equation is significant).
Similar results for a prismatic cell subjected to venting, obtained using the model equations reported above are shown in Figure IV - 104.
Figure IV - 103: Point of failure of a fully discharged cell coincides with the point of test, where as that for a fully charged cell is significantly different

IV.C.7 Lithium-Ion Abuse Model Development Santhanagopalan, Kim – NREL
Energy Storage R&D 220 FY 2013 Annual Progress Report
Figure IV - 104: NREL's cell venting simulation results show that for propagation purposes, the location of cell failure does not always coincide with the location of crush
Conclusions and Future Directions
Using a rigorous model that captures the contribution of kinetic, thermal and mechanical properties of the cell components is critical to identifying the failure mode of individual cells during abuse testing and the direction of propagation of failure within a module. Subsequent work will consider propagation mechanisms based on the understanding developed from these models.
Simultaneously, it is pertinent to develop a set of parameters from independent experiments to characterize the rate constants and transport coefficients for the abuse kinetics reactions, as well as the mechanical constants that are used in these models. Towards this end, we have started measurement of heat generation rates for the cell-components such as the cathode at different states of lithiation, the electrolyte,
and combinations thereof. These results are currently being compared with similar measurements made at the cell level, to identify the most appropriate experimental technique to measure these parameters. These results will be documented in a future report.
FY 2013 Publications/Presentations
1. Ahmad Pesaran, Shriram Santhanagopalan, and Gi-Heon Kim; “Addressing the Impact of Temperature Extremes on Large Format Li-Ion Batteries for Vehicle Applications”; Presented at 30th International Battery Seminar, Ft. Lauderdale, FL; March 11-14, 2013. NREL Report No. PR-5400-58145.
2. Ahmad Pesaran, Matt Keyser, Gi-Heon Kim, Shriram Santhanagopalan, and Kandler Smith; “Tools for Designing Thermal Management of Batteries in Electric Drive Vehicles”; Presented at the Large Lithium Ion Battery Technology & Application Symposia Advanced Automotive Battery Conference; Pasadena, CA. February 4–8, 2013. NREL Report No. PR-5400-57747.
3. Ahmad Pesaran, Gi-Heon Kim, Kandler Smith, Shriram Santhanagopalan; “Accelerating Development of EV Batteries Through Computer-Aided Engineering”; Presented at the 2012 Automotive Simulation World Congress, Detroit, MI; October 30-31, 2012.