bathymetry, acoustic backscatter, and seafloor character ...bathymetry, acoustic backscatter, and...
TRANSCRIPT

U.S. Department of the InteriorU.S. Geological Survey
Open-File Report 2014–1234
Bathymetry, Acoustic Backscatter, and Seafloor Character of Farallon Escarpment and Rittenburg Bank, Northern California


Bathymetry, Acoustic Backscatter, and Seafloor Character of Farallon Escarpment and Rittenburg Bank, Northern California
By Peter Dartnell, Guy R. Cochrane, and David P. Finlayson
Prepared in cooperation with the National Oceanic and Atmospheric Administration Open-File Report 2014–1234 U.S. Department of the Interior U.S. Geological Survey

U.S. Department of the Interior SALLY JEWELL, Secretary
U.S. Geological Survey Suzette M. Kimball, Acting Director
U.S. Geological Survey, Reston, Virginia: 2014
For more information on the USGS—the Federal source for science about the Earth, its natural and living resources, natural hazards, and the environment—visit http://www.usgs.gov or call 1–888–ASK–USGS
For an overview of USGS information products, including maps, imagery, and publications, visit http://www.usgs.gov/pubprod
To order this and other USGS information products, visit http://store.usgs.gov
Suggested citation: Dartnell, P., Cochrane, G.R., and Finlayson, D.P., 2014, Bathymetry, acoustic backscatter, and seafloor character of Farallon Escarpment and Rittenburg Bank, northern California: U.S. Geological Survey Open-File Report 2014-1234, 18 p., http://doi.dx.org/10.3133/ofr20141234.
Any use of trade, firm, or product names is for descriptive purposes only and does not imply endorsement by the U.S. Government.
Although this information product, for the most part, is in the public domain, it also may contain copyrighted materials as noted in the text. Permission to reproduce copyrighted items must be secured from the copyright owner.

iii
Contents Abstract ......................................................................................................................................................................... 1 Introduction .................................................................................................................................................................... 1
Mapping Mission ........................................................................................................................................................ 3 Tides ...................................................................................................................................................................... 3
Data Processing ......................................................................................................................................................... 5 Vessel Position and Attitude ................................................................................................................................... 5 Sound Velocity Measurements ............................................................................................................................... 5 Sonar Sounding Processing ................................................................................................................................... 5 Digital Terrain Model Production ............................................................................................................................ 5 Backscatter Image Production ................................................................................................................................ 7
Multibeam-Echosounder Survey Results ....................................................................................................................... 7 Seafloor Character........................................................................................................................................................13 Acknowledgments ........................................................................................................................................................17 References Cited ..........................................................................................................................................................17
Figures Figure 1. Map showing location of the U.S. Geological Survey multibeam echosounder survey of the Farallon Escarpment and Rittenburg Bank, northern California, 2011 ......................................................................................... 2 Figure 2. Photograph showing National Oceanic and Atmospheric Administration National Marine Sanctuary Program’s research vessel Fulmar. ............................................................................................................................... 4 Figure 3. Color shaded-relief bathymetry of the upper Farallon Escarpment and Rittenburg and Cochrane Banks generated by the U.S. Geological Survey multibeam echosounder survey, northern California, 2011. ......................... 6 Figure 4. Acoustic-backscatter imagery of the upper Farallon Escarpment and Rittenburg Bank generated by the U.S. Geological Survey multibeam echosounder survey northern California, 2011 ....................................................... 8 Figure 5. Colored shaded relief bathymetry of the Rittenburg Bank, northern California, 2011 .................................... 9 Figure 6. Acoustic-backscatter imagery of the Rittenburg Bank generated by U.S. Geological Survey multibeam echosounder survey, northern California, 2011. ......................................................................................... 10 Figure 7. Colored shaded relief bathymetry of the Cochrane Bank, northern California, 2011. .................................. 11 Figure 8. Acoustic-backscatter imagery of the Cochrane Bank, northern California, 2011 ......................................... 12 Figure 9. Plan view of seafloor character of Rittenburg Bank, northern California, 2011 ........................................... 14 Figure 10. Plan view of seafloor character of Farallon Escarpment, northern California, 2011 .................................. 15 Figure 11. Plan view of seafloor character of Cochrane Bank, northern California, 2011. ......................................... 16
Table Table 1. Reson 7111 multibeam echosounder sonar specifications. ............................................................................ 4

iv
Conversion Factors and Datums Conversion Factors Inch/Pound to SI
Multiply By To obtain
Length
foot (ft) 0.3048 meter (m)
mile (mi) 1.609 kilometer (km)
Area square mile (mi2) 259.0 hectare (ha)
square mile (mi2) 2.590 square kilometer (km2)
Datums Horizontal coordinate information is referenced to the North American Datum of 1983 (NAD 83). Tide values exported from the tide station were referenced to the North American Vertical Datum of 1988 (NAVD88).

1
Bathymetry, Acoustic Backscatter, and Seafloor Character of Farallon Escarpment and Rittenburg Bank, Northern California
By Peter Dartnell, Guy R. Cochrane, and David P. Finlayson
Abstract In 2011, scientists from the U.S. Geological Survey’s Coastal and Marine Geology Program
acquired bathymetry and acoustic-backscatter data along the upper slope of the Farallon Escarpment and Rittenburg Bank within the Gulf of the Farallones National Marine Sanctuary offshore of the San Francisco Bay area. The surveys were funded by the National Oceanic and Atmospheric Administration’s Deep Sea Coral Research and Technology Program to identify potential deep sea coral habitat prior to planned sampling efforts. Bathymetry and acoustic-backscatter data can be used to map seafloor geology (rock, sand, mud), and slope of the sea floor, both of which are useful for the prediction of deep sea coral habitat. The data also can be used for the prediction of sediment and contaminant budgets and transport, and for the assessment of earthquake and tsunami hazards. The surveys were conducted aboard National Oceanic and Atmospheric Administration’s National Marine Sanctuary Program’s 67-foot-long research vessel Fulmar outfitted with a U.S. Geological Survey 100-kHz Reson 7111 multibeam-echosounder system. This report provides the bathymetry and backscatter data acquired during these surveys, interpretive seafloor character maps in several formats, a summary of the mapping mission, maps of bathymetry and backscatter, and Federal Geographic Data Committee metadata.
Introduction In 2011, U.S. Geological Survey (USGS) Coastal and Marine Geology Program team members,
in cooperation with the National Oceanic and Atmospheric Administration (NOAA), mapped along the upper slope of the Farallon Escarpment and Rittenburg Bank located within the Gulf of the Farallones National Marine Sanctuary. Prior to 2011, high-resolution habitat maps did not exist for Rittenburg Bank or the Farallon Escarpment. Additionally, little is known about deep sea coral (DSC) distribution and abundance on the continental shelf and slope of the United States West Coast. To address some of these biological issues and to discover new regions that may be candidates for Essential Fish Habitat protection, NOAA Deep Sea Coral Research and Technology Program (DSCRTP) initiated a 3-year program (2010–12) to study West Coast DSC ecosystems. A main goal of the research was to identify areas most likely to have habitat suitable for deep-sea corals and sponges, to characterize and map these habitats, and to collect information that could be integrated into a review of groundfish Essential Fish Habitat. The multibeam data revealed highly detailed images of several significant underwater geologic features, including rocky banks and canyon features in these areas.

2
The area surveyed is located about 65 km west of the entrance to San Francisco Bay and about 30 km southwest of Point Reyes (fig. 1). The main Farallon Islands are located 10 km to the east. This newly mapped region encompasses a diverse physiography in water depths ranging from about 78 to 870 m (256 to 2,854 ft) and includes featureless and moderate relief seafloor along the outer shelf and slope, as well as the heads of numerous gullies along the upper Farallon Escarpment. A new area of moderate-relief seafloor was identified along the outer shelf during this survey (here called Cochrane Bank) and is considered an additional rocky feature of interest for DSC habitat (fig. 1). The moderate relief of Rittenburg and Cochrane Banks have high backscatter intensities, while the surrounding low-relief seafloor has a complex pattern of low and high backscatter. The heads of the gullies along the upper slope have high backscatter intensities, but this may be partially because of the increased slope of the seafloor. These data are used as basemap information for a seafloor character map showing the distribution of rock, mixed substrate, and soft sediment.
Figure 1. Map showing location of the U.S. Geological Survey multibeam echosounder survey of the Farallon Escarpment and Rittenburg Bank, northern California, 2011. Maps in this report are portrayed in Universal Transverse Mercator, Zone 10, North American Datum of 1983 coordinate system. Colors show shallower (red) to deeper (purple) depths. Range of depths is 78–870 m (256–2,854 ft.). Gray background bathymetry and topography from National Geophysical Data Center, Central California 1-arc second Digital Elevation Model.

3
These new data and interpretive maps can be used to help understand the geology and habitats of the outer shelf and upper slope. Detailed bathymetric and acoustic-backscatter data provide important information regarding seafloor substrate and marine habitats, sediment transport pathways, slope stability, and potential submarine landslide hazards. This report provides the 2011 USGS bathymetry and backscatter data, the seafloor character maps in several digital formats, and a summary of the mapping mission, maps of bathymetry, backscatter, seafloor character, and Federal Geographic Data Committee (FGDC) metadata.
Mapping Mission Multibeam mapping took place over 16 days from September 6 through September 21, 2011
(U.S. Geological Survey field activity F-01-11-NC), using a 100 kHz Reson 7111 multibeam echosounder. The 7111 is a horseshoe shaped sonar that was mounted on the 67-foot-long NOAA National Marine Sanctuary Program’s research vessel Fulmar (fig. 2) and affixed to a hull brace. The multibeam system receives acoustic returns from 101, 201, or 301 beams depending on the setting. Individual beams are 1.9° along-track and 1.5° across-track, providing a combined 150° swath at maximum. Table 1 provides the sonar system specifications. Differentially Corrected Global Positioning System (DGPS) navigational data were passed through a CodaOctopus F190 inertial measurement unit (IMU) to the sonar hardware and data collection software. The R/V Fulmar was outfitted with three networked workstations and a navigation computer for use by the captain and survey crew for data collection and initial processing.
The mapping mission collected bathymetry and acoustic-backscatter data over two regions, including 158 km2 (61 mi2) of the upper Farallon Escarpment and 22.5 km2 (8.7 mi2) of Rittenburg Bank in water depths ranging from 78 to 870 m (256–2,854 ft) (fig. 1).
Tides Nearshore multibeam surveys can take advantage of geodetic control from shore-based Global
Positioning System (GPS) base stations broadcasting real-time kinematic (RTK) corrections via UHF frequencies. This survey, however, was conducted farther offshore, outside the range of UHF radio coverage. Therefore, depth values during the survey were based on tidal datums. Tidal corrections from the San Francisco Golden Gate tide station (9414290) were used along with time and height offsets from the Southeast Farallon Island subordinate station (9414262). Twenty-nine minutes were added to the San Francisco tide station values (average of -39 minutes for high tide and -19 minutes for low tide) and 0.04 m were subtracted from the San Francisco tide station values (average of -0.09 m at high tide and 0.0 m at low tide). Tide values exported from the tide station were referenced to the North American Vertical Datum of 1988 (NAVD88). There is a 0.018 m vertical difference between the NAVD88 datum (1.804 m) and the Mean Lower Low Water (MLLW) datum (1.822 m) at the Golden Gate station (http://tidesandcurrents.noaa.gov/datums.html?units=1&epoch=0&id=9414290&name=San+Francisco&state=CA).

4
Figure 2. Photograph showing National Oceanic and Atmospheric Administration National Marine Sanctuary Program’s research vessel Fulmar. Photograph from http://www.sanctuarysimon.org/regional_sections/fulmar/.
Table 1. Reson 7111 multibeam echosounder sonar specifications (http://www.reson.com/products/seabat/seabat-7111).
Sonar
Reson-7111
Frequency
100 kiloHertz
Beams
101, 201 equal angle or 301 equal distance
Swath Minimum depth Maximum depth Typical depth Pulse length
150 degrees coverage (7.5 × depth) 3 meters 1,000 meters 900 meters 0.08–3.04 milliseconds

5
Data Processing
Vessel Position and Attitude The R/V Fulmar was equipped with a CodaOctopus F190 inertial motion unit (IMU) for the
duration of the survey. The F190 received DGPS-aided positional navigation from dual Trimble model 4000 DGPS receivers, and commercial C-Nav satellite differential stations. The DGPS data were combined with the inertial vessel motion measurements (pitch, roll, heading, and heave) directly within the F190 hardware so that high-precision position and attitude corrections were fed in real time to the sonar acquisition equipment.
Sound Velocity Measurements Sound velocity measurements were collected continuously with an Applied Micro Systems
Micro sound velocimeter (SV) deployed on the transducer frame for real-time sound velocity adjustments at the transducer-water interface. The Micro SV is accurate to ±0.03 m/s. Additionally, water column sound velocity profiles (SVP) were collected approximately every 2 hours throughout each survey day with an Applied Micro Systems, SvPlus 3472. This instrument provided sound-velocity measurements by using invar rods with a sound-velocity accuracy of ±0.06 m/s. Pressure was measured by a semiconductor bridge strain gauge to an accuracy of 0.15 percent (500 dbar, full scale) and temperature was measured by thermistor with an accuracy of 0.05° C (Applied Microsystems, Ltd., 2005).
Sonar Sounding Processing DGPS data and measurements of vessel motion were combined in the F190 hardware to produce
a high-precision vessel attitude packet. This packet was transmitted to the PDS2000 acquisition software in real time and combined with instantaneous sound velocity measurements at the transducer head before each ping. The returned samples were projected to the seafloor using a ray-tracing algorithm working with the previously measured sound-velocity profiles in the PDS2000 software. Finally, the processed data were stored line-by-line as Reson S7K files.
Digital Terrain Model Production CARIS HIPS and SIPS (version 7.1.1 Service Pack 3) bathymetry processing software was used
to clean and bin the raw bathymetry. Processed S7K files were imported to CARIS and field sheets were created within CARIS to encompass both the deeper Farallon Escarpment and the shallower Rittenburg Bank areas. Survey lines were filtered to remove obvious erroneous soundings and soundings towards the noisier outer beams and then added into the appropriate field sheet. CARIS base surfaces were created for each field sheet at 2 and 10 m resolutions using the CUBE surface type. The 2 m base surface included the shallow Rittenburg Bank region, while the 10-m base surface included the deep Farallon Escarpment area. The finalized base surfaces were then exported as ASCII XYZ files (x coordinate, y coordinate, depth) in World Geodetic System of 1984 (WGS 84, G1150) coordinates relative to the NAVD88. These data were gridded in Fledermaus (QPC) software (Version 7.1) at 2 and 10 m resolutions, and the resulting surfaces were converted to ASCIIRaster format files and imported

6
into a Geographic Information System (ESRI, ArcMap). Grids were projected horizontally to the North American Datum of 1983 (CORS96) using the ESRI “WGS_1984_(ITRF00)_To_NAD_1983 (CORS96)” function in ArcTools. Finally, an illumination having an azimuth of 300° and 45° above horizontal was applied to the bathymetry grids to create the shaded relief imagery of the Farallon Escarpment and Rittenburg Bank (fig. 3). All these bathymetric surfaces are in the online Data Catalog available for download at http://pubs.usgs.gov/ofr/2014/xxxx. Note that the USGS collects bathymetric data for scientific purposes only. The USGS does not guarantee that full bottom search has been achieved and the data have not been inspected for dangers to navigation.
Figure 3. Color shaded-relief bathymetry of the upper Farallon Escarpment and Rittenburg and Cochrane Banks generated by the U.S. Geological Survey multibeam echosounder survey, northern California, 2011. Colors show depth shallow (red) to deep (purples). Range of depths is 78–870 m (256–2,854 ft.). Gray background shaded-relief bathymetry from National Geophysical Data Center, Central California 1-arc second Digital Elevation Model.

7
Backscatter Image Production The multibeam-echosounder backscatter data were processed using the Fledermaus (version
7.3.2) integration of Geocoder. Caris HDCS line files were exported as GSF line files and imported into Fledermaus along with the corresponding original Reson S7K files. Adjustments were made to the line files including TX/RX (transmit/receive) power gain, beam pattern, and adaptive angle-varying gain corrections. The line files were then mosaicked into 2 m resolution (Rittenburg Bank) and 10 m resolution (Farallon Escarpment) images. The images were then exported as georeferenced TIFF images, imported into a Geographic Information System (GIS), and converted to GRIDs at 2 and 10 m resolutions. The grids were projected horizontally from WGS 84 coordinates to NAD 83 (CORS96) coordinates using the ESRI “WGS_1984_(ITRF00)_To_NAD_1983 (CORS96)” function in ArcTools. Lastly, the GRIDs were exported as geoTIFF images (fig. 4).
In the backscatter imagery, brighter tones indicate higher backscatter intensity, and darker tones indicate lower backscatter intensity. The intensity represents a complex interaction between the acoustic pulse and the seafloor, as well as characteristics within the shallow subsurface, providing a general indication of seafloor texture and composition. Backscatter intensity depends on the acoustic source level; the frequency used to image the seafloor; the beam grazing angle; the composition and character of the seafloor, including grain size, water content, bulk density, and seafloor roughness; and the amount and type of biological cover. Harder and rougher bottom types, such as rocky outcrops or coarse sediment, typically return stronger intensities (high backscatter, lighter tones), whereas softer bottom types, such as fine sediment, return weaker intensities (low backscatter, darker tones).
Multibeam-Echosounder Survey Results The 2011 USGS multibeam-echosounder survey collected bathymetry (fig. 3) and acoustic
backscatter data (fig. 4) along 37 km of the upper Farallon Escarpment covering 158 km2 (61 mi2) and Rittenburg Bank covering 22.5 km2 (8.7 miles2). Water depths of the entire mapped region range from about 78 to 870 m (256 to 2,854 ft). The newly mapped region shows Rittenburg Bank in fine detail (fig. 5). Water depths of the Bank range from about 78 to 110 m (256 to 361 ft). The eastern boundary of the Bank gently rises from a depth of about 110 m of the surrounding sediment to about 80 m in the center of the outcrop. The southwestern boundary of the outcrop ends abruptly along a northwest-southeast trending line. A couple of larger pinnacles along the southwestern boundary have as much as 35 m of relief. Acoustic-backscatter imagery (fig. 6) reveals that the higher relief of Rittenburg Bank has higher backscatter intensities than most of the surrounding seafloor. Acoustic-backscatter intensities also are high, beyond the Bank on lower-relief seafloor to the south (A in fig. 6). This region is likely low-relief seafloor composed of harder material, such as a mixture of boulders, cobbles, and coarser sands. Even though the bathymetry shows the surrounding seafloor is almost featureless, the backscatter imagery reveals a complex pattern of low and high intensities. This pattern may be created by fine sediments with low backscatter intensities migrating over coarse sediment deposits that may include large-scale bedforms (for example, sand waves). These sediment-filled scour depressions resemble the “rippled scour depressions” of Cacchione and others (1984) and Davis and others (2013) or the “sorted bedforms” of Murray and Thieler (2004), Goff and others (2005), and Trembanis and Hume (2011).

8
Figure 4. Acoustic-backscatter imagery of the upper Farallon Escarpment and Rittenburg Bank generated by the U.S. Geological Survey multibeam echosounder survey northern California, 2011. Brighter tones are higher backscatter intensity and darker tones are lower backscatter intensity.

9
Figure 5. Colored shaded relief bathymetry of the Rittenburg Bank, northern California, 2011. Colors show shallower (red) to deeper (purple) depths. Range of depths is about 78–110 m (256–361 ft).

10
Figure 6. Acoustic-backscatter imagery of the Rittenburg Bank generated by U.S. Geological Survey multibeam echosounder survey, northern California, 2011. Brighter tones are higher backscatter intensity and darker tones are lower backscatter intensity.

11
The upper slope of the Farallon Escarpment includes the heads of 22 gullies (fig. 3). These gullies likely served as conduits carrying sediment off the shelf and into offshore basins. These gullies are largely inactive during sea level high stands, but become active during low stands when the shoreline is at the shelf edge.
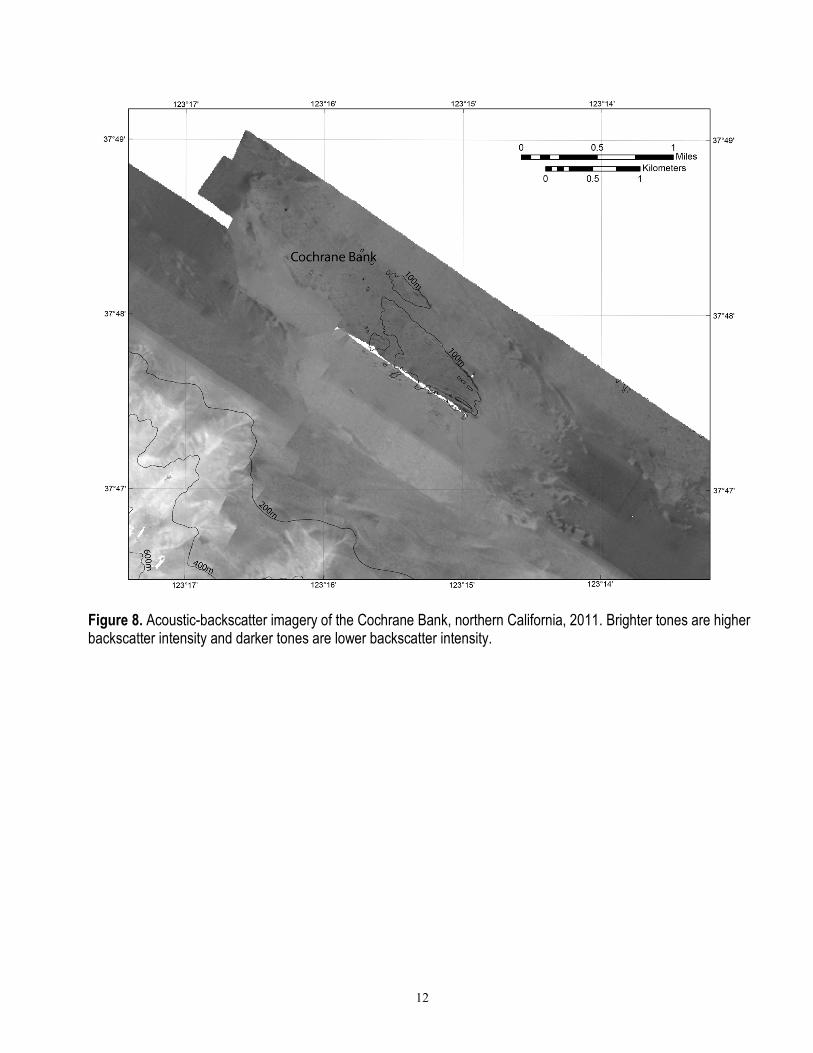
The Farallon Escarpment mapped region reveals a previously unmapped bank along the outer shelf (here called Cochrane Bank) (figs. 7 and 8). Cochrane Bank is an elongated, northwest–southeast trending bathymetric high with up to 15 m of local relief. The bank has an overall length of 3.5 km (northwest to southeast) and a width of more than 900 m (northeast to southwest).
Figure 7. Colored shaded relief bathymetry of the Cochrane Bank, northern California, 2011. Colors show shallower (red) to deeper (purple) depths.
12
Figure 8. Acoustic-backscatter imagery of the Cochrane Bank, northern California, 2011. Brighter tones are higher backscatter intensity and darker tones are lower backscatter intensity.

13
Seafloor Character The new bathymetry and acoustic-backscatter data are used to produce a seafloor character map
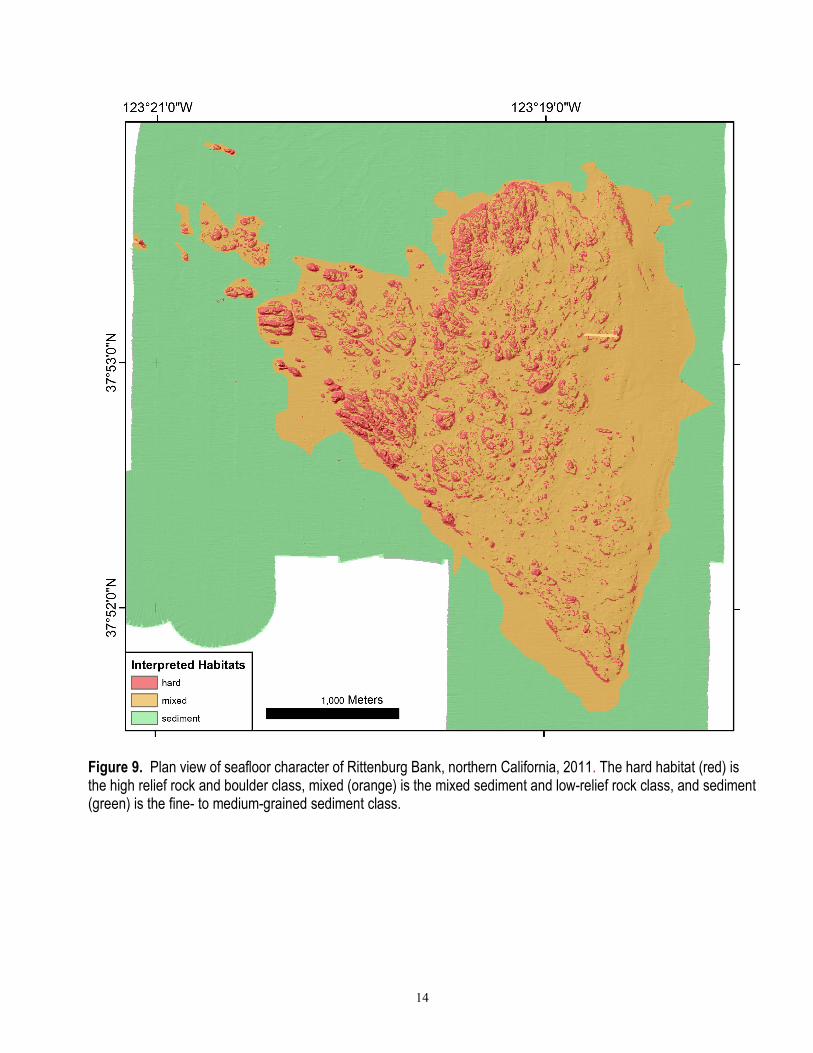
as defined by Cochrane (2008). Three seafloor classes are distinguished in this methodology; fine- to medium-grained sediment, mixed sediment and low-relief rock, and high relief rock and boulder. The two variants used in this classification are backscatter intensity and vector ruggedness, which is a standard calculation performed with the NOAA benthic-terrain modeler (available at http://www.csc.noaa.gov/digitalcoast/tools/btm/; accessed March 4, 2013), using a 3 × 3 pixel array of bathymetry. Vector ruggedness was separated into two classes and the classified ruggedness was combined in a GIS with hand-delineated areas of high backscatter intensity to produce the three classes of seafloor characterization raster images (figs. 9–11).
The primary use of the seafloor character classification was the identification of potential DSC habitat. Hard substrate and high relief are emphasized in the seafloor character classification and both are important components of DSC habitat. Areas of potential high relief and hard bottom were identified on Rittenburg Bank, the Farallon Escarpment, and the newly discovered Cochrane Bank.
In the Rittenburg Bank area, 0.7 km2 of potential high relief rock and boulder habitat and 3.4 km2 of potential mixed coarse sediment and low relief rock habitat were identified by the classification (fig. 9). In the Farallon Escarpment area, the seafloor character classification identified 6.1 km2 of potential high relief rock and boulder bottom and 1.0 km2 of potential mixed coarse sediment and low-relief rock habitat (fig. 10). The Cochrane Bank component of the Farallon Escarpment included 0.4 km2 of potential high-relief rock and boulder habitat and 3.3 km2 of potential mixed coarse sediment and low-relief rock habitat (fig. 11).
14
Figure 9. Plan view of seafloor character of Rittenburg Bank, northern California, 2011. The hard habitat (red) is the high relief rock and boulder class, mixed (orange) is the mixed sediment and low-relief rock class, and sediment (green) is the fine- to medium-grained sediment class.

15
Figure 10. Plan view of seafloor character of Farallon Escarpment, northern California, 2011. The hard habitat (red) is the high relief rock and boulder class, mixed (orange) is the mixed sediment and low-relief rock class, and sediment (green) is the fine- to medium-grained sediment class.

16
Figure 11. Plan view of seafloor character of Cochrane Bank, northern California, 2011. The hard habitat (red) is the high relief rock and boulder class, mixed (orange) is the mixed sediment and low-relief rock class, and sediment (green) is the fine- to medium-grained sediment class.

17
Acknowledgments This project was funded by the National Oceanic and Atmospheric Administration’s Deep Sea
Coral Research and Technology Program and the U.S. Geological Survey. Thanks to the U.S. Geological Survey, Pacific Coastal and Marine Science Center internal reviewers for technical, metadata, and website edits and suggestions.
References Cited Applied Microsystems Ltd., 2005, SVplus sound velocity, temperature, and depth profiler user's
manual, revision 1.23: Sidney, B.C., Canada, 39 p. Cacchione, D.A., Drake, D.E., Grant, W.D., and Tate, G.B., 1984, Rippled scour depressions of the
inner continental shelf off central California: Journal of Sedimentary Petrology, v. 54, p. 1,280–1,291. Cochrane, G.R., 2008, Video-supervised classification of sonar data for mapping seafloor habitat, in
Reynolds, J.R., and Greene, H.G., eds., Marine habitat mapping technology for Alaska: Fairbanks, University of Alaska, Alaska Sea Grant College Program, p. 185–194, available at http://doc.nprb.org/web/research/research%20pubs/615_habitat_mapping_workshop/Individual%20Chapters%20High-Res/Ch13%20Cochrane.pdf.
Davis, A.C.D., Kvitek, R.G., Mueller, C.B.A., Young, M.A., Storlazzi, C.D., and Phillips, E.L., 2013, Distribution and abundance of rippled scour depressions along the California Coast: Continental Shelf Research, v. 69, p. 88–100.
Goff, J.A., Mayer, L.A., Traykovski, P., Buynevich, I., Wilkens, R., Raymond, R., Glang, G., Evans, R.L., Olson, H., and Jenkins, C., 2005, Detailed investigations of sorted bedforms or “rippled scour depressions,” within the Martha’s Vineyard Coastal Observatory, Massachusetts: Continental Shelf Research, v. 25, p. 461–484.
Murray, B., and Thieler, E.R., 2004, A new hypothesis and exploratory model for the formation of large-scale inner-shelf sediment sorting and “rippled scour depressions”: Continental Shelf Research, v. 24, no. 3, p. 295–315.
Trembanis, A.C., and Hume, T.M., 2011, Sorted bedforms on the inner shelf off northeastern New Zealand—Spatiotemporal relationships and potential paleo-environmental implications: Geo-Marine Letters, v. 31, p. 203–214.

18
This page left intentionally blank

Publishing support provided by the U.S. Geological SurveyPublishing Network, Menlo Park and Tacoma Publishing Service Centers
For more information concerning the research in this report, contact the U.S. Geological Survey Pacific Science Center 400 Natural Bridges Drive Santa Cruz, CA 95060 http://walrus.wr.usgs.gov/

Dartnell and others—Bathym
etry, Acoustic Backscatter, of Farallon Escarpment and Rittenburg Bank, N
orthern California—Open-File Report 2014–1234
ISSN 2331-1258 (online)http://dx.doi.org/10.3133/ofr20141234