batch to real-time: incremental data collection ... · batch to real-time: incremental data...
TRANSCRIPT
Batch to Real-Time: Incremental Data Collection & Analytics Platform
Ahmet Arif Aydin University of Colorado Boulder
Kenneth M. Anderson University of Colorado Boulder
Abstract Real-time data collection and analytics is a
desirable but challenging feature to provide in data-intensive software systems. To provide highly concurrent and efficient real-time analytics on streaming data at interactive speeds requires a well-designed software architecture that makes use of a carefully selected set of software frameworks. In this paper, we report on the design and implementation of the Incremental Data Collection & Analytics Platform (IDCAP). The IDCAP provides incremental data collection and indexing in real-time of social media data; support for real-time analytics at interactive speeds; highly concurrent batch data processing supported by a novel data model; and a front-end web client that allows an analyst to manage IDCAP resources, to monitor incoming data in real-time, and to provide an interface that allows incremental queries to be performed on top of large Twitter datasets.
1. Introduction
Every day, large amounts of data are generated by a variety of computational systems. It is important for an organization to have tools that can manage these large data sets while also providing real-time analytics on streaming data. Thus, organizations must struggle with the design of data-intensive software systems [15, 17].
We are a team of software engineering researchers working on Project EPIC at the University of Colorado [20] on a research area known as crisis informatics. Project EPIC studies how members of the public make use of social media during times of crisis [21, 22]; crisis informatics software collects and analyzes the information generated on social media during times of mass emergency. To conduct research in crisis informatics, we have been collecting and analyzing large Twitter data sets since Fall 2009. We face significant challenges storing billions of tweets and processing them such that they can be efficiently browsed, annotated, and analyzed [4].
We have previously reported on EPIC Collect [1, 2, 24], Project EPIC’s Twitter data collection
infrastructure, and the design challenges we faced in producing a production software system within a collaborative, multidisciplinary research project. We have also reported on EPIC Analyze [3], the data analysis environment we built to allow Project EPIC analysts to browse, search, sample, filter, sort, and annotate large Twitter data sets. EPIC Analyze is focused on the batch processing of crisis data after a crisis event is over. Now, we need to collect and analyze crisis data in real-time during a crisis event.
In this paper, we report on the Incremental Data Collection & Analytics Platform (IDCAP); it is a new data analytics platform that addresses certain limitations of EPIC Collect and EPIC Analyze that prevented them from providing real-time analytics over Project EPIC’s datasets. The IDCAP thus provides a way to transition Project EPIC from batch-oriented style data processing to real-time data collection and analytics. The IDCAP is a robust, reliable, fault tolerant and 24/7 available data collection and analytics platform. The IDCAP collects tweets via the Twitter Streaming API and stores tweets in Cassandra in an incremental and scalable fashion; it is able to provide greatly improved and significantly faster batch data analysis on previously collected Twitter data sets while also providing real-time analytics on streaming crisis data. Furthermore, the IDCAP is an example of a data-intensive software system that provides insight into the types of techniques and technologies that must be combined to implement such systems and ensure that they are scalable, reliable, and efficient [7].
This paper is organized as follows. In Section 2, we discuss the design challenges of data intensive software systems. In Section 3, we discuss the design of the IDCAP and discuss its front-end application, the IDCA App, in Section 4. In Section 5, we present our evaluation and then discuss related work in Section 6. In Section 7, we conclude with our contributions. 2. Design Challenges
The design of data intensive software systems introduces many challenges. The primary challenges are 1) identifying a proper software architectural
5911
Proceedings of the 50th Hawaii International Conference on System Sciences | 2017
URI: http://hdl.handle.net/10125/41876ISBN: 978-0-9981331-0-2CC-BY-NC-ND
design for the system to handle the velocity of streaming data in a 24/7, reliable, fault tolerant, and scalable fashion [14, 19]; 2) incrementally indexing data streams in real-time to provide real-time data analysis and creating an indexing schema for later batch analytics; and 3) handling the volume of data by permanently storing incrementally indexed data in a scalable fashion in a persistent store to support batch data processing and analysis [4].
The design of software architecture is paramount [12, 23] because it explicitly impacts not only operational properties such as performance, reliability, and availability, but also quality attributes of a system such as changeability, reusability, and maintainability [13, 18]. The software architecture of a system provides a view of a system’s components, the way those components interact, and their responsibilities [10, 16]. Therefore, using the right set of technologies allows one to meet the design goals of the system and provides efficient generation of metrics and statistics and fast exploratory analysis on large datasets [3]. The rise of big data has triggered the demand for a scalable data analytics software architecture and a flexible data processing infrastructure to handle diverse and various analysis requests in real-time and later in the batch processing of large amounts of data. In our own research, finding a unifying software architecture that contains the right set of components and data models to achieve these goals has taken years of experimentation and iterative design. The IDCAP is our most recent attempt at achieving this goal; it outperforms our previous efforts significantly.
With respect to indexing, capturing data in real-time in a scalable and highly concurrent fashion without losing any information is a challenging task [8]. There are two difficult challenges related to indexing data streams in real-time. The first is what data structure can be used to store data such that a global index is created that is capable of answering the
types of questions that analysts ask. This structure must be one that allows for efficient queries but also efficient inserts of new information into the index to allow for real-time data analysis. The second challenge is how can such an index be generated in an incremental fashion? Most techniques that operate in real-time divide the streaming data into short windows of time. The challenge then is to generate a mini-index of all tweets received in the last window, update all active metrics/queries, and then merge this mini-index into the global index before the next window of time is processed. We present IDCAP’s approach to these indexing challenges below.
A third challenge of designing a data model that allows for the efficient storage and batch processing of large amounts of data is not addressed in this paper. We explain our approach to this third challenge in detail in [7]. In this paper, we focus exclusively on the work we performed to enable real-time analysis of streaming social media data during times of crisis. There are, of course, additional challenges beyond the ones mentioned above; for instance, data intensive software systems require well-designed user interfaces to facilitate access to large data sets and to allow users to search, filter, sort, query, and analyze that data [3, 6, 9]. While we encountered these challenges when creating the IDCAP, we do not discuss them here.
3. The Software Architecture of the IDCAP
In this section, we present the design and
implementation of the IDCAP. Project EPIC’s existing data collection software system—EPIC Collect—was not designed to provide rich support for data analytics. The design goal of the IDCAP is to address this concern via the creation of a new data model, discussed in [7], and a new set of software services that implement the IDCAP. The IDCAP handles the scalable and reliable storage of streaming Twitter data (as EPIC Collect does now) but also provides the ability to perform real-time data analysis on incoming tweets as well as greatly improved and significantly faster batch data analysis on previously collected datasets. While we focus on Twitter data due to Project EPIC’s needs, our techniques easily generalize to other problem domains and types of data.
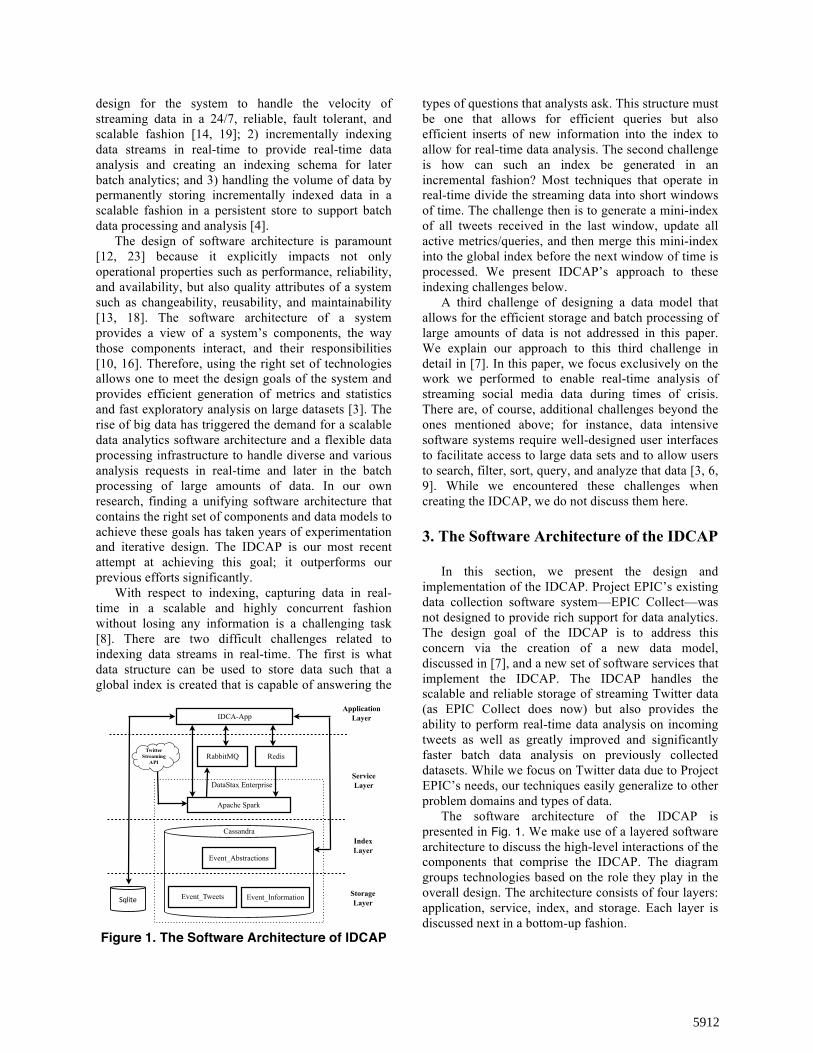
The software architecture of the IDCAP is presented in Fig. 1. We make use of a layered software architecture to discuss the high-level interactions of the components that comprise the IDCAP. The diagram groups technologies based on the role they play in the overall design. The architecture consists of four layers: application, service, index, and storage. Each layer is discussed next in a bottom-up fashion.
IDCA-AppApplication
Layer
Service Layer
Index Layer
Storage Layer
RabbitMQ Redis
Apache Spark
Event_InformationEvent_Tweets
Event_Abstractions
Cassandra
DataStax Enterprise
Twitter Streaming
API
Sqlite
Figure 1. The Software Architecture of IDCAP
5912
3.1. Storage Layer
The storage layer consists of both NoSQL and relational database technologies; in the prototype implementation of the IDCAP, we specifically make use of Cassandra and Sqlite. Cassandra is used to store Twitter data sets while Sqlite is used to store information by IDCAPs front-end web app.
One of the requirements for conducting research in crisis informatics is to make use of the right database to achieve reliable and scalable data storage. To find the database that meets Project EPIC’s needs, various relational and NoSQL databases were explored including MySQL, MongoDB, HBase, Solr/Lucene, and Cassandra. Cassandra was selected for the IDCAP because: (1) Cassandra automatically partitions data across a cluster, eliminating issues encountered when trying to scale relational databases, and (2) Cassandra provides reliability via its support for replication [24].
The IDCAP makes use of Cassandra’s default partitioning strategy, the Murmur3Partitioner. This strategy was chosen to uniformly distribute data across a cluster and to avoid the performance problems that can be introduced by the use of Cassandra’s random partitioning strategy. Moreover, to provide availability and accessibility, the replication factor for the IDCAP for our three-node cluster was set to three. This setting tells Cassandra to ensure that each node has a complete copy of the data stored in our datasets; this also ensures that our cluster can respond to client requests even if two of the three nodes are down.
Finding the right data model for a given problem domain is critical to achieve fast and efficient queries [6, 9]. The storage layer of the IDCAP contains the Event_Tweets and Event_Information column families; these column families are discussed in detail in [7]. For the purposes of this paper, it is sufficient to know that Event_Tweets stores tweets in a scalable fashion, storing large Twitter datasets by dividing the tweets into rows of twenty thousand tweets each. This allows the row size in the column family to stay near 100 MB, which is the size that Cassandra recommends for best performance for retrieving rows efficiently. Our rows make use of Twitter’s integer tweet id as column names to ensure that tweets are sorted automatically by creation date in ascending order. Event_Information maintains metadata about each collected crisis event and provides summary information about events stored in Event_Tweets. For instance, it is possible to get a list of all keywords used to collect data for a given event in a single call. These two column families serve as the foundation for the index layer which allows the IDCAP to provide real-time analytics over the collected datasets.
3.2. Index Layer
Creating a proper mechanism to incrementally index large data sets while collecting data in real-time is an important and challenging task. A well-designed indexing mechanism plays a key role in enabling real-time analytics and provides benefits to the analysis of large data sets via batch processing as well.
The index layer provides an indexing schema on top of Project EPIC’s large datasets via a novel design of the Event_Abstraction column family; this column family is explained in detail in [7] and is “designed for analytics.” It provides indexes and high level abstractions for Twitter datasets that are stored in Event_Tweets and it was designed based on the domain attributes that are of highest interest to Project EPIC analysts including event names, data collection dates, tweet collection keywords, and unique tweet ids. In all cases, the Event_Abstraction column family allows queries based on these attributes to be performed efficiently; it does this by storing the tweet ids that match or contain a particular attribute of interest. For instance, if an analyst wants to locate all tweets that contain the keyword hurricane, the IDCAP looks up a particular row and column in Event_Abstractions that returns a hashtable that contains keyword/tweet id associations. Retrieving the value associated with hurricane in this hashtable, provides a set of row_key/column references that indicate which tweets in Event_Tweets contain that keyword. Using this system, any query that simply needs to return a count of matching tweets can do so immediately by counting the number of tweet references stored for the attribute of interest. Otherwise, the query completes by fetching the indicated tweets stored in Event_Tweets and returning them to the caller. With this new design, Project EPIC analysts will be able to filter, search, sample, sort, and perform exploratory analytics efficiently on large Twitter datasets using IDCAP. This analysis is currently supported in the IDCAPs front-end web app—the IDCA App—and will eventually be integrated into a future version of EPIC Analyze [3]. The IDCA App is discussed in Section 4. 3.3. Service Layer
The service layer of the IDCAP consists of DataStax Enterprise (DSE), RabbitMQ, and Redis. Each technology and its purpose within the IDCAP is discussed next. This layer is the extension point for integrating new technologies into the IDCAP to implement new functionality.
5913
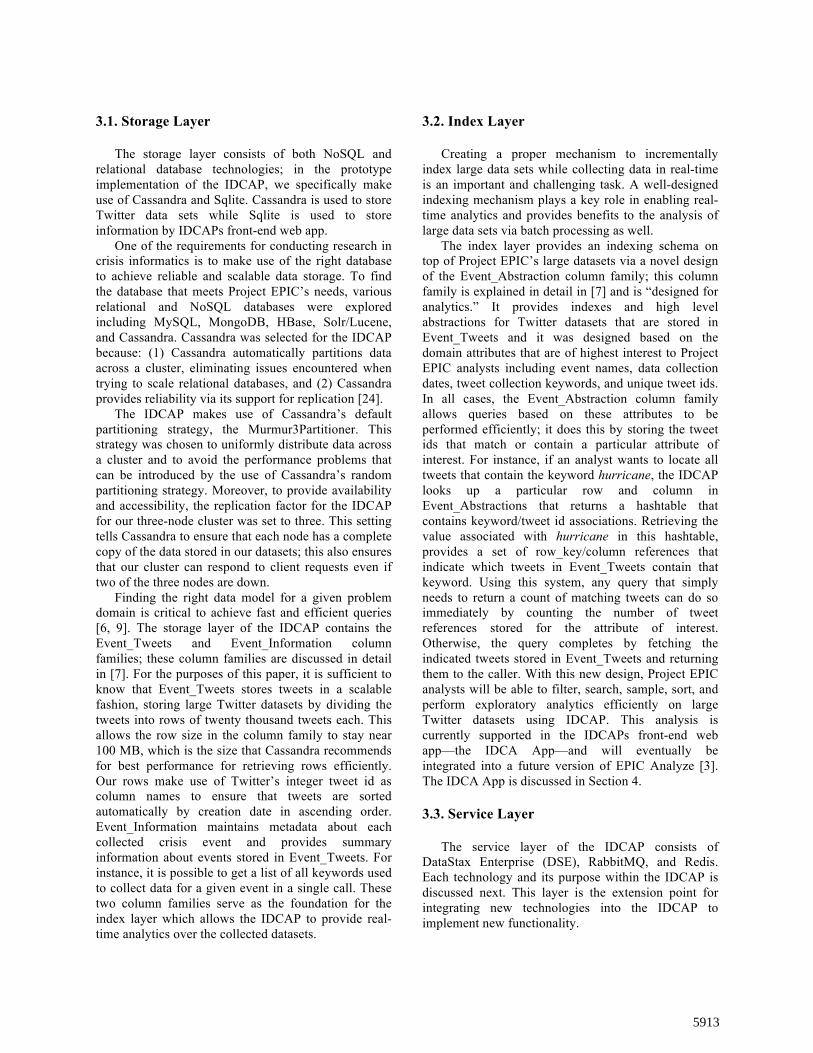
The IDCAP make use of DSE since it provides a collection of open source Apache technologies that have been integrated to work with Cassandra; for instance, Spark and Pig have been modified to read from and write to Cassandra column families instead of the Hadoop Distributed File System (HDFS). Moreover, DSE’s integrations allow multiple technologies to work together including Pig, Spark, and Solr. For the prototype implementation of the IDCAP, a three node DSE Cluster was configured and deployed in an OpenStack environment (see Fig. 2).
In the IDCAP’s DSE cluster, DSE 4.7.3 is used; this version is deployed with Cassandra 2.1 and Spark 1.2.2. Each DSE node is configured as an OpenStack virtual machine that makes use of the CentOS operating system. Each OpenStack instance was configured to have its own extended volume to store data; each such volume was created to avoid data loss in the case of operating system crashes, problems with the OpenStack software, or hardware-related crashes.
3.3.1. Apache Spark & Spark Streaming. Spark is a fast and general purpose distributed computing platform. Spark provides a straightforward way to parallelize computations across a cluster; its API hides the complexity of distributed systems programming, network communication, and fault tolerance. Spark extends the MapReduce model in order to support more types of computations including interactive queries and stream processing. The Spark technology stack consists of Spark Core, Spark Streaming, Spark SQL, MLlib, and GraphX. Spark Core provides the functionalities of task scheduling, memory management, fault recovery, and interacting with storage systems. Spark Streaming allows RDDs to be created from streaming data sources. Spark internally creates streams that consist of a series of RDDs (Spark’s primary data structure) and provides an API to transform/process each RDD that consists of data received from the source of streaming data.
DSE Spark Streaming
Twitter Streaming
APIRdd1, Rdd2, ... DSE Spark
Engine
DStreams
RabbitMQ
Figure 3. DSE Spark Streaming
In the IDCAP, the Spark streaming component is used to stream public tweets from Twitter (see Fig. 3). Our spark streaming script is written in Python and makes use of the Pyspark module. The streaming script
performs its task via the following steps: 1) create a unique set of event keywords by getting the active event keywords stored in Redis (see Table. I; this information is managed by the IDCA App, discussed in Section 4); 2) creating a spark streaming context; 3) submitting keywords to the Twitter Streaming API via a POST HTTP request; 4) collecting RDDs that contain multiple Tweet JSON objects to the Spark master; 5) filtering out any responses that are not tweets; 6) classifying each of the remaining tweets based on the event keywords to associate a particular tweet with one or more data collection events; 7) creating RabbitMQ messages for each classified tweet; 8) inserting the messages created in step 7 into RabbitMQ queues (discussed below); 9) and repeating steps 3 through 8 until a stop request is received.
We carefully configured our DSE Spark cluster and extensively tested the implementation of our streaming script to provide reliable, robust, efficient, and 24/7 Twitter data collection. In particular, we configured some of the following parameters to help achieve the performance exhibited by the IDCAP prototype: 1) setting the batch interval time to 2 seconds; 2) setting the spark.streaming.unpersist property to automatically delete a persisted stream from memory when they are not used anymore; this setting is needed since Spark streams are persisted in memory by default; and 3) setting spark.cleaner.ttl property to 300 seconds to periodically clean memory since the default is infinite which is not conducive to 24/7 data collection.
3.3.2. RabbitMQ. RabbitMQ is an open source message queuing service that provides reliable, durable, and persistent message queues. It provides an API that allows multiple clients concurrently to insert messages into queues and retrieve messages from queues. The IDCAP makes use of RabbitMQ to provide a set of durable and persistent queues that are used to receive tweets from the Twitter Streaming API via the work of the spark streaming script discussed above. For each event collected, the spark streaming script will create one queue in RabbitMQ. These queues are used to temporarily store incoming tweets before they are permanently stored in Cassandra by the IDCAP persistence script (discussed below). These queues thus serve as a buffer in a producer-consumer relationship between the streaming script and the persistence script allowing the two to work independently of each other and to shield each other from errors that might occur in the other.
3.3.2. Redis. Redis is a key-value in-memory database; it provides a rich API over a well-known set of data structures such as sets, lists, and dictionaries. Redis stores data in memory by default; on the other hand, Redis can also persist data permanently onto disk as well by configuring its appendonly attribute
DSE Cluster
Cassandra Master Node
Cassandra Node 2
Cassandra Node 3
Spark Master
Spark WorkerSpark Worker
Figure 2. DSE Cluster (Cassandra + Spark)
5914
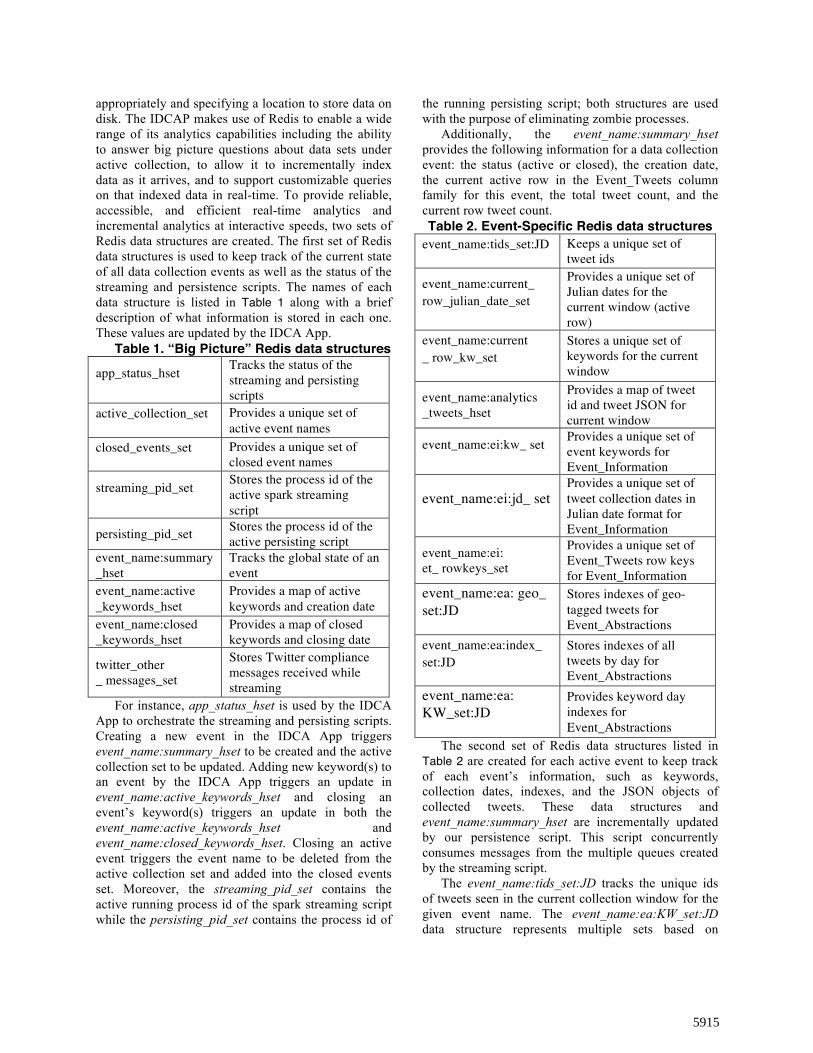
appropriately and specifying a location to store data on disk. The IDCAP makes use of Redis to enable a wide range of its analytics capabilities including the ability to answer big picture questions about data sets under active collection, to allow it to incrementally index data as it arrives, and to support customizable queries on that indexed data in real-time. To provide reliable, accessible, and efficient real-time analytics and incremental analytics at interactive speeds, two sets of Redis data structures are created. The first set of Redis data structures is used to keep track of the current state of all data collection events as well as the status of the streaming and persistence scripts. The names of each data structure is listed in Table 1 along with a brief description of what information is stored in each one. These values are updated by the IDCA App.
Table 1. “Big Picture” Redis data structures
app_status_hset Tracks the status of the streaming and persisting scripts
active_collection_set Provides a unique set of active event names
closed_events_set Provides a unique set of closed event names
streaming_pid_set Stores the process id of the active spark streaming script
persisting_pid_set Stores the process id of the active persisting script
event_name:summary_hset
Tracks the global state of an event
event_name:active _keywords_hset
Provides a map of active keywords and creation date
event_name:closed _keywords_hset
Provides a map of closed keywords and closing date
twitter_other _ messages_set
Stores Twitter compliance messages received while streaming
For instance, app_status_hset is used by the IDCA App to orchestrate the streaming and persisting scripts. Creating a new event in the IDCA App triggers event_name:summary_hset to be created and the active collection set to be updated. Adding new keyword(s) to an event by the IDCA App triggers an update in event_name:active_keywords_hset and closing an event’s keyword(s) triggers an update in both the event_name:active_keywords_hset and event_name:closed_keywords_hset. Closing an active event triggers the event name to be deleted from the active collection set and added into the closed events set. Moreover, the streaming_pid_set contains the active running process id of the spark streaming script while the persisting_pid_set contains the process id of
the running persisting script; both structures are used with the purpose of eliminating zombie processes.
Additionally, the event_name:summary_hset provides the following information for a data collection event: the status (active or closed), the creation date, the current active row in the Event_Tweets column family for this event, the total tweet count, and the current row tweet count. Table 2. Event-Specific Redis data structures
event_name:tids_set:JD Keeps a unique set of tweet ids
event_name:current_ row_julian_date_set
Provides a unique set of Julian dates for the current window (active row)
event_name:current _ row_kw_set
Stores a unique set of keywords for the current window
event_name:analytics _tweets_hset
Provides a map of tweet id and tweet JSON for current window
event_name:ei:kw_ set Provides a unique set of event keywords for Event_Information
event_name:ei:jd_ set Provides a unique set of tweet collection dates in Julian date format for Event_Information
event_name:ei: et_ rowkeys_set
Provides a unique set of Event_Tweets row keys for Event_Information
event_name:ea: geo_ set:JD
Stores indexes of geo-tagged tweets for Event_Abstractions
event_name:ea:index_ set:JD
Stores indexes of all tweets by day for Event_Abstractions
event_name:ea: KW_set:JD
Provides keyword day indexes for Event_Abstractions
The second set of Redis data structures listed in Table 2 are created for each active event to keep track of each event’s information, such as keywords, collection dates, indexes, and the JSON objects of collected tweets. These data structures and event_name:summary_hset are incrementally updated by our persistence script. This script concurrently consumes messages from the multiple queues created by the streaming script.
The event_name:tids_set:JD tracks the unique ids of tweets seen in the current collection window for the given event name. The event_name:ea:KW_set:JD data structure represents multiple sets based on
5915
multiple events keywords (KW) and tweet collection dates (JD). For example, assume a test event collects on two keywords colorado and boulder on two days—2016001 and 2016002—for the current collection window. Then, four sets are created to keep track of the tweets collected on those days for those keywords: test:ea:colorado_set:2016001, test:ea:colorado_set:2016002, test:ea:boulder_set:2016001, test:ea:boulder_set:2016002.
As new tweets come in on 2016002 (the second day of the year 2016), they will be assigned to the correct set by the persistence script. To efficiently make use of the Redis data structures, defining the right window size is critical. This value determines the amount of data that will be stored in Redis (and therefore in memory) for each event. The window size has a direct impact on the goal of providing analytics in near real-time at interactive speeds. The window size we selected is the last 20 thousand tweets received from Twitter, which corresponds to the length that was selected for the size of rows in the Event_Tweets column family. This decision means that we are never asking the persistence script to insert more tweets into Cassandra than its maximum recommended row size.
The persistence script first pulls tweets from RabbitMQ and places them in Redis and then when the window size is reached, flushes the tweets captured for the current window into the Event_Tweets, Event_Abstraction, and Event_Information column families. Given the above information, the high-level responsibilities of the persistence script are now clear. For each active event, it subscribes to the corresponding queue in RabbitMQ; it gets notified by RabbitMQ when a tweet has arrived in the queue; it dequeues the tweet, checks to see if the tweet is unique (by consulting with the event_name:tids_set of the current Julian day in Redis); it stores all unique tweets into a batch until 256 tweets are in the batch and then stores them into the current row of Event_Tweets for that event; it then updates the Redis data structures related to Event_Information and Event_Abstractions, so they are ready to respond to queries; it then loops and performs these steps again until the window size of 20 thousands tweets total has been reached, it then flushes the Event_Information and Event_Abstractions information to Cassandra. It continues to do this until it is told to shutdown by the IDCA App.
When an active event is closed, first, the IDCA App updates the events data structures listed in Table 1; then the persistence script consumes all possible tweets of the event stored in RabbitMQ, updates all event-related data structures listed in Table 2, performs a final update of the Event_Information and Event_Abstractions indexes, and then deletes the event’s Redis-related data structures to release resources (i.e. memory) for future events.
4. IDCA App
The IDCA App—a Ruby on Rails web application—was developed to orchestrate the IDCAP and its resources. The IDCA App provides a user-friendly UI that allows analysts to focus on their analysis tasks without having to worry about the complex orchestration of IDCAP components going on in the background. The IDCA App sits on top of the IDCAP architecture and provides the following features: a) it allows analysts to efficiently create/update/close events and their keywords, b) it orchestrates the streaming and persistence scripts, c) it allows analysts to monitor streaming tweets in real-time, and d) it displays event metrics to analysts by providing customizable queries on the streaming data at interactive speeds. The IDCA App provides this functionality via three tabs: Process & Event Manager, Real-Time Monitoring, and Incremental Analytics.
The Process & Event Manager allows analysts to manage events. Creating a new event triggers the creation of the event_name:summary_hset data structure in Redis. Adding keywords to an event updates the related Redis data structures listed in Table 1. Furthermore, the IDCA App provides a process manager to manage the streaming and persistence scripts discussed in Section 3.
When an analyst makes a change to an event, the streaming script needs to be stopped and then restarted. Currently, this is done manually via a button. When this button is clicked, the spark streaming process is gracefully disconnected from Twitter and then stopped after all existing Twitter data has been deposited into the relevant RabbitMQ message queues. The user can then click on the Resume Streaming button to have the streaming script started again; it will then reconnect to Twitter using the updated event information and resume collecting data once again.
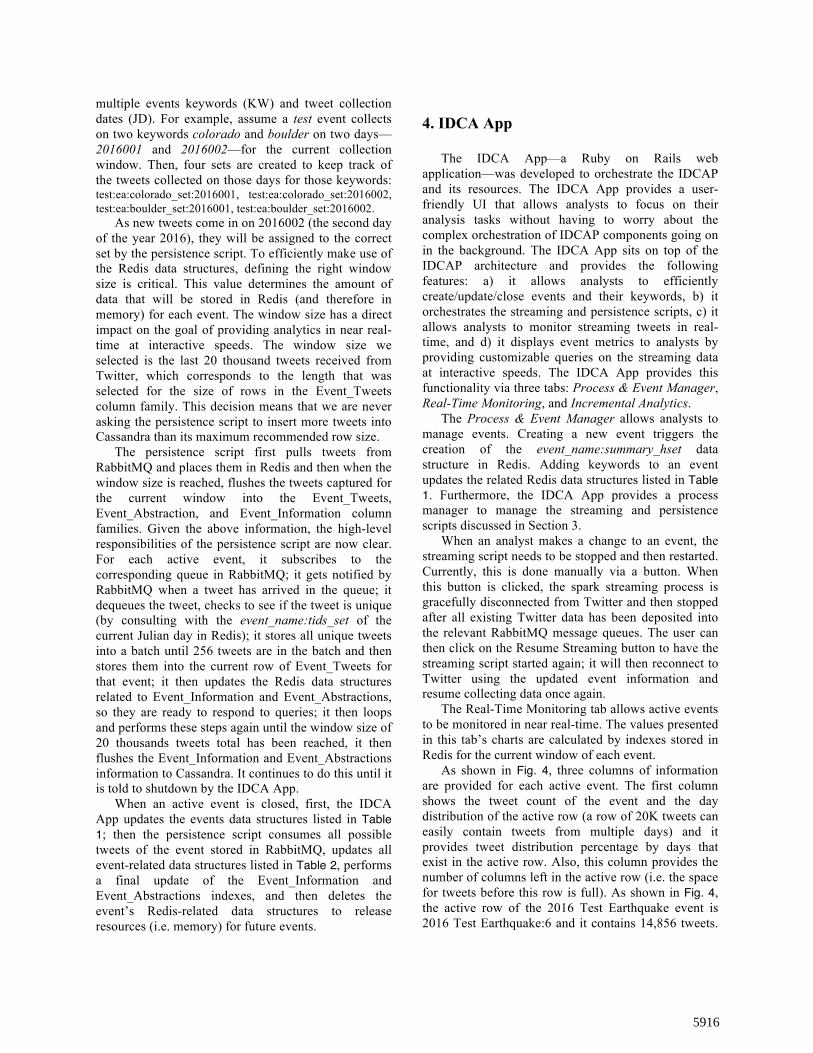
The Real-Time Monitoring tab allows active events to be monitored in near real-time. The values presented in this tab’s charts are calculated by indexes stored in Redis for the current window of each event.
As shown in Fig. 4, three columns of information are provided for each active event. The first column shows the tweet count of the event and the day distribution of the active row (a row of 20K tweets can easily contain tweets from multiple days) and it provides tweet distribution percentage by days that exist in the active row. Also, this column provides the number of columns left in the active row (i.e. the space for tweets before this row is full). As shown in Fig. 4, the active row of the 2016 Test Earthquake event is 2016 Test Earthquake:6 and it contains 14,856 tweets.
5916
This row contains tweets that were collected on the following days: 2016120, 2016121 and 2016122. Also, 25.7 percent of columns are left before this row is considered full and a new active row is created.
The second column shows keyword distribution of tweets that are collected on the last day of the event in real-time. As shown in Fig. 4, 2,424 tweets have been collected on the last current day (2016122) of the 2016 Test Earthquake event and the tweet distribution chart is based on seven keywords. The last column displays maps of the geo-tagged tweets that exist in the events active row. As shown in Fig. 4, the 2016 Test Earthquake event contains 33 geo-tagged tweets stored in the 2016 Test Earthquake:6 row of Event_Tweets.
The Incremental Analytics tab provides analysts with a user interface to incrementally process queries on the entire set of tweets for an event including all tweets stored for the event in Cassandra as well as all tweets stored in Redis for the current window of real-time data collection. The logic of IDCAP’s support for incremental analytics applies a query on both the tweets in the current window (via real-time calculations) and the previously collected tweets of an event (via batch processing). After completing a query request, the results of both the real-time analysis and the batch processing are shown in a unified view.
In the Incremental Analytics tab, the first step is to
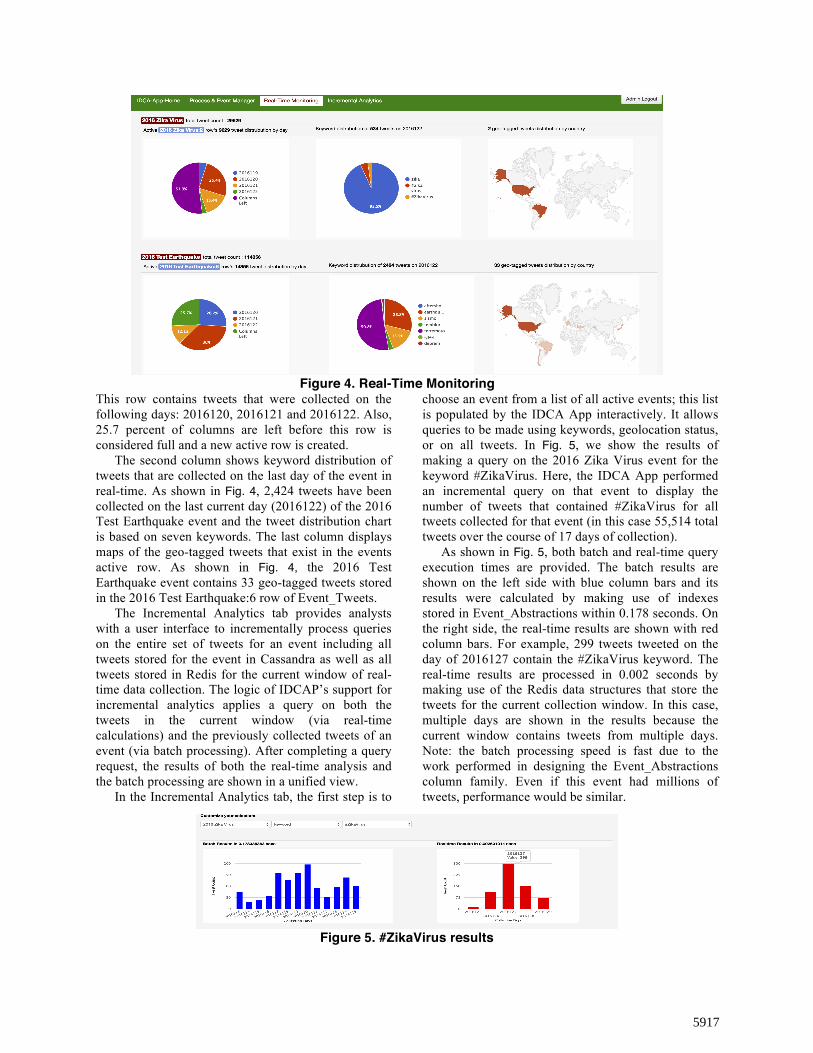
choose an event from a list of all active events; this list is populated by the IDCA App interactively. It allows queries to be made using keywords, geolocation status, or on all tweets. In Fig. 5, we show the results of making a query on the 2016 Zika Virus event for the keyword #ZikaVirus. Here, the IDCA App performed an incremental query on that event to display the number of tweets that contained #ZikaVirus for all tweets collected for that event (in this case 55,514 total tweets over the course of 17 days of collection).
As shown in Fig. 5, both batch and real-time query execution times are provided. The batch results are shown on the left side with blue column bars and its results were calculated by making use of indexes stored in Event_Abstractions within 0.178 seconds. On the right side, the real-time results are shown with red column bars. For example, 299 tweets tweeted on the day of 2016127 contain the #ZikaVirus keyword. The real-time results are processed in 0.002 seconds by making use of the Redis data structures that store the tweets for the current collection window. In this case, multiple days are shown in the results because the current window contains tweets from multiple days. Note: the batch processing speed is fast due to the work performed in designing the Event_Abstractions column family. Even if this event had millions of tweets, performance would be similar.
Figure 4. Real-Time Monitoring
Figure 5. #ZikaVirus results
5917
5. Evaluation
An example of the IDCAP’s support for real-time tweet monitoring and incremental analytics are provided in Section 4. These features are not supported at all by Project EPIC’s previous systems. In this section, the exploratory batch data processing capability of the IDCAP is evaluated with respect to EPIC Analyze (which makes use of Apache Solr for most of its capabilities) and EPIC Collect. The IDCAP, EPIC Collect, and Apache Solr each provide their own indexing mechanism and their batch data processing steps were explained in detail in [7].
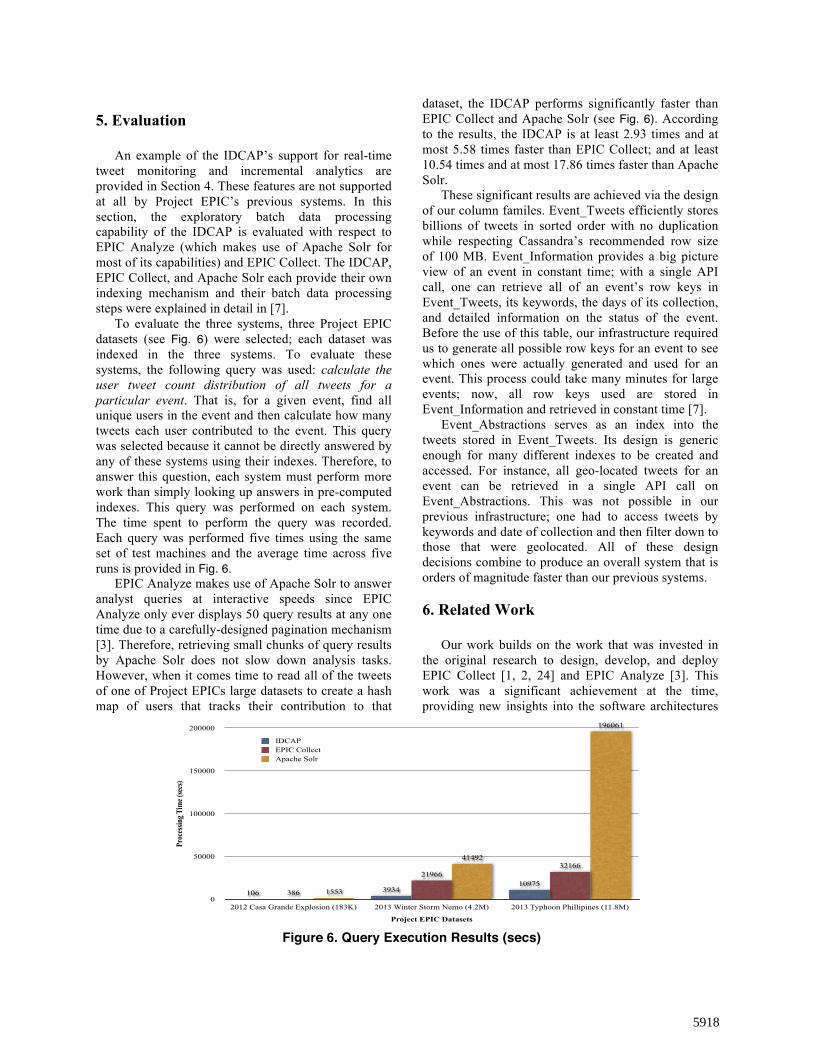
To evaluate the three systems, three Project EPIC datasets (see Fig. 6) were selected; each dataset was indexed in the three systems. To evaluate these systems, the following query was used: calculate the user tweet count distribution of all tweets for a particular event. That is, for a given event, find all unique users in the event and then calculate how many tweets each user contributed to the event. This query was selected because it cannot be directly answered by any of these systems using their indexes. Therefore, to answer this question, each system must perform more work than simply looking up answers in pre-computed indexes. This query was performed on each system. The time spent to perform the query was recorded. Each query was performed five times using the same set of test machines and the average time across five runs is provided in Fig. 6.
EPIC Analyze makes use of Apache Solr to answer analyst queries at interactive speeds since EPIC Analyze only ever displays 50 query results at any one time due to a carefully-designed pagination mechanism [3]. Therefore, retrieving small chunks of query results by Apache Solr does not slow down analysis tasks. However, when it comes time to read all of the tweets of one of Project EPICs large datasets to create a hash map of users that tracks their contribution to that
dataset, the IDCAP performs significantly faster than EPIC Collect and Apache Solr (see Fig. 6). According to the results, the IDCAP is at least 2.93 times and at most 5.58 times faster than EPIC Collect; and at least 10.54 times and at most 17.86 times faster than Apache Solr.
These significant results are achieved via the design of our column familes. Event_Tweets efficiently stores billions of tweets in sorted order with no duplication while respecting Cassandra’s recommended row size of 100 MB. Event_Information provides a big picture view of an event in constant time; with a single API call, one can retrieve all of an event’s row keys in Event_Tweets, its keywords, the days of its collection, and detailed information on the status of the event. Before the use of this table, our infrastructure required us to generate all possible row keys for an event to see which ones were actually generated and used for an event. This process could take many minutes for large events; now, all row keys used are stored in Event_Information and retrieved in constant time [7].
Event_Abstractions serves as an index into the tweets stored in Event_Tweets. Its design is generic enough for many different indexes to be created and accessed. For instance, all geo-located tweets for an event can be retrieved in a single API call on Event_Abstractions. This was not possible in our previous infrastructure; one had to access tweets by keywords and date of collection and then filter down to those that were geolocated. All of these design decisions combine to produce an overall system that is orders of magnitude faster than our previous systems.
6. Related Work
Our work builds on the work that was invested in the original research to design, develop, and deploy EPIC Collect [1, 2, 24] and EPIC Analyze [3]. This work was a significant achievement at the time, providing new insights into the software architectures
0
50000
100000
150000
200000
2012 Casa Grande Explosion (183K) 2013 Winter Storm Nemo (4.2M) 2013 Typhoon Phillipines (11.8M)
196061
41492
1553
3216621966
38610975
3934106
Proc
essin
g Tim
e (se
cs)
Project EPIC Datasets
IDCAPEPIC CollectApache Solr
Figure 6. Query Execution Results (secs)
5918
required to make data-intensive software systems reliable and scalable and tackling the initial thorny work that was required to identify a data model that supports those characteristics for the reliable collection of large Twitter datasets. We now discuss related work.
In [19], a software architecture for collecting and analyzing geospatial and semantic information from Twitter data was described. The tweets were consumed by a Twitter4j Java application and then transferred into a PostgreSQL database using the PostGIS spatial extension. Wordnet and Solr were used to relate tweets together if those tweets share the same meaning. The tweets are then made available by a Django web application, using GeoDjango for geospatial queries and the Haystack API for semantic queries. The goal of this infrastructure was to search for tweets via semantic keywords and coordinates, and export the results via a map or CSV file. The focus of [19] is on a particular domain-independent analysis technique and not with supporting the entire analysis life cycle for crisis informatics research. In contrast to their work, we store the entire JSON object of collected tweets in Cassandra in a way that allows us to answer all deep queries related to the entire tweet object.
In [5], a software architecture for the analysis of cloud-based data streams is proposed. The proposed architecture’s aim is to support system management of large enterprise data centers for cloud based infrastructures and to analyze the data collected to glean useful information about the state of the system. Our work shares the same goal of storing, processing, and analyzing large amounts of information but the type of information is different. In [5], the work focuses on system monitoring by keeping system related information stored in HDFS and HBase clusters and analyzing them using MapReduce jobs generated by programs written using Apache Pig. We focus instead on crisis data sets. We do, however, make use of similar techniques; for instance, our work on ISM [6] sorts tweets using MapReduce jobs generated by the DataStax Enterprise version of Apache Pig which can read/write data stored in Cassandra.
In [11], an Emergency Situation Awareness-Automated Web Text Mining (ESA-AWTM) platform was presented; it is designed for crisis coordinators in Australia. The goal of this system is to identify situational awareness information from tweets generated during the response phase of crisis events. The ESA-AWTM platform’s interface allows users to monitor and refresh alerts related to queries of interest. The Burst Detector/Alert Monitor interface provides stylized words to visualize incident status based on statistical models. The Cluster visualizer summarizes situational awareness information from streamed tweets by using the Carrot Clustering engine and Solr.
Support Vector Machines are trained to detect high-value messages such as infrastructure damage. We share the same goals of designing systems for emergencies. We would like to provide the types of queries provided by ESA-AWTM in our future work. 7. Conclusions
In this paper, we reported on a novel software infrastructure called the Incremental Data Collection and Analytics Platform. We have shown how various data analytics frameworks such as Cassandra, Spark, Redis, and RabbitMQ can be efficiently deployed together in support of real-time data collection and analytics. The IDCAP can incrementally index streaming data in real-time and perform real-time data analytics on the current collection window at interactive speeds. Furthermore, the IDCA App was developed to efficiently make use of the IDCAP. The IDCA App provides a user interface for analysts to orchestrate the IDCAP to stream, persist, and monitor tweets in real-time. The IDCA App provides incremental analytics that allows analysts to perform their queries in real-time at interactive speeds without worrying about big data collection and analytics related challenges.
To conclude, developing the IDCAP requires software engineering skills to trade one class of technology for another, and it involves determining the proper architectural style that supports data analytics using both real-time and batch processing techniques. Although the IDCAP was applied to Twitter datasets and the domain of crisis informatics, our design techniques can be applied to other application domains and datasets to provide scalable and incremental storage and analytics more broadly. Therefore, this work represents a contribution to software engineering with respect to software architecture design and technology trade-offs and a prototype infrastructure for transitioning from batch data processing to real-time data collection that other software engineering researchers can use in their own work when making use of columnar NoSQL data stores. References [1] Anderson, K. M., and Schram, A. Design and implementation of a data analytics infrastructure in support of crisis informatics research (nier track). In 33rd International Conference on Software Engineering, May 2011, pp. 844–847.
[2] Anderson, K. M., Schram, A., Alzabarah, A., and Palen, L. Architectural implications of social media analytics in support of crisis informatics research. IEEE Bulletin of the Technical Committee on Data Engineering, vol. 36, no. 3, pp.
5919
13–20, September 2013.
[3] Anderson, K. M., Aydin, A. A., Barrenechea, M., Cardenas, A., Hakeem, M., and Jambi, S. Design challenges/solutions for environments supporting the analysis of social media data in crisis informatics research. In 48th Hawaii International Conference on System Sciences, January 2015, pp. 163–172.
[4] Anderson, K. M. Embrace the challenges: Software engineering in a big data world. In First International Workshop on Big Data Software Engineering, Part of the 2015 International Conference on Software Engineering, May 2015, pp. 19–25.
[5] Andreolini, M., Colajanni, M., and Tosi, S. A software architecture for the analysis of large sets of data streams in cloud infrastructures. In 11th International Conference on Computer and Information Technology, pp. 389–394, 2011.
[6] Aydin, A. A., and Anderson, K. M. Incremental sorting for large dynamic data sets. In First International Conference on Big Data Computing Service and Applications, pp. 170–175, March+April 2015.
[7] Aydin, A. A. Incremental data collection & analytics the design of next-generation crisis informatics software. Ph.D. dissertation, University of Colorado, 106 pages, 2016.
[8] Barlow, M. Real-Time Big Data Analytics: Emerging Architecture. O’Reilly, 2013.
[9] Barrenechea, M., Anderson, K. M., Aydin, A. A., Hakeem, M., and Jambi, S. Getting the query right: User interface design of analysis platforms for crisis research. In 2015 International Conference on Web Engineering, pp. 547–564, June 2015.
[10] Bosch, J. Software architecture: The next step. In Proc. Software Architecture: First European Workshop, EWSA 2004, pp. 194–199, 2004.
[11] Cameron, M. A., Power, R., Robinson, B., and Yin, J. Emergency situation awareness from twitter for crisis management. In Proc. of the 21st International Conference on World Wide Web Companion, pp. 695–698, 2012.
[12] Garlan, D., and Shaw, M. An introduction to software architecture. Tech. Rep., 1994.
[13] Garlan, D. Software architecture: A roadmap. In Proc. of the Conference on The Future of Software Engineering, pp. 91–101, 2000.
[14] Han, L., Potter, S., Beckett, G., Pringle, G., Welch, S., Koo, S.-H., Wickler, G., Usmani, A., Torero, J. L., and Tate A. Firegrid: An e-infrastructure for next-generation
emergency response support. J. Parallel Distrib. Comput., vol. 70, no. 11, pp. 1128–1141, November 2010.
[15] Hang, Y. and Fong, S. Real-time business intelligence system architecture with stream mining. In Digital Information Management (ICDIM), 2010 Fifth International Conference on, July 2010, pp. 29–34.
[16] Hinsman, C., Sangal, N., and Stafford, J. Achieving agility through architecture visibility. Architectures for Adaptive Software Systems. pp. 116–129, 2009.
[17] Jarr, S. Fast Data and The New Enterprise Data Architecture. O’Reilly, 2015.
[18] Mattsson, M., Grahn, H., and Mårtensson, F. Software architecture evaluation methods for performance, maintainability, testability, and portability. Second International Conference on the Quality of Software Architectures, 2006.
[19] Oussalah, M., Bhat, F., Challis, K., and Schnier, T. A software architecture for twitter collection, search and geolocation services. Knowledge-Based Systems, vol. 37, pp. 105–120, January 2013.
[20] Palen, L., Martin, J., Anderson, K. M., and Sicker, D. Widescale computer-mediated communication in crisis re- sponse: Roles, trust & accuracy in the social distribution of information. 2009, http://www.nsf.gov/awardsearch/ showAward.do?AwardNumber=0910586.
[21] Palen, L., Anderson, K. M., Mark, G., Martin, J., Sicker, D., Palmer, M., and Grunwald, D. A vision for technology- mediated support for public participation & assistance in mass emergencies & disasters. In ACM-BCS Visions of Computer Science, April 2010, Article 8. 12 pages.
[22] Palen, L., Vieweg, S., and Anderson, K. M. Supporting ‘everyday analysts’ in safety- and time-critical situations. The Information Society, vol. 27, no. 1, pp. 52–62, January 2011.
[23] Perry, D. E., and Wolf, A. L. Foundations for the study of software architecture. SIGSOFT Softw. Eng. Notes, vol. 17, no. 4, pp. 40–52, October 1992.
[24] Schram, A., and Anderson, K. M. MySQL to NoSQL: Data modeling challenges in supporting scalability. In ACM Conference on Systems, Programming, Languages and Applications: Software for Humanity, October 2012, pp. 191–202.
5920