batch emulsion polymerization
DESCRIPTION
Emulsion polymerization techniquesTRANSCRIPT
Batch emulsion polymerizationA chemical engineering approach
CIP-DATA LIBRARY TECHNISCHE UNIVERSITEIT EINDHOVEN
Kemmere, Maria F.
Batch emulsion polymerization: a chemical engineering approach /by Maria F. Kemmere. - Eindhoven : Technische Universiteit Eindhoven,1999. – Proefschrift. - ISBN 90-386-2611-8NUGI 813Trefwoorden: emulsiepolymerisatie / emulsies / coagulatie / reologie /warmte-overdrachtSubjects headings: emulsion polymerization / emulsions / coagulation /rheology / heat transfer
© Copyright 1999, M.F. KemmereOmslagontwerp: Ben Mobach, TUEDruk: Universiteitsdrukkerij TUE
Batch emulsion polymerizationA chemical engineering approach
PROEFSCHRIFT
ter verkrijging van de graad van doctor aan deTechnische Universiteit Eindhoven, op gezag van de
Rector Magnificus, prof. dr. M. Rem, voor eencommissie aangewezen door het College voor
Promoties in het openbaar te verdedigenop woensdag 29 september om 16.00 uur
door
Maria Francisca Kemmere
geboren te Loon op Zand
Dit proefschrift is goedgekeurd door de promotoren:
prof. dr. ir. A.A.H. Drinkenburgenprof. dr. ir. A.L. German
Copromotor:dr. J. Meuldijk
Het in dit proefschrift beschreven onderzoek werd financieel gesteund door deStichting Emulsie Polymerisatie (SEP)
SUMMARY
Emulsion polymerization is an important industrial process for the production oflatex paints, rubbers, coatings and adhesives. Although the process has been usedfor a long time, relatively little attention has been paid to the engineering aspects ofthe polymerization. In the work described in this thesis batch emulsionpolymerization has been investigated from an engineering point of view with theobjective to improve the operation of current processes and to allow forimprovements in the development of novel emulsion polymerization processes. Forthis purpose, different issues have shown to be important, for which this work hasbeen focused on four topics: emulsification, colloidal stability, rheology and flowin high solids polymerization and heat transfer. These topics have been studiedusing the polymerization of styrene and vinyl acetate as two representative modelsystems.
In the first stage of the polymerization, emulsification of the monomers isimportant, because insufficient emulsification influences the product properties.This is due to the fact that once poor emulsification has affected the polymerizationin terms of a broad particle size distribution, the consequences of insufficientemulsification work out through the further course of the reaction. Fromvisualization experiments and polymerizations in combination with reactioncalorimetric studies, a critical impeller speed, N*, can accurately be determined fora particular reactor setup and a given recipe. Impeller speeds equal or above N*
guarantee intrinsic polymerization rates. Then the monomer droplets are smallenough to ensure a sufficiently high mass transfer coefficient, thus making thereaction the rate limiting step. For the emulsion systems investigated, it has notbeen possible to properly measure monomer droplet sizes. Nevertheless, an indirectmethod, the visual criterion for sufficient dispersion based on N* has proven to be areliable tool to study emulsification in emulsion polymerization systems rather thanmonomer droplet size measurements. The results show that styrene/water mixturesare more difficult to emulsify than vinyl acetate/water mixtures. This is a result ofthe difference in physico-chemical properties, in which the density of the dispersedmonomer phase plays a major role. For the same reactor configuration, more powerinput for sufficient emulsification is required for styrene/water mixtures than forvinyl acetate/water mixtures. Small and large turbine and pitched blade impellershave been tested for emulsification purposes. In general, a large turbine impeller
appears to be more effective in emulsifying monomer/water dispersions than apitched blade impeller.
For studying the colloidal stability of polystyrene and polyvinyl acetate latexsystems, emulsion polymerizations as well as coagulation experiments withoutpolymerization have been performed. In order to study coagulation properly,sufficient emulsification is required. The experimental results clearly show thatBrownian coagulation is the predominant mechanism in emulsion polymerization.This conclusion is supported by the fact that the model developed at the ETHZürich by Melis and Morbidelli, which considers Brownian coagulation based onthe DLVO-theory, agrees well with our experimental data. Shear effects arenegligible, since the polymer particles are smaller than the Kolmogorov microscaleof turbulence. In order to provide sufficient colloidal stability, proper stabilizationby emulsifier and a low ionic strength are required. This implies that the recipedominates the coagulation behavior rather than the process conditions.
The rheological properties and flow have been studied for the high solids emulsionpolymerization of styrene. The increasing volume fraction of monomer swollenpolymer particles causes an increase in viscosity. At the same time the rheologychanges from Newtonian into pseudo-plastic behavior, which results from theorientation of the polymer particles in the flow. Due to the shear rate distribution inthe reactor, the pseudo-plastic behavior results in intensive mixing in the vicinity ofthe impeller, while relatively low mixing rates occur in the almost stagnant zonesfar from the impeller. The particle size distribution has a significant influence onthe rheology and flow. Latices with a bimodal particle size distribution showNewtonian rheology and have a lower viscosity at the same solids content ascompared to latices with a narrow and unimodal particle size distribution. Thisimplies that generation of a bimodal particle size distribution by secondarynucleation can avoid stagnant zones and thus can improve the mass and heattransfer in high solids emulsion polymerization.
Reaction calorimetry has been applied to determine the partial heat transfercoefficient at the reaction side in batch emulsion polymerization of styrene andvinyl acetate. It has been shown that system properties such as solids content andmonomer type have a strong influence on the rate of heat transfer. A large turbineimpeller provides the highest heat transfer coefficient under the same conditions ascompared to pitched blade impellers.
overallelectrolyte
concentration
CE,θθcrit
CCC
N** N*
insufficient stabilization
uncontrolled coagulation
impeller speed
aeration / surfacecoagulation
insufficient emulsification /poor heat transfer
operating window
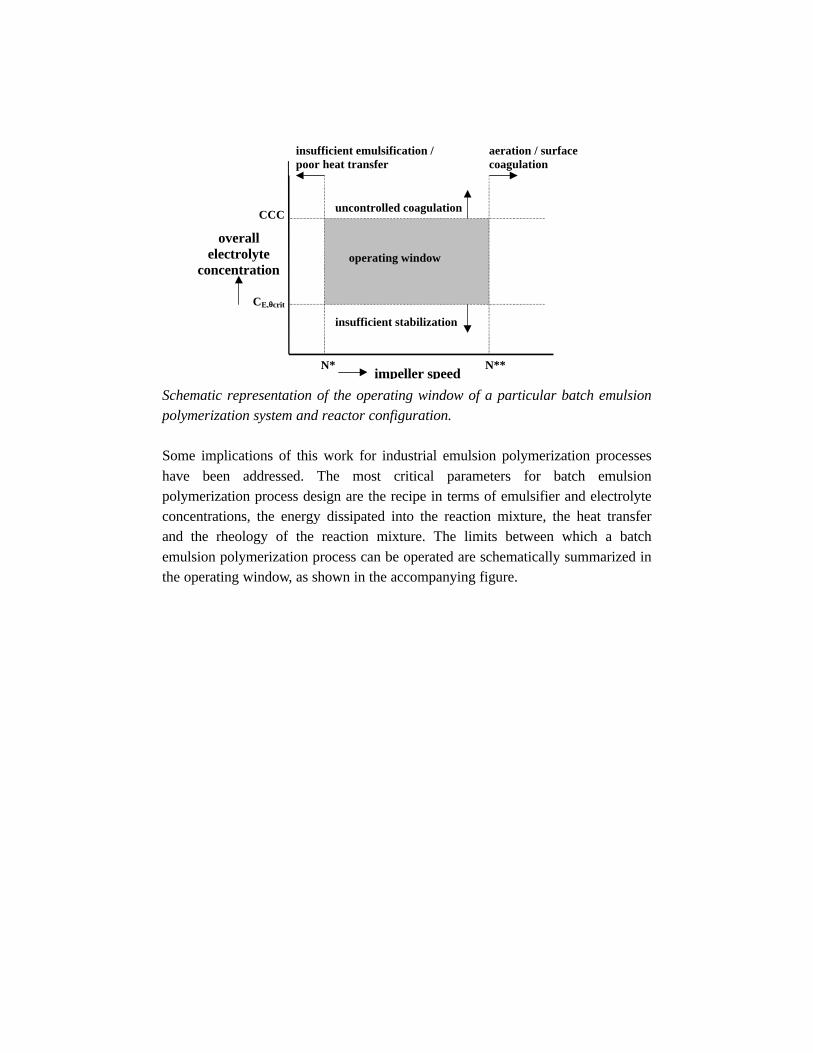
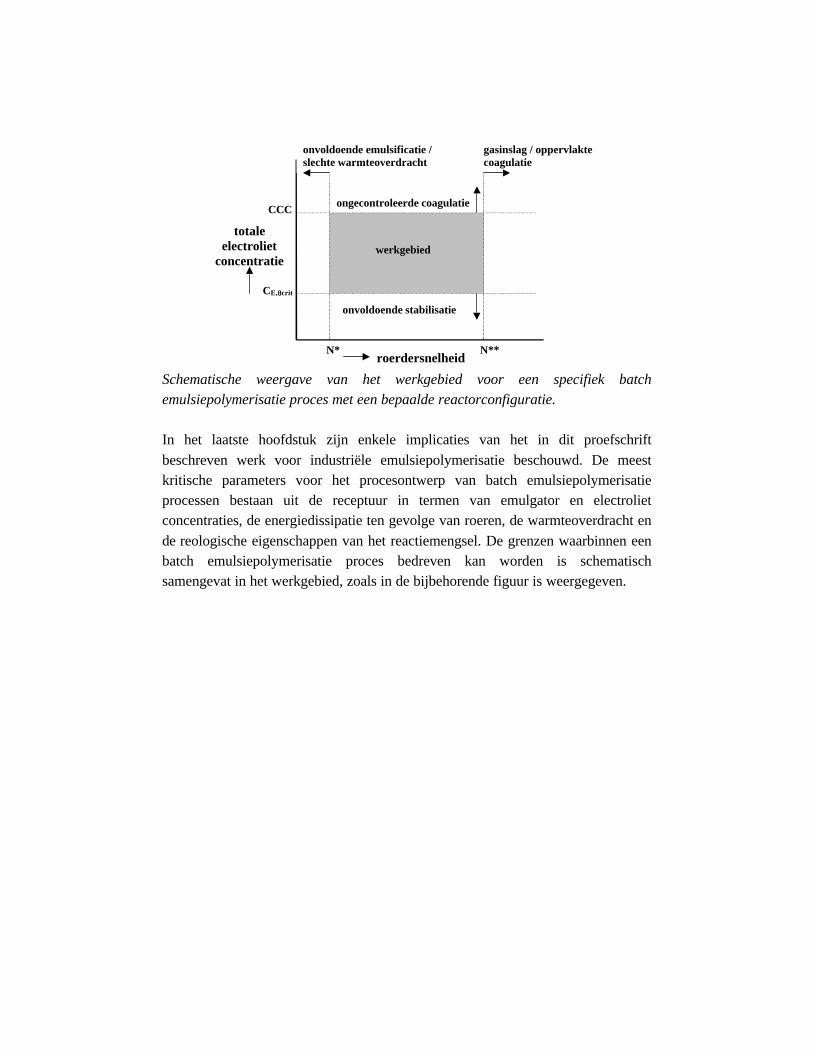
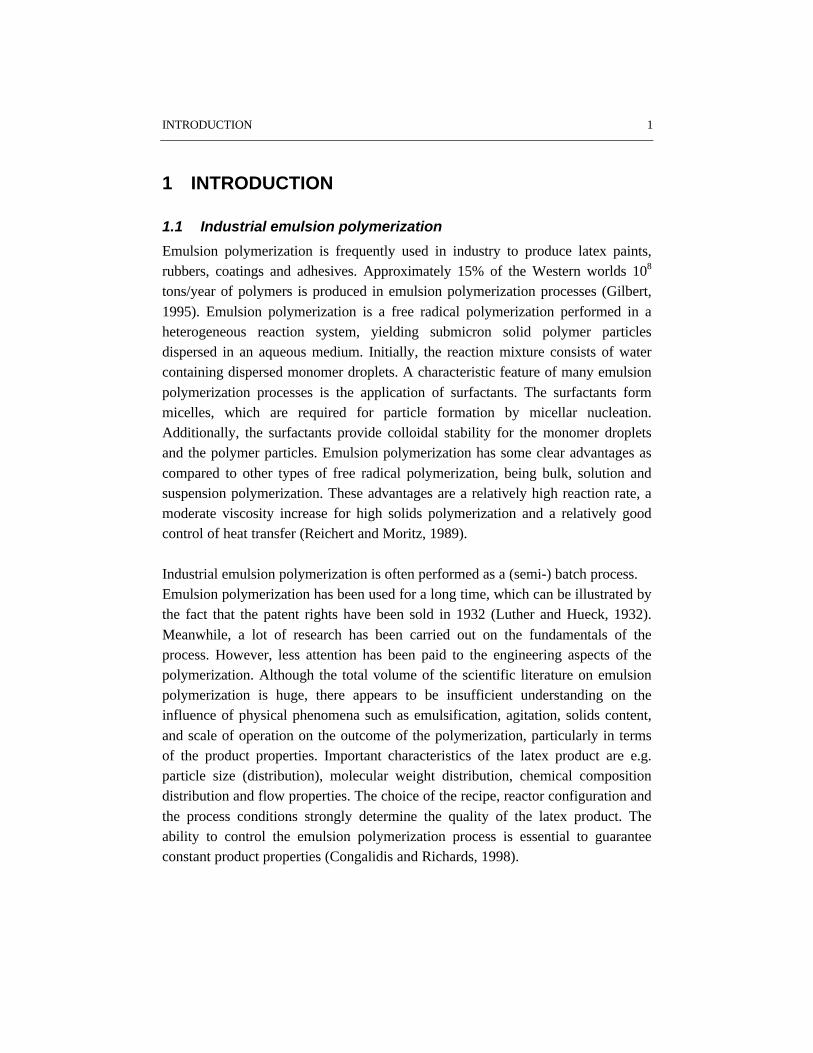
Schematic representation of the operating window of a particular batch emulsionpolymerization system and reactor configuration.
Some implications of this work for industrial emulsion polymerization processeshave been addressed. The most critical parameters for batch emulsionpolymerization process design are the recipe in terms of emulsifier and electrolyteconcentrations, the energy dissipated into the reaction mixture, the heat transferand the rheology of the reaction mixture. The limits between which a batchemulsion polymerization process can be operated are schematically summarized inthe operating window, as shown in the accompanying figure.
SAMENVATTING
Emulsiepolymerisatie is een belangrijk proces voor de productie van o.a. verf,rubbers, coatings en lijmen. Hoewel het proces reeds lang op technische schaalwordt uitgevoerd, is relatief weinig aandacht besteed aan de proceskundigeaspecten. In het in dit proefschrift beschreven onderzoek is batchemulsiepolymerisatie onderzocht vanuit een procestechnologische invalshoek metals doel bestaande processen te verbeteren en de ontwikkeling van nieuweemulsiepolymerisatie processen te bevorderen. Hiertoe is het onderzoek opgesplitstin vier deelonderwerpen: emulsificatie, colloïdale stabiliteit, reologie en stromingalsmede warmteoverdracht. De emulsiepolymerisatie van styreen en vinylacetaatzijn als modelprocessen gebruikt.
Tijdens het eerste stadium van de polymerisatie is emulsificatie van de monomerenbelangrijk, aangezien onvoldoende emulsificatie de producteigenschappen in sterkemate beïnvloedt in termen van een verbrede deeltjesgrootteverdeling. Met behulpvan visualisatie- en polymerisatie-experimenten in combinatie metreactiecalorimetrie kan een ondergrens voor het toerental, N*, vastgesteld wordenvoor een bepaalde reactorconfiguratie en receptuur. Toerentallen hoger dan ofgelijk aan N* garanderen intrinsieke kinetiek. Aangezien de monomeerdruppels indat geval klein genoeg zijn voor voldoende stoftransport, wordt de reactie desnelheidsbepalende stap. Voor de onderzochte emulsiesystemen is het niet mogelijkgebleken de monomeerdruppelgrootte te meten. Hoewel het criterium voor N*
gebaseerd op visualisatie-experimenten en polymerisaties een indirecte methode is,blijkt het een meer betrouwbare methode te zijn voor de bestudering vanemulsificatie dan de druppelgroottemeting. De resultaten van het emulsificatieonderzoek geven aan dat styreen/water mengsels moeilijker te emulgeren zijn danvinyl acetaat/water mengsels. Dit is een gevolg van de verschillen in fysisch-chemische eigenschappen, waarbij de dichtheid van de disperse monomeer faseeen belangrijke rol speelt. Voor een identieke reactorconfiguratie vraagt hetemulgeren van styreen/water mengsels meer vermogen dan vinyl acetaat/watermengsels. In het algemeen blijkt een grote turbineroerder effectievermonomeer/water mengsels te emulgeren dan een schuine blad roerder.
In het onderzoek naar de colloïdale stabiliteit van polystyreen en polyvinylacetaatlatices zijn zowel polymerisaties als coagulatie experimenten zonder reactieuitgevoerd. Om coagulatie op juiste wijze te onderzoeken is voldoende
emulsificatie vereist. De experimentele resultaten laten zien dat Brownsecoagulatie het bepalende mechanisme is in emulsiepolymerisatie. Deze conclusiewordt ondersteund door het feit dat de berekeningen met een model, ontwikkeldaan de ETH Zürich door Melis en Morbidelli, goed overeenkomen met deexperimentele data. Dit model beschouwt Brownse coagulatie gebaseerd op deDLVO theorie. Afschuifeffecten zijn verwaarloosbaar, aangezien depolymeerdeeltjes veel kleiner zijn dan de Kolmogorov microschaal voorturbulentie. Om voldoende colloïdale stabiliteit te garanderen is een goedestabilisatie door emulgator en een lage ionsterkte vereist. Dit impliceert dat dereceptuur van veel groter belang is voor het beheersen van de colloïdale stabiliteittijdens reactie dan de procescondities.
Tijdens hoog vaste stof emulsie polymerisatie van styreen zijn de reologischeeigenschappen en de stroming onderzocht. De toenemende volume fractie van metmonomeer gezwollen polymeerdeeltjes veroorzaakt een toename in viscositeit.Tevens verandert de reologie veelal van Newtons naar pseudo-plastisch. Deoriëntatie van de polymeerdeeltjes in de stroming veroorzaakt het pseudo-plastischgedrag van het reactiemengsel. Vanwege de verdeling van de afschuifsnelheid inde reactor, resulteert het pseudo-plastisch gedrag in intensieve menging in de buurtvan de roerder, terwijl relatief lage vloeistofsnelheden optreden ver van de roerder.De deeltjesgrootteverdeling heeft een significante invloed op de reologischeeigenschappen en stroming. Latices met een bimodale deeltjesgrootteverdelingvertonen Newtonse reologie en hebben een lagere viscositeit bij gelijke volumefractie deeltjes dan latices met een smalle unimodale deeltjesgrootteverdeling. Ditimpliceert dat door het genereren van een bimodale deeltjesgrootteverdelingmiddels secundaire nucleatie, de stagnante zones vermeden worden, waardoor destof- en warmteoverdracht bevorderd worden.
Reactiecalorimetrie is toegepast om de partiële warmteoverdrachtscoefficiënt aande reactiezijde te bepalen voor de batch emulsiepolymerisatie van styreen en vinylacetaat. Systeemeigenschappen zoals het vaste stof gehalte en het monomeertypehebben een sterke invloed op de snelheid van warmteoverdracht. Een groteturbineroerder geeft de hoogste warmteoverdrachtscoefficiënt onder gelijkecondities in vergelijking met schuine blad roerders.
totaleelectroliet
concentratie
CE,θθcrit
CCC
N** N*
onvoldoende stabilisatie
ongecontroleerde coagulatie
roerdersnelheid
gasinslag / oppervlaktecoagulatie
onvoldoende emulsificatie /slechte warmteoverdracht
werkgebied
Schematische weergave van het werkgebied voor een specifiek batchemulsiepolymerisatie proces met een bepaalde reactorconfiguratie.
In het laatste hoofdstuk zijn enkele implicaties van het in dit proefschriftbeschreven werk voor industriële emulsiepolymerisatie beschouwd. De meestkritische parameters voor het procesontwerp van batch emulsiepolymerisatieprocessen bestaan uit de receptuur in termen van emulgator en electrolietconcentraties, de energiedissipatie ten gevolge van roeren, de warmteoverdracht ende reologische eigenschappen van het reactiemengsel. De grenzen waarbinnen eenbatch emulsiepolymerisatie proces bedreven kan worden is schematischsamengevat in het werkgebied, zoals in de bijbehorende figuur is weergegeven.
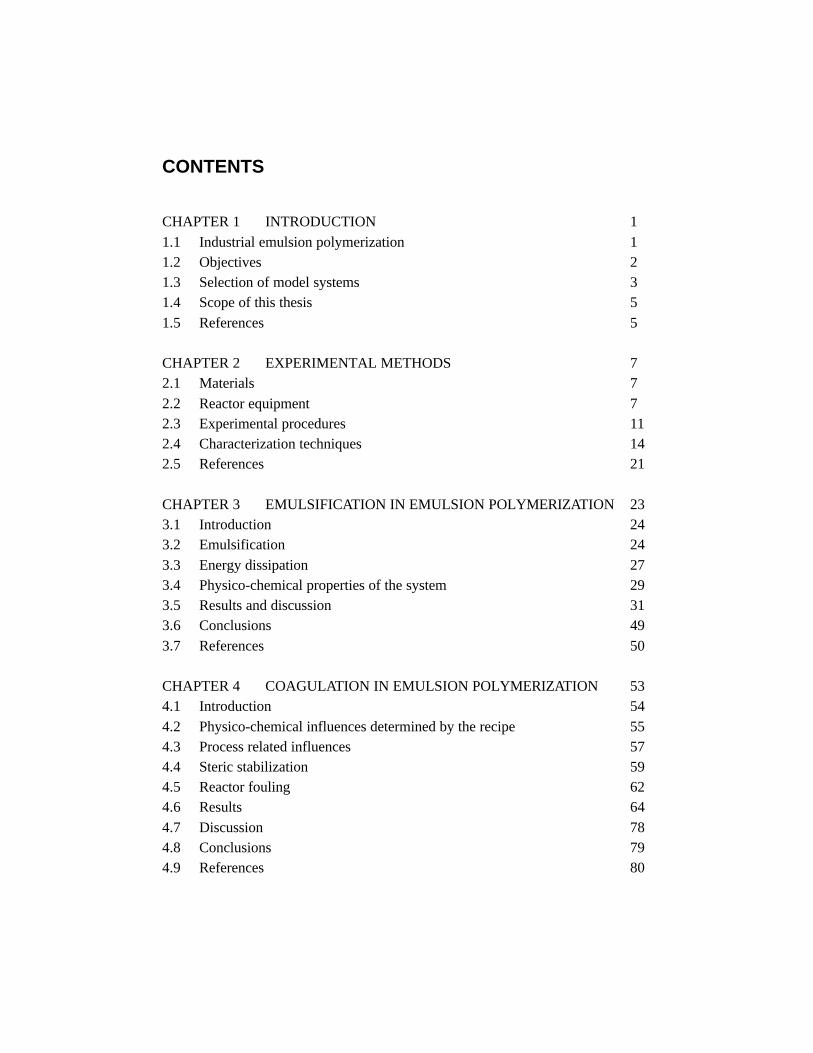
CONTENTS
CHAPTER 1 INTRODUCTION 11.1 Industrial emulsion polymerization 11.2 Objectives 21.3 Selection of model systems 31.4 Scope of this thesis 51.5 References 5
CHAPTER 2 EXPERIMENTAL METHODS 72.1 Materials 72.2 Reactor equipment 72.3 Experimental procedures 112.4 Characterization techniques 142.5 References 21
CHAPTER 3 EMULSIFICATION IN EMULSION POLYMERIZATION 233.1 Introduction 243.2 Emulsification 243.3 Energy dissipation 273.4 Physico-chemical properties of the system 293.5 Results and discussion 313.6 Conclusions 493.7 References 50
CHAPTER 4 COAGULATION IN EMULSION POLYMERIZATION 534.1 Introduction 544.2 Physico-chemical influences determined by the recipe 554.3 Process related influences 574.4 Steric stabilization 594.5 Reactor fouling 624.6 Results 644.7 Discussion 784.8 Conclusions 794.9 References 80
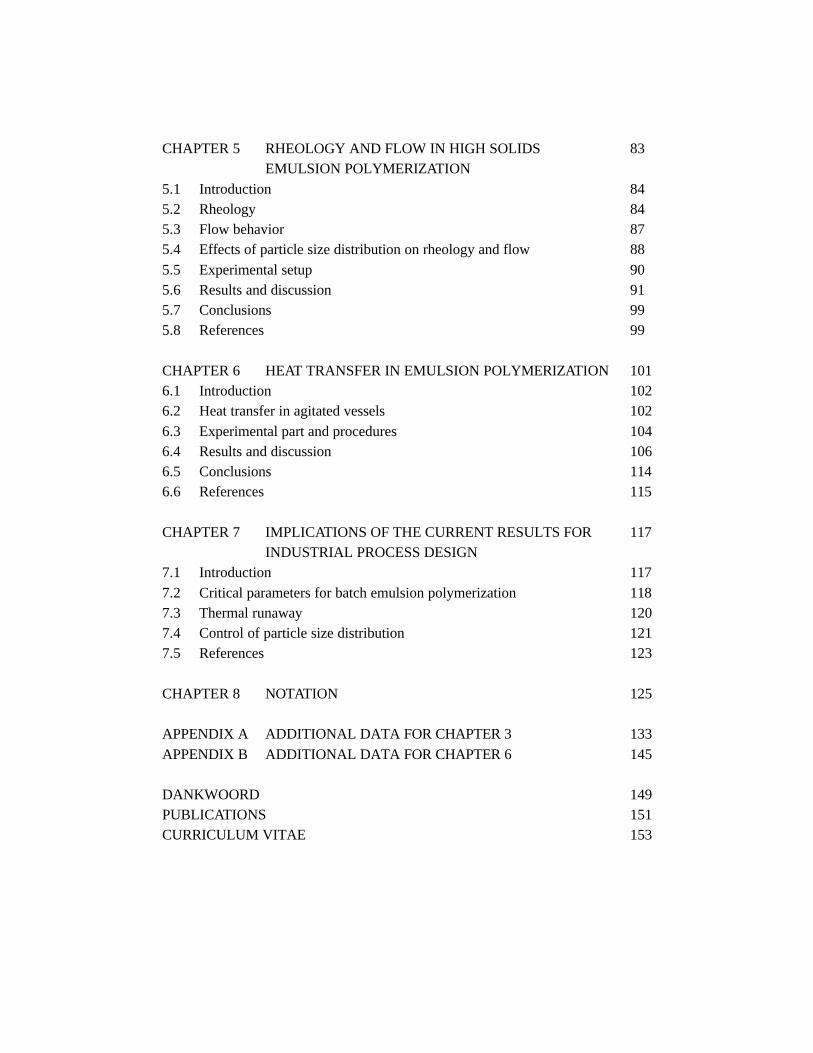
CHAPTER 5 RHEOLOGY AND FLOW IN HIGH SOLIDSEMULSION POLYMERIZATION
83
5.1 Introduction 845.2 Rheology 845.3 Flow behavior 875.4 Effects of particle size distribution on rheology and flow 885.5 Experimental setup 905.6 Results and discussion 915.7 Conclusions 995.8 References 99
CHAPTER 6 HEAT TRANSFER IN EMULSION POLYMERIZATION 1016.1 Introduction 1026.2 Heat transfer in agitated vessels 1026.3 Experimental part and procedures 1046.4 Results and discussion 1066.5 Conclusions 1146.6 References 115
CHAPTER 7 IMPLICATIONS OF THE CURRENT RESULTS FORINDUSTRIAL PROCESS DESIGN
117
7.1 Introduction 1177.2 Critical parameters for batch emulsion polymerization 1187.3 Thermal runaway 1207.4 Control of particle size distribution 1217.5 References 123
CHAPTER 8 NOTATION 125
APPENDIX A ADDITIONAL DATA FOR CHAPTER 3 133APPENDIX B ADDITIONAL DATA FOR CHAPTER 6 145
DANKWOORD 149PUBLICATIONS 151CURRICULUM VITAE 153
INTRODUCTION 1
1 INTRODUCTION
1.1 Industrial emulsion polymerization
Emulsion polymerization is frequently used in industry to produce latex paints,rubbers, coatings and adhesives. Approximately 15% of the Western worlds 108
tons/year of polymers is produced in emulsion polymerization processes (Gilbert,1995). Emulsion polymerization is a free radical polymerization performed in aheterogeneous reaction system, yielding submicron solid polymer particlesdispersed in an aqueous medium. Initially, the reaction mixture consists of watercontaining dispersed monomer droplets. A characteristic feature of many emulsionpolymerization processes is the application of surfactants. The surfactants formmicelles, which are required for particle formation by micellar nucleation.Additionally, the surfactants provide colloidal stability for the monomer dropletsand the polymer particles. Emulsion polymerization has some clear advantages ascompared to other types of free radical polymerization, being bulk, solution andsuspension polymerization. These advantages are a relatively high reaction rate, amoderate viscosity increase for high solids polymerization and a relatively goodcontrol of heat transfer (Reichert and Moritz, 1989).
Industrial emulsion polymerization is often performed as a (semi-) batch process.Emulsion polymerization has been used for a long time, which can be illustrated bythe fact that the patent rights have been sold in 1932 (Luther and Hueck, 1932).Meanwhile, a lot of research has been carried out on the fundamentals of theprocess. However, less attention has been paid to the engineering aspects of thepolymerization. Although the total volume of the scientific literature on emulsionpolymerization is huge, there appears to be insufficient understanding on theinfluence of physical phenomena such as emulsification, agitation, solids content,and scale of operation on the outcome of the polymerization, particularly in termsof the product properties. Important characteristics of the latex product are e.g.particle size (distribution), molecular weight distribution, chemical compositiondistribution and flow properties. The choice of the recipe, reactor configuration andthe process conditions strongly determine the quality of the latex product. Theability to control the emulsion polymerization process is essential to guaranteeconstant product properties (Congalidis and Richards, 1998).
2 CHAPTER 1
In industry, as a result of environmental constraints, the demand for high solidsemulsion polymerization is increasing. High solids emulsion polymerizationcomplicates the process in terms of reactor fouling and less uniform flow. Severereactor fouling often causes expensive reactor shutdowns. Other typical problemsin semi-batch operation include difficulties in feeding the monomer and emulsifierstreams into the reactor (Soares and Hamielec, 1997). Thermal runaway can be aserious problem in industrial polymerizations as well (Poehlein, 1997).Additionally, the increasingly stringent environmental requirements ask for thereduction of energy consumption in production and processing as well as for aminimum production of waste material in terms of off-spec products andwastewater. To make significant improvements on the above-mentioned issues, itwill be obvious that a thorough understanding of the physical and chemicalphenomena governing the emulsion polymerization process is required.
1.2 Objectives
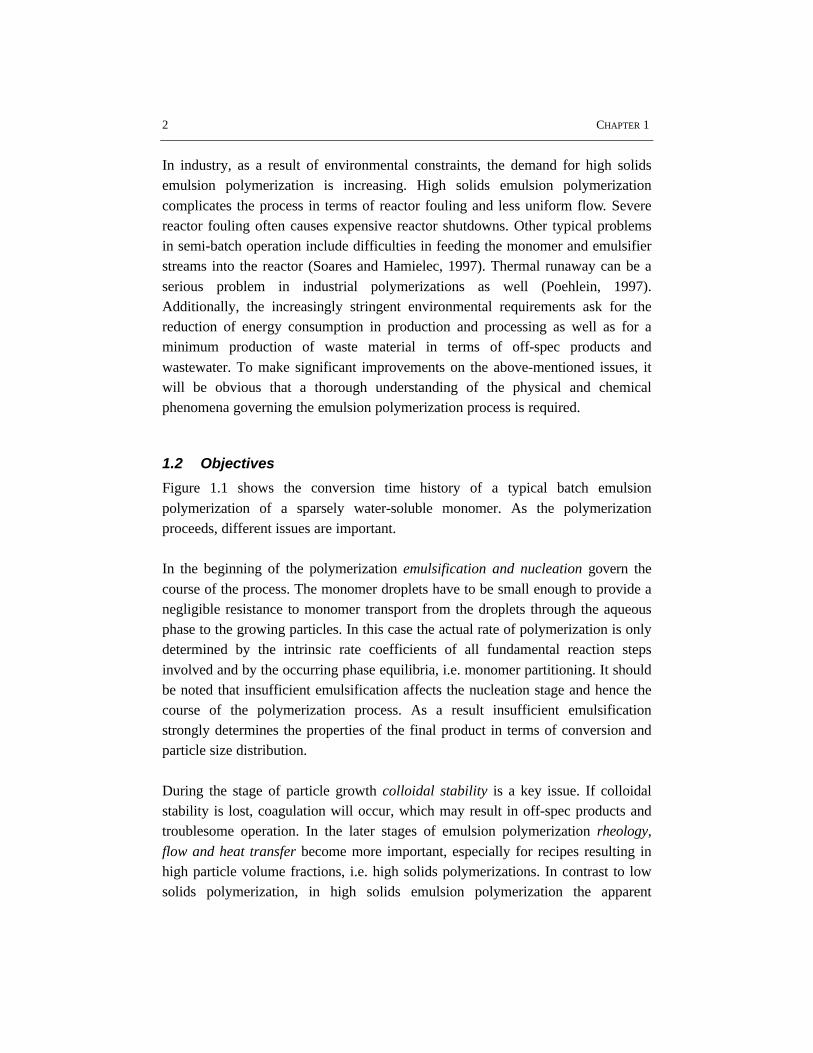
Figure 1.1 shows the conversion time history of a typical batch emulsionpolymerization of a sparsely water-soluble monomer. As the polymerizationproceeds, different issues are important.
In the beginning of the polymerization emulsification and nucleation govern thecourse of the process. The monomer droplets have to be small enough to provide anegligible resistance to monomer transport from the droplets through the aqueousphase to the growing particles. In this case the actual rate of polymerization is onlydetermined by the intrinsic rate coefficients of all fundamental reaction stepsinvolved and by the occurring phase equilibria, i.e. monomer partitioning. It shouldbe noted that insufficient emulsification affects the nucleation stage and hence thecourse of the polymerization process. As a result insufficient emulsificationstrongly determines the properties of the final product in terms of conversion andparticle size distribution.
During the stage of particle growth colloidal stability is a key issue. If colloidalstability is lost, coagulation will occur, which may result in off-spec products andtroublesome operation. In the later stages of emulsion polymerization rheology,
flow and heat transfer become more important, especially for recipes resulting inhigh particle volume fractions, i.e. high solids polymerizations. In contrast to lowsolids polymerization, in high solids emulsion polymerization the apparent
INTRODUCTION 3
viscosity of the reaction mixture increases significantly with conversion. Thisimplies that for high solids processes, the choice of the reactor configuration andprocess conditions is crucial.
time
conv
ersi
on
I
II
III
emulsification
& nucleationcolloidal stability
high solids: rheology & flow
heat transfer
Figure 1.1: Schematic representation of the various important issues in ab-initiobatch emulsion polymerization of sparsely water-soluble monomers.
In this thesis, these critical aspects of the emulsion polymerization process havebeen studied separately. The results of this work enable the improvement of thecurrently operated emulsion polymerization processes, and will provide guidelinesfor the development of novel polymerization processes. For this purpose, a detailedexperimental program with different monomers, recipes, equipment, and operatingprocedures has been carried out.
1.3 Selection of model systems
In this study, the batch emulsion polymerization of styrene and vinyl acetate hasbeen chosen as representative model systems for many industrial processes. Thestyrene and vinyl acetate systems differ, among several other characteristics, inwater solubility of the monomers and in polarity of the resulting polymer particlesurface. In emulsion polymerization there is a complicated interaction between thepolymerization reaction and a number of physical phenomena. The water solubilityof the monomer strongly influences the kinetics of the polymerization. Duringbatch emulsion polymerization of sparsely water soluble monomers such asstyrene, three time-separated intervals can be distinguished, see Figure 1.1: particleformation (I), polymerization with (II), and without (III) monomer droplets present
4 CHAPTER 1
(Harkins, 1947; Smith and Ewart, 1948). Particle formation is dominated bymicellar nucleation. Once the initiator is added, which is in our case completelywater soluble, thermal decomposition into radicals occurs. The actualpolymerization starts in the aqueous phase by reaction of a monomer moleculewith an initiator radical. After a few propagation steps in the aqueous phase, theoligomer radical enters a monomer-swollen micelle and a particle is formed. In thisfreshly formed polymer particle, i.e. the locus of polymerization, a polymer chainstarts growing. At the end of interval I all micelles have disappeared and particlenucleation stops. The surfactants, initially present as micelles have then becomepolymer particles or are adsorbed onto the surface of the growing particles toprovide colloidal stability. During the second stage of the process, thepolymerization takes place in the monomer-swollen particles. The third intervalstarts when the monomer droplets have disappeared. In this stage, the reaction ratedeclines due to a decrease of the monomer concentration in the polymer particles.For monomers with a moderate water solubility such as vinyl acetate,homogeneous nucleation plays an important role (Hansen and Ugelstad, 1978). Theoligomers grow in the aqueous phase until the solubility limit is reached. Then theoligomers precipitate to form partially stabilized primary particles. The polymerparticles grow by absorbing monomer, and by polymerization as well as bycoagulation. Contrary to the emulsion polymerization of sparsely water-solublemonomers, it is difficult to observe distinct intervals during emulsionpolymerization of moderately water-soluble monomers.
For the emulsion polymerization of both styrene and vinyl acetate, sodium dodecylsulfate, sodium persulfate and sodium carbonate have been used as emulsifier,initiator and buffer, respectively. The monomer fraction in the recipe has beenvaried between 25 percent by weight of monomer, leading to a relatively low solids
content latex product, and 50 wt% monomer in the recipe, leading to a so-calledhigh solids latex product.
Concerning the reactor equipment, two different impeller types have been chosen:a turbine impeller, which provides radial acceleration of the fluid at the impellerblades, and a pitched blade impeller, which generates axial acceleration of the fluidat the impeller blades. In order to study scale-effects, three different reactor scaleshave been investigated.
INTRODUCTION 5
1.4 Scope of this thesis
For providing a general basis, chapter 2 gives an overview of the materials, reactorequipment and experimental procedures used in this study. Subsequently, the nextchapters describe the different key issues in emulsion polymerization, as shown inFigure 1.1. In chapter 3, the influence of emulsification of the monomer in theaqueous phase on the polymerization process is discussed. A visual criterion isdescribed for determining the lowest impeller speed for sufficient emulsification.Chapter 4 deals with the colloidal stability of latex systems. The influence of recipeand process conditions on the coagulation behavior of polystyrene and polyvinylacetate latices has been investigated in batch emulsion polymerization experimentsas well as using experiments in absence of polymerization. Chapter 5 focuses onthe rheology and flow in high solids emulsion polymerization of styrene.Additionally, the relation between the particle size distribution and the rheologyand flow of the reaction mixture is discussed. In chapter 6, reaction calorimetry isshown to be a versatile tool for the determination of the heat transfer coefficients inbatch emulsion polymerization. The effect of the physico-chemical properties ofthe reaction mixture as well as the process conditions on heat transfer has beeninvestigated. Finally, chapter 7 discusses some implications of the work describedin this thesis for industrial emulsion polymerization process design. This thesis hasbeen set up in such a way, that each chapter can be read separately. As aconsequence, some crucial information has been repeated in the subsequentchapters.
1.5 References
Congalidis, J.P., Richards, J.R., (1998), Polym. React. Eng., 6, (2), 71
Gilbert, R.G., (1995), Emulsion polymerization, A mechanistic approach, Academic Press
Hansen, F.K., Ugelstad, J., (1978), J. Polym. Sci., 16, 1953
Harkins,W.D., (1947), J. Am. Chem. Soc., 69, 1428
Luther, M., Hueck, C., (1932), U.S. Patent 1,864,078
Poehlein, G.W., (1997), in Polymeric dispersions: principles and applications, J.M. Asua (ed.),Kluwer Academic Publishers
Reichert, K.H., Moritz, H.U., (1989), Compr. Polym. Sci., 3, 327
Smith, W.V., Ewart, R.H., (1948), J. Chem. Phys., 16, (6), 592
Soares, J.B.P., Hamielec, A.E., (1997), in Polymeric dispersions: principles and applications, J.M.Asua (ed.), Kluwer Academic Publishers

6 CHAPTER 1
EXPERIMENTAL METHODS 7
2 EXPERIMENTAL METHODS
This chapter describes the materials, the reactor equipment and the variousexperimental procedures used in this study. Additionally, characterizationtechniques used for the experiments as described in the next chapters, arediscussed.
2.1 Materials
Table 2.1 gives the chemicals used for the (semi-) batch experiments described inthis thesis.
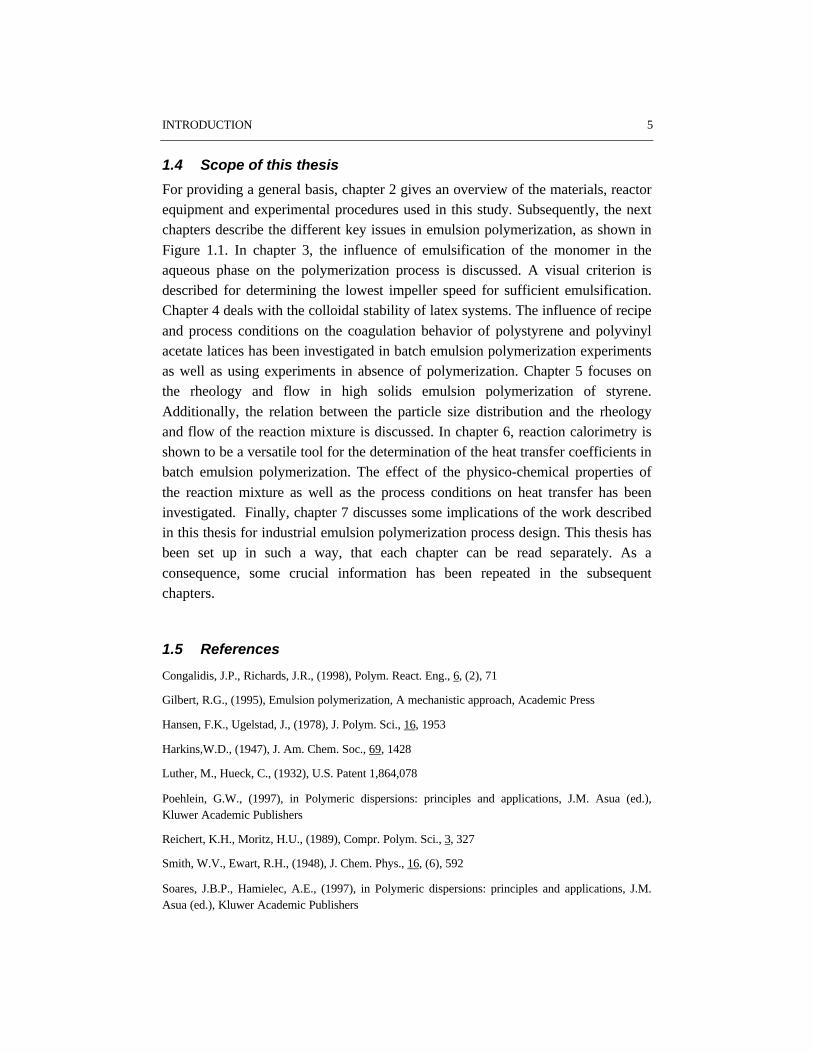
Table 2.1: Chemicals used for the experiments described in this thesis.Chemical Purity Supplier Function
styrene* industrial grade DSM Research monomervinyl acetate* industrial grade DSM Research monomersodium dodecyl sulfate industrial grade DSM Research emulsifiersodium persulfate laboratory grade Janssen initiatorsodium carbonate laboratory grade Merck bufferhydroquinone laboratory grade Acros short stop agentargon 5.0 laboratory grade Hoekloos removal of oxygenphosphotungstic acid laboratory grade Merck staininguranyl acetate laboratory grade Merck stainingethylene glycol dimethacrylate laboratory grade Aldrich crosslinking agentcarboxy methyl cellulose laboratory grade Aqualon visualization mediumacidic acrylate latex industrial grade Johnson Polymer visualization mediummono ethanol amine laboratory grade Merck neutralization agent
* Distilled under reduced pressure to remove the inhibitor 4-tert.-butylcatechol (TBC). TBCinfluences the course and outcome of the emulsion polymerization process (Kemmere et al., 1999).
2.2 Reactor equipment
2.2.1 Emulsion polymerization reactors
Batch emulsion polymerization experiments as well as coagulation experimentswithout polymerization were performed in three stainless steel stirred tank reactorsof different scale (0.935, 1.85 and 7.48 dm3, respectively), all equipped with fourbaffles and with external jackets for heating and cooling. For all experiments theliquid height was taken equal to the vessel diameter. Rushton six-bladed turbine
8 CHAPTER 2
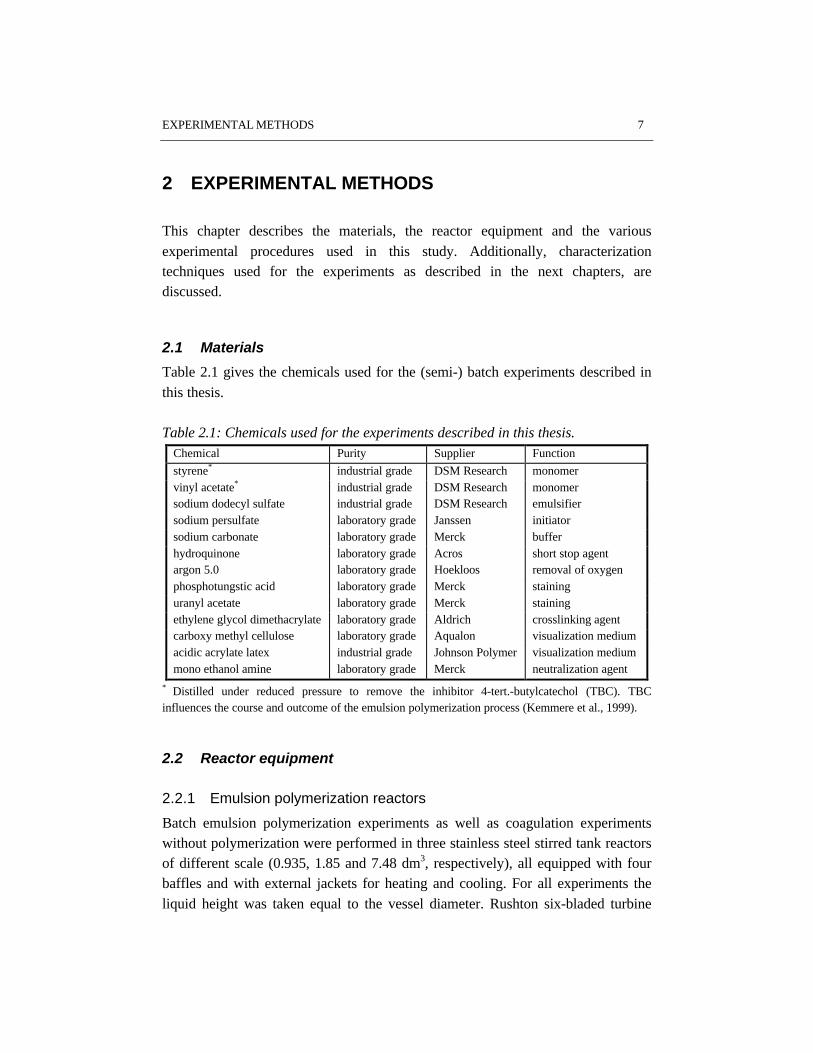
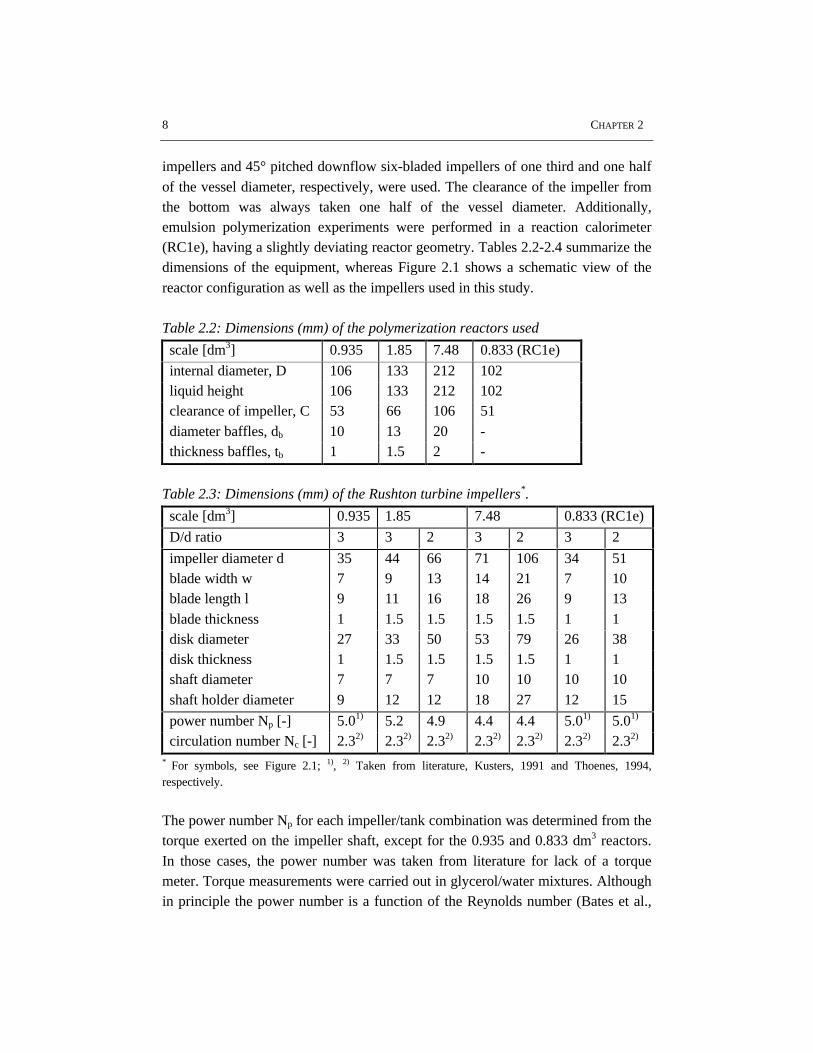
impellers and 45° pitched downflow six-bladed impellers of one third and one halfof the vessel diameter, respectively, were used. The clearance of the impeller fromthe bottom was always taken one half of the vessel diameter. Additionally,emulsion polymerization experiments were performed in a reaction calorimeter(RC1e), having a slightly deviating reactor geometry. Tables 2.2-2.4 summarize thedimensions of the equipment, whereas Figure 2.1 shows a schematic view of thereactor configuration as well as the impellers used in this study.
Table 2.2: Dimensions (mm) of the polymerization reactors used
scale [dm3] 0.935 1.85 7.48 0.833 (RC1e)
internal diameter, D 106 133 212 102liquid height 106 133 212 102clearance of impeller, C 53 66 106 51diameter baffles, db 10 13 20 -thickness baffles, tb 1 1.5 2 -
Table 2.3: Dimensions (mm) of the Rushton turbine impellers*.
scale [dm3] 0.935 1.85 7.48 0.833 (RC1e)
D/d ratio 3 3 2 3 2 3 2
impeller diameter d 35 44 66 71 106 34 51blade width w 7 9 13 14 21 7 10blade length l 9 11 16 18 26 9 13blade thickness 1 1.5 1.5 1.5 1.5 1 1disk diameter 27 33 50 53 79 26 38disk thickness 1 1.5 1.5 1.5 1.5 1 1shaft diameter 7 7 7 10 10 10 10shaft holder diameter 9 12 12 18 27 12 15
power number Np [-] 5.01) 5.2 4.9 4.4 4.4 5.01) 5.01)
circulation number Nc [-] 2.32) 2.32) 2.32) 2.32) 2.32) 2.32) 2.32)
* For symbols, see Figure 2.1; 1), 2) Taken from literature, Kusters, 1991 and Thoenes, 1994,respectively.
The power number Np for each impeller/tank combination was determined from thetorque exerted on the impeller shaft, except for the 0.935 and 0.833 dm3 reactors.In those cases, the power number was taken from literature for lack of a torquemeter. Torque measurements were carried out in glycerol/water mixtures. Althoughin principle the power number is a function of the Reynolds number (Bates et al.,
EXPERIMENTAL METHODS 9
1963), the variations in power number with Reynolds during the polymerizationexperiments have shown to be rather limited. Therefore, the power number wasassumed to be constant during all the experiments.
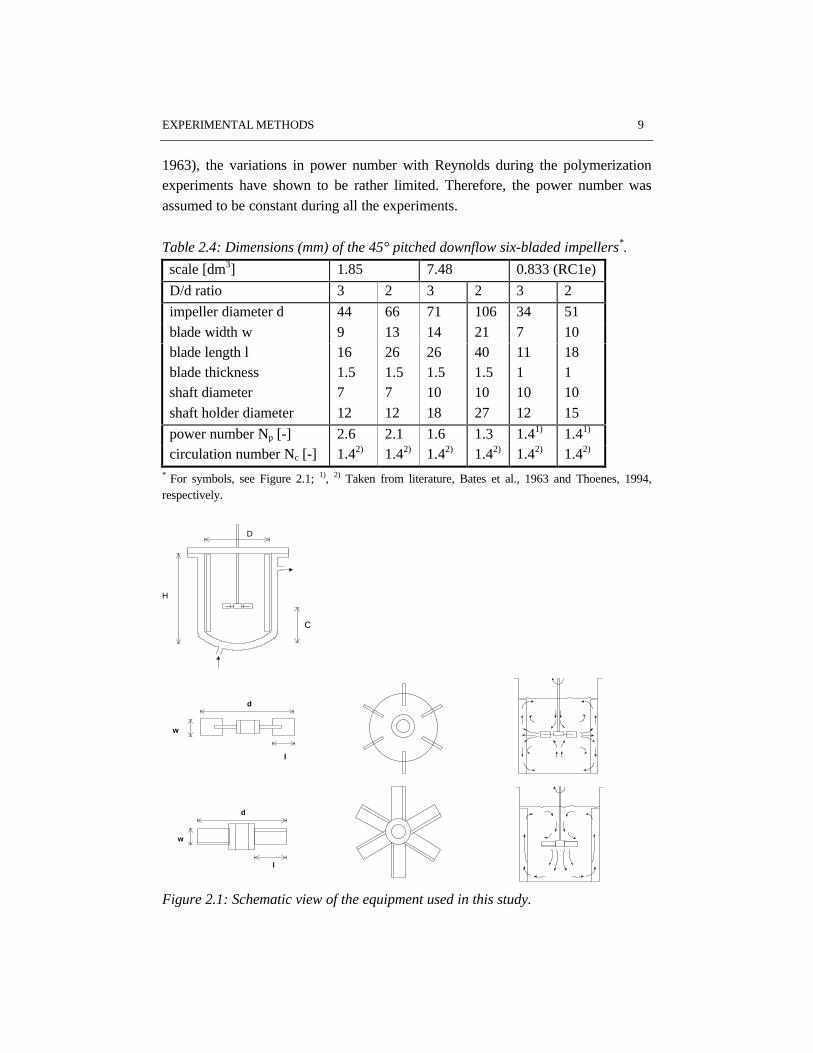
Table 2.4: Dimensions (mm) of the 45° pitched downflow six-bladed impellers*.
scale [dm3] 1.85 7.48 0.833 (RC1e)
D/d ratio 3 2 3 2 3 2
impeller diameter d 44 66 71 106 34 51blade width w 9 13 14 21 7 10blade length l 16 26 26 40 11 18blade thickness 1.5 1.5 1.5 1.5 1 1shaft diameter 7 7 10 10 10 10shaft holder diameter 12 12 18 27 12 15
power number Np [-] 2.6 2.1 1.6 1.3 1.41) 1.41)
circulation number Nc [-] 1.42) 1.42) 1.42) 1.42) 1.42) 1.42)
* For symbols, see Figure 2.1; 1), 2) Taken from literature, Bates et al., 1963 and Thoenes, 1994,respectively.
D
I
H
C
d
l
w
d
w
l
Figure 2.1: Schematic view of the equipment used in this study.
10 CHAPTER 2
The circulation number Nc of a particular reactor setup is a product of the pumpnumber and the circulation ratio (Thoenes, 1994). With the circulation number, theaverage circulation time of the liquid starting from and returning to the impellerregion can be calculated.
The glass vessels used for the visualization experiments had the same geometry asthe 1.85 and 7.48 dm3 polymerization reactors.
2.2.2 Reaction calorimetry
A commercially available reaction calorimeter (RC1e, HP60 reactor, Mettler-Toledo GmbH, Switzerland) was used in this study. A detailed description of thecharacteristics and possibilities of this piece of equipment has been given byVarela de la Rosa et al. (1996) and Sáenz de Buruaga et al. (1997). The dimensionsof the reactor have been given in the previous section, see Tables 2.3 and 2.4. Theconfiguration of the reaction calorimeter was slightly different from thepolymerization reactors. However, during all the experiments the liquid heightequaled the vessel diameter and the sensors served as baffles. The RC1e was
operated in the isothermal mode at a set reactor temperature of 50.0 °C. Overallheat transfer coefficients were determined by calibrations, in which a given amountof energy was supplied to a non-reacting fluid by an electrical heater over a periodof 10 minutes. If during a calibration run the reactor temperature remains constantand no other heat effects occur in the system, the overall heat transfer coefficientfollows from equation (2.1):
∫∫ =−2
1
2
1
)(t
t
c
t
t
ar dtQdtTTAU (2.1)
in which A represents the heat transfer area, t1 and t2 are the starting and end timesof the calibration, Qc stands for the calibration heat, Tr and Ta are the reactor andcorrected jacket temperature, respectively. Part of the heat flow from the jacketliquid into the reactor is used to heat or cool the reactor wall and is therefore nottransferred into the reactor contents. The corrected jacket temperature Ta,calculated from the real jacket temperature Tj, compensates for this effect. Notethat the calculation of U according to equation (2.1) assumes a perfectly mixedreactor. The overall heat transfer coefficient was measured in duplicate for eachsetup. In most cases the deviation in U remained below 1%.
EXPERIMENTAL METHODS 11
At the beginning and the end of a temperature ramp, the heat capacity of thereactor contents, Cp,r, can be determined according to equation (2.2), provided noother heat effects occur in the system:
( )dt
dTCm
dt
dTCmTTAU r
ipir
rprar ,, +=− (2.2)
in which mi and Cp,i represent the mass and heat capacity of the inserts (i.e. stirrer,temperature sensor, electrical heater etc.), respectively. The symbols dTr/dt, mr andCp,r stand for the heating rate, the mass and the heat capacity of the reactorcontents, respectively.
2.3 Experimental procedures
2.3.1 Ab-initio batch emulsion polymerization
During an ab-initio batch experiment all three intervals according to Smith-Ewartkinetics (Harkins, 1947, Smith and Ewart, 1948) occur successively. Prior to use,the water and monomer were flushed with argon separately to remove the oxygen.The emulsifier and buffer were dissolved in distilled water. The reactor wascharged with both the aqueous and monomer phase. Subsequently, the reactionmixture was stirred and heated until the desired reaction temperature was reached.Finally, the reaction was started by adding the aqueous initiator solution.
2.3.2 Seeded batch emulsion polymerization
In seeded batch polymerization, the nucleation period is skipped and the reactionstarts in interval II. A dialyzed, well-defined, monodisperse seed-latex was mixedwith the aqueous phase. The subsequent procedures were identical to thosementioned for ab-initio batch emulsion polymerization.
2.3.3 Coagulation experiments without polymerization
Since the time scale of limited coagulation is small as compared to the time scaleof particle growth by simultaneous reaction and monomer absorption (Mayer et al.,1995), we decided to study the coagulation behavior of latex particles as a functionof electrolyte concentration without performing emulsion polymerization. Thereactor was charged with seed-latex and monomer, but no initiator was added. The
12 CHAPTER 2
mixture was stirred and heated until the desired temperature was reached. Thepolymer particles were allowed to absorb monomer up to maximum swelling (Noëlet al., 1995). After the particles were completely swollen, a sample was taken forparticle size analysis. After sampling more electrolyte was added, 30 minutes wereallowed for further coagulation, after which another sample was taken, and so on.The swelling method is particularly suited to study the coagulation behavior ofpolyvinyl acetate latices because homogeneous secondary nucleation will occurduring seeded emulsion polymerization of vinyl acetate.
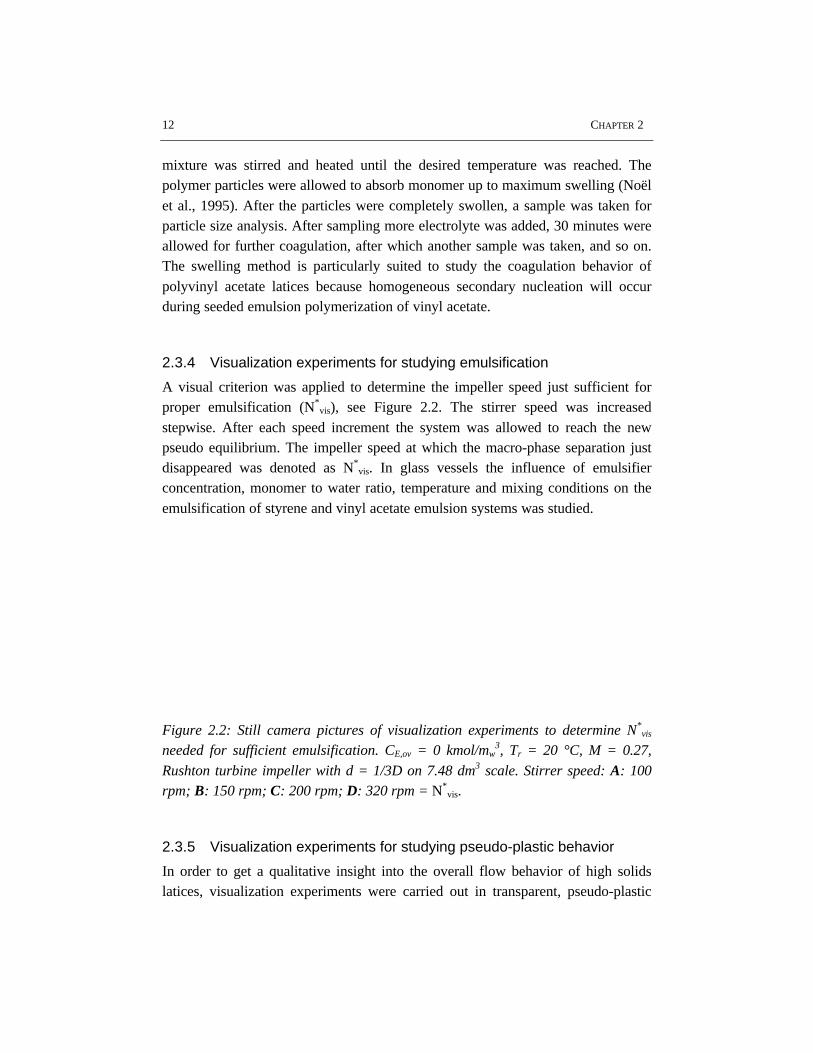
2.3.4 Visualization experiments for studying emulsification
A visual criterion was applied to determine the impeller speed just sufficient forproper emulsification (N*
vis), see Figure 2.2. The stirrer speed was increasedstepwise. After each speed increment the system was allowed to reach the newpseudo equilibrium. The impeller speed at which the macro-phase separation justdisappeared was denoted as N*
vis. In glass vessels the influence of emulsifierconcentration, monomer to water ratio, temperature and mixing conditions on theemulsification of styrene and vinyl acetate emulsion systems was studied.
Figure 2.2: Still camera pictures of visualization experiments to determine N*vis
needed for sufficient emulsification. CE,ov = 0 kmol/mw3, Tr = 20 °C, M = 0.27,
Rushton turbine impeller with d = 1/3D on 7.48 dm3 scale. Stirrer speed: A: 100rpm; B: 150 rpm; C: 200 rpm; D: 320 rpm = N*
vis.
2.3.5 Visualization experiments for studying pseudo-plastic behavior
In order to get a qualitative insight into the overall flow behavior of high solidslatices, visualization experiments were carried out in transparent, pseudo-plastic
EXPERIMENTAL METHODS 13
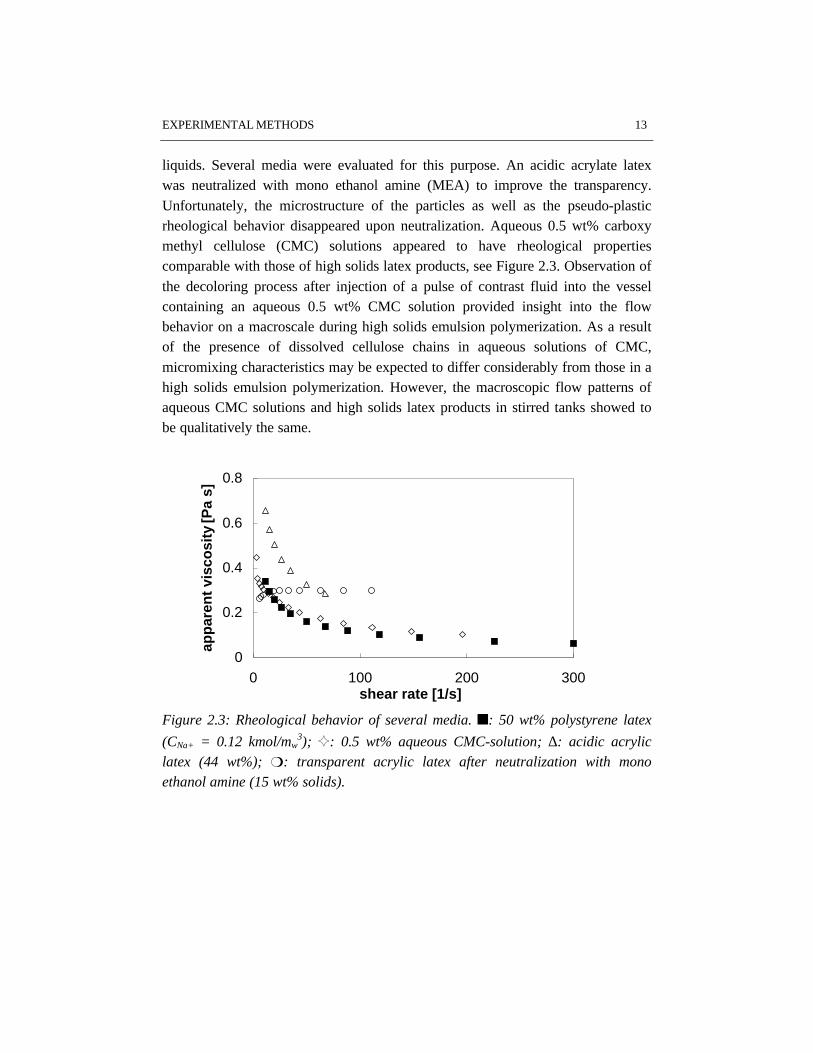
liquids. Several media were evaluated for this purpose. An acidic acrylate latexwas neutralized with mono ethanol amine (MEA) to improve the transparency.Unfortunately, the microstructure of the particles as well as the pseudo-plasticrheological behavior disappeared upon neutralization. Aqueous 0.5 wt% carboxymethyl cellulose (CMC) solutions appeared to have rheological propertiescomparable with those of high solids latex products, see Figure 2.3. Observation ofthe decoloring process after injection of a pulse of contrast fluid into the vesselcontaining an aqueous 0.5 wt% CMC solution provided insight into the flowbehavior on a macroscale during high solids emulsion polymerization. As a resultof the presence of dissolved cellulose chains in aqueous solutions of CMC,micromixing characteristics may be expected to differ considerably from those in ahigh solids emulsion polymerization. However, the macroscopic flow patterns ofaqueous CMC solutions and high solids latex products in stirred tanks showed tobe qualitatively the same.
0
0.2
0.4
0.6
0.8
0 100 200 300shear rate [1/s]
app
aren
t vi
sco
sity
[Pa
s]
Figure 2.3: Rheological behavior of several media. n: 50 wt% polystyrene latex
(CNa+ = 0.12 kmol/mw3); G: 0.5 wt% aqueous CMC-solution; ∆: acidic acrylic
latex (44 wt%); m: transparent acrylic latex after neutralization with monoethanol amine (15 wt% solids).
14 CHAPTER 2
2.4 Characterization techniques
2.4.1 Conversion
Monomer conversion was determined gravimetrically. Samples were taken fromthe reactor and transferred directly into a dry, clean aluminum cup, where thereaction was short-stopped by addition of hydroquinone. The sample was weighed,the free liquid was evaporated on a steambath and the resulting product was dried
in an oven at 80°C, until a constant weight was obtained. For ab-initio emulsionpolymerizations, the conversion X was calculated according to equation 2.3, seethe list of symbols in chapter 8.
M
ds
fEF
fEFEDX
⋅−⋅−−−
=)(
)()( (2.3)
For seeded emulsion polymerization the conversion was determined according toequation 2.4, in which the polymer of the seed is included in the calculation of theconversion. Using the gravimetrical method, the conversion could be determinedwithin 1% accuracy.
XD E F E f
F E fds
M S
=− − − ⋅
− ⋅ +
( ) ( )
( ) (2.4)
2.4.2 Particle size (distribution)
The average particle size and particle size distribution are important parameters forthe quality and applications of a latex product. The particle size and the particlesize distribution were determined by two different methods: dynamic lightscattering (DLS) and transmission electron microscopy (TEM).
Dynamic Light Scattering
Dynamic light scattering (Berne et al., 1976; Schmitz, 1990) is a relatively rapidmethod for determining particle sizes. The particles in a latex exhibit Brownianmotion due to collisions of the fluid (water) molecules with the particles. Thismotion is random and the smaller the particles, the faster they move. In DLS theintensity of the scattered light beam is measured at a certain fixed angle to theprimary beam as a function of time. In this study a Malvern Autosizer IIc was used
EXPERIMENTAL METHODS 15
(laser: 5 mW, He-Ne, λ = 633 nm, angle: 90°, T = 25°C). The intensity-weighed
average diameter was measured. For small particles (dp ≤ 60 nm) the scattering isisotropic and the Rayleigh approximation is valid. When particles become larger,they tend to scatter more in forward direction (Mie theory, van de Hulst, 1957). Inthis regime, scattering shows angular dependence and the measurement is morecomplex than for small particles. In this case it is important to use the correctrefractive indices for the particles and the medium, respectively. Samples with abroad particle size distribution are generally difficult to characterize with DLS.
Transmission Electron MicroscopyIn Transmission electron microscopy, the electron beam passes through a thinsample, thus producing an image on a fluorescence screen or photo negative. Withthis technique very small particles (1 nm) are detectable and it is possible to obtaina complete particle size distribution. For the determination of the particle sizedistribution of latex products, a Jeol 2000 FX transmission electron microscopewas used.
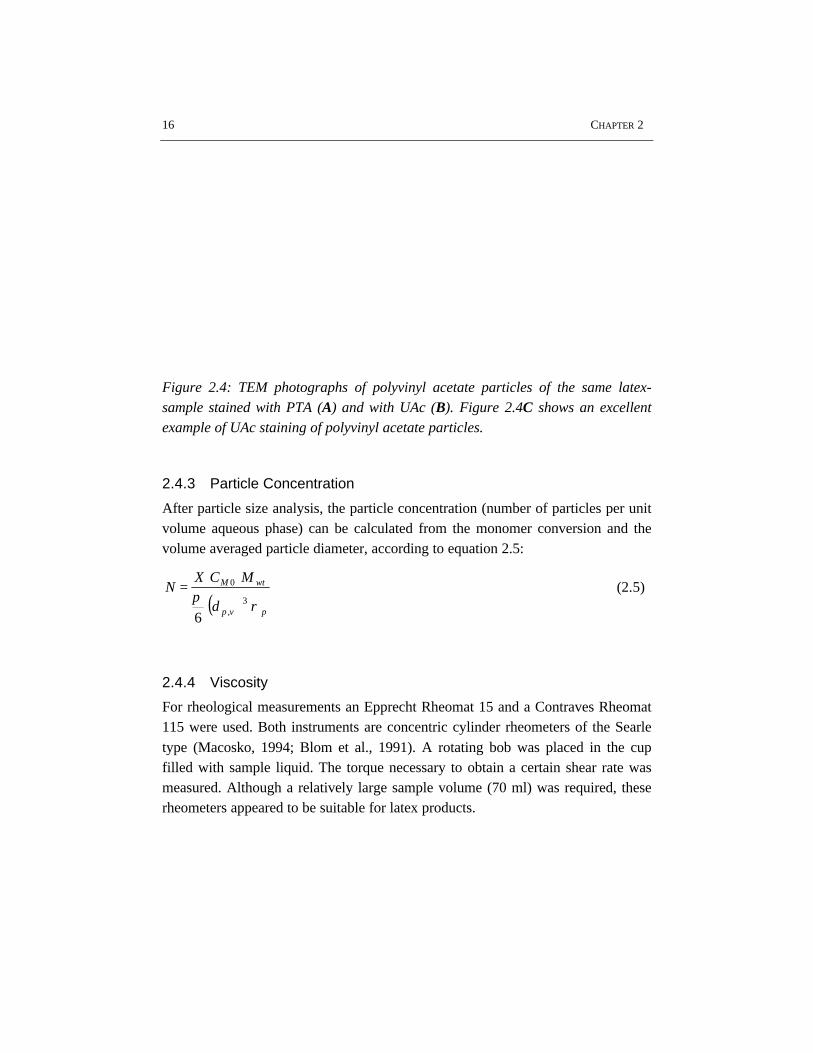
Because of the high glass transition temperature, polystyrene particles are stableenough in the electron beam to provide sufficient contrast for taking micrographs.Since polyvinyl acetate has a low glass transition temperature (Tg = 29 °C), inprinciple the use of a cryo-TEM technique is required. Unfortunately, cryo-TEMfacilities were not available in our laboratory. In order to prepare the polyvinylacetate particles for common TEM analysis several techniques were applied. Inliterature phosphotungstic acid (PTA) (Shaffer et al, 1983; Spit, 1962) as well asuranyl acetate (UAc) (Spit 1967; Hodge et al., 1977) are reported as suitablespecies for staining polyvinyl acetate particles. Our experiments reveal thatstaining with 0.5 wt% UAc solution led to a better contrast around the particles,than staining with 2 wt% PTA solution, see Figure 2.4. However, backgroundartifacts are more pronounced in the case of UAc staining as compared to stainingwith PTA. Hardening of the particles by crosslinking with ethylene glycoldimethacrylate or treatment with UV-light does not improve the TEM-images.Using the technique described above, it is in principle possible to use commonTEM-analysis for characterization of polyvinyl acetate latices, however, thisappeared to be rather time consuming. Therefore, DLS was used to characterize thepolyvinyl acetate latices throughout.
16 CHAPTER 2
Figure 2.4: TEM photographs of polyvinyl acetate particles of the same latex-sample stained with PTA (A) and with UAc (B). Figure 2.4C shows an excellentexample of UAc staining of polyvinyl acetate particles.
2.4.3 Particle Concentration
After particle size analysis, the particle concentration (number of particles per unitvolume aqueous phase) can be calculated from the monomer conversion and thevolume averaged particle diameter, according to equation 2.5:
( ) pv,p
wtM
d
MCXN
ρπ 3
0
6
= (2.5)
2.4.4 Viscosity
For rheological measurements an Epprecht Rheomat 15 and a Contraves Rheomat115 were used. Both instruments are concentric cylinder rheometers of the Searletype (Macosko, 1994; Blom et al., 1991). A rotating bob was placed in the cupfilled with sample liquid. The torque necessary to obtain a certain shear rate wasmeasured. Although a relatively large sample volume (70 ml) was required, theserheometers appeared to be suitable for latex products.
EXPERIMENTAL METHODS 17
2.4.5 Dialysis
Inorganic salts and part of the emulsifier were removed from the seed-latex by
dialysis, using a Lundia Alpha 500 artificial kidney membrane module
containing Cuprophan regenerated cellulose sheets of 8 µm dry thickness anddemineralized water as the extraction liquid. The membrane module had aneffective surface area of 1.0 m2. Although classical dialysis is not the mostappropriate method to remove electrolyte (Brodnyan et al., 1964; Ottewill et al.,1966; Force et al., 1967; Edelhauser, 1969), dialysis with a membrane cell hasshowed to be efficient for cleaning relatively large amounts (10 dm3) of seed latex.The influence of the dialysis procedure used on the ultimate particle size(distribution) of seed latices appeared to be negligible.
2.4.6 Fractional surface coverage of particles with emulsifier
After dialysis of a latex, the particle surface coverage with emulsifier cannot becalculated from the emulsifier concentration in the recipe, because part of thesurfactant is removed during the dialysis process. When both the critical micelleconcentration, CCMC, and specific surface area covered by one mole of emulsifier,AE, are known, the procedure reported by Maron (1954a) and Abbey (1978) can beused to determine the fractional surface coverage of the particles with emulsifier.When a given amount of latex is titrated with a standard surfactant solution andeither the surface tension or conductance is measured as a function of the amountof emulsifier added, an intersection point can be determined, at which the particlesare completely occupied with emulsifier and the aqueous phase is saturated at thecritical micelle concentration, see figure 2.5. The titrated soap is assumed to adsorbpreferentially on the particle surface. The amount of adsorbed emulsifier on thelatex/air surface is assumed to be negligible as compared to the adsorbed emulsifieron the particle surface, since the particle surface area is several orders ofmagnitude larger than the latex/air surface.
From the amount of emulsifier required to reach the intersection point, mE,tot,added,the amount of emulsifier taken up by the latex particles, CE,p can be approximatedby equation 2.6.
CMCintpoint,wp,Eadded,tot,E CVmm += (2.6)
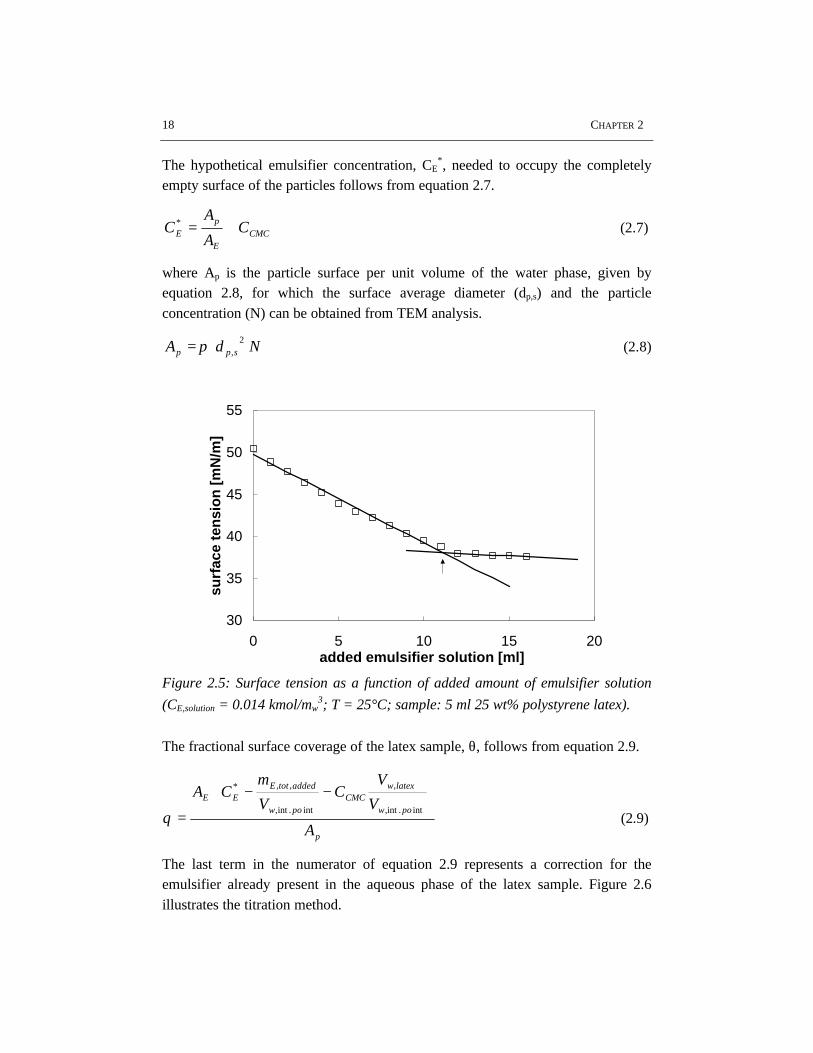
18 CHAPTER 2
The hypothetical emulsifier concentration, CE*, needed to occupy the completely
empty surface of the particles follows from equation 2.7.
CMCE
pE C
A
AC +=* (2.7)
where Ap is the particle surface per unit volume of the water phase, given byequation 2.8, for which the surface average diameter (dp,s) and the particleconcentration (N) can be obtained from TEM analysis.
NdA spp2
,π= (2.8)
30
35
40
45
50
55
0 5 10 15 20added emulsifier solution [ml]
surf
ace
ten
sio
n [
mN
/m]
Figure 2.5: Surface tension as a function of added amount of emulsifier solution
(CE,solution = 0.014 kmol/mw3; T = 25°C; sample: 5 ml 25 wt% polystyrene latex).
The fractional surface coverage of the latex sample, θ, follows from equation 2.9.
p
pow
latexwCMC
pow
addedtotEEE
A
V
VC
V
mCA
−−⋅
=int.int,
,
int.int,
,,*
θ (2.9)
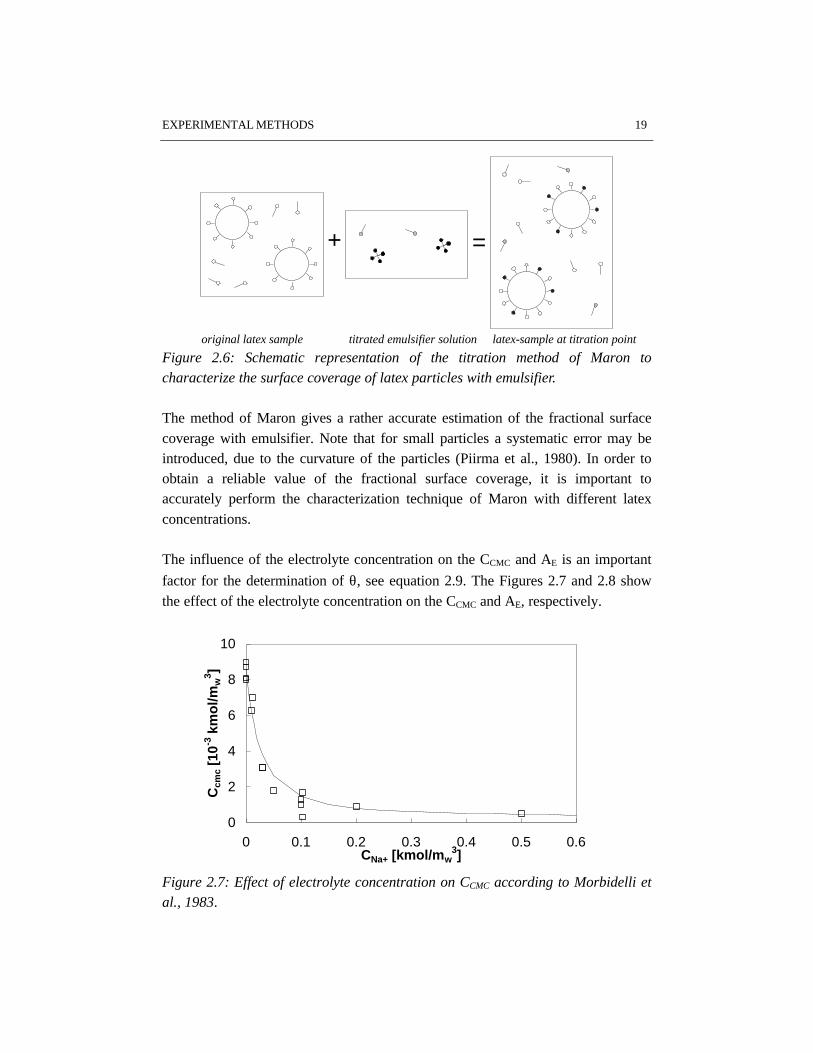
The last term in the numerator of equation 2.9 represents a correction for theemulsifier already present in the aqueous phase of the latex sample. Figure 2.6illustrates the titration method.
EXPERIMENTAL METHODS 19
+ =
original latex sample titrated emulsifier solution latex-sample at titration point
Figure 2.6: Schematic representation of the titration method of Maron tocharacterize the surface coverage of latex particles with emulsifier.
The method of Maron gives a rather accurate estimation of the fractional surfacecoverage with emulsifier. Note that for small particles a systematic error may beintroduced, due to the curvature of the particles (Piirma et al., 1980). In order toobtain a reliable value of the fractional surface coverage, it is important toaccurately perform the characterization technique of Maron with different latexconcentrations.
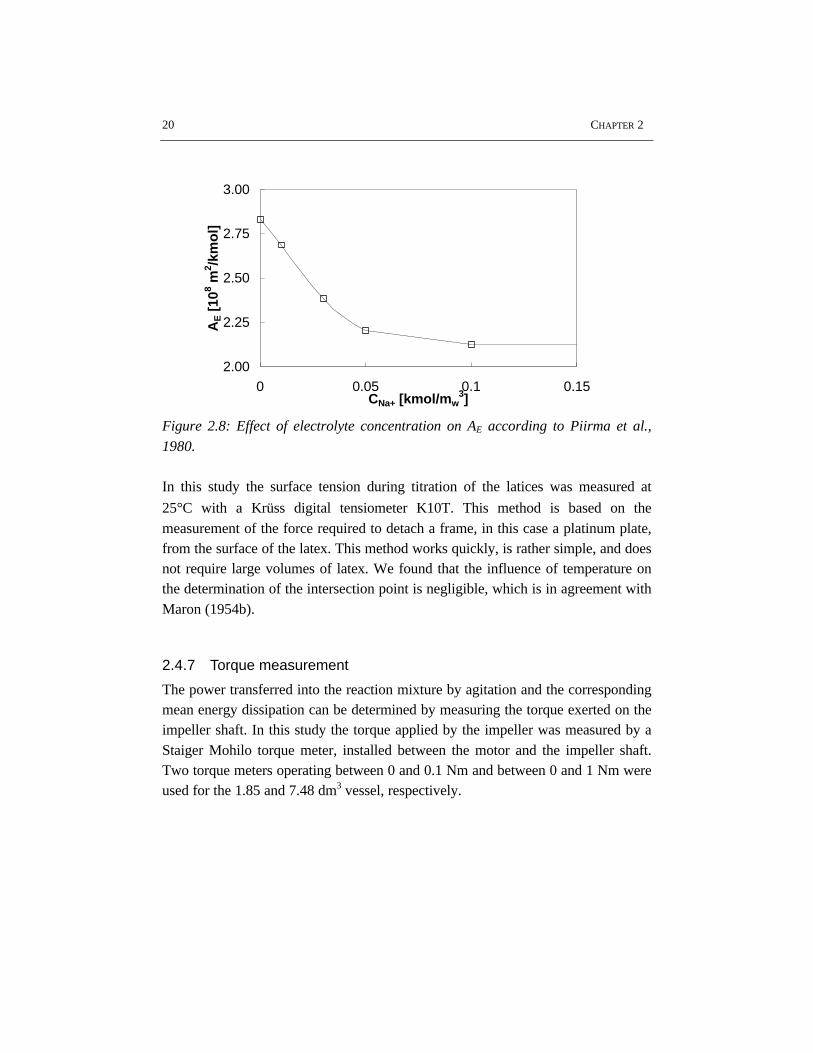
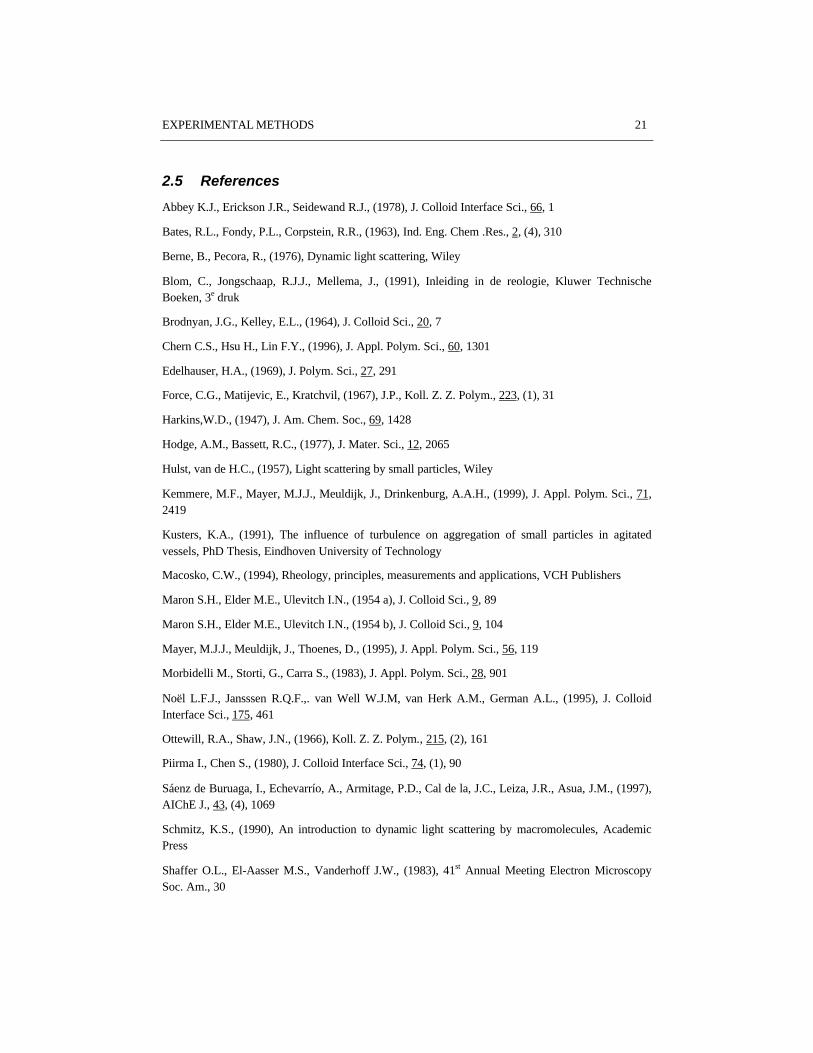
The influence of the electrolyte concentration on the CCMC and AE is an important
factor for the determination of θ, see equation 2.9. The Figures 2.7 and 2.8 showthe effect of the electrolyte concentration on the CCMC and AE, respectively.
0
2
4
6
8
10
0 0.1 0.2 0.3 0.4 0.5 0.6CNa+ [kmol/mw
3]
Ccm
c [1
0-3 k
mo
l/mw
3 ]
Figure 2.7: Effect of electrolyte concentration on CCMC according to Morbidelli etal., 1983.
20 CHAPTER 2
2.00
2.25
2.50
2.75
3.00
0 0.05 0.1 0.15CNa+ [kmol/mw
3]
AE [
108 m
2 /km
ol]
Figure 2.8: Effect of electrolyte concentration on AE according to Piirma et al.,
1980.
In this study the surface tension during titration of the latices was measured at
25°C with a Krüss digital tensiometer K10T. This method is based on themeasurement of the force required to detach a frame, in this case a platinum plate,from the surface of the latex. This method works quickly, is rather simple, and doesnot require large volumes of latex. We found that the influence of temperature onthe determination of the intersection point is negligible, which is in agreement withMaron (1954b).
2.4.7 Torque measurement
The power transferred into the reaction mixture by agitation and the correspondingmean energy dissipation can be determined by measuring the torque exerted on theimpeller shaft. In this study the torque applied by the impeller was measured by aStaiger Mohilo torque meter, installed between the motor and the impeller shaft.Two torque meters operating between 0 and 0.1 Nm and between 0 and 1 Nm wereused for the 1.85 and 7.48 dm3 vessel, respectively.
EXPERIMENTAL METHODS 21
2.5 References
Abbey K.J., Erickson J.R., Seidewand R.J., (1978), J. Colloid Interface Sci., 66, 1
Bates, R.L., Fondy, P.L., Corpstein, R.R., (1963), Ind. Eng. Chem .Res., 2, (4), 310
Berne, B., Pecora, R., (1976), Dynamic light scattering, Wiley
Blom, C., Jongschaap, R.J.J., Mellema, J., (1991), Inleiding in de reologie, Kluwer TechnischeBoeken, 3e druk
Brodnyan, J.G., Kelley, E.L., (1964), J. Colloid Sci., 20, 7
Chern C.S., Hsu H., Lin F.Y., (1996), J. Appl. Polym. Sci., 60, 1301
Edelhauser, H.A., (1969), J. Polym. Sci., 27, 291
Force, C.G., Matijevic, E., Kratchvil, (1967), J.P., Koll. Z. Z. Polym., 223, (1), 31
Harkins,W.D., (1947), J. Am. Chem. Soc., 69, 1428
Hodge, A.M., Bassett, R.C., (1977), J. Mater. Sci., 12, 2065
Hulst, van de H.C., (1957), Light scattering by small particles, Wiley
Kemmere, M.F., Mayer, M.J.J., Meuldijk, J., Drinkenburg, A.A.H., (1999), J. Appl. Polym. Sci., 71,2419
Kusters, K.A., (1991), The influence of turbulence on aggregation of small particles in agitatedvessels, PhD Thesis, Eindhoven University of Technology
Macosko, C.W., (1994), Rheology, principles, measurements and applications, VCH Publishers
Maron S.H., Elder M.E., Ulevitch I.N., (1954 a), J. Colloid Sci., 9, 89
Maron S.H., Elder M.E., Ulevitch I.N., (1954 b), J. Colloid Sci., 9, 104
Mayer, M.J.J., Meuldijk, J., Thoenes, D., (1995), J. Appl. Polym. Sci., 56, 119
Morbidelli M., Storti, G., Carra S., (1983), J. Appl. Polym. Sci., 28, 901
Noël L.F.J., Jansssen R.Q.F.,. van Well W.J.M, van Herk A.M., German A.L., (1995), J. ColloidInterface Sci., 175, 461
Ottewill, R.A., Shaw, J.N., (1966), Koll. Z. Z. Polym., 215, (2), 161
Piirma I., Chen S., (1980), J. Colloid Interface Sci., 74, (1), 90
Sáenz de Buruaga, I., Echevarrío, A., Armitage, P.D., Cal de la, J.C., Leiza, J.R., Asua, J.M., (1997),AIChE J., 43, (4), 1069
Schmitz, K.S., (1990), An introduction to dynamic light scattering by macromolecules, AcademicPress
Shaffer O.L., El-Aasser M.S., Vanderhoff J.W., (1983), 41st Annual Meeting Electron MicroscopySoc. Am., 30
22 CHAPTER 2
Smith, W.V., Ewart, R.H., (1948), J. Chem. Phys., 16, (6), 592
Spit, B.J., (1962), 5th Int. Congress Electron Microscopy
Spit, B.J., (1967), Faserforschung und Textiltechnik, 18, (4), 161
Thoenes, D., (1994), Chemical reactor development, from laboratory to industrial production, KluwerAcademic Publishers
Varela de Rosa, L., Sudol, E.D., El-Aasser, M.S., Klein, A., (1996), J. Polym. Sci., A, 34, 461
EMULSIFICATION IN EMULSION POLYMERIZATION 23
3 EMULSIFICATION IN EMULSION POLYMERIZATION
AbstractDispersion of liquid-liquid systems is commonly applied in industrial processessuch as extraction, suspension and emulsion polymerization. In this chapter, theinfluence of the quality of emulsification on the course and outcome of the batchemulsion polymerization of styrene and vinyl acetate has been studied. For thispurpose, a visual criterion has been applied for determining the lowest impellerspeed for sufficient emulsification (N*
vis). In polymerization experiments at thesame conditions, N*
vis is the critical value above which no further increase inpolymerization rate can be observed (N*
pol). The results show that styrene/wateremulsions are more difficult to emulsify than vinyl acetate/water emulsions. Ingeneral, a large turbine impeller appears to be more effective in emulsifyingmonomer/water dispersions than a pitched blade impeller.
Main part of this chapter has been accepted for publication as M.F. Kemmere, J. Meuldijk, A.A.H.Drinkenburg, and A.L. German, ‘Emulsification in batch emulsion polymerization’, J. Appl. Polym.Sci.
24 CHAPTER 3
3.1 Introduction
At the beginning of a batch emulsion polymerization the monomer is mainlypresent in droplets dispersed in the continuous phase. The droplets serve asmonomer reservoirs, from which mass transfer of monomer occurs through theaqueous phase into the polymer particles. A typical size of the monomer droplets is
about 5 µm (Gilbert, 1995). During emulsion polymerization stirring is necessaryto keep the monomer phase properly dispersed. If the emulsification is notsufficient, the mass transfer of the monomer from the monomer phase to theparticle phase may be limiting. Obviously, such mass transfer limitation affects thecourse and outcome of the polymerization process. The quality of emulsification ofthe monomer is important for the product properties of the ultimate latex product interms of e.g. particle size (distribution). This chapter combines the generalunderstanding of emulsification with the specific characteristics of the emulsionpolymerization process.
3.2 Emulsification
Emulsification is the process of preparing an emulsion by mechanical agitation of asystem containing two approximately immiscible liquids (Becher, 1977). Tofacilitate emulsification, in many cases a surfactant is added. As a result of theGibbs free energy necessary to maintain large oil/water surface areas, emulsionsare thermodynamically not stable. The droplet size distribution is governed by adynamic equilibrium between break up and coalescence of the droplets, therequired energy being supplied by the stirrer.
3.2.1 Droplet size
In a stirred dispersion, deformation of the droplets occurs as a result of the shearforces in the turbulent flow field. The droplets experience viscous shear stresses,pressure variations along their surface and turbulent velocity fluctuations (Hinze,1955; Shinnar, 1961). Break up occurs if the hydrodynamic forces exceed thestabilizing forces originating from the interfacial tension and drop viscosity(Baldyga et al., 1997). Deformation and break up is characterized by the Webernumber, which is proportional to the ratio of inertia forces and surface tensionforces. Break up occurs if the Weber number exceeds a critical value.
EMULSIFICATION IN EMULSION POLYMERIZATION 25
σ
ρ dropdropc dduWe
)(2
= (3.1)
where ρc, ddrop and σ stand for the density of the continuous phase, droplet size andinterfacial tension, respectively. The mean square of relative velocity fluctuationsbetween two diametrically opposite points on the surface of droplets is representedby u2 (Shinnar, 1961).
In emulsion polymerization, monomer droplet sizes are usually smaller than theKolmogorov microscale of turbulence. In the case of isotropic homogeneousturbulence, the viscous shear forces are then dominant in the deformation process.In the case of isotropic homogeneous turbulence, the largest stable droplet sizebefore break up occurs is given by (Shinnar, 1961; Sprow, 1967a):
Φ
=
c
d
av
c
c
Cdηη
εν
ησ
5.0
max ' (3.2)
in which ηc, ηd, νc and εav represent the dynamic viscosity of continuous phase anddispersed phase, the kinematic viscosity of continuous phase and the mean energy
dissipation, respectively. Φ(ηd/ηc) is a function of the ratio of the dynamicviscosity of the continuous and the dispersed phase.
Coalescence of droplets in a turbulent liquid-liquid system is affected by therelative volumes of the continuous and the dispersed phase, the hydrodynamicforces as well as the physico-chemical properties of both phases and of theinterface (Pacek et al., 1997). The rate of coalescence is determined by thecollision frequency and coalescence efficiency. The latter strongly depends on thethickness and physico-chemical properties of the thin liquid film between twoapproaching droplets. According to Ivanov (1980), the rate of film thinning and thecritical film thickness at which film rupture occurs, are both influenced by theemulsifier present at the interface of the droplets. For monomer droplets smallerthan the Kolmogorov microscale, the smallest stable droplet size beforecoalescence occurs can be given by (Sprow, 1967a):
25.05.0
min ''
=
av
c
c
FCd
εν
η (3.3)
26 CHAPTER 3
in which F represents the interaction force between two droplets. Since a pseudosteady state is reached at equal rates of break up and coalescence, the averagemonomer droplet size in a particular emulsion system is between the droplet sizecalculated with equation 3.3 and the one calculated with equation 3.2.
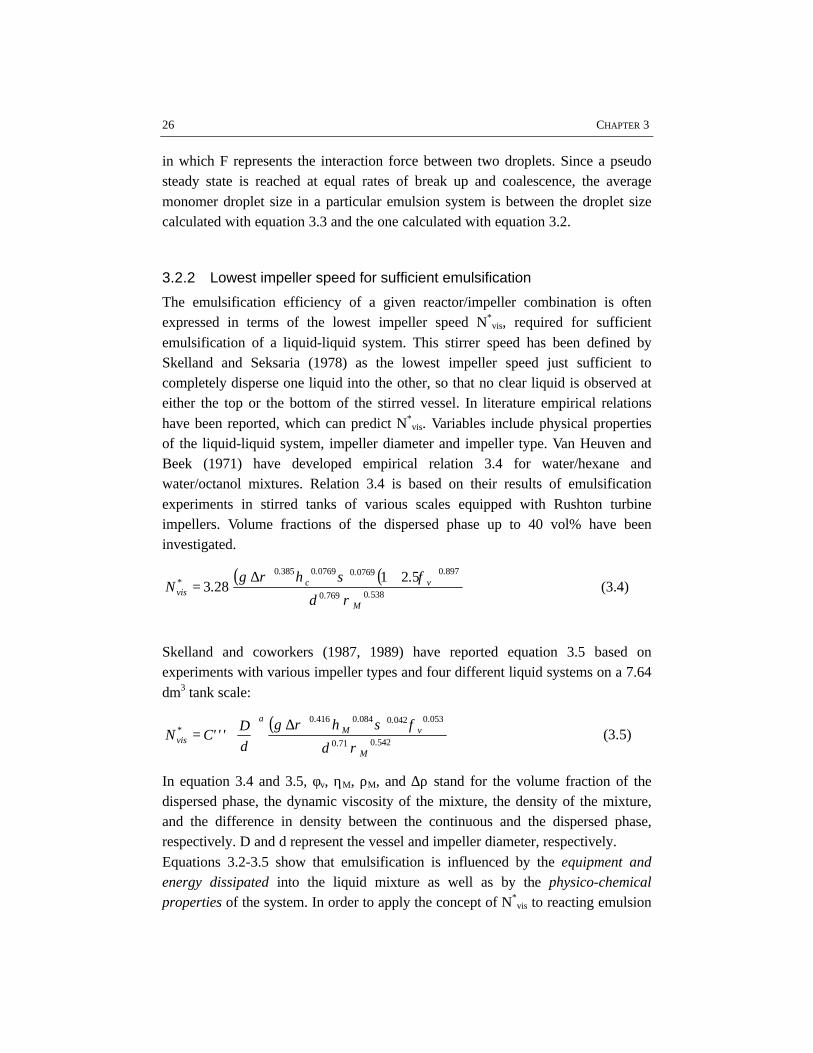
3.2.2 Lowest impeller speed for sufficient emulsification
The emulsification efficiency of a given reactor/impeller combination is oftenexpressed in terms of the lowest impeller speed N*
vis, required for sufficientemulsification of a liquid-liquid system. This stirrer speed has been defined bySkelland and Seksaria (1978) as the lowest impeller speed just sufficient tocompletely disperse one liquid into the other, so that no clear liquid is observed ateither the top or the bottom of the stirred vessel. In literature empirical relationshave been reported, which can predict N*
vis. Variables include physical propertiesof the liquid-liquid system, impeller diameter and impeller type. Van Heuven andBeek (1971) have developed empirical relation 3.4 for water/hexane andwater/octanol mixtures. Relation 3.4 is based on their results of emulsificationexperiments in stirred tanks of various scales equipped with Rushton turbineimpellers. Volume fractions of the dispersed phase up to 40 vol% have beeninvestigated.
( ) ( )53807690
897007690076903850 521283
.M
.
.v
..c
.*vis
d
.g.N
ρ
φσηρ +∆= (3.4)
Skelland and coworkers (1987, 1989) have reported equation 3.5 based onexperiments with various impeller types and four different liquid systems on a 7.64dm3 tank scale:
( )5420710
0530042008404160
.M
.
.v
..M
.*vis
d
g
d
D'''CN
ρ
φσηρα ∆
= (3.5)
In equation 3.4 and 3.5, φv, ηM, ρM, and ∆ρ stand for the volume fraction of thedispersed phase, the dynamic viscosity of the mixture, the density of the mixture,and the difference in density between the continuous and the dispersed phase,respectively. D and d represent the vessel and impeller diameter, respectively.Equations 3.2-3.5 show that emulsification is influenced by the equipment andenergy dissipated into the liquid mixture as well as by the physico-chemicalproperties of the system. In order to apply the concept of N*
vis to reacting emulsion
EMULSIFICATION IN EMULSION POLYMERIZATION 27
systems, polymerization experiments have to be carried out to determine the lowestimpeller speed to allow for polymerization with maximum rate, N*
pol. The questionis whether N*
pol equals N*vis as determined from visualization experiments without
reaction.
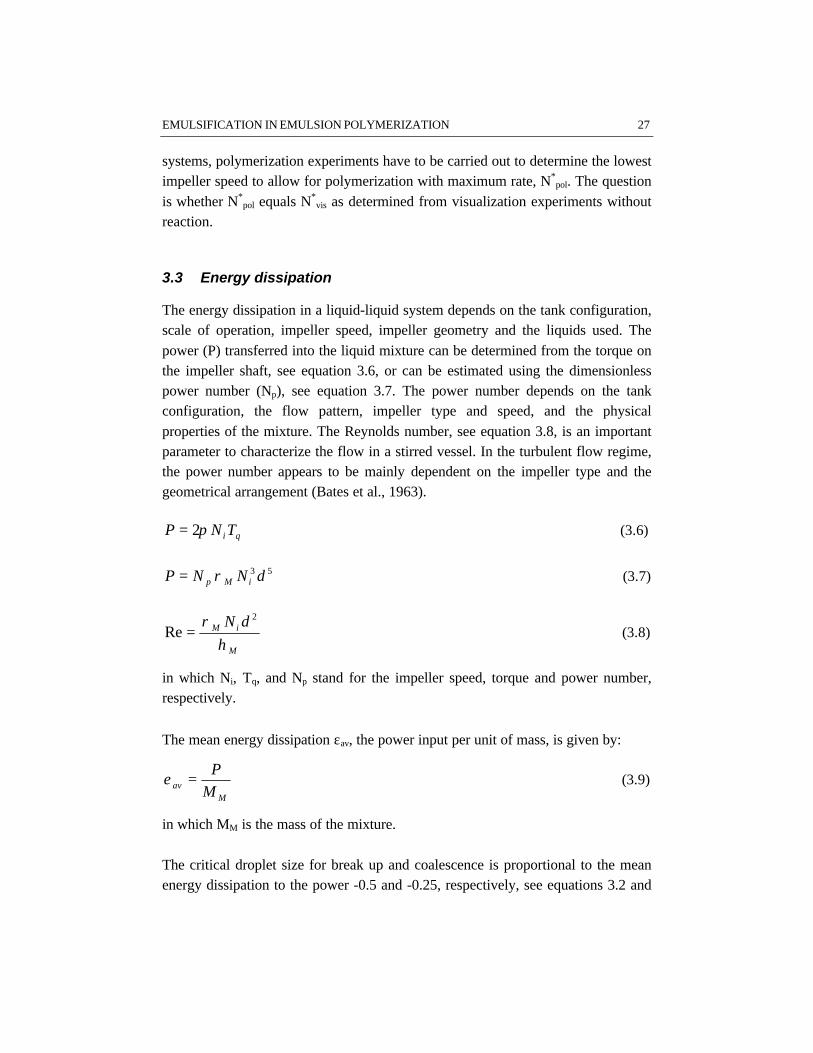
3.3 Energy dissipation
The energy dissipation in a liquid-liquid system depends on the tank configuration,scale of operation, impeller speed, impeller geometry and the liquids used. Thepower (P) transferred into the liquid mixture can be determined from the torque onthe impeller shaft, see equation 3.6, or can be estimated using the dimensionlesspower number (Np), see equation 3.7. The power number depends on the tankconfiguration, the flow pattern, impeller type and speed, and the physicalproperties of the mixture. The Reynolds number, see equation 3.8, is an importantparameter to characterize the flow in a stirred vessel. In the turbulent flow regime,the power number appears to be mainly dependent on the impeller type and thegeometrical arrangement (Bates et al., 1963).
qi TNP π2= (3.6)
53 dNNP iMp ρ= (3.7)
M
iM dN
ηρ 2
Re = (3.8)
in which Ni, Tq, and Np stand for the impeller speed, torque and power number,respectively.
The mean energy dissipation εav, the power input per unit of mass, is given by:
Mav M
P=ε (3.9)
in which MM is the mass of the mixture.
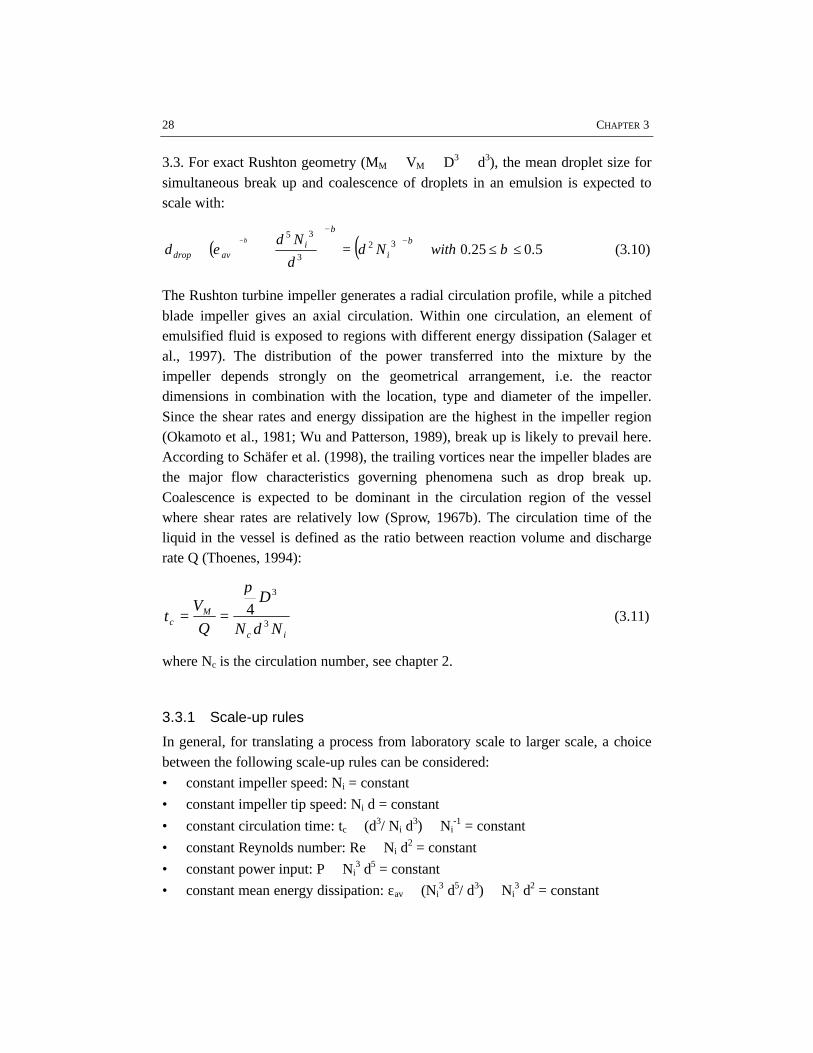
The critical droplet size for break up and coalescence is proportional to the meanenergy dissipation to the power -0.5 and -0.25, respectively, see equations 3.2 and
28 CHAPTER 3
3.3. For exact Rushton geometry (MM ∝ VM ∝ D3 ∝ d3), the mean droplet size forsimultaneous break up and coalescence of droplets in an emulsion is expected toscale with:
( ) ( ) 5.025.0323
35
≤≤=
∝∝
−−
−
βεβ
ββ
withNdd
Ndd i
iavdrop (3.10)
The Rushton turbine impeller generates a radial circulation profile, while a pitchedblade impeller gives an axial circulation. Within one circulation, an element ofemulsified fluid is exposed to regions with different energy dissipation (Salager etal., 1997). The distribution of the power transferred into the mixture by theimpeller depends strongly on the geometrical arrangement, i.e. the reactordimensions in combination with the location, type and diameter of the impeller.Since the shear rates and energy dissipation are the highest in the impeller region(Okamoto et al., 1981; Wu and Patterson, 1989), break up is likely to prevail here.According to Schäfer et al. (1998), the trailing vortices near the impeller blades arethe major flow characteristics governing phenomena such as drop break up.Coalescence is expected to be dominant in the circulation region of the vesselwhere shear rates are relatively low (Sprow, 1967b). The circulation time of theliquid in the vessel is defined as the ratio between reaction volume and dischargerate Q (Thoenes, 1994):
ic
Mc
NdN
D
Q
Vt
3
3
4
π
== (3.11)
where Nc is the circulation number, see chapter 2.
3.3.1 Scale-up rules
In general, for translating a process from laboratory scale to larger scale, a choicebetween the following scale-up rules can be considered:
• constant impeller speed: Ni = constant
• constant impeller tip speed: Ni d = constant
• constant circulation time: tc ∝ (d3/ Ni d3) ∝ Ni
-1 = constant
• constant Reynolds number: Re ∝ Ni d2 = constant
• constant power input: P ∝ Ni3 d5 = constant
• constant mean energy dissipation: εav ∝ (Ni3 d5/ d3) ∝ Ni
3 d2 = constant
EMULSIFICATION IN EMULSION POLYMERIZATION 29
Several authors have investigated the scale-up of emulsification processes. Esch etal. (1971) have suggested that scaling-up of reactors for heterogeneous liquidsystems requires a constant batch mixing time. The batch mixing time is defined asthe product of the circulation time and the number of cycles required to obtain auniform distribution of the dispersed phase throughout the vessel. Esch et al.(1971) use the relationship Ni d
0.15 = constant to predict a constant batch mixingtime on different scales. Van Heuven and Beek (1971) have reported differentscale-up rules for both droplet size and N*
vis. According to the results reported byVan Heuven and Beek, the droplet size will be constant by scaling-up on the basisof a constant mean energy dissipation. To predict N*
vis on different scales, they useNi d
0.77 = constant, see equation 3.4. According to Skelland and Ramsay (1987),N*
vis can be predicted by scaling-up with Ni d 0.71 = constant, see equation 3.5.According to Zhou and Kresta (1998a, 1998b) both energy dissipation and flow areimportant factors in considering the scale-up of liquid-liquid dispersions. Theseauthors have suggested that the mean drop size distribution is better correlated tothe maximum local energy dissipation rate than to either the average power inputper unit mass of the dispersion or the impeller tip speed.
3.4 Physico-chemical properties of the system
3.4.1 Emulsifier
The emulsifier used in the system affects the emulsification of the monomer andother aspects of the polymerization process, such as nucleation and colloidalstability. The present study deals with the effects of the anionic surfactant sodiumdodecyl sulfate. The type as well as the concentration of the surfactant areimportant. Hoedemakers (1990) has observed considerable differences inemulsification of styrene/water mixtures when using rosin acid soap or sodiumdodecyl sulfate as emulsifier. This work, however, only discusses the influence ofsurfactant concentration.
The effect of the surfactant concentration on emulsification is twofold. Theemulsifier lowers the interfacial tension, thus making the shear generated by thestirring device more effective in breaking up droplets. Additionally, surfactantretards the film thinning between two approaching droplets. This results in a lowercoalescence efficiency and hence in a lower coalescence rate. Effects of adsorbed
30 CHAPTER 3
emulsifier on the droplet surface are likely to be more important when neighboringinterfaces are close, which is the case for high monomer fractions (Salager et al.,1997). The overall effect of surfactant in the emulsion system is a smaller dropletsize at higher emulsifier concentration up to the critical micelle concentration,CCMC. Above the CCMC, the interfacial tension does not change upon a furtherincrease of the emulsifier concentration. In this case the break up is hardlysensitive to changes in emulsifier concentration (Salager et al., 1997).
The presence of the surfactant also affects the emulsion polymerization itself. Forcase 2 kinetics, which is generally obeyed by the emulsion polymerization ofstyrene, Smith and Ewart (1948) have derived the following relation for theparticle number (N) and polymerization rate (Rp):
( ) 6.0,
4.00, CMCovEIp CCCRN −∝∝ (3.12)
where CI,0 and CE,ov stand for the initial concentrations of initiator and emulsifier,respectively. CCMC is the critical micelle concentration. Increasing the emulsifierconcentration results in a higher polymerization rate. Apparently, forpolymerization the excess emulsifier over the CCMC is relevant. Consequently, thetime constant of monomer transfer from the monomer droplets through the aqueousphase to the growing polymer particles should be sufficiently short to avoid anylimitations in the polymerization rate. The monomer-water interfacial area has tobe large enough to ensure that the polymerization rate will be governed by intrinsickinetics.
A different mechanism applies for the emulsion polymerization of more water-soluble monomers such as vinyl acetate. In this case, homogeneous nucleationplays an important role (Hansen and Ugelstad, 1978). A kinetic relation has beendeveloped for the period of constant reaction rate, based on Ugelstad et al. (1967),see equation 3.13 (Nomura, 1982; Meuldijk et al., 1992). In the case ofhomogeneous nucleation, the emulsifier concentration has no influence on thereaction rate.
5.0Ip CR ∝ (3.13)
EMULSIFICATION IN EMULSION POLYMERIZATION 31
3.4.2 Monomer
Both the type and volume fraction of monomer affect the emulsification of thesystem. In this study the emulsification of styrene and vinyl acetate emulsions hasbeen investigated. Physical properties such as the density, water solubility andviscosity of the monomer as well as the interfacial tension between the water andmonomer phase are important parameters. Fontenot and Schork (1993) haveobserved that less water soluble monomers such as styrene are more difficult toemulsify as compared to more water soluble monomers like vinyl acetate, due todifferences in physico-chemical properties.
A higher volume fraction of monomer in the system results in a higher collisionfrequency of the droplets and consequently in a higher coalescence rate. Theviscosity of the emulsion also changes, due to the increased mutual interactionbetween the droplets at a high monomer fraction in the system. According toequations 3.12 and 3.13, the monomer concentration does not affect the rate ofpolymerization of styrene and vinyl acetate.
3.4.3 Reaction temperature
The temperature affects both emulsification and polymerization. An increase intemperature can have different effects on droplet size (Salager et al., 1997). Due toa higher temperature, the internal phase viscosity decreases, thus enhancing thedroplet break up rate. On the other hand, a higher temperature reduces thesurfactant adsorption, increasing the interfacial tension. A high interfacial tensionfavors coalescence and lowers the break up of droplets. Depending on the systemused and the magnitude of the temperature change, one of both effects prevails.The emulsion polymerization reaction is affected by temperature, since both theinitiator decomposition rate and propagation rate are dependent on temperatureaccording to the Arrhenius equation. Since higher temperatures result in higherpolymerization rates, the requirements for sufficient emulsification of the monomerbecome even more stringent.
3.5 Results and discussion
Initially, two methods for droplet size measurement in emulsion systems have beenapplied: off-line laser diffraction spectrometry using a Malvern 2600HSL particle
32 CHAPTER 3
sizer (Hoedemakers, 1990) and an on-line laser back-scattering technique, using aPartec 100 apparatus (van den Boomen and Akhssay, 1997). Both methods haveshown limitations for the investigation of emulsification. Applying the off-linemethod, samples are strongly diluted, approaching the water solubility of themonomer. Because of this strong dilution, the droplets may dissolve partially in theaqueous phase. Besides that, the samples have to be stable for a period of at least10 minutes, which is not very likely considering the low internal viscosity of themonomer droplets. The results obtained by Hoedemakers (1990) deviate fromresults reported in literature (Nomura et al., 1972), probably for this reason. Also,the on-line method will not give reliable quantitative information on droplet sizes(van den Boomen and Akhssay, 1997) as a result of the disturbance by air bubbles.Nevertheless, it is possible to observe trends in droplet size as a function of energydissipation and monomer volume fraction. Concerning styrene/water emulsionswithout emulsifier, the results indicate that for low volume fractions of dispersed
phase (< 10 vol% styrene), the break-up mechanism (β ≈ 0.5, see equation 3.10)appears to be dominant, whereas for high volume fractions of dispersed phase (>
25 vol% styrene) the coalescence of the droplets is the predominant mechanism (β≈ 0.25, see equation 3.10). Major drawback of the on-line back-scatteringtechnique is that it is impossible to measure droplet sizes in liquid-liquid systemswith surfactants. In those systems the monomer droplets are generally too small tobe measured with this technique. As the measurement of a critical droplet size onlyresults in a certain arbitrary defined number, we have chosen to use the visualobservation of sufficient emulsification based on N*
vis throughout.
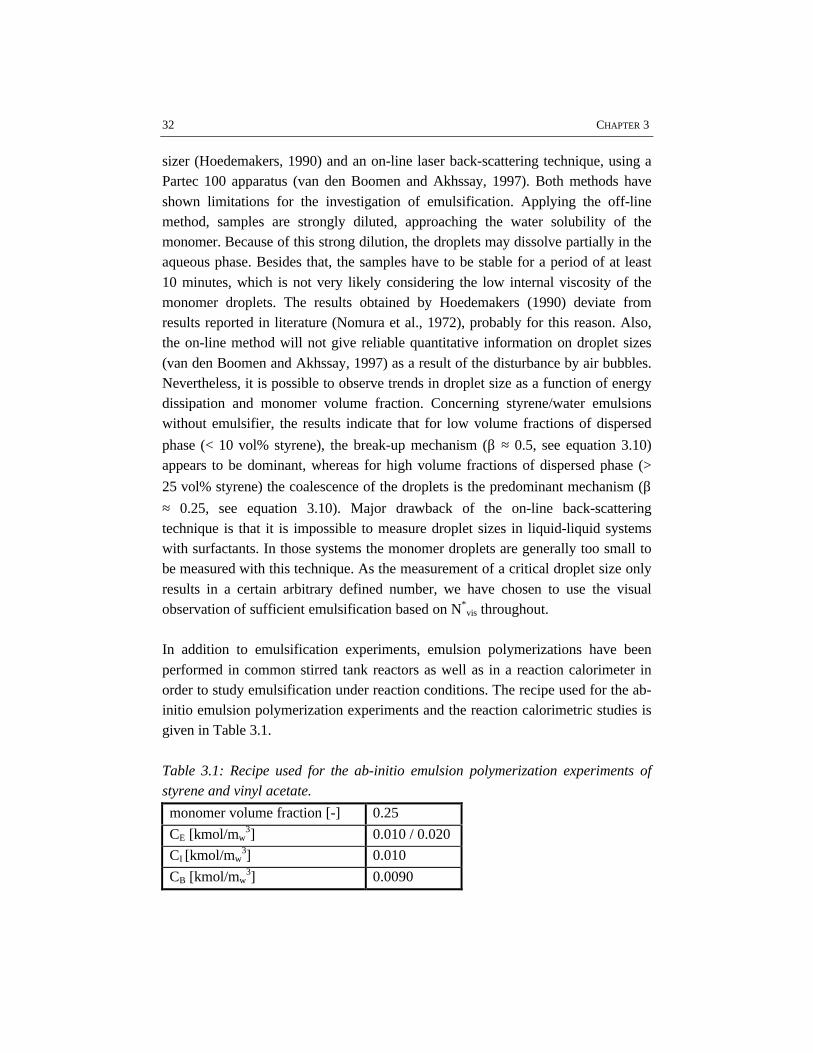
In addition to emulsification experiments, emulsion polymerizations have beenperformed in common stirred tank reactors as well as in a reaction calorimeter inorder to study emulsification under reaction conditions. The recipe used for the ab-initio emulsion polymerization experiments and the reaction calorimetric studies isgiven in Table 3.1.
Table 3.1: Recipe used for the ab-initio emulsion polymerization experiments ofstyrene and vinyl acetate.
monomer volume fraction [-] 0.25
CE [kmol/mw3] 0.010 / 0.020
CI [kmol/mw3] 0.010
CB [kmol/mw3] 0.0090
EMULSIFICATION IN EMULSION POLYMERIZATION 33
3.5.1 Emulsification in styrene/water mixtures
Visualization and polymerization experiments have been performed on both 1.85and 7.48 dm3 scale, for which the results are given in Appendix A.
Visualization experiments for studying emulsificationThe critical stirrer speeds N*
vis as determined by visualization experiments on 1.85dm3 scale, have been collected in Table A.1. The results show that the influence ofemulsifier on N*
vis is twofold. The difference between N*vis for water/styrene
mixtures with and without emulsifier is considerable (e.g. 550 rpm versus 320 rpm,respectively for the given examples, see experiments 1 and 2). Increasing theemulsifier concentration from 0.01 to 0.08 kmol/mw
3 only slightly influences N*vis.
These results support the explanation given by Salager et al. (1997), that foremulsifier concentrations above the critical micelle concentration no significantinfluence of emulsifier concentration on the emulsification process can beexpected.
An increase in the monomer weight fraction from 0.25 to 0.50 does not changeN*
vis under further equal circumstances, see e.g. experiments 1 and 3. All systemsused in this study have rather high monomer concentrations. Apparently, theemulsification is not significantly sensitive to variations in monomer concentrationfor systems at the monomer concentration level used. This result is in contrast withdiluted systems in which the concentration of dispersed phase significantlyinfluences the emulsification (Pacek et al., 1997).
At higher temperature (50 °C versus 20 °C), a higher N*vis for emulsification is
found, see e.g. experiments 2 and 5. A possible explanation is, that highertemperatures result in a higher interfacial tension. The opposite effect of a lowerinternal viscosity of the dispersed phase resulting from an increase in temperature,(Salager et al., 1997) appears to be not significant for the dispersions investigatedin this study. The viscosity of the monomer droplets only varies slightly withtemperature.
Visualization experiments have also been carried out in the presence of latexparticles. In Table A.1 these experiments are marked with +. The results show thatthe presence of polymer particles increases N*
vis in all cases, but in particular in theexperiment with a pitched blade impeller of d = 1/3D, see experiment 19.Apparently, this impeller is less effective for emulsification. The increase in N*
vis
34 CHAPTER 3
as compared to visualization experiments without latex particles probably resultsfrom a redistribution of the overall amount of emulsifier in the system. As a resultof adsorption of the emulsifier on the surface of the latex particles, there will beless emulsifier available for the stabilization of the monomer droplets.
In Table A.2 the values of N*vis, determined on a 7.48 dm3 scale with a monomer
volume fraction of 0.25, are collected. The results on 1.85 dm3 scale concerning theinfluence of temperature and the presence of polymer particles in the system, areconfirmed by the results on a 7.48 dm3 scale.
The results given in the Tables A.1 and A.2 demonstrate a significant influence ofthe impeller type and diameter on N*
vis. In agreement with Johansson and Godfrey(1997), our results show that the Rushton turbine impeller requires less power perunit of mass than the pitched blade impeller for the same emulsion system. Thedifferent performances of the impellers used are even more pronounced on thelarger scale. The results indicate that for the same average power input per unit ofmass, a Rushton turbine provides better emulsification as compared to a pitchedblade impeller. This different performance of the two impeller types originatesfrom a different flow pattern and a different energy dissipation distribution in thevessel: a turbine impeller generates a less uniform energy dissipation distributionthan a pitched blade impeller (Tiljander et al., 1997). It has, however, to be notedthat the torque on the impeller shaft determined on 1.85 dm3 scale has a limitedaccuracy. This limited accuracy originates from the low absolute value of thetorque for low viscosity mixtures. Consequently, the differences between ‘torque’-based and ‘power number’-based mean energy dissipation are significantly largeras compared to the 7.48 dm3 scale, because of the better accuracy of the torquemeasurement on the larger scale. Despite the different flow patterns of the turbineand the pitched blade impeller, the circulation time, as calculated with equation3.11, and the experimentally determined N*
vis, does not show remarkabledifferences between the two impellers.
The results of the various scale-up rules for N*vis on scaling-up from 1.85 dm3 to
7.48 dm3 are presented in Table A.3. The experimentally observed values of N*vis
on both scales are also given in Table A.3. The underlined stirrer speed gives theclosest approach to the experimentally determined value of N*
vis on 7.48 dm3 scalefor a particular system. When using a constant Reynolds number or a constantpower input for scale-up, the experimentally determined values of N*
vis are always
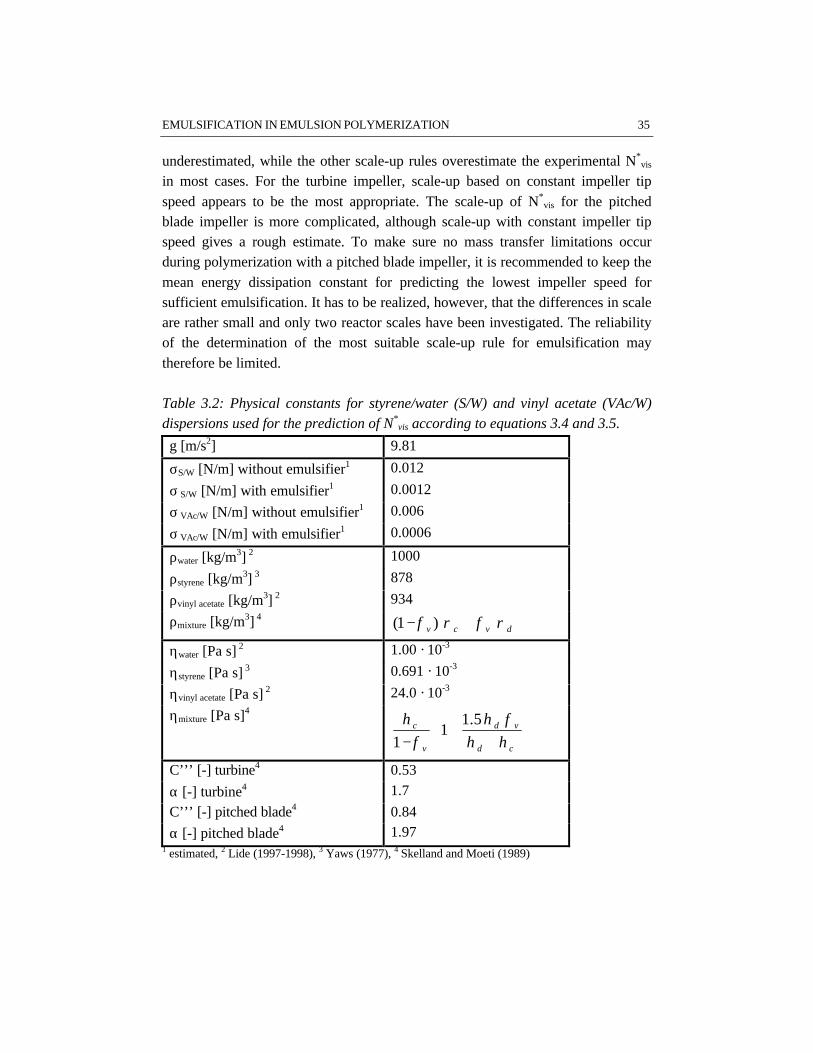
EMULSIFICATION IN EMULSION POLYMERIZATION 35
underestimated, while the other scale-up rules overestimate the experimental N*vis
in most cases. For the turbine impeller, scale-up based on constant impeller tipspeed appears to be the most appropriate. The scale-up of N*
vis for the pitchedblade impeller is more complicated, although scale-up with constant impeller tipspeed gives a rough estimate. To make sure no mass transfer limitations occurduring polymerization with a pitched blade impeller, it is recommended to keep themean energy dissipation constant for predicting the lowest impeller speed forsufficient emulsification. It has to be realized, however, that the differences in scaleare rather small and only two reactor scales have been investigated. The reliabilityof the determination of the most suitable scale-up rule for emulsification maytherefore be limited.
Table 3.2: Physical constants for styrene/water (S/W) and vinyl acetate (VAc/W)dispersions used for the prediction of N*
vis according to equations 3.4 and 3.5.
g [m/s2] 9.81
σS/W [N/m] without emulsifier1 0.012
σ S/W [N/m] with emulsifier1 0.0012
σ VAc/W [N/m] without emulsifier1 0.006
σ VAc/W [N/m] with emulsifier1 0.0006
ρwater [kg/m3] 2 1000
ρstyrene [kg/m3] 3 878
ρvinyl acetate [kg/m3] 2 934
ρmixture [kg/m3] 4dvcv ρφρφ +− )1(
ηwater [Pa s] 2 1.00 · 10-3
ηstyrene [Pa s] 3 0.691 · 10-3
ηvinyl acetate [Pa s] 2 24.0 · 10-3
ηmixture [Pa s]4
+
+− cd
vd
v
c
ηηφη
φη 5.1
11
C’’’ [-] turbine4 0.53
α [-] turbine4 1.7
C’’’ [-] pitched blade4 0.84
α [-] pitched blade4 1.971 estimated, 2 Lide (1997-1998), 3 Yaws (1977), 4 Skelland and Moeti (1989)
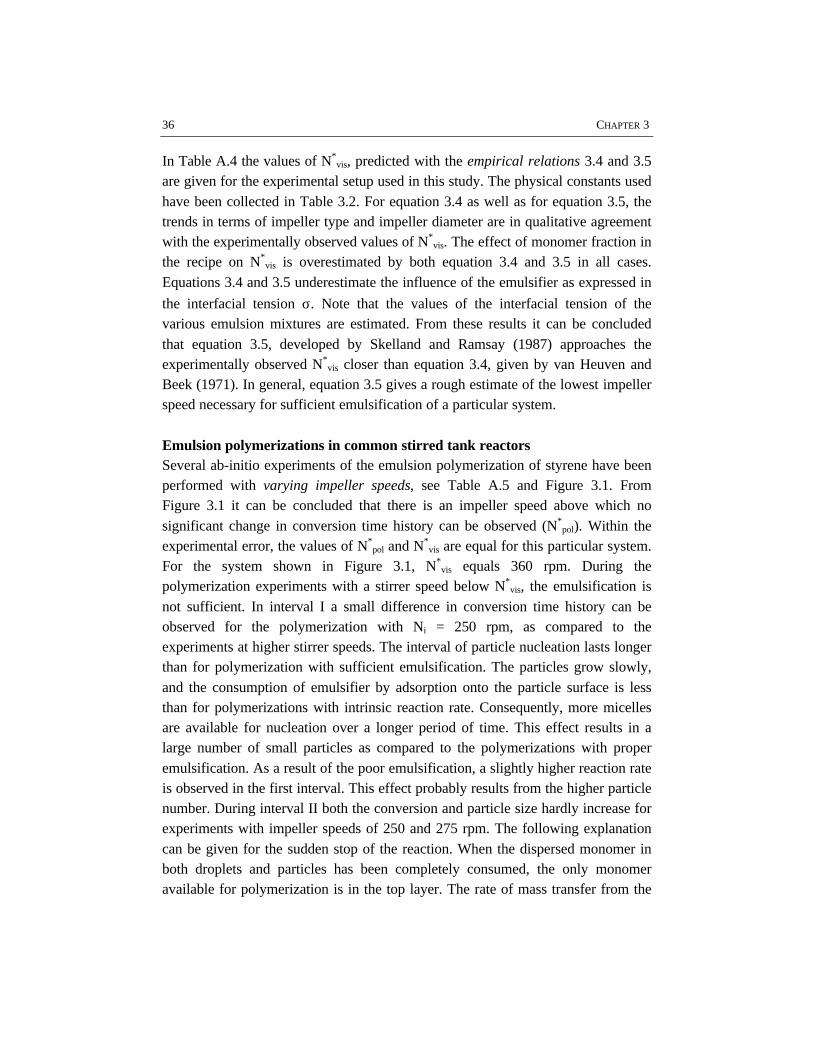
36 CHAPTER 3
In Table A.4 the values of N*vis, predicted with the empirical relations 3.4 and 3.5
are given for the experimental setup used in this study. The physical constants usedhave been collected in Table 3.2. For equation 3.4 as well as for equation 3.5, thetrends in terms of impeller type and impeller diameter are in qualitative agreementwith the experimentally observed values of N*
vis. The effect of monomer fraction inthe recipe on N*
vis is overestimated by both equation 3.4 and 3.5 in all cases.Equations 3.4 and 3.5 underestimate the influence of the emulsifier as expressed in
the interfacial tension σ. Note that the values of the interfacial tension of thevarious emulsion mixtures are estimated. From these results it can be concludedthat equation 3.5, developed by Skelland and Ramsay (1987) approaches theexperimentally observed N*
vis closer than equation 3.4, given by van Heuven andBeek (1971). In general, equation 3.5 gives a rough estimate of the lowest impellerspeed necessary for sufficient emulsification of a particular system.
Emulsion polymerizations in common stirred tank reactorsSeveral ab-initio experiments of the emulsion polymerization of styrene have beenperformed with varying impeller speeds, see Table A.5 and Figure 3.1. FromFigure 3.1 it can be concluded that there is an impeller speed above which nosignificant change in conversion time history can be observed (N*
pol). Within theexperimental error, the values of N*
pol and N*vis are equal for this particular system.
For the system shown in Figure 3.1, N*vis equals 360 rpm. During the
polymerization experiments with a stirrer speed below N*vis, the emulsification is
not sufficient. In interval I a small difference in conversion time history can beobserved for the polymerization with Ni = 250 rpm, as compared to theexperiments at higher stirrer speeds. The interval of particle nucleation lasts longerthan for polymerization with sufficient emulsification. The particles grow slowly,and the consumption of emulsifier by adsorption onto the particle surface is lessthan for polymerizations with intrinsic reaction rate. Consequently, more micellesare available for nucleation over a longer period of time. This effect results in alarge number of small particles as compared to the polymerizations with properemulsification. As a result of the poor emulsification, a slightly higher reaction rateis observed in the first interval. This effect probably results from the higher particlenumber. During interval II both the conversion and particle size hardly increase forexperiments with impeller speeds of 250 and 275 rpm. The following explanationcan be given for the sudden stop of the reaction. When the dispersed monomer inboth droplets and particles has been completely consumed, the only monomeravailable for polymerization is in the top layer. The rate of mass transfer from the
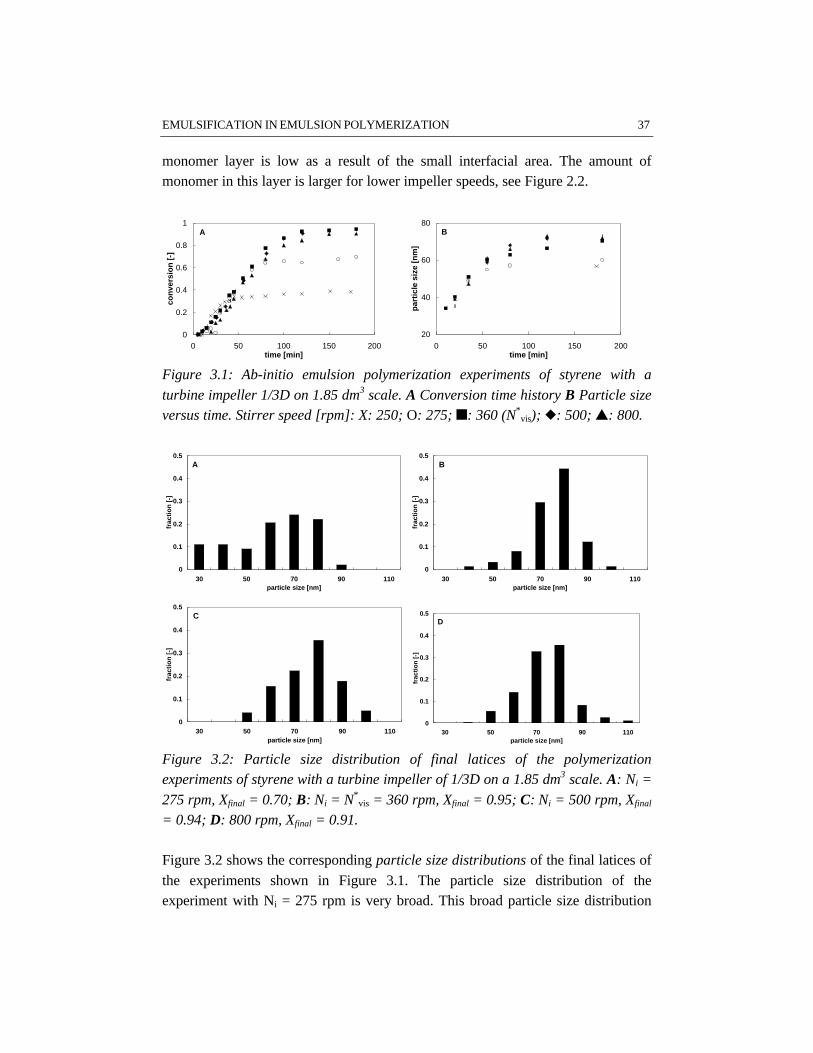
EMULSIFICATION IN EMULSION POLYMERIZATION 37
monomer layer is low as a result of the small interfacial area. The amount ofmonomer in this layer is larger for lower impeller speeds, see Figure 2.2.
0
0.2
0.4
0.6
0.8
1
0 50 100 150 200time [min]
con
vers
ion
[-]
A
20
40
60
80
0 50 100 150 200time [min]
par
ticl
e si
ze [
nm
]
B
Figure 3.1: Ab-initio emulsion polymerization experiments of styrene with a
turbine impeller 1/3D on 1.85 dm3 scale. A Conversion time history B Particle sizeversus time. Stirrer speed [rpm]: X: 250; O: 275; n: 360 (N*
vis); u: 500; s: 800.
0
0.1
0.2
0.3
0.4
0.5
30 50 70 90 110particle size [nm]
frac
tio
n [
-]
A
0
0.1
0.2
0.3
0.4
0.5
30 50 70 90 110particle size [nm]
frac
tio
n [
-]
B
0
0.1
0.2
0.3
0.4
0.5
30 50 70 90 110particle size [nm]
frac
tio
n [
-]
C
0
0.1
0.2
0.3
0.4
0.5
30 50 70 90 110particle size [nm]
frac
tio
n [
-]
D
Figure 3.2: Particle size distribution of final latices of the polymerizationexperiments of styrene with a turbine impeller of 1/3D on a 1.85 dm3 scale. A: Ni =
275 rpm, Xfinal = 0.70; B: Ni = N*vis = 360 rpm, Xfinal = 0.95; C: Ni = 500 rpm, Xfinal
= 0.94; D: 800 rpm, Xfinal = 0.91.
Figure 3.2 shows the corresponding particle size distributions of the final latices ofthe experiments shown in Figure 3.1. The particle size distribution of theexperiment with Ni = 275 rpm is very broad. This broad particle size distribution
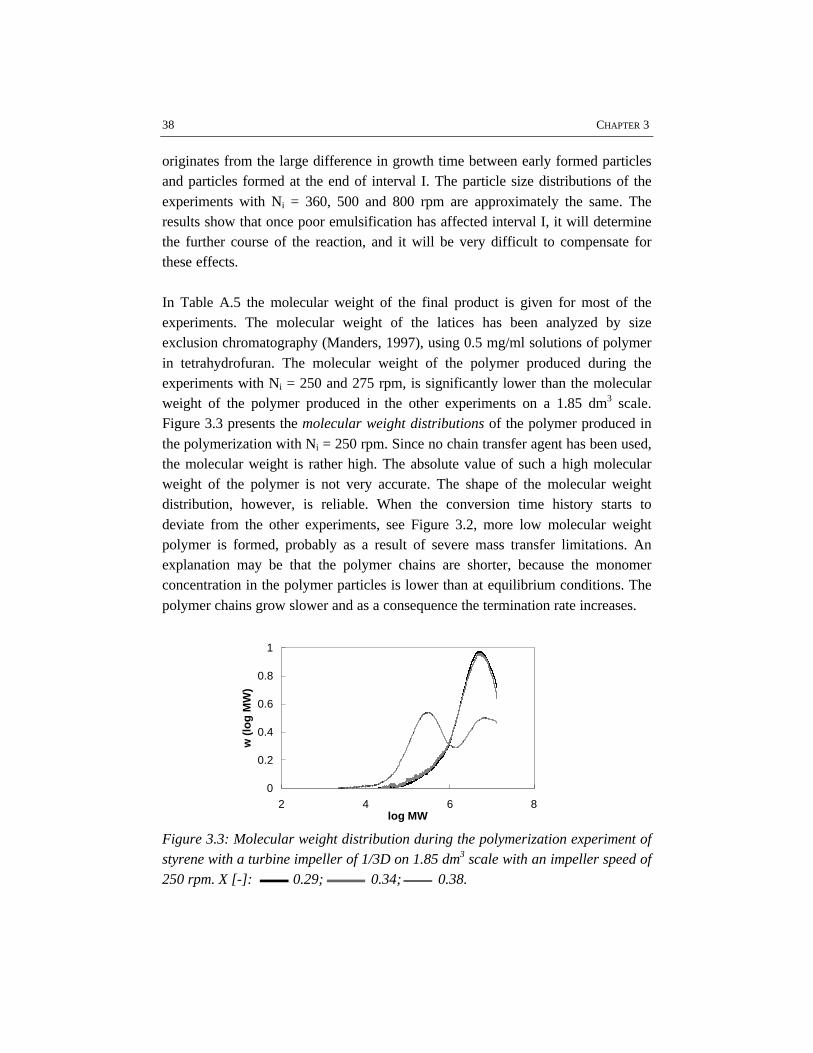
38 CHAPTER 3
originates from the large difference in growth time between early formed particlesand particles formed at the end of interval I. The particle size distributions of theexperiments with Ni = 360, 500 and 800 rpm are approximately the same. Theresults show that once poor emulsification has affected interval I, it will determinethe further course of the reaction, and it will be very difficult to compensate forthese effects.
In Table A.5 the molecular weight of the final product is given for most of theexperiments. The molecular weight of the latices has been analyzed by sizeexclusion chromatography (Manders, 1997), using 0.5 mg/ml solutions of polymerin tetrahydrofuran. The molecular weight of the polymer produced during theexperiments with Ni = 250 and 275 rpm, is significantly lower than the molecularweight of the polymer produced in the other experiments on a 1.85 dm3 scale.Figure 3.3 presents the molecular weight distributions of the polymer produced inthe polymerization with Ni = 250 rpm. Since no chain transfer agent has been used,the molecular weight is rather high. The absolute value of such a high molecularweight of the polymer is not very accurate. The shape of the molecular weightdistribution, however, is reliable. When the conversion time history starts todeviate from the other experiments, see Figure 3.2, more low molecular weightpolymer is formed, probably as a result of severe mass transfer limitations. Anexplanation may be that the polymer chains are shorter, because the monomerconcentration in the polymer particles is lower than at equilibrium conditions. Thepolymer chains grow slower and as a consequence the termination rate increases.
0
0.2
0.4
0.6
0.8
1
2 4 6 8log MW
w (
log
MW
)
Figure 3.3: Molecular weight distribution during the polymerization experiment ofstyrene with a turbine impeller of 1/3D on 1.85 dm3 scale with an impeller speed of250 rpm. X [-]: 0.29; 0.34; 0.38.
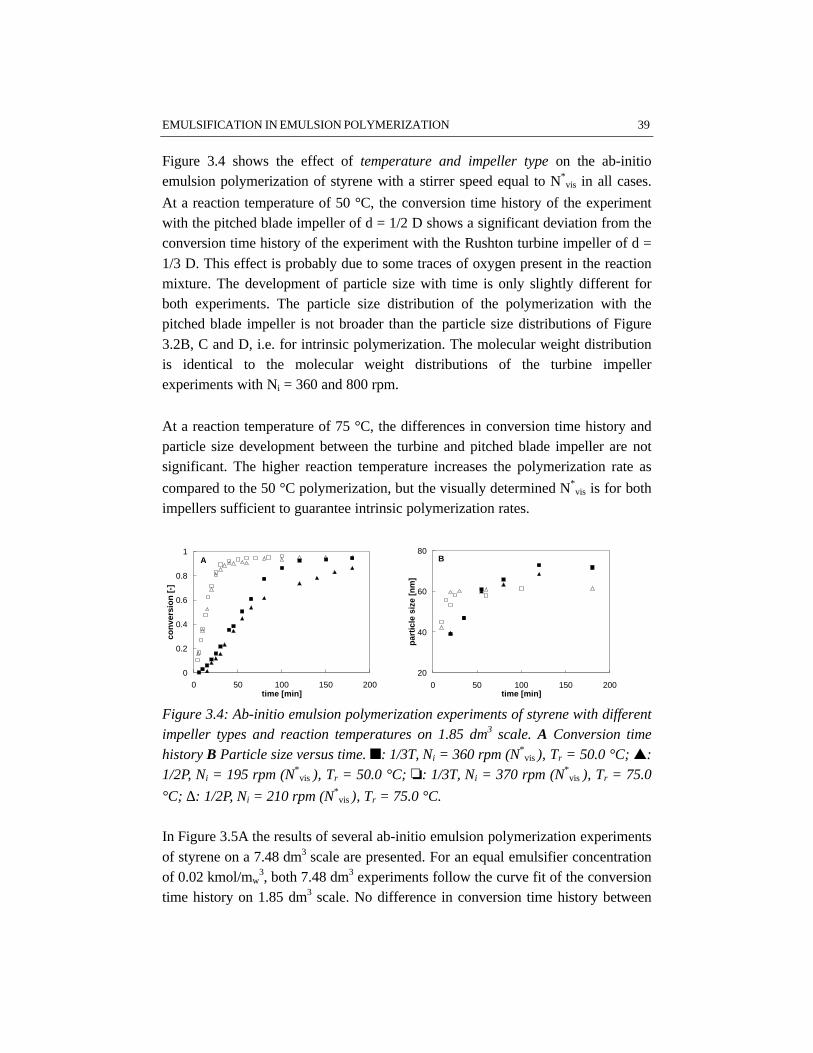
EMULSIFICATION IN EMULSION POLYMERIZATION 39
Figure 3.4 shows the effect of temperature and impeller type on the ab-initioemulsion polymerization of styrene with a stirrer speed equal to N*
vis in all cases.
At a reaction temperature of 50 °C, the conversion time history of the experimentwith the pitched blade impeller of d = 1/2 D shows a significant deviation from theconversion time history of the experiment with the Rushton turbine impeller of d =1/3 D. This effect is probably due to some traces of oxygen present in the reactionmixture. The development of particle size with time is only slightly different forboth experiments. The particle size distribution of the polymerization with thepitched blade impeller is not broader than the particle size distributions of Figure3.2B, C and D, i.e. for intrinsic polymerization. The molecular weight distributionis identical to the molecular weight distributions of the turbine impellerexperiments with Ni = 360 and 800 rpm.
At a reaction temperature of 75 °C, the differences in conversion time history andparticle size development between the turbine and pitched blade impeller are notsignificant. The higher reaction temperature increases the polymerization rate as
compared to the 50 °C polymerization, but the visually determined N*vis is for both
impellers sufficient to guarantee intrinsic polymerization rates.
0
0.2
0.4
0.6
0.8
1
0 50 100 150 200time [min]
con
vers
ion
[-]
A
20
40
60
80
0 50 100 150 200time [min]
par
ticl
e si
ze [
nm
]
B
Figure 3.4: Ab-initio emulsion polymerization experiments of styrene with differentimpeller types and reaction temperatures on 1.85 dm3 scale. A Conversion timehistory B Particle size versus time. n: 1/3T, Ni = 360 rpm (N*
vis ), Tr = 50.0 °C; s:1/2P, Ni = 195 rpm (N*
vis ), Tr = 50.0 °C; o: 1/3T, Ni = 370 rpm (N*vis ), Tr = 75.0
°C; ∆: 1/2P, Ni = 210 rpm (N*vis ), Tr = 75.0 °C.
In Figure 3.5A the results of several ab-initio emulsion polymerization experimentsof styrene on a 7.48 dm3 scale are presented. For an equal emulsifier concentrationof 0.02 kmol/mw
3, both 7.48 dm3 experiments follow the curve fit of the conversiontime history on 1.85 dm3 scale. No difference in conversion time history between
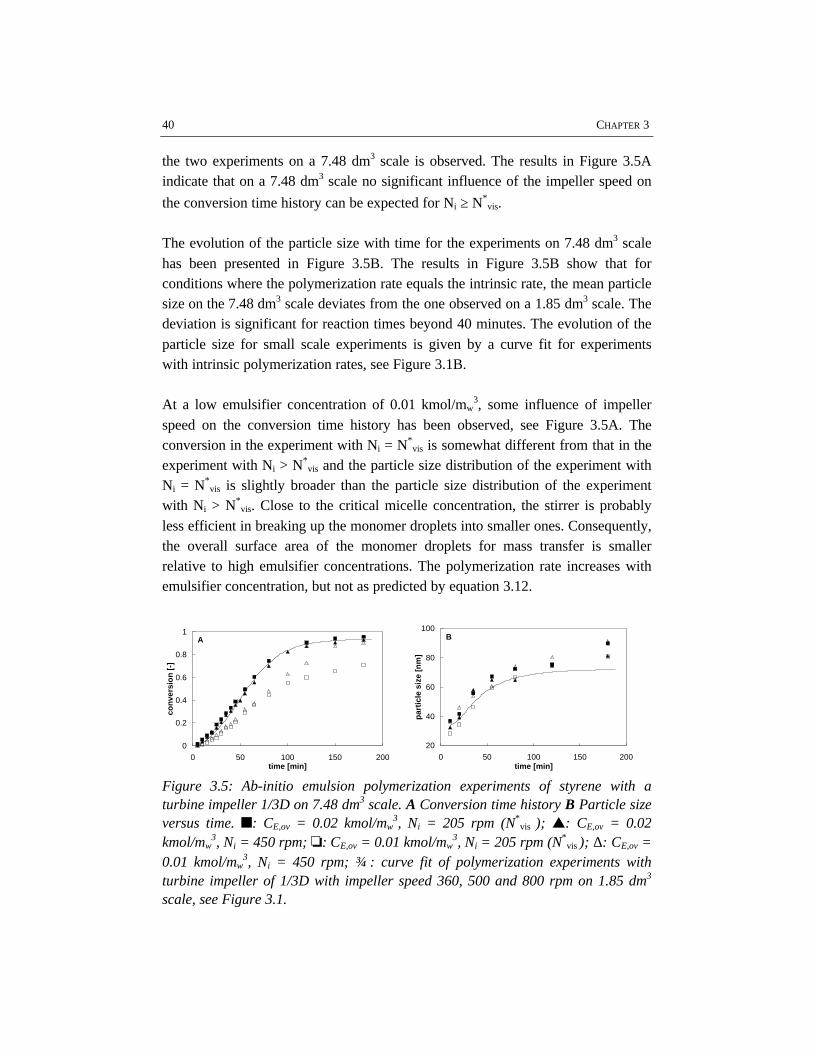
40 CHAPTER 3
the two experiments on a 7.48 dm3 scale is observed. The results in Figure 3.5Aindicate that on a 7.48 dm3 scale no significant influence of the impeller speed on
the conversion time history can be expected for Ni ≥ N*vis.
The evolution of the particle size with time for the experiments on 7.48 dm3 scalehas been presented in Figure 3.5B. The results in Figure 3.5B show that forconditions where the polymerization rate equals the intrinsic rate, the mean particlesize on the 7.48 dm3 scale deviates from the one observed on a 1.85 dm3 scale. Thedeviation is significant for reaction times beyond 40 minutes. The evolution of theparticle size for small scale experiments is given by a curve fit for experimentswith intrinsic polymerization rates, see Figure 3.1B.
At a low emulsifier concentration of 0.01 kmol/mw3, some influence of impeller
speed on the conversion time history has been observed, see Figure 3.5A. Theconversion in the experiment with Ni = N*
vis is somewhat different from that in theexperiment with Ni > N*
vis and the particle size distribution of the experiment withNi = N*
vis is slightly broader than the particle size distribution of the experimentwith Ni > N*
vis. Close to the critical micelle concentration, the stirrer is probablyless efficient in breaking up the monomer droplets into smaller ones. Consequently,the overall surface area of the monomer droplets for mass transfer is smallerrelative to high emulsifier concentrations. The polymerization rate increases withemulsifier concentration, but not as predicted by equation 3.12.
0
0.2
0.4
0.6
0.8
1
0 50 100 150 200time [min]
con
vers
ion
[-]
A
20
40
60
80
100
0 50 100 150 200time [min]
par
ticl
e si
ze [
nm
]
B
Figure 3.5: Ab-initio emulsion polymerization experiments of styrene with aturbine impeller 1/3D on 7.48 dm3 scale. A Conversion time history B Particle sizeversus time. n: CE,ov = 0.02 kmol/mw
3, Ni = 205 rpm (N*vis ); s: CE,ov = 0.02
kmol/mw3, Ni = 450 rpm; o: CE,ov = 0.01 kmol/mw
3, Ni = 205 rpm (N*vis ); ∆: CE,ov =
0.01 kmol/mw3, Ni = 450 rpm; : curve fit of polymerization experiments with
turbine impeller of 1/3D with impeller speed 360, 500 and 800 rpm on 1.85 dm3
scale, see Figure 3.1.
EMULSIFICATION IN EMULSION POLYMERIZATION 41
Comparison of the duplicate experiments of the pitched blade impeller with Ni =195 rpm and the turbine impeller with Ni = 275 rpm, show that besideemulsification, other effects, such as different levels of oxygen in the reactionmixture may have influenced the course of the reaction.
Emulsion polymerizations in a reaction calorimeterDuring emulsion polymerization experiments with the reaction calorimetric
equipment the rate of heat production Qr, the heat of polymerization ∆rH, thecalorimetric conversion X, the final particle size dp,vfinal, and the final solids contentS have been measured. Figure 3.6A shows some examples of the time evolution ofthe heat of reaction, Qr. In Figure 3.6B the corresponding fractional reactioncalorimetric conversion versus time is given. Note that the calorimetric conversiondiffers from the gravimetrical conversion, since the calorimetric conversion is theratio of the partial heat of reaction evolved at time t and the total heat of reaction atthe end of the experiment. From the data presented in Figure 3.6, the heat ofreaction can be obtained as a function of the calorimetric conversion, see Figure3.7. During the experiments with intrinsic polymerization rate, the shape of theheat of reaction curve is similar. The following explanation can be given for theshape of the heat of reaction curves. According to Varela de la Rosa et al. (1996),the nucleation period is indicated by the increase in the rate of polymerization up tothe maximum. Accordingly, our results show a relatively long nucleation period,which is in agreement with the results obtained by Varela de la Rosa et al. (1996).The decrease in the rate of polymerization results from the disappearance of themonomer droplets and the reduction of monomer concentration in the polymerparticles. The second maximum in the reaction rate may be caused by the gel-effect(Varela de la Rosa et al., 1996).
The results of the experiments with the turbine and pitched blade impeller of 1/3Dare summarized in the Tables 3.3 and 3.4 and the Figures 3.6 and 3.7. Thedistinction between insufficient and proper emulsification is quite precise. Inaddition to visualization experiments and common emulsion polymerization,reaction calorimetry can accurately determine the required process conditions forsufficient emulsification. From the results follows that N*
pol for the turbine impelleris between 400 and 410 rpm, whereas for the pitched blade impeller N*
pol isbetween 575 and 585 rpm.
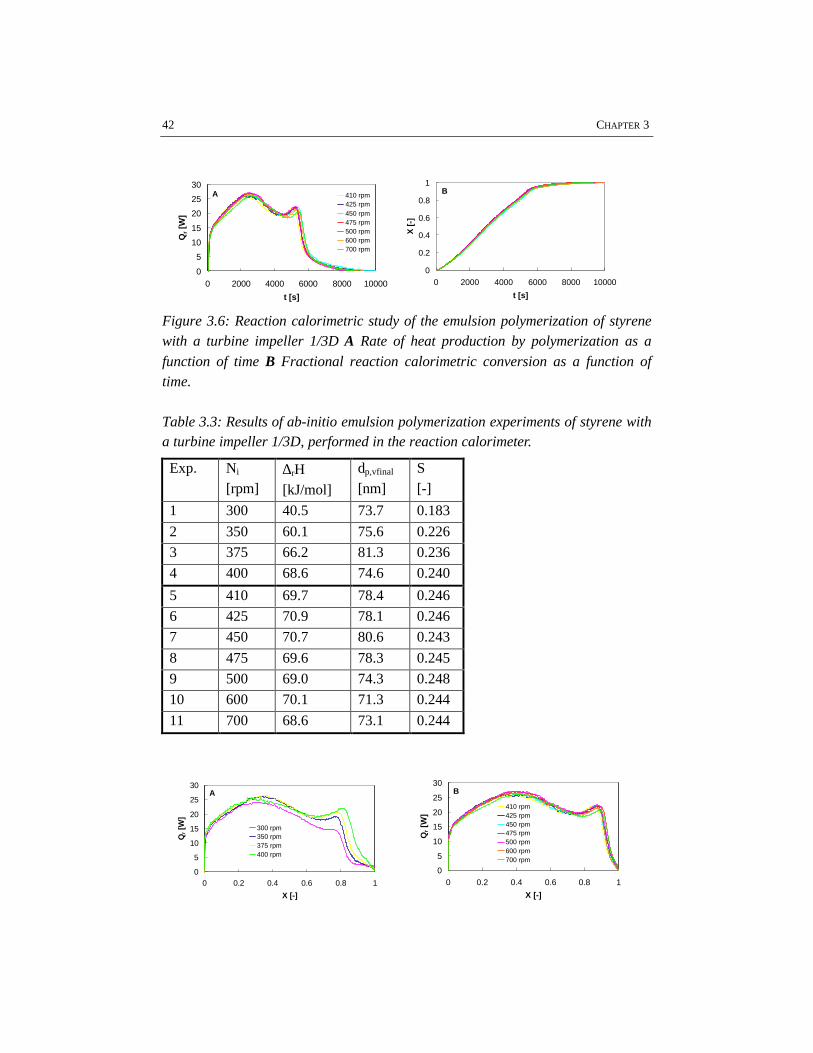
42 CHAPTER 3
0
5
10
15
20
25
30
0 2000 4000 6000 8000 10000
t [s]
Qr [
W]
410 rpm425 rpm450 rpm475 rpm500 rpm600 rpm700 rpm
A
0
0.2
0.4
0.6
0.8
1
0 2000 4000 6000 8000 10000
t [s]
X [
-]
B
Figure 3.6: Reaction calorimetric study of the emulsion polymerization of styrenewith a turbine impeller 1/3D A Rate of heat production by polymerization as a
function of time B Fractional reaction calorimetric conversion as a function oftime.
Table 3.3: Results of ab-initio emulsion polymerization experiments of styrene witha turbine impeller 1/3D, performed in the reaction calorimeter.
Exp. Ni
[rpm]∆rH[kJ/mol]
dp,vfinal
[nm]S[-]
1 300 40.5 73.7 0.183
2 350 60.1 75.6 0.226
3 375 66.2 81.3 0.236
4 400 68.6 74.6 0.240
5 410 69.7 78.4 0.246
6 425 70.9 78.1 0.246
7 450 70.7 80.6 0.243
8 475 69.6 78.3 0.245
9 500 69.0 74.3 0.248
10 600 70.1 71.3 0.244
11 700 68.6 73.1 0.244
0
5
10
15
20
25
30
0 0.2 0.4 0.6 0.8 1
X [-]
Qr [
W]
300 rpm350 rpm375 rpm400 rpm
A
0
5
10
15
20
25
30
0 0.2 0.4 0.6 0.8 1
X [-]
Qr [
W]
410 rpm425 rpm450 rpm475 rpm500 rpm600 rpm700 rpm
B
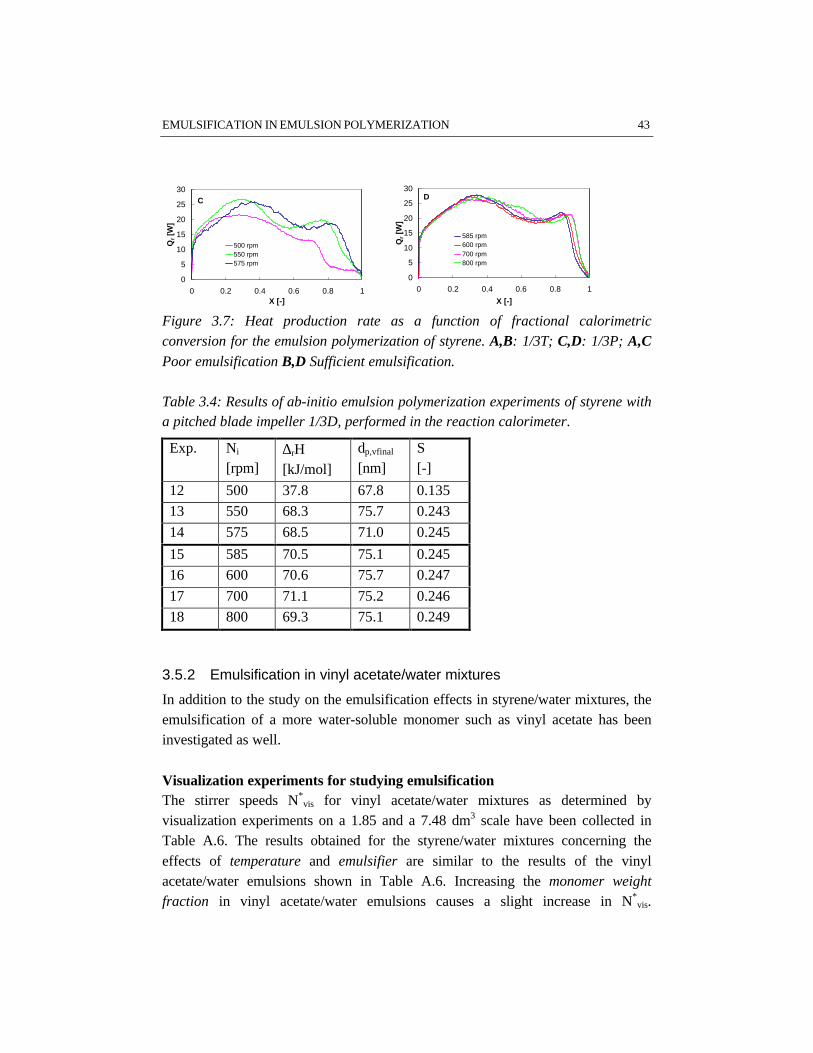
EMULSIFICATION IN EMULSION POLYMERIZATION 43
0
5
10
15
20
25
30
0 0.2 0.4 0.6 0.8 1X [-]
Qr [
W]
500 rpm550 rpm575 rpm
C
0
5
10
15
20
25
30
0 0.2 0.4 0.6 0.8 1
X [-]
Qr [
W]
585 rpm600 rpm700 rpm 800 rpm
D
Figure 3.7: Heat production rate as a function of fractional calorimetricconversion for the emulsion polymerization of styrene. A,B: 1/3T; C,D: 1/3P; A,CPoor emulsification B,D Sufficient emulsification.
Table 3.4: Results of ab-initio emulsion polymerization experiments of styrene witha pitched blade impeller 1/3D, performed in the reaction calorimeter.
Exp. Ni
[rpm]∆rH[kJ/mol]
dp,vfinal
[nm]S[-]
12 500 37.8 67.8 0.135
13 550 68.3 75.7 0.243
14 575 68.5 71.0 0.245
15 585 70.5 75.1 0.245
16 600 70.6 75.7 0.247
17 700 71.1 75.2 0.246
18 800 69.3 75.1 0.249
3.5.2 Emulsification in vinyl acetate/water mixtures
In addition to the study on the emulsification effects in styrene/water mixtures, theemulsification of a more water-soluble monomer such as vinyl acetate has beeninvestigated as well.
Visualization experiments for studying emulsificationThe stirrer speeds N*
vis for vinyl acetate/water mixtures as determined byvisualization experiments on a 1.85 and a 7.48 dm3 scale have been collected inTable A.6. The results obtained for the styrene/water mixtures concerning theeffects of temperature and emulsifier are similar to the results of the vinylacetate/water emulsions shown in Table A.6. Increasing the monomer weightfraction in vinyl acetate/water emulsions causes a slight increase in N*
vis.
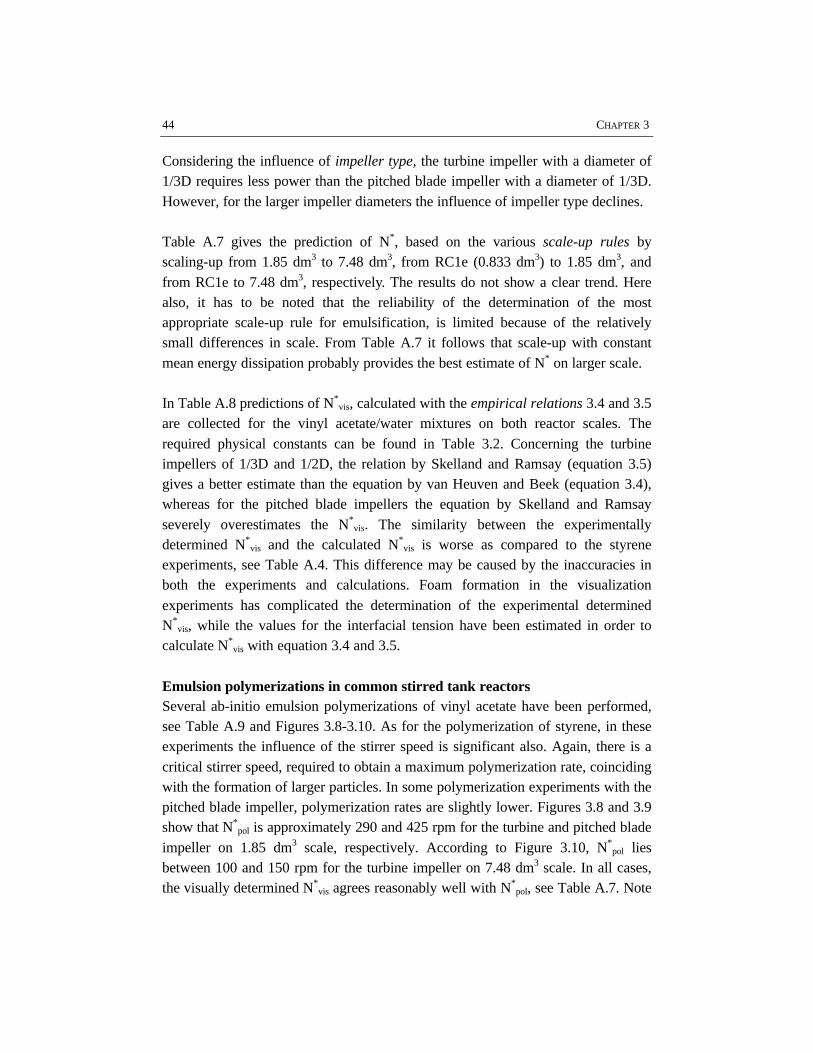
44 CHAPTER 3
Considering the influence of impeller type, the turbine impeller with a diameter of1/3D requires less power than the pitched blade impeller with a diameter of 1/3D.However, for the larger impeller diameters the influence of impeller type declines.
Table A.7 gives the prediction of N*, based on the various scale-up rules byscaling-up from 1.85 dm3 to 7.48 dm3, from RC1e (0.833 dm3) to 1.85 dm3, andfrom RC1e to 7.48 dm3, respectively. The results do not show a clear trend. Herealso, it has to be noted that the reliability of the determination of the mostappropriate scale-up rule for emulsification, is limited because of the relativelysmall differences in scale. From Table A.7 it follows that scale-up with constantmean energy dissipation probably provides the best estimate of N* on larger scale.
In Table A.8 predictions of N*vis, calculated with the empirical relations 3.4 and 3.5
are collected for the vinyl acetate/water mixtures on both reactor scales. Therequired physical constants can be found in Table 3.2. Concerning the turbineimpellers of 1/3D and 1/2D, the relation by Skelland and Ramsay (equation 3.5)gives a better estimate than the equation by van Heuven and Beek (equation 3.4),whereas for the pitched blade impellers the equation by Skelland and Ramsayseverely overestimates the N*
vis. The similarity between the experimentallydetermined N*
vis and the calculated N*vis is worse as compared to the styrene
experiments, see Table A.4. This difference may be caused by the inaccuracies inboth the experiments and calculations. Foam formation in the visualizationexperiments has complicated the determination of the experimental determinedN*
vis, while the values for the interfacial tension have been estimated in order tocalculate N*
vis with equation 3.4 and 3.5.
Emulsion polymerizations in common stirred tank reactorsSeveral ab-initio emulsion polymerizations of vinyl acetate have been performed,see Table A.9 and Figures 3.8-3.10. As for the polymerization of styrene, in theseexperiments the influence of the stirrer speed is significant also. Again, there is acritical stirrer speed, required to obtain a maximum polymerization rate, coincidingwith the formation of larger particles. In some polymerization experiments with thepitched blade impeller, polymerization rates are slightly lower. Figures 3.8 and 3.9show that N*
pol is approximately 290 and 425 rpm for the turbine and pitched bladeimpeller on 1.85 dm3 scale, respectively. According to Figure 3.10, N*
pol liesbetween 100 and 150 rpm for the turbine impeller on 7.48 dm3 scale. In all cases,the visually determined N*
vis agrees reasonably well with N*pol, see Table A.7. Note
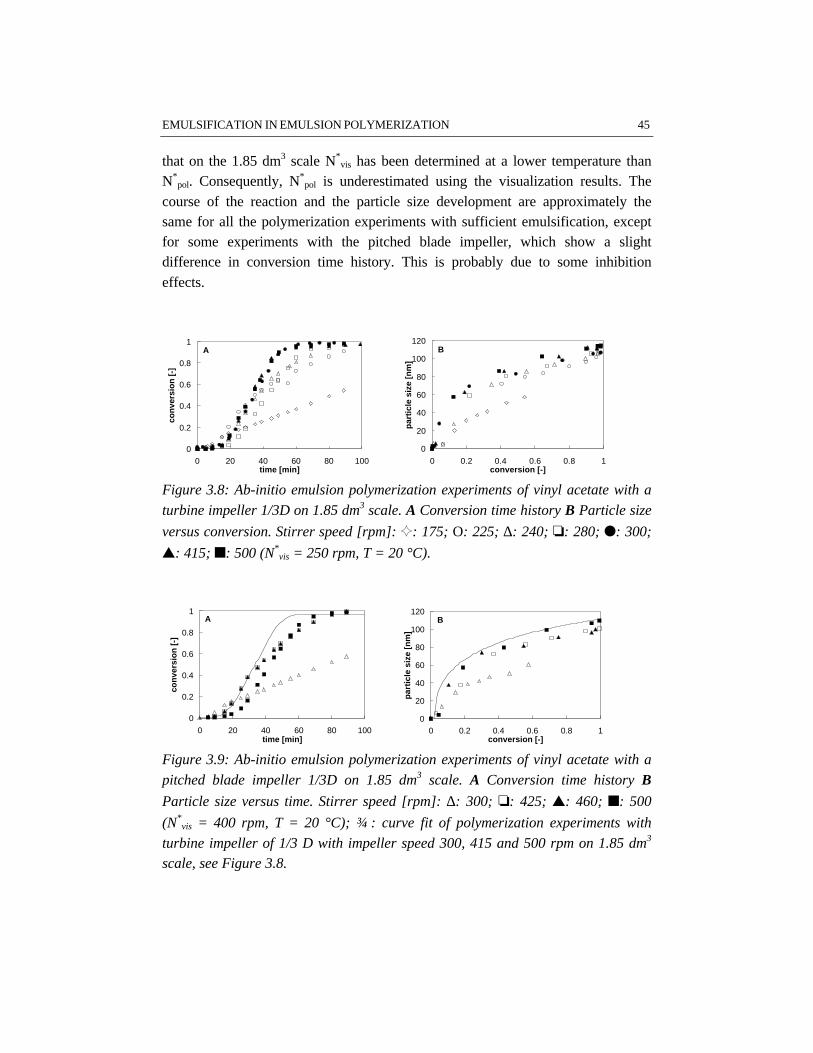
EMULSIFICATION IN EMULSION POLYMERIZATION 45
that on the 1.85 dm3 scale N*vis has been determined at a lower temperature than
N*pol. Consequently, N*
pol is underestimated using the visualization results. Thecourse of the reaction and the particle size development are approximately thesame for all the polymerization experiments with sufficient emulsification, exceptfor some experiments with the pitched blade impeller, which show a slightdifference in conversion time history. This is probably due to some inhibitioneffects.
0
0.2
0.4
0.6
0.8
1
0 20 40 60 80 100time [min]
con
vers
ion
[-]
A
0
20
40
60
80
100
120
0 0.2 0.4 0.6 0.8 1conversion [-]
par
ticl
e si
ze [
nm
]
B
Figure 3.8: Ab-initio emulsion polymerization experiments of vinyl acetate with a
turbine impeller 1/3D on 1.85 dm3 scale. A Conversion time history B Particle size
versus conversion. Stirrer speed [rpm]: G: 175; O: 225; ∆: 240; o: 280; l: 300;
s: 415; n: 500 (N*vis = 250 rpm, T = 20 °C).
0
0.2
0.4
0.6
0.8
1
0 20 40 60 80 100time [min]
con
vers
ion
[-]
A
0
20
40
60
80
100
120
0 0.2 0.4 0.6 0.8 1conversion [-]
par
ticl
e si
ze [
nm
]
B
Figure 3.9: Ab-initio emulsion polymerization experiments of vinyl acetate with a
pitched blade impeller 1/3D on 1.85 dm3 scale. A Conversion time history B
Particle size versus time. Stirrer speed [rpm]: ∆: 300; o: 425; s: 460; n: 500
(N*vis = 400 rpm, T = 20 °C); : curve fit of polymerization experiments with
turbine impeller of 1/3 D with impeller speed 300, 415 and 500 rpm on 1.85 dm3
scale, see Figure 3.8.
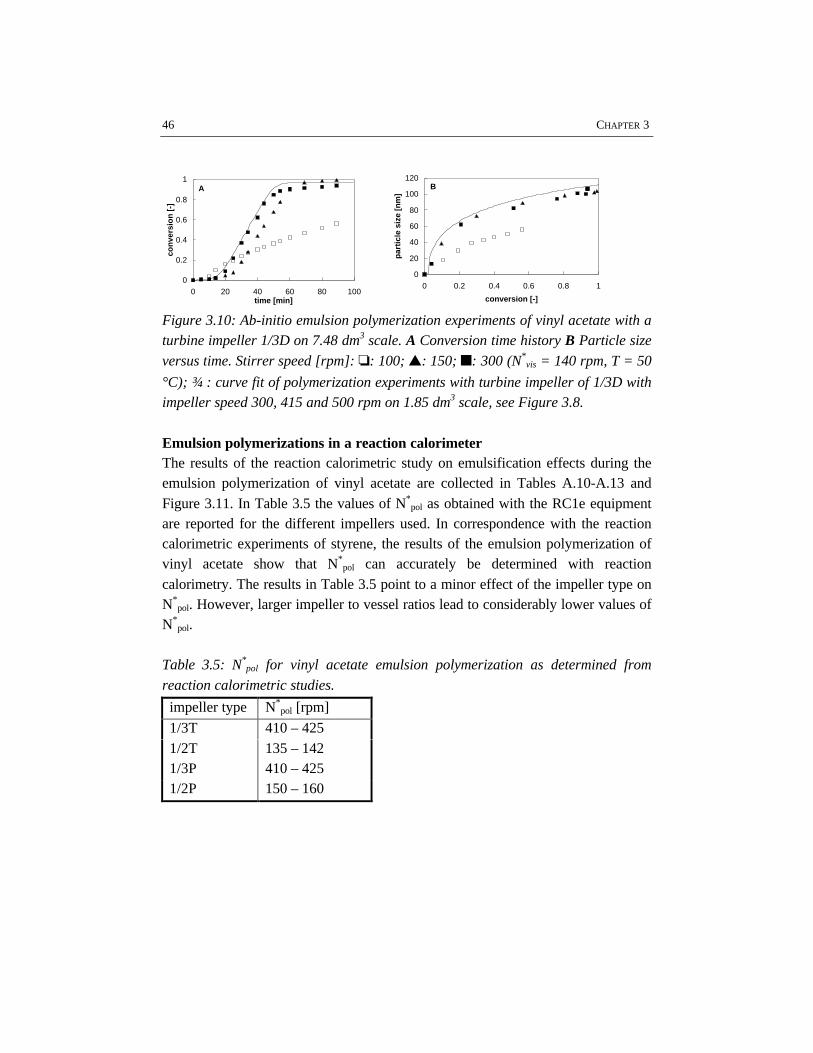
46 CHAPTER 3
0
0.2
0.4
0.6
0.8
1
0 20 40 60 80 100time [min]
con
vers
ion
[-]
A
0
20
40
60
80
100
120
0 0.2 0.4 0.6 0.8 1
conversion [-]
par
ticl
e si
ze [
nm
]
B
Figure 3.10: Ab-initio emulsion polymerization experiments of vinyl acetate with aturbine impeller 1/3D on 7.48 dm3 scale. A Conversion time history B Particle size
versus time. Stirrer speed [rpm]: o: 100; s: 150; n: 300 (N*vis = 140 rpm, T = 50
°C); : curve fit of polymerization experiments with turbine impeller of 1/3D withimpeller speed 300, 415 and 500 rpm on 1.85 dm3 scale, see Figure 3.8.
Emulsion polymerizations in a reaction calorimeterThe results of the reaction calorimetric study on emulsification effects during theemulsion polymerization of vinyl acetate are collected in Tables A.10-A.13 andFigure 3.11. In Table 3.5 the values of N*
pol as obtained with the RC1e equipmentare reported for the different impellers used. In correspondence with the reactioncalorimetric experiments of styrene, the results of the emulsion polymerization ofvinyl acetate show that N*
pol can accurately be determined with reactioncalorimetry. The results in Table 3.5 point to a minor effect of the impeller type onN*
pol. However, larger impeller to vessel ratios lead to considerably lower values ofN*
pol.
Table 3.5: N*pol for vinyl acetate emulsion polymerization as determined from
reaction calorimetric studies.
impeller type N*pol [rpm]
1/3T 410 – 4251/2T 135 – 1421/3P 410 – 4251/2P 150 – 160
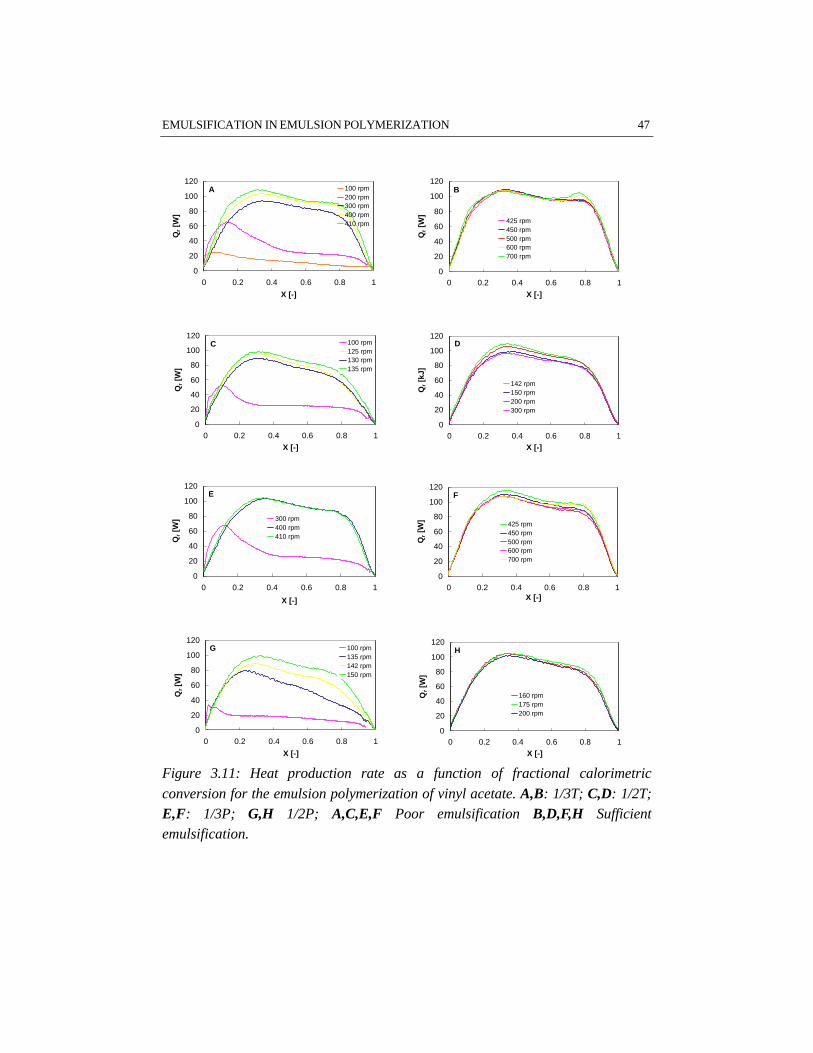
EMULSIFICATION IN EMULSION POLYMERIZATION 47
0
20
40
60
80
100
120
0 0.2 0.4 0.6 0.8 1
X [-]
Qr [
W]
100 rpm200 rpm300 rpm400 rpm410 rpm
A
0
20
40
60
80
100
120
0 0.2 0.4 0.6 0.8 1
X [-]
Qr [
W]
425 rpm450 rpm500 rpm600 rpm700 rpm
B
0
20
40
60
80
100
120
0 0.2 0.4 0.6 0.8 1
X [-]
Qr [
W]
100 rpm125 rpm130 rpm135 rpm
C
0
20
40
60
80
100
120
0 0.2 0.4 0.6 0.8 1X [-]
Qr [
kJ]
142 rpm150 rpm200 rpm300 rpm
D
0
20
40
60
80
100
120
0 0.2 0.4 0.6 0.8 1
X [-]
Qr [
W] 300 rpm
400 rpm410 rpm
E
0
20
40
60
80
100
120
0 0.2 0.4 0.6 0.8 1X [-]
Qr [
W] 425 rpm
450 rpm500 rpm600 rpm700 rpm
F
0
20
40
60
80
100
120
0 0.2 0.4 0.6 0.8 1
X [-]
Qr [
W]
100 rpm135 rpm142 rpm150 rpm
G
0
20
40
60
80
100
120
0 0.2 0.4 0.6 0.8 1X [-]
Qr [
W]
160 rpm175 rpm200 rpm
H
Figure 3.11: Heat production rate as a function of fractional calorimetric
conversion for the emulsion polymerization of vinyl acetate. A,B: 1/3T; C,D: 1/2T;E,F: 1/3P; G,H 1/2P; A,C,E,F Poor emulsification B,D,F,H Sufficientemulsification.
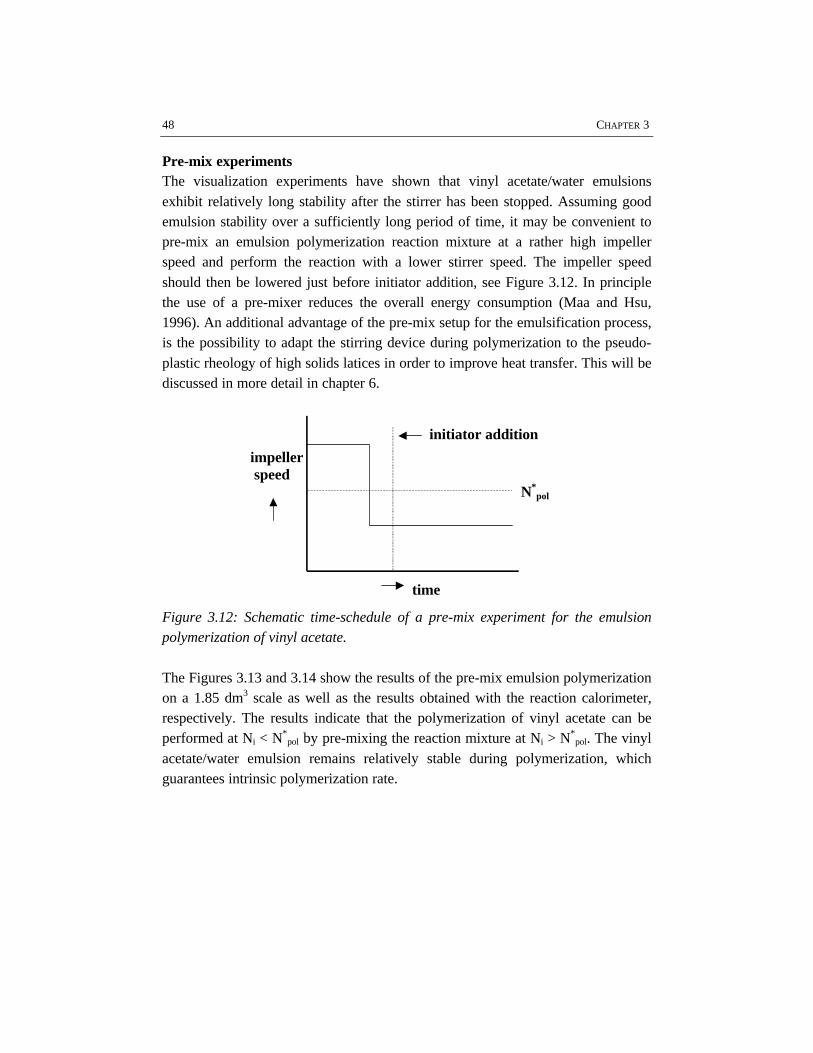
48 CHAPTER 3
Pre-mix experimentsThe visualization experiments have shown that vinyl acetate/water emulsionsexhibit relatively long stability after the stirrer has been stopped. Assuming goodemulsion stability over a sufficiently long period of time, it may be convenient topre-mix an emulsion polymerization reaction mixture at a rather high impellerspeed and perform the reaction with a lower stirrer speed. The impeller speedshould then be lowered just before initiator addition, see Figure 3.12. In principlethe use of a pre-mixer reduces the overall energy consumption (Maa and Hsu,1996). An additional advantage of the pre-mix setup for the emulsification process,is the possibility to adapt the stirring device during polymerization to the pseudo-plastic rheology of high solids latices in order to improve heat transfer. This will bediscussed in more detail in chapter 6.
impellerspeed
time
N*pol
initiator addition
Figure 3.12: Schematic time-schedule of a pre-mix experiment for the emulsionpolymerization of vinyl acetate.
The Figures 3.13 and 3.14 show the results of the pre-mix emulsion polymerizationon a 1.85 dm3 scale as well as the results obtained with the reaction calorimeter,respectively. The results indicate that the polymerization of vinyl acetate can beperformed at Ni < N*
pol by pre-mixing the reaction mixture at Ni > N*pol. The vinyl
acetate/water emulsion remains relatively stable during polymerization, whichguarantees intrinsic polymerization rate.
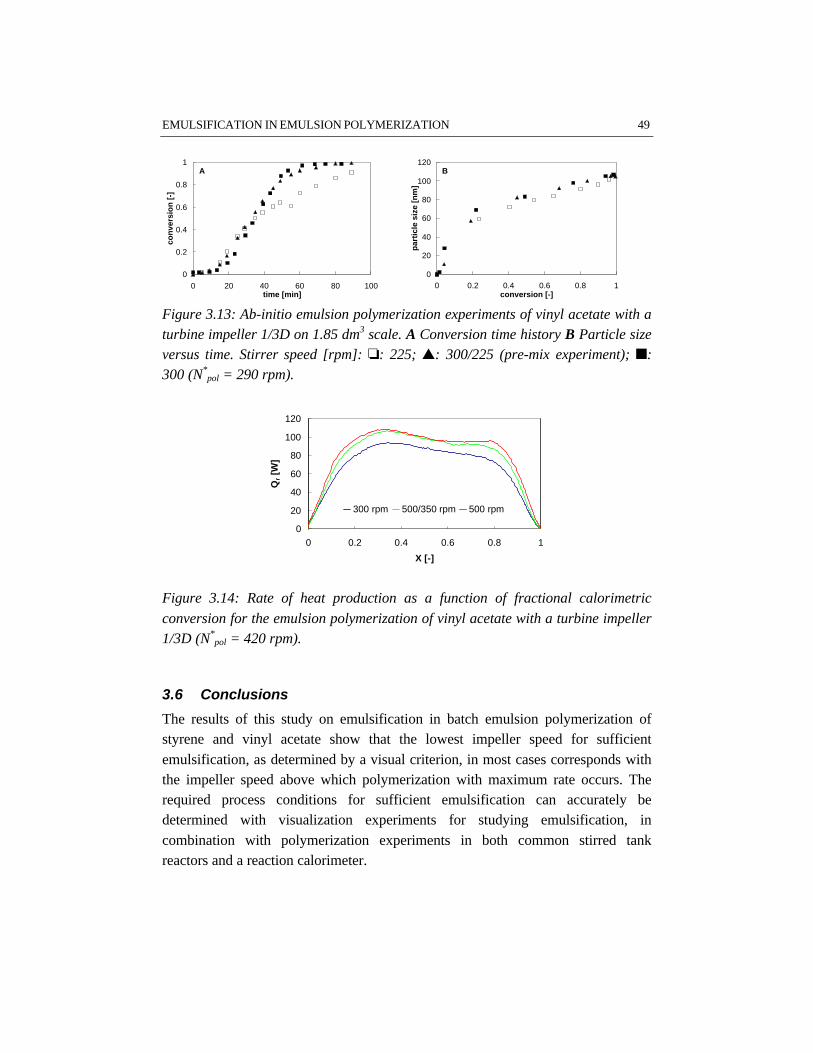
EMULSIFICATION IN EMULSION POLYMERIZATION 49
0
0.2
0.4
0.6
0.8
1
0 20 40 60 80 100time [min]
con
vers
ion
[-]
A
0
20
40
60
80
100
120
0 0.2 0.4 0.6 0.8 1conversion [-]
par
ticl
e si
ze [
nm
]
B
Figure 3.13: Ab-initio emulsion polymerization experiments of vinyl acetate with aturbine impeller 1/3D on 1.85 dm3 scale. A Conversion time history B Particle sizeversus time. Stirrer speed [rpm]: o: 225; s: 300/225 (pre-mix experiment); n:300 (N*
pol = 290 rpm).
0
20
40
60
80
100
120
0 0.2 0.4 0.6 0.8 1
X [-]
Qr [
W]
300 rpm 500/350 rpm 500 rpm
Figure 3.14: Rate of heat production as a function of fractional calorimetric
conversion for the emulsion polymerization of vinyl acetate with a turbine impeller1/3D (N*
pol = 420 rpm).
3.6 Conclusions
The results of this study on emulsification in batch emulsion polymerization ofstyrene and vinyl acetate show that the lowest impeller speed for sufficientemulsification, as determined by a visual criterion, in most cases corresponds withthe impeller speed above which polymerization with maximum rate occurs. Therequired process conditions for sufficient emulsification can accurately bedetermined with visualization experiments for studying emulsification, incombination with polymerization experiments in both common stirred tankreactors and a reaction calorimeter.
50 CHAPTER 3
Concerning the impeller type and diameter as well as the physico-chemicalproperties of the liquid-liquid mixture, the following detailed conclusions can beformulated:
• Our results show that dispersion with a turbine impeller requires less power perunit of mass to obtain sufficient emulsification as compared to a pitched bladeimpeller, except for the larger impeller diameter used in case of vinylacetate/water emulsions. This is in agreement with the findings of Johanssonand Godfrey (1997).
• A larger impeller diameter requires less power per unit of mass for properemulsification.
• Addition of emulsifier to the mixture considerably reduces the required stirrerspeed for sufficient emulsification.
• At elevated temperatures, the coalescence rate of the monomer droplets is
higher and consequently the critical impeller speed for sufficient emulsificationincreases.
• For styrene/water emulsions, introduction of polymer particles in the mixture
increases the lowest impeller speed for sufficient emulsification.
• In agreement with Fontenot and Schork (1993), our results show that theemulsification of styrene/water mixtures requires more power input forsufficient emulsification as compared to vinyl acetate/water mixtures.
• The empirical relation reported by Skelland and Ramsay (1987) provides arough estimate for the critical impeller speed for sufficient emulsification for aparticular styrene/water system. For vinyl acetate/water emulsions, however,the deviations are rather large.
3.7 References
Baldyga, J., Podgorska, W., Smit, L., (1997), Proc. 9th Eur. Mixing Conf., 11, (52), 247
Bates, R.L., Fondy, P.L., Corpstein, R.R., (1963), Ind. Eng. Chem. Res., 2, (4), 310
Becher, P., (1977), Emulsions, theory and practice, Reinhold Publishing Corporation, 2nd edition
Boomen, F.H.A.M van den, Akhssay, M., (1997), internal report Laboratory of Process Development,Eindhoven University of Technology
Esch, D.D., D’Angelo, P.J., Pike, R.W., (1971), Can. J. Chem. Eng., 49, 872
Gilbert, R.G., (1995), Emulsion polymerization, A mechanistic approach, Academic Press
Fontenot, K., Schork, F.J., (1993), Ind. Eng. Chem. Res., 32, 373
Hansen, F.K., Ugelstad, J., (1978), J. Polym. Sci., 16, 1953
EMULSIFICATION IN EMULSION POLYMERIZATION 51
Heuven, J.W. van, Beek, J.W., (1971), Proc. Int. Solv. Extr. Conf., paper 51
Hinze, J.O., (1955), AIChE J., 1, (3), 289
Hoedemakers, G.F.M., (1990), Continuous emulsion polymerization in a pulsed packed column, PhDthesis, Eindhoven University of Technology
Ivanov, I.B., (1980), Pure & Appl. Chem., 52, 1241
Johansson, A.C., Godfrey, J.C., (1997), Proc. 9th Eur. Mixing Conf., 11, (52), 255
Lide, D.R., (1997-1998), Handbook of chemistry and physics, CRC Press, 78th edition
Maa, Y.F., Hsu, C., (1996), Microencapsulation, 13, (4), 419
Manders, L.G., (1997), Pulsed initiation polymerization. Applications in homogeneous andheterogeneous radical systems PhD thesis, Eindhoven University of Technology
Meuldijk, J., Strien, C.J.G. van , Doormalen F.A.H.C. van, Thoenes, D., (1992), Chem. Eng. Sci., 47,(9-11), 2603
Nomura, M., (1982), Emulsion polymerization, I. Piirma (ed.), Academic Press
Nomura, M., Harada, M., Eguchi, W., Nagata, S., (1972), J. Appl. Polym. Sci., 16, 835
Okamoto, Y., Nishikawa, M., Hashimoto, K., (1981), Int. Chem. Eng., 21, (1), 88
Pacek, A.W., Man, C.C., Nienow, A.W., (1997), Proc. 9th Eur. Mixing Conf. 11, (52), 263
Salager, J.L., Perez-Sanchez, M., Raminez-Gouveia, M., Anderez, J.M., Bricenoivas, M.I., (1997),Proc. 9th Eur. Mixing Conf., 11, (52), 123
Schäfer, M., Yianneskis, M., Wächter, P., Durst, F., (1998), AIChE J., 44, (6), 1233
Shinnar, R., (1961), J. Fluid Mech., 10, 259
Skelland, A.H.P., Moeti, L.T., (1989), Ind. Eng. Chem. Res., 28, 122
Skelland, A.H.P., Ramsay, G.G., (1987), Ind. Eng. Chem. Res., 26, 77
Skelland, A.H.P., Seksaria, R., (1978), Ind. Eng. Chem. Proc. Des. Dev., 17, (1), 56
Smith, W.V., Ewart, R.H., (1948), J. Chem. Phys., 16, (6), 592
Sprow, F.B., (1967), Chem. Eng. Sci., 22, 435, a
Sprow, F.B., (1967), AIChE J., 13, (5), 995, b
Thoenes, D., (1994), Chemical reactor development, from laboratory to industrial production, KluwerAcademic Publishers
Tiljander, P., Rönnmark, B., Thelliander, H., (1997), Can. J. Chem. Eng., 75, 787
Ugelstad, J., Mörk, P.C., Aasen, J.O., (1967), J. Polym. Sci., A-1, (5), 2281
Varela de la Rosa, L., Sudol, E.D., El-Aasser, M.S., Klein, A., J. Polym. Sci. A, 34, 461
Wu, H., Patterson, G.K., (1989), Chem. Eng. Sci., 44, (10), 2207
52 CHAPTER 3
Yaws, C.L., (1977), Physical properties, A guide to the physical, thermodynamic and transportproperty data of industrially important chemical compounds, McGraw-Hill
Zhou, G., Kresta, S.M., (1998), Chem. Eng. Sci., 53, (11), 2063, a
Zhou, G., Kresta, S.M., (1998), Chem. Eng. Sci., 53, (11), 2099, b
COAGULATION IN EMULSION POLYMERIZATION 53
4 COAGULATION IN EMULSION POLYMERIZATION
AbstractThe influence of recipe and process conditions on the colloidal stability ofpolystyrene and polyvinyl acetate latices has been studied. For this purpose,emulsion polymerizations as well as coagulation experiments withoutpolymerization have been performed. The experimental results show that Browniancoagulation is the predominant mechanism. Shear effects appear to be negligible.This conclusion is supported by the model developed at the ETH Zürich by Melisand Morbidelli, based on Brownian coagulation, which agrees reasonably well withour experimental data. The recipe in terms of the emulsifier and electrolyteconcentrations, dominates the coagulation behavior rather than the processconditions. For the systems investigated, the solids content has no influence on thecolloidal stability up to 50 wt%.
This chapter is published in the following papers:
M.F. Kemmere, J. Meuldijk, A.A.H. Drinkenburg, and A.L. German, ‘Aspects of coagulation duringemulsion polymerization of styrene and vinyl acetate’, (1998), J. Appl. Polym. Sci., 69, 2409
M.F. Kemmere, J. Meuldijk, A.A.H. Drinkenburg, A.L. German, ‘Colloidal stability of high solidspolystyrene and polyvinyl acetate latices, J. Appl. Polym. Sci., in press
Stefano Melis, Maartje Kemmere, Jan Meuldijk, Giuseppe Storti, Massimo Morbidelli, ‘A model forthe aggregation of polyvinyl acetate particles in emulsion’, Chem. Eng. Sci., in press
54 CHAPTER 4
4.1 Introduction
The product of an emulsion polymerization is a dispersion of submicron polymerparticles in a continuous aqueous phase. The average particle size and the particlesize distribution (PSD), are important characteristics of the product latex, becausethey affect the rheology as well as the film formation properties. The particle sizeand PSD are among others influenced by coagulation during the stage of particlegrowth by simultaneous absorption of monomer and reaction. In commercialprocesses coagulation may result in off-spec products as well as in troublesomeoperation. It is therefore important to control the particle size during thepolymerization.
Coagulation is caused by a loss of colloidal stability of the latex particles. Thecolloidal stability of the polymer particles is mainly governed by electrostaticrepulsion when ionic surfactants are used. Coagulation will occur if the kineticenergy of the particles is sufficiently high to overcome the potential energy barrier,being the sum of the Van der Waals attraction energy and the electrostatic repulsionenergy. Destabilization may be accelerated by reducing the height of the potentialenergy barrier (physico-chemical influences determined by the recipe) as well asby increasing the average kinetic energy of the particles (process relatedinfluences). The next two sections discuss the physico-chemical and processrelated influences separately. Concerning the colloidal stability during emulsionpolymerization of vinyl acetate, steric stabilization may also be involved. Section4.4 and 4.5 give some background information on steric stabilization and reactorfouling, respectively. In this chapter, the influence of recipe i.e. solids content,emulsifier and electrolyte concentration as well as the influence of processconditions i.e. impeller speed, reactor scale, impeller type and diameter on thecoagulation behavior of polystyrene (PS) and polyvinyl acetate (PVAc) latices hasbeen studied. For this purpose, three types of experiments have been carried out:ab-initio polymerization, seeded polymerization and coagulation experimentswithout polymerization. One of the objectives is to determine which parameters interms of recipe and operating conditions are most critical for the coagulation inemulsion polymerization systems. Other objectives are the determination of theimpact of Brownian and shear coagulation in emulsion polymerization.Additionally, the effect of steric stabilization and reactor fouling has beeninvestigated.
COAGULATION IN EMULSION POLYMERIZATION 55
4.2 Physico-chemical influences determined by the recipe
The recipe used in emulsion polymerization influences the colloidal stability of thepolymer particles. Important parameters for electrostatic stabilization are the ionicstrength, type and concentration of the emulsifier, solids content and the monomersused.
Every emulsion polymerization recipe contains some electrolyte originating fromthe initiator, emulsifier and pH-buffer. Industrial recipes often contain a largenumber of additives, which may increase the electrolyte concentration even more.A high electrolyte concentration results in a lower energy barrier for approachingparticles to coagulate.
Emulsifier occupies the particle surface. The extent of adsorption of emulsifier onthe surface of the polymer particles often determines the stability of the latexsystem (Ahmed et al., 1980). A high emulsifier concentration increases the surfacecharge, resulting in a high electrostatic repulsion. Neighboring particles experiencea high energy barrier to coagulate. Colloidal stability is ensured when the fractionalsurface coverage of the growing particle with emulsifier remains above a critical
value, θcrit (Meuldijk et al., 1992; Mayer et al., 1995).
The area occupied by one mole of emulsifier, AE, is affected by the emulsifier used,temperature, electrolyte concentration, particle size and nature of the polymersurface (Piirma and Chen, 1980). According to Gu and coworkers (1991, 1992),the adsorption of surfactant is different for low and high surface concentrations ofemulsifier. At low surface concentrations the emulsifier is adsorbed through theinteractions between emulsifier and particle surface. Single emulsifier moleculesadsorb on the particle surface (Brown and Zhao, 1993). At higher surfaceconcentration hydrophobic interactions between the adsorbed surfactant moleculesplay a role (Gu and Zhu, 1992). The emulsifier molecules adsorb cooperatively(Brown and Zhao, 1993), favoring so-called surface micellization (Zhu and Gu,1991). The adsorption isotherm of emulsifier on the surface of latex particles canhave various shapes. Adsorption isotherms can be divided into three types:Langmuir (L-) type, S shape (S-type) or the intermediate form, the LS-type (Zhuand Gu, 1991). The adsorption of sodium docecyl sulfate on polystyrene particlesobeys Langmuirian behavior (Ahmed et al, 1980), whereas the adsorption isothermfor polyvinyl acetate latices is of the S-type, characteristic for adsorption on aporous substrate or absorption of emulsifier by the substrate (Ahmed et al, 1980;
56 CHAPTER 4
Verezhikov et al., 1993). For polymerization of polar monomers, the polar groupsof macromolecules near the particle surface tend to orient towards the aqueousphase (Verezhikov et al., 1993; Yeliskeyeva et al., 1973). For this reason, they actas stabilizers as well.
The AE value of a particular surfactant in a latex system strongly depends on thenature of the polymer particle surface (Vijayendran, 1980; 1979). AE increases withincreasing polarity of the particle surface (Vijayendran, 1980; 1979; Paxton, 1969;Zuikov et al., 1975). For a higher polarity of the polymer surface, the density of theadsorbed emulsifier on the particle surface is lower, resulting in a reduced colloidalstability (Yasilenko et al., 1983). The higher the polarity of the polymer particlesurface, the stronger the affinity among the emulsifier molecules themselves ascompared to the affinity between the surfactant and the particle surface (Piirma andChen, 1980). Despite the diminished stabilization by the surfactant, polar polymerparticles may exhibit self-stabilization due to the orientation of the polar groups ofthe polymer at the particle surface (Vijayendran, 1979).
Even though coagulation phenomena have been studied extensively, little attentionhas been paid to coagulation in complex high solids latex systems in stirred tanksunder reaction conditions (Lowry et al., 1984). Usually, recipes of commercialemulsion polymerization processes contain 50 wt% of monomer, resulting in ahigh solids latex product. In contrast with low solids emulsion polymerization, theapparent viscosity of the reaction mixture increases significantly with conversionduring high solids emulsion polymerization in a batch process. The product is arelatively viscous pseudo-plastic latex, see chapter 5. Considering the colloidalstability of high solids latices, the average interparticle distance becomes animportant factor in the interaction between two particles (Chern et al., 1996). Athigh solids content, the classical DLVO theory is no longer applicable (Hsu andLiu, 1998) and multiparticle interactions have to be taken into account (Senguptaand Papadopoulos, 1998). The presence of particles surrounding two interactingparticles reduces the total interaction energy between the latter and consequentlyincreases the probability of coagulation (Hsu and Liu, 1998).
COAGULATION IN EMULSION POLYMERIZATION 57
4.3 Process related influences
Two mechanisms play a role for process related influences on the coagulation rateof submicron polymer particles: Brownian and shear coagulation. Particlesconsiderably smaller than the Kolmogorov microscale for isotropic turbulenceexhibit no inertial effects (Kruis and Kusters, 1997). The effect of surfacecoagulation is minimized by controlling the gas-liquid surface area.
Brownian or perikinetic coagulation is related to the Brownian motion of thepolymer particles in the latex. The intensity of the Brownian motion is directlyproportional to the temperature and inversely proportional to the particle diameter.For similar sized particles Von Smoluchowski (1917) has shown that the rate ofBrownian coagulation is governed by a second order rate equation:
2
3
4N
W
TkJ
Br
RBBr η
= (4.1)
where η, WBr and N stands for the dynamic viscosity, the Brownian stabilitycoefficient and the number of particles per unit volume, respectively.
Shear or orthokinetic coagulation is due to the motion of the surrounding liquid.Agitation increases the force as well as the frequency of the collisions betweenpolymer particles. For monodispersed particles smaller than the Kolmogorovmicroscale the rate of coagulation may be approximated by:
2
35.0
NW
dCJ
Sh
pShSh
=
ηρε
(4.2)
where CSh, ε, ρ, dp and WSh stand for the coagulation coefficient, energydissipation, density of the liquid, particle diameter and shear stability coefficient,respectively. In literature different values are reported for the coagulationcoefficient (Camp and Stein, 1943; Saffman and Turner, 1956; Levich, 1962;Delichatsios and Probstein, 1974; Higashitani et al., 1983).
From equations 4.1 and 4.2 follows the ratio of Brownian and shear coagulation:
( )RbShSh
pBr
Br
Sh
TkWC
dW
J
J
3
4 5.03 ηρε= (4.3)
58 CHAPTER 4
If hydrodynamic forces are neglected and WBr equals WSh, it follows from equation4.3 that Brownian coagulation dominates over shear coagulation for submicronparticles. In latex systems, however, hydrodynamic and colloidal forces modify the
trajectories of the colliding particles, i.e. WBr ≠ WSh (Kusters et al., 1997). WSh
decreases with increasing shear rate, whereas WBr is independent of the shear rate.
The shear rate in the reactor depends on the power transferred into the mixture, dueto stirring. Reactor configuration, scale of operation, impeller speed and impellertype determine the power input. The mean energy dissipation, the power input perunit of mass, is given by:
3
5353
4D
dNN
V
dNN
V
P ip
R
ip
Rav πρ
ε === (4.4)
where P, VR, Np, Ni and d stand for the power input, volume of reaction mixture,power number, impeller speed and impeller diameter, respectively.
In the turbulent flow regime, the empirical power number is determined by theimpeller type and the geometrical arrangement (Rushton et al., 1950). The energydissipation distribution in the reactor has been determined for a Rushton turbineimpeller using a hot film anemometer (Okamoto et al., 1981) and laser dopplervelocimetry, LDV (Costes and Couderc, 1988; Kajbic, 1995). Although theabsolute values of the energy dissipation vary, these papers all indicate largedifferences of local energy dissipation between impeller and circulation zone of thetank. In our laboratory preliminary results of the local energy dissipation have beendetermined from LDV measurements in vessels of different size but with equalRushton geometry (Kajbic, 1995). Internal vessel diameters ranging from 0.2 to 0.8m and a power input of 1 W/kg have been used. These experiments reveal that theenergy dissipation distribution is similar for different reactor scales at equal meanenergy dissipation.
The circulation time of the liquid back to the impeller region might be importantfor shear coagulation when there is coagulation and break up in different areas. Thecirculation time is defined as the ratio of the reaction volume and the discharge rateQ (Thoenes, 1994):
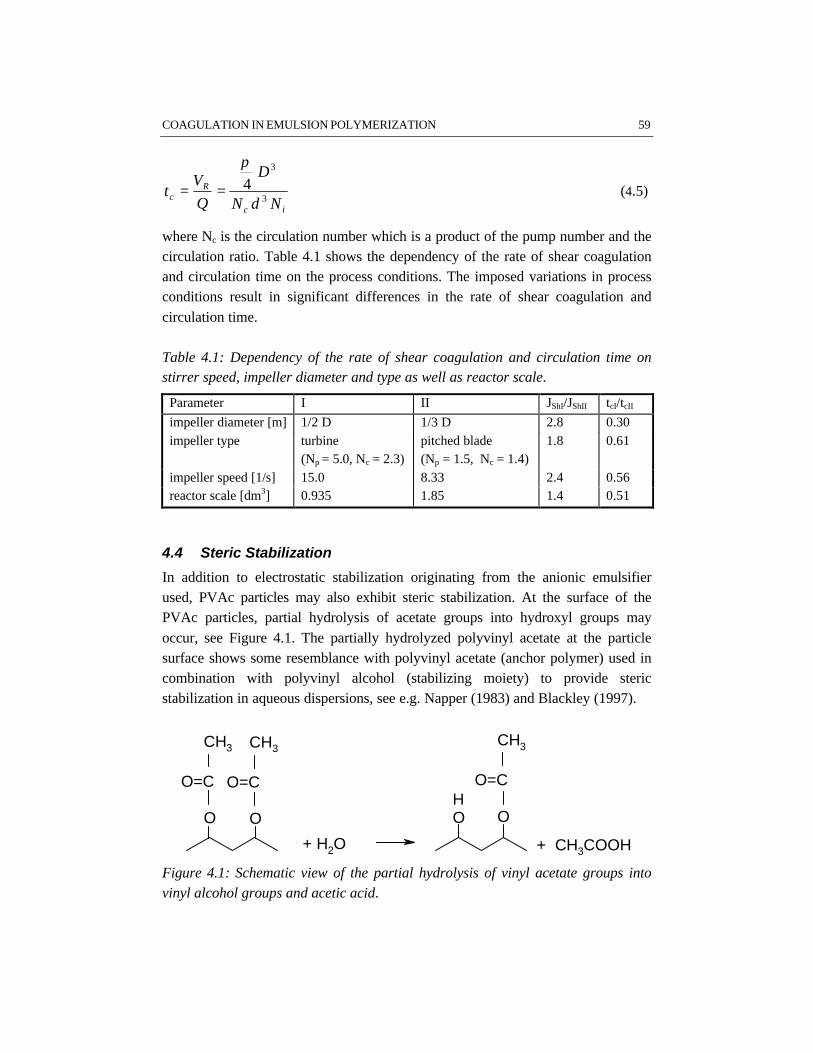
COAGULATION IN EMULSION POLYMERIZATION 59
ic
Rc
NdN
D
Q
Vt
3
3
4
π
== (4.5)
where Nc is the circulation number which is a product of the pump number and thecirculation ratio. Table 4.1 shows the dependency of the rate of shear coagulationand circulation time on the process conditions. The imposed variations in processconditions result in significant differences in the rate of shear coagulation andcirculation time.
Table 4.1: Dependency of the rate of shear coagulation and circulation time onstirrer speed, impeller diameter and type as well as reactor scale.
Parameter I II JShI/JShII tcI/tcII
impeller diameter [m] 1/2 D 1/3 D 2.8 0.30impeller type turbine
(Np = 5.0, Nc = 2.3)pitched blade(Np = 1.5, Nc = 1.4)
1.8 0.61
impeller speed [1/s] 15.0 8.33 2.4 0.56reactor scale [dm3] 0.935 1.85 1.4 0.51
4.4 Steric Stabilization
In addition to electrostatic stabilization originating from the anionic emulsifierused, PVAc particles may also exhibit steric stabilization. At the surface of thePVAc particles, partial hydrolysis of acetate groups into hydroxyl groups mayoccur, see Figure 4.1. The partially hydrolyzed polyvinyl acetate at the particlesurface shows some resemblance with polyvinyl acetate (anchor polymer) used incombination with polyvinyl alcohol (stabilizing moiety) to provide stericstabilization in aqueous dispersions, see e.g. Napper (1983) and Blackley (1997).
CH3
O=C
O
CH3
O=C
O
+ H2O + CH3COOH
HO
CH3
O=C
O
Figure 4.1: Schematic view of the partial hydrolysis of vinyl acetate groups intovinyl alcohol groups and acetic acid.
60 CHAPTER 4
Steric stabilization of colloidal particles is governed by macromolecules that arechemically or physically attached to the surface of the particles (Napper, 1983;Hiemenz and Rajagopalan, 1997). Steric stabilization has both entropic andenthalpic (osmotic) origins (Walker and Grant, 1998). The steric interaction energycan be regarded as the sum of the volume restriction interaction, caused by the lossof configurational freedom of the attached chains, Vfr, and the osmotic interaction,which results from an increase in the local concentration of attached chains close tothe particle surface, Vos (Romero-Cano, et al., 1998; van de Pas, 1993). Thecombination of electrostatic and steric stabilization is often referred to aselectrosteric stabilization (Hiemenz and Rajagopalan, 1997; Romero-Cano, et al.,1998). The overall potential energy is assumed to be the sum of all attractive andrepulsive contributions (Romero-Cano, et al., 1998):
osfrEVDWSEVDWtot VVVVVVVV +++=++= (4.6)
where VVDW, VE and VS stand for Van der Waals attraction, electrostatic repulsionand steric repulsion, respectively.
Steric stabilization requires certain characteristics of the attached stabilizingmolecules:
• The macromolecules should form a layer thickness δ, for which the distance 2δis sufficient to substantially reduce the effect of the Van der Waals attraction(Ottewill, 1997).
• The macromolecular layer should have sufficient density to provide stericinterference (Blackley, 1997).
• One end of the macromolecules have to stay firmly attached to the surface(Ottewill, 1997).
• The macromolecular chains should be sufficiently solvated by the dispersingmedium (Blackley, 1997), for emulsion polymerization mixtures the watermolecules of the continuous phase.
There are various types of steric stabilizers (Ottewill, 1997): non-ionic surfactants,random coil polymers, linear block copolymers, brush copolymers, graftedpolymer chains and globular molecules. Concerning steric stabilization, the degreeof surface coverage of the attached chains is important as well as the orientation,which is dependent on the molecular structure (Walker and Grant, 1998; Romero-Cano, et al., 1998). In the case of vinyl alcohol segments on polyvinyl acetateparticles, the polymer chains are irreversibly bound to the surface. For terminally
COAGULATION IN EMULSION POLYMERIZATION 61
attached, isolated chains two limiting cases are considered: the ‘mushroom’structure and the ‘pancake’ structure where the chain revisits the surface (Fleer etal., 1993). When the average chain density on the surface increases and chainoverlap occurs, the structure becomes stretched into a brush form (Hiemenz andRajagopalan, 1997; Fleer et al., 1993). Romero-Cano et al. (1998) have studied thecolloidal stability of polystyrene particles with polyethylene oxide chains on thesurface as steric stabilizers. The results reported by these authors point to aconformational change resulting in an extension of the chains when the chainlength of the surfactant molecules increases. This conformational change results ina better colloidal stability due to a larger distance between the chain-ends and theparticle surface. Romero-Cano et al. (1998) also have found that a morehydrophobic surface provides a more extended conformation, resulting in bettercolloidal stability. According to Walker and Grant (1998), the length as well as theflexibility of the chains affect the conformation of the macromolecules at theparticle surface and consequently the colloidal stability of the system. Liu et al.(1997) have studied the colloidal stability of polystyrene particles, synthesizedwith macromonomer polyethylene oxide as polymerizable stabilizer. According toLiu et al. (1997) only a small fraction of the particle surface has to be covered withmacromolecules in order to provide sufficient steric stability of the latex system.Steric stabilization also depends on the relative size of the PVAc particles ascompared to the size of the stabilizing vinyl alcohol segments (Walker and Grant,1998; Ottewill, 1997). Only if the particle size is considerably larger than theradius of gyration of the macromolecules, steric stabilization will occur.
Electrostatic and steric stabilization differ in several ways:
• Sterically stabilized dispersions are relatively insensitive to the presence ofelectrolyte as compared to electrostatically stabilized systems (Napper, 1983).Steric stabilizers can be effective at high electrolyte concentrations whereelectrical double layers are shielded to such an extent that they are almostunable to provide colloidal stability (Blackley, 1997). However, when thepolymer chain is charged and/or the particle surface carries a charge,electrolyte as well as pH become important for the electrosteric stability (bothelectrostatic and steric interactions) of the colloidal system (Walker and Grant,1998; Fleer et al., 1993).
• Steric stabilization is more sensitive to temperature than electrostaticstabilization (Blackley, 1997).
62 CHAPTER 4
• The efficiency of steric stabilization is usually equal for latex systems with low
or high solids content (Napper, 1983; Russel et al., 1989). As a consequenceof the interactions between the charge clouds of the electrical double layerssurrounding the particles, an increased solids contents leads to a considerablymore pronounced increase in the viscosity for electrostatically stabilized latexsystems as compared to sterically stabilized latex sytems.
• When the interparticle distance decreases by an increase in solids content, thebeginning of the steric repulsion is quite sudden, while the electrostaticrepulsion operates over rather long distances (Ottewill, 1997). There is littlesteric repulsion between the attached chains on different particles when theyare far apart. However, once the layers approach each other there is a suddenincrease in the repulsive forces.
4.5 Reactor fouling
Reactor fouling often occurs during high solids emulsion polymerization at about60-70% conversion, see chapter 5. Two types of fouling can be distinguished:coagulum formation in the latex and polymer build-up on the wall, impeller andbaffles of the reactor (Vanderhoff, 1981). Reactor fouling causes several problemsin the production of latices (Lowry et al., 1984). It decreases the yield of the latexproduced (Vanderhoff, 1981) and increases the heat transfer resistance to thereactor wall. The quality and properties of the final latex product are also affected(Kostansek, 1996) and reactor fouling shortens the time intervals between reactorshut downs for cleaning (Chern et al., 1996).
The formation of coagulum in the latex is caused by a loss of colloidal stability ofthe particles, which may eventually form microscopic and/or macroscopiccoagulum (Vanderhoff, 1981). Once a floc is formed, it quickly aggregates withpolymer particles to form more coagulum (Lowry et al., 1986). Coagulum can alsoresult from the entry of radicals into separate layers of monomer causing bulkpolymerization (Vanderhoff, 1981). A few very large particles, incidentally formedby droplet polymerization, may act as nuclei for coagulum formation (Rodriguesand Schork, 1997). Coagulum is relatively easily formed when the fractionalsurface coverage of the particles is low or at high electrolyte and particleconcentrations (Chern and Kuo, 1996). The hydrophobicity of themonomer/polymer in the reacting system may also influence the formation ofcoagulum (Kostansek, 1996). Note that for particles with a low fractional coverage
COAGULATION IN EMULSION POLYMERIZATION 63
of the surface with ionic groups, a significant part of the particle surface may havea hydrophobic ‘non-wettable’ character (Sjöblom, 1996). Particles with suchhydrophobic areas may associate, so minimizing their contact-surface with water(Sjöblom, 1996).
The amount of coagulum formation may increase considerably for recipes withmonomer weight fractions above 0.40 (Chern and Hsu, 1996). According to Chernet al. (1996), the impeller speed has no significant influence. For low solids contentmixtures, Kusters (1991) has studied the influence of the hydrodynamics on the
turbulent aggregation of 1 µm polystyrene particles in baffled turbine agitatedvessels. Attention has been focused on the dependence of aggregate size on thestirrer speed, solids concentration, electrolyte concentration and vessel size. Theresults show that a dynamic equilibrium exists between aggregate growth inregions of low turbulent shear stress, i.e. the circulation zone, and break-up ofaggregates in regions of high shear stress, i.e. the impeller region. The question ishow important the break-up mechanism is for the formation of coagulum duringemulsion polymerization. Kemoun et al. (1997) have studied the influence ofhydrodynamics on the aggregation of clay in agitated vessels. In contrast withChern et al. (1996), the results by Kemoun et al. (1997) point to a dynamicequilibrium between aggregate size and local hydrodynamic conditions. A higherstirrer speed corresponds with smaller average floc sizes. At the discharge flowlocations of the impeller, considerably smaller floc sizes have been measured thanelsewhere in the vessel. Extrapolation of these results to emulsion polymerizationsystems suggests that the energy dissipation distribution influences the formationof coagulum. The energy dissipation distribution appears to be independent ofvessel size at constant power input (Schoenmakers et al., in prep.). In that casecoagulum formation is expected to be scale independent, unless the kinetics forbreak up of coagulum are affected by the circulation time. At the same meanenergy dissipation the circulation time increases with scale. From the foregoing itcan be concluded that, large, radial flow impellers, which produce a relativelyuniform power input (Henzler and Biermann, 1996) are probably more suitable forprevention of coagulum formation than small axial flow impellers.
The polymer on the reactor wall, impeller and baffles results from surfacepolymerization (Vanderhoff, 1981) as well as from deposition of polymer particles(van de Ven, 1998). Polymer build-up depends among others on the material of thevessel surface. Glass-lined reactors are less sensitive to polymer deposition than
64 CHAPTER 4
stainless steel reactors (Vanderhoff, 1981). Surface polymerization is related to thesmoothness of the surfaces in the reactor, because scratches are dominant locationsfor the fixation of polymer or radical carrying oligomeric species (Vanderhoff,1981). Wetting of the reactor surface by the monomer/polymer phase is facilitatedby surface roughness (Vanderhoff, 1981). Since the specific surface area is loweron larger scales, the effect of polymer build-up on the yield and properties of thelatex product will become less important on a larger scale. However, in industrialemulsion polymerization, the inevitable cleaning of reactor surfaces is still aconsiderable problem.
Concerning the attachment of particles on the reactor surface, three phenomena areinvolved: deposition, blocking, i.e. collisions between free particles and depositedparticles resulting in a particle flux away from the surface, and detachment (van deVen, 1998). The mechanism of particle deposition is governed by the physico-chemical properties of the latex and the surface characteristics of the equipmentused as well as by the hydrodynamic conditions in the stirred latex (van de Ven,1998). Van der Waals, electrostatic and hydrophobic interactions play a role in thedeposition of colloidal particles onto equipment surfaces (van de Ven, 1998).
4.6 Results
In emulsion polymerization, the coagulation process is mainly influenced by theinitial conditions of the system. Both the recipe (i.e. solids content, monomer type,electrolyte, and emulsifier concentration) and the operating conditions (i.e. reactorscale, stirrer speed, impeller diameter and type), determine the initial conditions ofthe system. Additionally, the coagulation process is also influenced by thechanging conditions during polymerization as a result of particle growth. In thiswork coagulation kinetics are probably of minor importance, since the time scaleof coagulation is small as compared to the time scale of polymerization. During thewhole polymerization process, equilibrium conditions are assumed to be valid.
4.6.1 Colloidal stability of polystyrene latices
Both the impact of physico-chemical and process related influences on thecoagulation behavior of polystyrene latices have been investigated during seededemulsion polymerization. An overview of the polystyrene seed-latices, recipes andpolymerization experiments is given in the Tables 4.2-4.4.
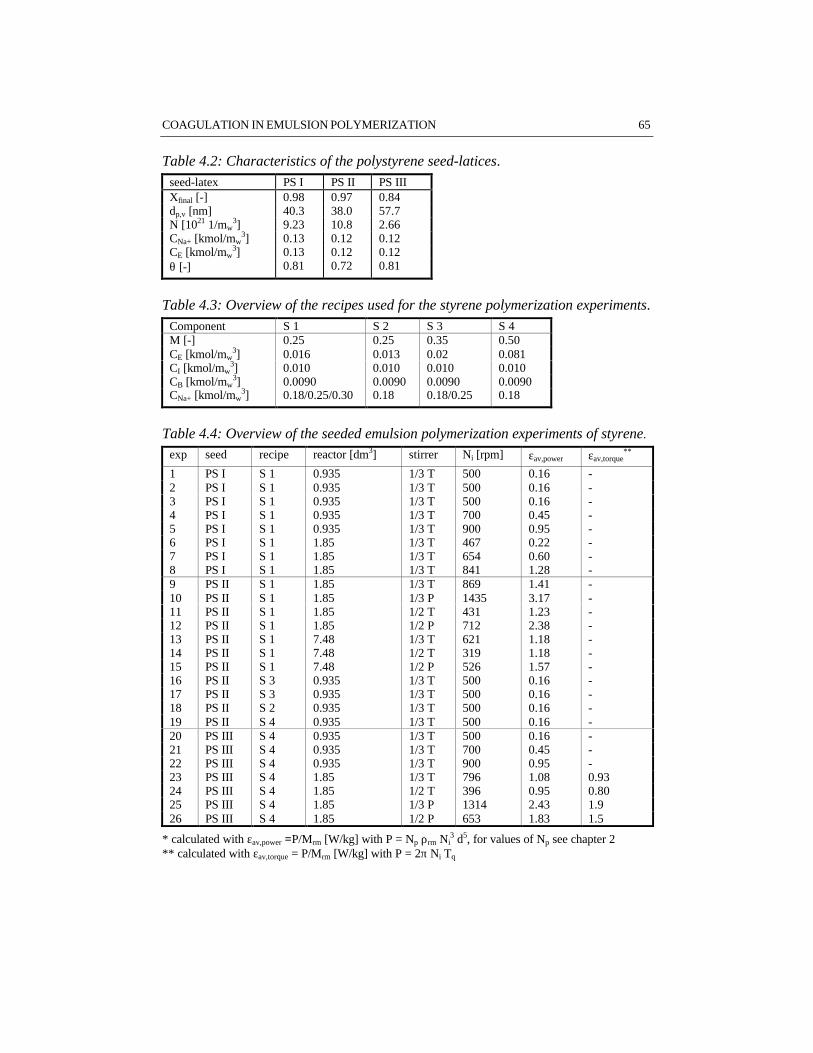
COAGULATION IN EMULSION POLYMERIZATION 65
Table 4.2: Characteristics of the polystyrene seed-latices.seed-latex PS I PS II PS IIIXfinal [-] 0.98 0.97 0.84dp,v [nm] 40.3 38.0 57.7N [1021 1/mw
3] 9.23 10.8 2.66CNa+ [kmol/mw
3] 0.13 0.12 0.12CE [kmol/mw
3] 0.13 0.12 0.12θ [-] 0.81 0.72 0.81
Table 4.3: Overview of the recipes used for the styrene polymerization experiments.Component S 1 S 2 S 3 S 4M [-] 0.25 0.25 0.35 0.50CE [kmol/mw
3] 0.016 0.013 0.02 0.081CI [kmol/mw
3] 0.010 0.010 0.010 0.010CB [kmol/mw
3] 0.0090 0.0090 0.0090 0.0090CNa+ [kmol/mw
3] 0.18/0.25/0.30 0.18 0.18/0.25 0.18
Table 4.4: Overview of the seeded emulsion polymerization experiments of styrene.
exp seed recipe reactor [dm3] stirrer Ni [rpm] εav,power εav,torque**
1 PS I S 1 0.935 1/3 T 500 0.16 -2 PS I S 1 0.935 1/3 T 500 0.16 -3 PS I S 1 0.935 1/3 T 500 0.16 -4 PS I S 1 0.935 1/3 T 700 0.45 -5 PS I S 1 0.935 1/3 T 900 0.95 -6 PS I S 1 1.85 1/3 T 467 0.22 -7 PS I S 1 1.85 1/3 T 654 0.60 -8 PS I S 1 1.85 1/3 T 841 1.28 -9 PS II S 1 1.85 1/3 T 869 1.41 -10 PS II S 1 1.85 1/3 P 1435 3.17 -11 PS II S 1 1.85 1/2 T 431 1.23 -12 PS II S 1 1.85 1/2 P 712 2.38 -13 PS II S 1 7.48 1/3 T 621 1.18 -14 PS II S 1 7.48 1/2 T 319 1.18 -15 PS II S 1 7.48 1/2 P 526 1.57 -16 PS II S 3 0.935 1/3 T 500 0.16 -17 PS II S 3 0.935 1/3 T 500 0.16 -18 PS II S 2 0.935 1/3 T 500 0.16 -19 PS II S 4 0.935 1/3 T 500 0.16 -20 PS III S 4 0.935 1/3 T 500 0.16 -21 PS III S 4 0.935 1/3 T 700 0.45 -22 PS III S 4 0.935 1/3 T 900 0.95 -23 PS III S 4 1.85 1/3 T 796 1.08 0.9324 PS III S 4 1.85 1/2 T 396 0.95 0.8025 PS III S 4 1.85 1/3 P 1314 2.43 1.926 PS III S 4 1.85 1/2 P 653 1.83 1.5
* calculated with εav,power =P/Mrm [W/kg] with P = Np ρrm Ni3 d5, for values of Np see chapter 2
** calculated with εav,torque = P/Mrm [W/kg] with P = 2π Ni Tq
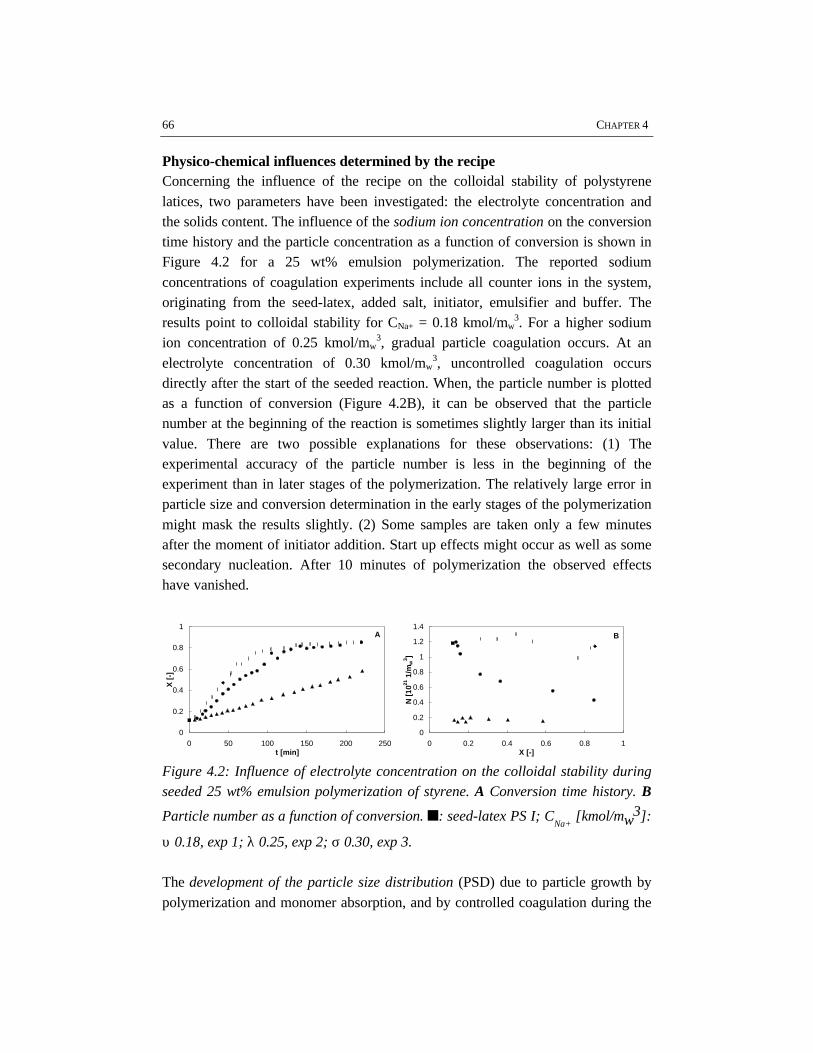
66 CHAPTER 4
Physico-chemical influences determined by the recipeConcerning the influence of the recipe on the colloidal stability of polystyrenelatices, two parameters have been investigated: the electrolyte concentration andthe solids content. The influence of the sodium ion concentration on the conversiontime history and the particle concentration as a function of conversion is shown inFigure 4.2 for a 25 wt% emulsion polymerization. The reported sodiumconcentrations of coagulation experiments include all counter ions in the system,originating from the seed-latex, added salt, initiator, emulsifier and buffer. Theresults point to colloidal stability for CNa+ = 0.18 kmol/mw
3. For a higher sodiumion concentration of 0.25 kmol/mw
3, gradual particle coagulation occurs. At anelectrolyte concentration of 0.30 kmol/mw
3, uncontrolled coagulation occursdirectly after the start of the seeded reaction. When, the particle number is plottedas a function of conversion (Figure 4.2B), it can be observed that the particlenumber at the beginning of the reaction is sometimes slightly larger than its initialvalue. There are two possible explanations for these observations: (1) Theexperimental accuracy of the particle number is less in the beginning of theexperiment than in later stages of the polymerization. The relatively large error inparticle size and conversion determination in the early stages of the polymerizationmight mask the results slightly. (2) Some samples are taken only a few minutesafter the moment of initiator addition. Start up effects might occur as well as somesecondary nucleation. After 10 minutes of polymerization the observed effectshave vanished.
0
0.2
0.4
0.6
0.8
1
0 50 100 150 200 250t [min]
X [
-]
A
0
0.2
0.4
0.6
0.8
1
1.2
1.4
0 0.2 0.4 0.6 0.8 1X [-]
N [
1021
1/m
w3 ]
B
Figure 4.2: Influence of electrolyte concentration on the colloidal stability duringseeded 25 wt% emulsion polymerization of styrene. A Conversion time history. B
Particle number as a function of conversion. n: seed-latex PS I; CNa+ [kmol/mw
3]:
υ 0.18, exp 1; λ 0.25, exp 2; σ 0.30, exp 3.
The development of the particle size distribution (PSD) due to particle growth bypolymerization and monomer absorption, and by controlled coagulation during the
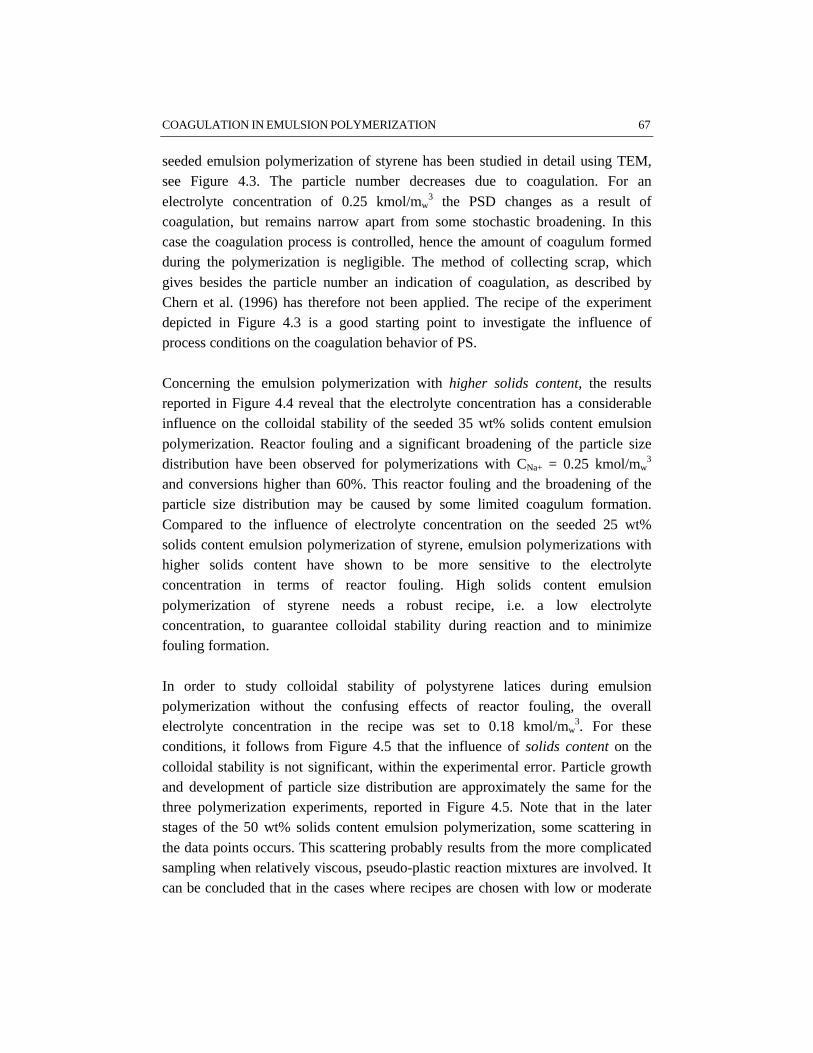
COAGULATION IN EMULSION POLYMERIZATION 67
seeded emulsion polymerization of styrene has been studied in detail using TEM,see Figure 4.3. The particle number decreases due to coagulation. For anelectrolyte concentration of 0.25 kmol/mw
3 the PSD changes as a result ofcoagulation, but remains narrow apart from some stochastic broadening. In thiscase the coagulation process is controlled, hence the amount of coagulum formedduring the polymerization is negligible. The method of collecting scrap, whichgives besides the particle number an indication of coagulation, as described byChern et al. (1996) has therefore not been applied. The recipe of the experimentdepicted in Figure 4.3 is a good starting point to investigate the influence ofprocess conditions on the coagulation behavior of PS.
Concerning the emulsion polymerization with higher solids content, the resultsreported in Figure 4.4 reveal that the electrolyte concentration has a considerableinfluence on the colloidal stability of the seeded 35 wt% solids content emulsionpolymerization. Reactor fouling and a significant broadening of the particle sizedistribution have been observed for polymerizations with CNa+ = 0.25 kmol/mw
3
and conversions higher than 60%. This reactor fouling and the broadening of theparticle size distribution may be caused by some limited coagulum formation.Compared to the influence of electrolyte concentration on the seeded 25 wt%solids content emulsion polymerization of styrene, emulsion polymerizations withhigher solids content have shown to be more sensitive to the electrolyteconcentration in terms of reactor fouling. High solids content emulsionpolymerization of styrene needs a robust recipe, i.e. a low electrolyteconcentration, to guarantee colloidal stability during reaction and to minimizefouling formation.
In order to study colloidal stability of polystyrene latices during emulsionpolymerization without the confusing effects of reactor fouling, the overallelectrolyte concentration in the recipe was set to 0.18 kmol/mw
3. For theseconditions, it follows from Figure 4.5 that the influence of solids content on thecolloidal stability is not significant, within the experimental error. Particle growthand development of particle size distribution are approximately the same for thethree polymerization experiments, reported in Figure 4.5. Note that in the laterstages of the 50 wt% solids content emulsion polymerization, some scattering inthe data points occurs. This scattering probably results from the more complicatedsampling when relatively viscous, pseudo-plastic reaction mixtures are involved. Itcan be concluded that in the cases where recipes are chosen with low or moderate
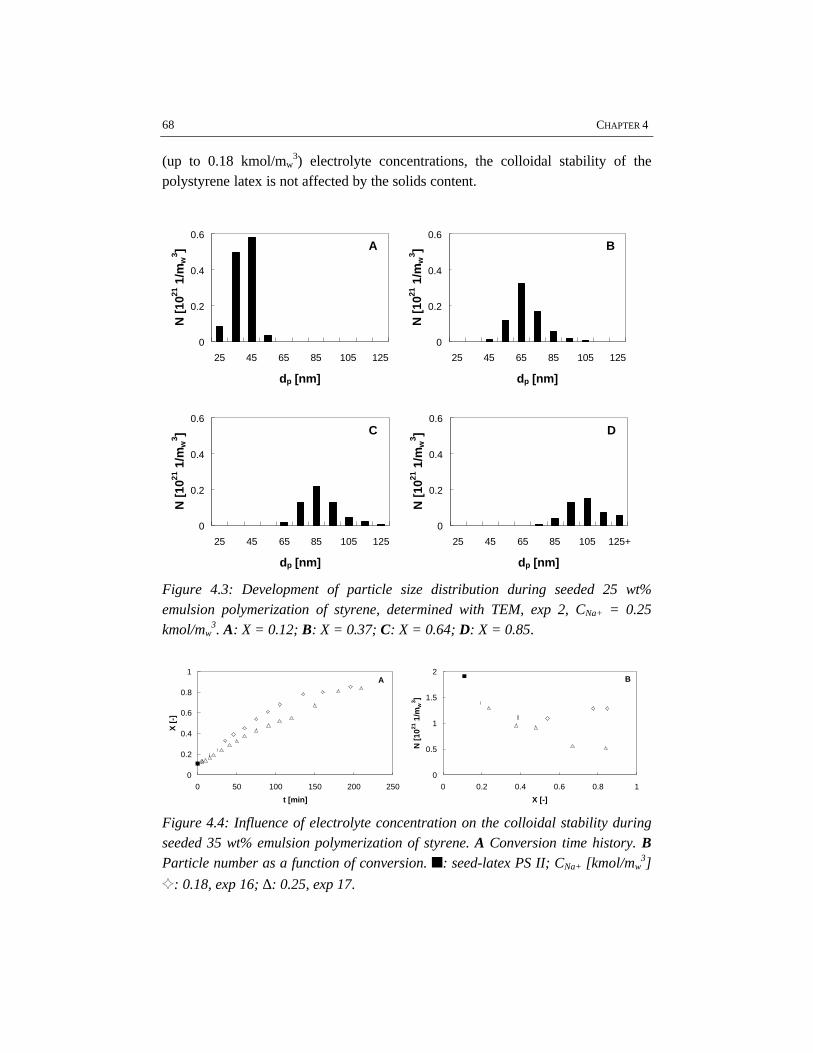
68 CHAPTER 4
(up to 0.18 kmol/mw3) electrolyte concentrations, the colloidal stability of the
polystyrene latex is not affected by the solids content.
0
0.2
0.4
0.6
25 45 65 85 105 125
dp [nm]
N [
1021
1/m
w3 ] A
0
0.2
0.4
0.6
25 45 65 85 105 125
dp [nm]
N [
1021
1/m
w3 ] B
0
0.2
0.4
0.6
25 45 65 85 105 125
dp [nm]
N [
1021
1/m
w3 ] C
0
0.2
0.4
0.6
25 45 65 85 105 125+
dp [nm]
N [
1021
1/m
w3 ] D
Figure 4.3: Development of particle size distribution during seeded 25 wt%emulsion polymerization of styrene, determined with TEM, exp 2, CNa+ = 0.25kmol/mw
3. A: X = 0.12; B: X = 0.37; C: X = 0.64; D: X = 0.85.
0
0.2
0.4
0.6
0.8
1
0 50 100 150 200 250
t [min]
X [
-]
A
0
0.5
1
1.5
2
0 0.2 0.4 0.6 0.8 1
X [-]
N [
1021
1/m
w3 ]
B
Figure 4.4: Influence of electrolyte concentration on the colloidal stability duringseeded 35 wt% emulsion polymerization of styrene. A Conversion time history. BParticle number as a function of conversion. n: seed-latex PS II; CNa+ [kmol/mw
3]
G: 0.18, exp 16; ∆: 0.25, exp 17.
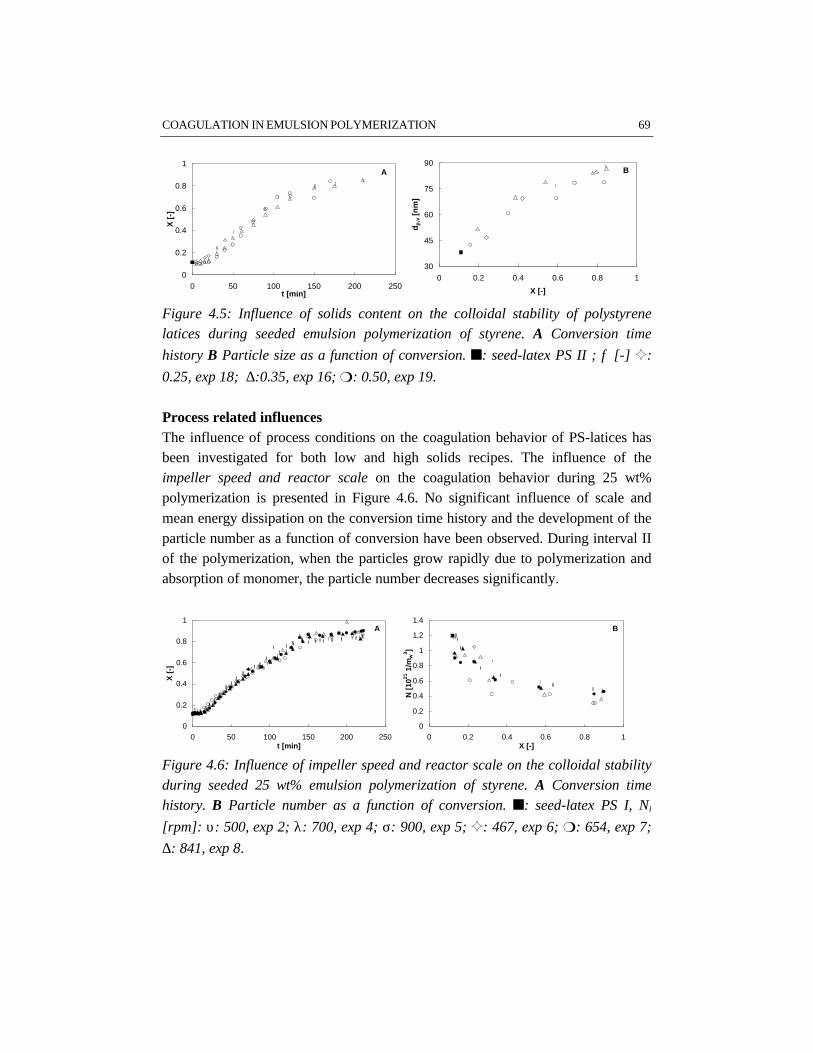
COAGULATION IN EMULSION POLYMERIZATION 69
0
0.2
0.4
0.6
0.8
1
0 50 100 150 200 250t [min]
X [
-]A
30
45
60
75
90
0 0.2 0.4 0.6 0.8 1
X [-]
dp
,v [
nm
]
B
Figure 4.5: Influence of solids content on the colloidal stability of polystyrenelatices during seeded emulsion polymerization of styrene. A Conversion time
history B Particle size as a function of conversion. n: seed-latex PS II ; φ [-] G:
0.25, exp 18; ∆:0.35, exp 16; m: 0.50, exp 19.
Process related influencesThe influence of process conditions on the coagulation behavior of PS-latices hasbeen investigated for both low and high solids recipes. The influence of theimpeller speed and reactor scale on the coagulation behavior during 25 wt%polymerization is presented in Figure 4.6. No significant influence of scale andmean energy dissipation on the conversion time history and the development of theparticle number as a function of conversion have been observed. During interval IIof the polymerization, when the particles grow rapidly due to polymerization andabsorption of monomer, the particle number decreases significantly.
0
0.2
0.4
0.6
0.8
1
0 50 100 150 200 250t [min]
X [
-]
A
0
0.2
0.4
0.6
0.8
1
1.2
1.4
0 0.2 0.4 0.6 0.8 1X [-]
N [
1021
1/m
w3 ]
B
Figure 4.6: Influence of impeller speed and reactor scale on the colloidal stabilityduring seeded 25 wt% emulsion polymerization of styrene. A Conversion timehistory. B Particle number as a function of conversion. n: seed-latex PS I, Ni
[rpm]: υ: 500, exp 2; λ: 700, exp 4; σ: 900, exp 5; G: 467, exp 6; m: 654, exp 7;
∆: 841, exp 8.
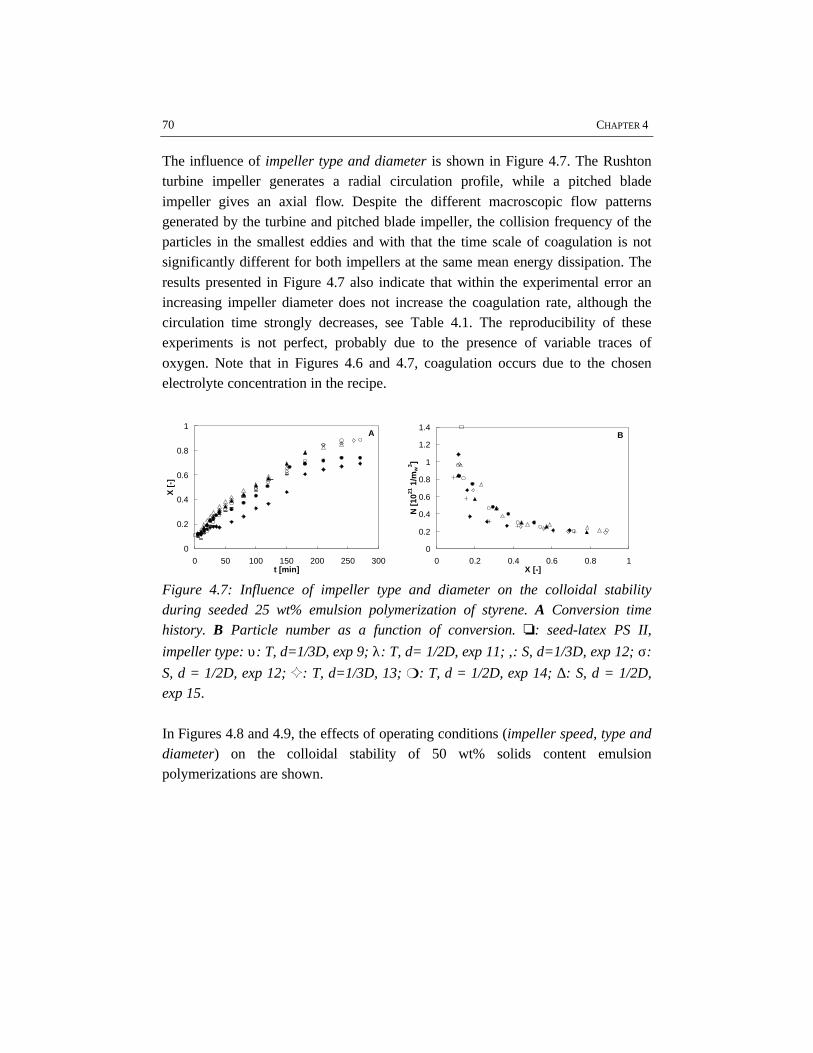
70 CHAPTER 4
The influence of impeller type and diameter is shown in Figure 4.7. The Rushtonturbine impeller generates a radial circulation profile, while a pitched bladeimpeller gives an axial flow. Despite the different macroscopic flow patternsgenerated by the turbine and pitched blade impeller, the collision frequency of theparticles in the smallest eddies and with that the time scale of coagulation is notsignificantly different for both impellers at the same mean energy dissipation. Theresults presented in Figure 4.7 also indicate that within the experimental error anincreasing impeller diameter does not increase the coagulation rate, although thecirculation time strongly decreases, see Table 4.1. The reproducibility of theseexperiments is not perfect, probably due to the presence of variable traces ofoxygen. Note that in Figures 4.6 and 4.7, coagulation occurs due to the chosenelectrolyte concentration in the recipe.
0
0.2
0.4
0.6
0.8
1
0 50 100 150 200 250 300t [min]
X [
-]
A
0
0.2
0.4
0.6
0.8
1
1.2
1.4
0 0.2 0.4 0.6 0.8 1X [-]
N [
1021
1/m
w3 ]
B
Figure 4.7: Influence of impeller type and diameter on the colloidal stabilityduring seeded 25 wt% emulsion polymerization of styrene. A Conversion timehistory. B Particle number as a function of conversion. o: seed-latex PS II,
impeller type: υ: T, d=1/3D, exp 9; λ: T, d= 1/2D, exp 11; ,: S, d=1/3D, exp 12; σ:
S, d = 1/2D, exp 12; G: T, d=1/3D, 13; m: T, d = 1/2D, exp 14; ∆: S, d = 1/2D,exp 15.
In Figures 4.8 and 4.9, the effects of operating conditions (impeller speed, type anddiameter) on the colloidal stability of 50 wt% solids content emulsionpolymerizations are shown.
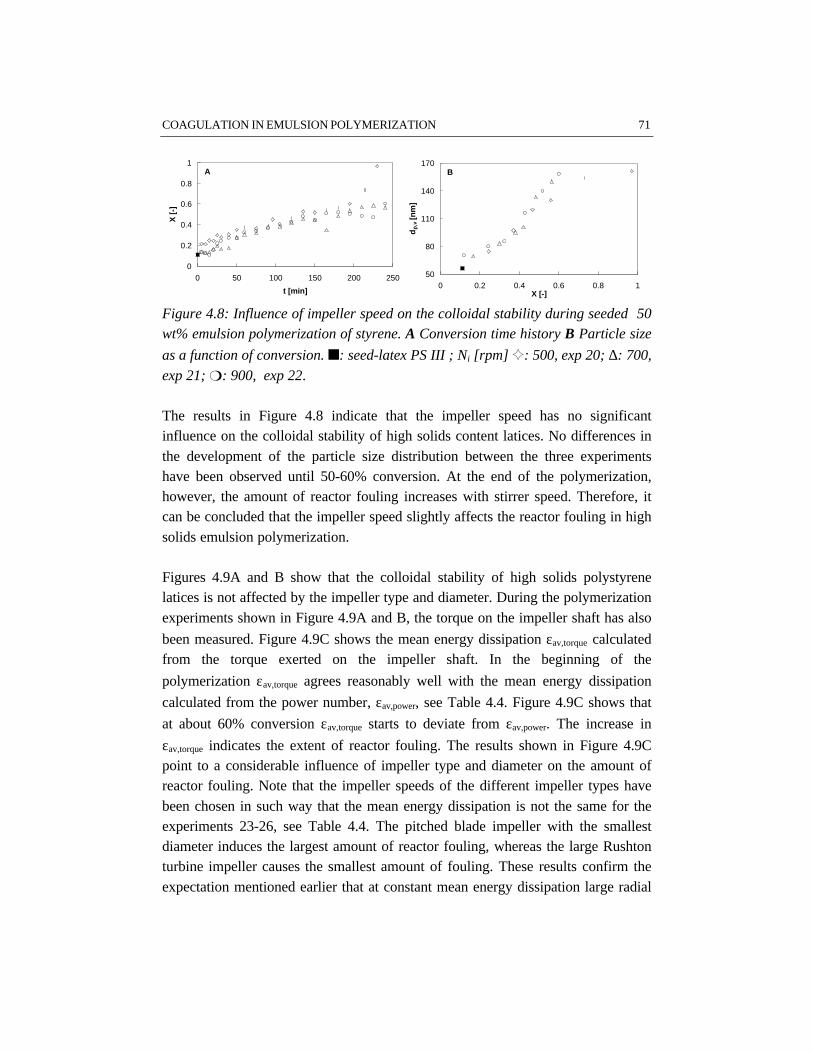
COAGULATION IN EMULSION POLYMERIZATION 71
0
0.2
0.4
0.6
0.8
1
0 50 100 150 200 250
t [min]
X [
-]A
50
80
110
140
170
0 0.2 0.4 0.6 0.8 1X [-]
dp
,v [
nm
]
B
Figure 4.8: Influence of impeller speed on the colloidal stability during seeded 50wt% emulsion polymerization of styrene. A Conversion time history B Particle size
as a function of conversion. n: seed-latex PS III ; Ni [rpm] G: 500, exp 20; ∆: 700,
exp 21; m: 900, exp 22.
The results in Figure 4.8 indicate that the impeller speed has no significantinfluence on the colloidal stability of high solids content latices. No differences inthe development of the particle size distribution between the three experimentshave been observed until 50-60% conversion. At the end of the polymerization,however, the amount of reactor fouling increases with stirrer speed. Therefore, itcan be concluded that the impeller speed slightly affects the reactor fouling in highsolids emulsion polymerization.
Figures 4.9A and B show that the colloidal stability of high solids polystyrenelatices is not affected by the impeller type and diameter. During the polymerizationexperiments shown in Figure 4.9A and B, the torque on the impeller shaft has also
been measured. Figure 4.9C shows the mean energy dissipation εav,torque calculatedfrom the torque exerted on the impeller shaft. In the beginning of the
polymerization εav,torque agrees reasonably well with the mean energy dissipation
calculated from the power number, εav,power, see Table 4.4. Figure 4.9C shows that
at about 60% conversion εav,torque starts to deviate from εav,power. The increase in
εav,torque indicates the extent of reactor fouling. The results shown in Figure 4.9Cpoint to a considerable influence of impeller type and diameter on the amount ofreactor fouling. Note that the impeller speeds of the different impeller types havebeen chosen in such way that the mean energy dissipation is not the same for theexperiments 23-26, see Table 4.4. The pitched blade impeller with the smallestdiameter induces the largest amount of reactor fouling, whereas the large Rushtonturbine impeller causes the smallest amount of fouling. These results confirm theexpectation mentioned earlier that at constant mean energy dissipation large radial
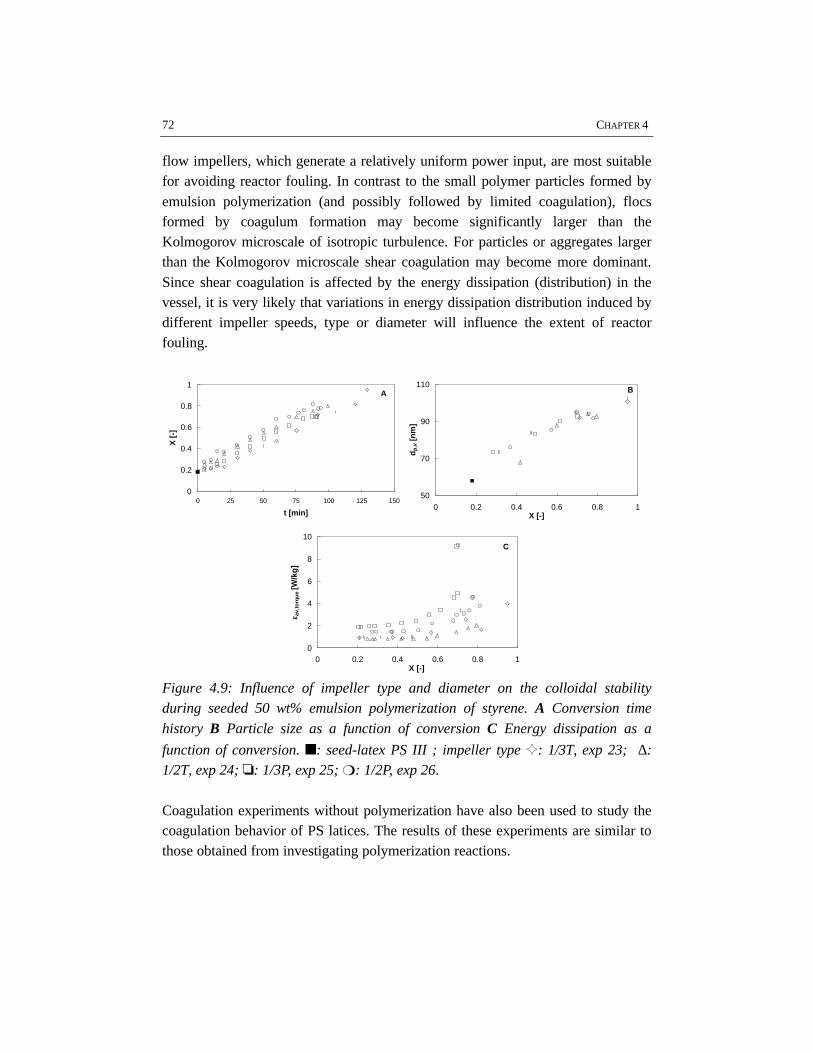
72 CHAPTER 4
flow impellers, which generate a relatively uniform power input, are most suitablefor avoiding reactor fouling. In contrast to the small polymer particles formed byemulsion polymerization (and possibly followed by limited coagulation), flocsformed by coagulum formation may become significantly larger than theKolmogorov microscale of isotropic turbulence. For particles or aggregates largerthan the Kolmogorov microscale shear coagulation may become more dominant.Since shear coagulation is affected by the energy dissipation (distribution) in thevessel, it is very likely that variations in energy dissipation distribution induced bydifferent impeller speeds, type or diameter will influence the extent of reactorfouling.
0
0.2
0.4
0.6
0.8
1
0 25 50 75 100 125 150
t [min]
X [
-]
A
50
70
90
110
0 0.2 0.4 0.6 0.8 1X [-]
dp
,v [
nm
]
B
0
2
4
6
8
10
0 0.2 0.4 0.6 0.8 1X [-]
εε av,
torq
ue
[W/k
g]
C
Figure 4.9: Influence of impeller type and diameter on the colloidal stabilityduring seeded 50 wt% emulsion polymerization of styrene. A Conversion time
history B Particle size as a function of conversion C Energy dissipation as a
function of conversion. n: seed-latex PS III ; impeller type G: 1/3T, exp 23; ∆:1/2T, exp 24; o: 1/3P, exp 25; m: 1/2P, exp 26.
Coagulation experiments without polymerization have also been used to study thecoagulation behavior of PS latices. The results of these experiments are similar tothose obtained from investigating polymerization reactions.
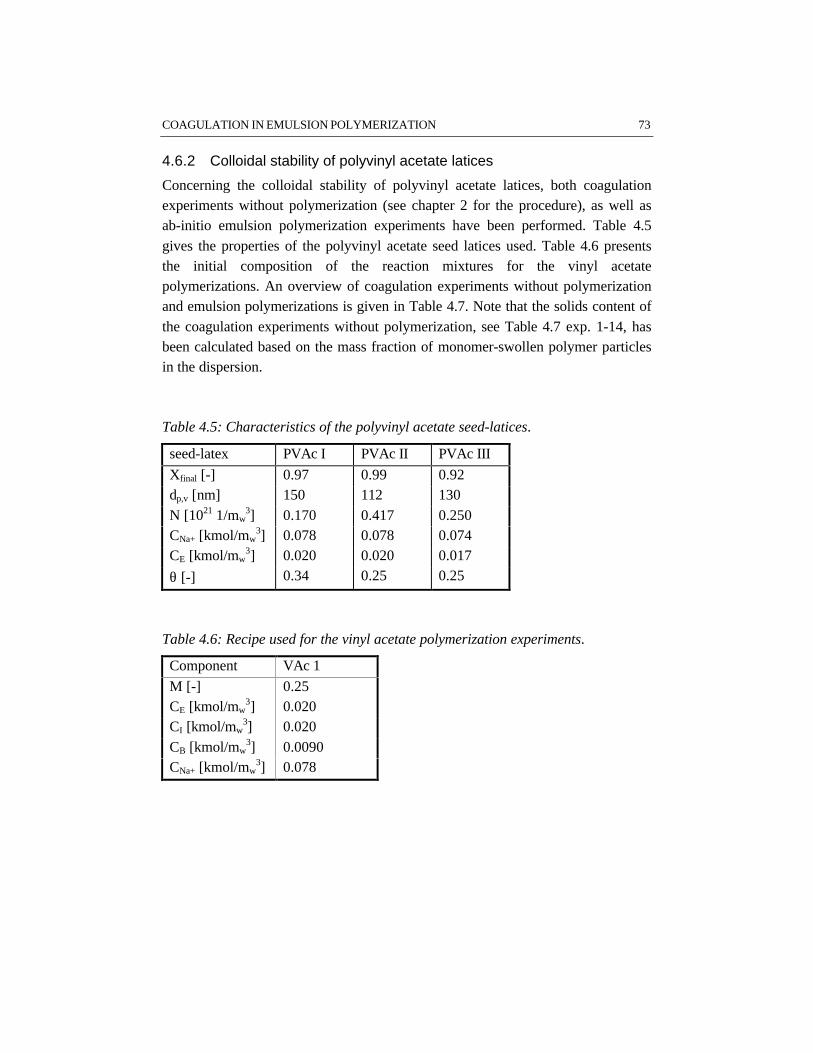
COAGULATION IN EMULSION POLYMERIZATION 73
4.6.2 Colloidal stability of polyvinyl acetate latices
Concerning the colloidal stability of polyvinyl acetate latices, both coagulationexperiments without polymerization (see chapter 2 for the procedure), as well asab-initio emulsion polymerization experiments have been performed. Table 4.5gives the properties of the polyvinyl acetate seed latices used. Table 4.6 presentsthe initial composition of the reaction mixtures for the vinyl acetatepolymerizations. An overview of coagulation experiments without polymerizationand emulsion polymerizations is given in Table 4.7. Note that the solids content ofthe coagulation experiments without polymerization, see Table 4.7 exp. 1-14, hasbeen calculated based on the mass fraction of monomer-swollen polymer particlesin the dispersion.
Table 4.5: Characteristics of the polyvinyl acetate seed-latices.
seed-latex PVAc I PVAc II PVAc III
Xfinal [-] 0.97 0.99 0.92dp,v [nm] 150 112 130N [1021 1/mw
3] 0.170 0.417 0.250CNa+ [kmol/mw
3] 0.078 0.078 0.074CE [kmol/mw
3] 0.020 0.020 0.017
θ [-] 0.34 0.25 0.25
Table 4.6: Recipe used for the vinyl acetate polymerization experiments.
Component VAc 1
M [-] 0.25CE [kmol/mw
3] 0.020CI [kmol/mw
3] 0.020CB [kmol/mw
3] 0.0090CNa+ [kmol/mw
3] 0.078
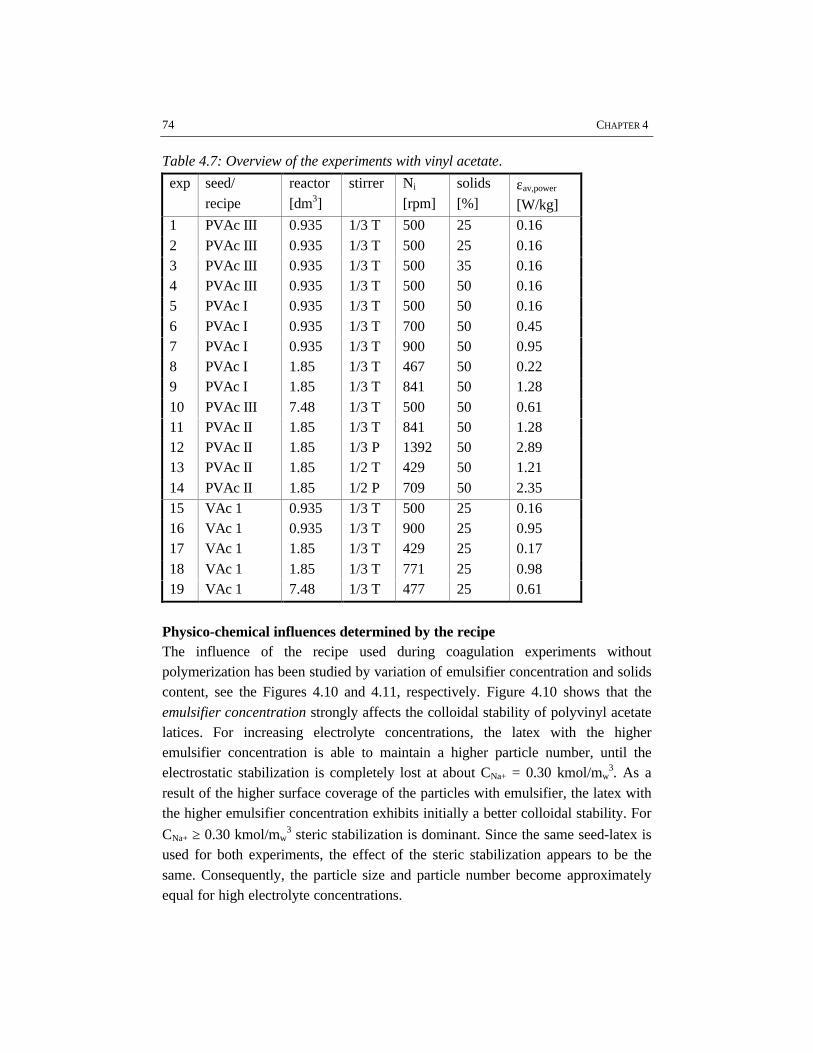
74 CHAPTER 4
Table 4.7: Overview of the experiments with vinyl acetate.
exp seed/recipe
reactor[dm3]
stirrer Ni
[rpm]solids[%]
εav,power
[W/kg]1 PVAc III 0.935 1/3 T 500 25 0.162 PVAc III 0.935 1/3 T 500 25 0.163 PVAc III 0.935 1/3 T 500 35 0.164 PVAc III 0.935 1/3 T 500 50 0.165 PVAc I 0.935 1/3 T 500 50 0.166 PVAc I 0.935 1/3 T 700 50 0.457 PVAc I 0.935 1/3 T 900 50 0.958 PVAc I 1.85 1/3 T 467 50 0.229 PVAc I 1.85 1/3 T 841 50 1.2810 PVAc III 7.48 1/3 T 500 50 0.6111 PVAc II 1.85 1/3 T 841 50 1.2812 PVAc II 1.85 1/3 P 1392 50 2.8913 PVAc II 1.85 1/2 T 429 50 1.2114 PVAc II 1.85 1/2 P 709 50 2.3515 VAc 1 0.935 1/3 T 500 25 0.1616 VAc 1 0.935 1/3 T 900 25 0.9517 VAc 1 1.85 1/3 T 429 25 0.1718 VAc 1 1.85 1/3 T 771 25 0.9819 VAc 1 7.48 1/3 T 477 25 0.61
Physico-chemical influences determined by the recipeThe influence of the recipe used during coagulation experiments withoutpolymerization has been studied by variation of emulsifier concentration and solidscontent, see the Figures 4.10 and 4.11, respectively. Figure 4.10 shows that theemulsifier concentration strongly affects the colloidal stability of polyvinyl acetatelatices. For increasing electrolyte concentrations, the latex with the higheremulsifier concentration is able to maintain a higher particle number, until theelectrostatic stabilization is completely lost at about CNa+ = 0.30 kmol/mw
3. As aresult of the higher surface coverage of the particles with emulsifier, the latex withthe higher emulsifier concentration exhibits initially a better colloidal stability. For
CNa+ ≥ 0.30 kmol/mw3 steric stabilization is dominant. Since the same seed-latex is
used for both experiments, the effect of the steric stabilization appears to be thesame. Consequently, the particle size and particle number become approximatelyequal for high electrolyte concentrations.
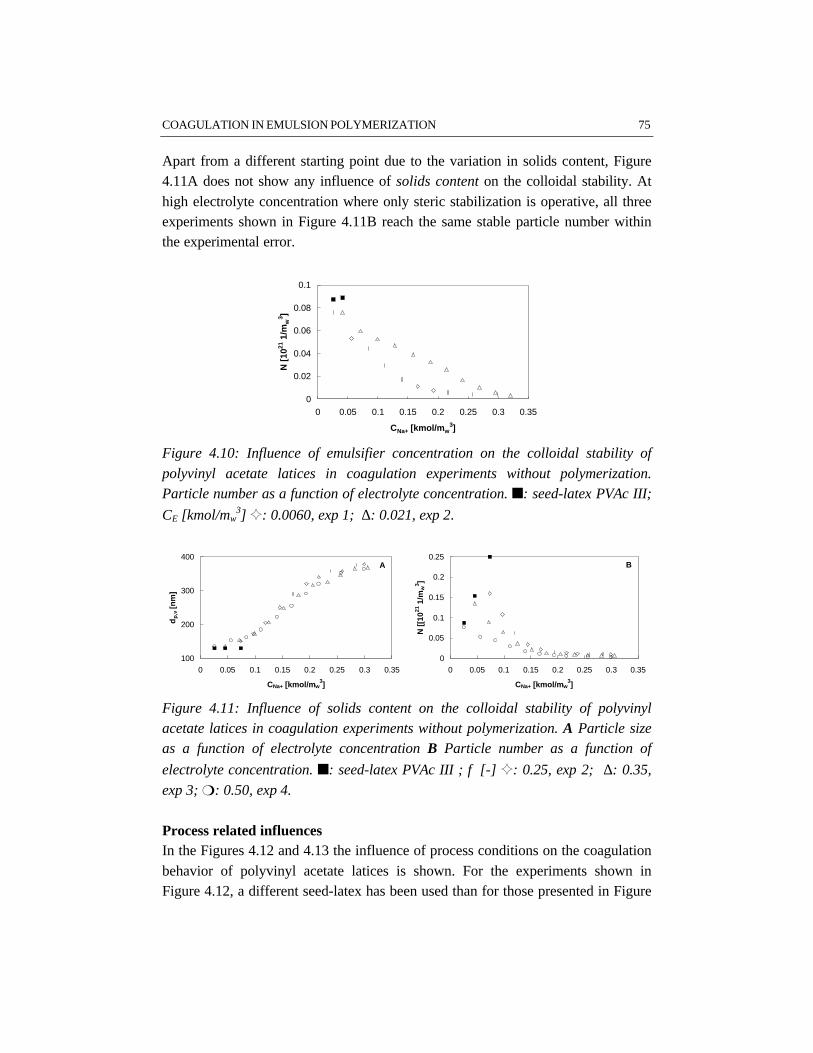
COAGULATION IN EMULSION POLYMERIZATION 75
Apart from a different starting point due to the variation in solids content, Figure4.11A does not show any influence of solids content on the colloidal stability. Athigh electrolyte concentration where only steric stabilization is operative, all threeexperiments shown in Figure 4.11B reach the same stable particle number withinthe experimental error.
0
0.02
0.04
0.06
0.08
0.1
0 0.05 0.1 0.15 0.2 0.25 0.3 0.35
CNa+ [kmol/mw3]
N [
1021
1/m
w3 ]
Figure 4.10: Influence of emulsifier concentration on the colloidal stability of
polyvinyl acetate latices in coagulation experiments without polymerization.Particle number as a function of electrolyte concentration. n: seed-latex PVAc III;
CE [kmol/mw3] G: 0.0060, exp 1; ∆: 0.021, exp 2.
100
200
300
400
0 0.05 0.1 0.15 0.2 0.25 0.3 0.35
CNa+ [kmol/mw3]
dp
,v [
nm
]
A
0
0.05
0.1
0.15
0.2
0.25
0 0.05 0.1 0.15 0.2 0.25 0.3 0.35
CNa+ [kmol/mw3]
N [
[1021
1/m
w3 ]
B
Figure 4.11: Influence of solids content on the colloidal stability of polyvinylacetate latices in coagulation experiments without polymerization. A Particle sizeas a function of electrolyte concentration B Particle number as a function of
electrolyte concentration. n: seed-latex PVAc III ; φ [-] G: 0.25, exp 2; ∆: 0.35,
exp 3; m: 0.50, exp 4.
Process related influencesIn the Figures 4.12 and 4.13 the influence of process conditions on the coagulationbehavior of polyvinyl acetate latices is shown. For the experiments shown inFigure 4.12, a different seed-latex has been used than for those presented in Figure
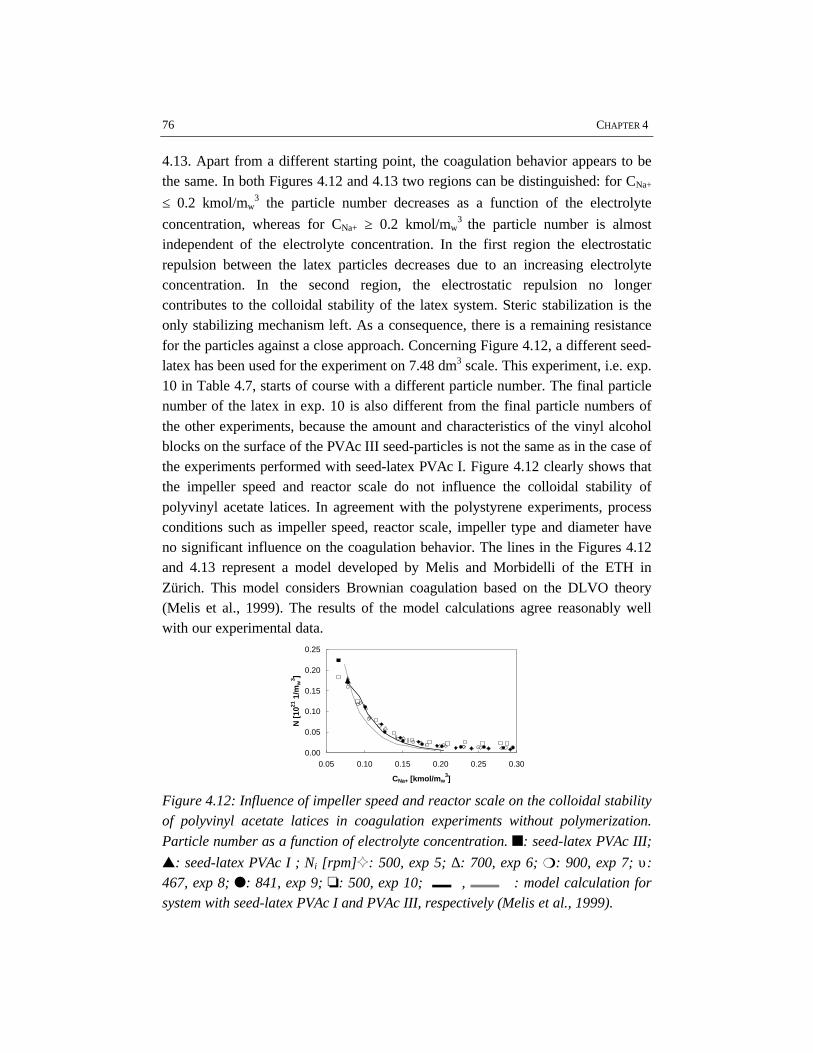
76 CHAPTER 4
4.13. Apart from a different starting point, the coagulation behavior appears to bethe same. In both Figures 4.12 and 4.13 two regions can be distinguished: for CNa+
≤ 0.2 kmol/mw3 the particle number decreases as a function of the electrolyte
concentration, whereas for CNa+ ≥ 0.2 kmol/mw3 the particle number is almost
independent of the electrolyte concentration. In the first region the electrostaticrepulsion between the latex particles decreases due to an increasing electrolyteconcentration. In the second region, the electrostatic repulsion no longercontributes to the colloidal stability of the latex system. Steric stabilization is theonly stabilizing mechanism left. As a consequence, there is a remaining resistancefor the particles against a close approach. Concerning Figure 4.12, a different seed-latex has been used for the experiment on 7.48 dm3 scale. This experiment, i.e. exp.10 in Table 4.7, starts of course with a different particle number. The final particlenumber of the latex in exp. 10 is also different from the final particle numbers ofthe other experiments, because the amount and characteristics of the vinyl alcoholblocks on the surface of the PVAc III seed-particles is not the same as in the case ofthe experiments performed with seed-latex PVAc I. Figure 4.12 clearly shows thatthe impeller speed and reactor scale do not influence the colloidal stability ofpolyvinyl acetate latices. In agreement with the polystyrene experiments, processconditions such as impeller speed, reactor scale, impeller type and diameter haveno significant influence on the coagulation behavior. The lines in the Figures 4.12and 4.13 represent a model developed by Melis and Morbidelli of the ETH inZürich. This model considers Brownian coagulation based on the DLVO theory(Melis et al., 1999). The results of the model calculations agree reasonably wellwith our experimental data.
0.00
0.05
0.10
0.15
0.20
0.25
0.05 0.10 0.15 0.20 0.25 0.30
CNa+ [kmol/mw3]
N [
1021
1/m
w3 ]
Figure 4.12: Influence of impeller speed and reactor scale on the colloidal stabilityof polyvinyl acetate latices in coagulation experiments without polymerization.
Particle number as a function of electrolyte concentration. n: seed-latex PVAc III;
s: seed-latex PVAc I ; Ni [rpm]G: 500, exp 5; ∆: 700, exp 6; m: 900, exp 7; υ:467, exp 8; l: 841, exp 9; o: 500, exp 10; , : model calculation forsystem with seed-latex PVAc I and PVAc III, respectively (Melis et al., 1999).
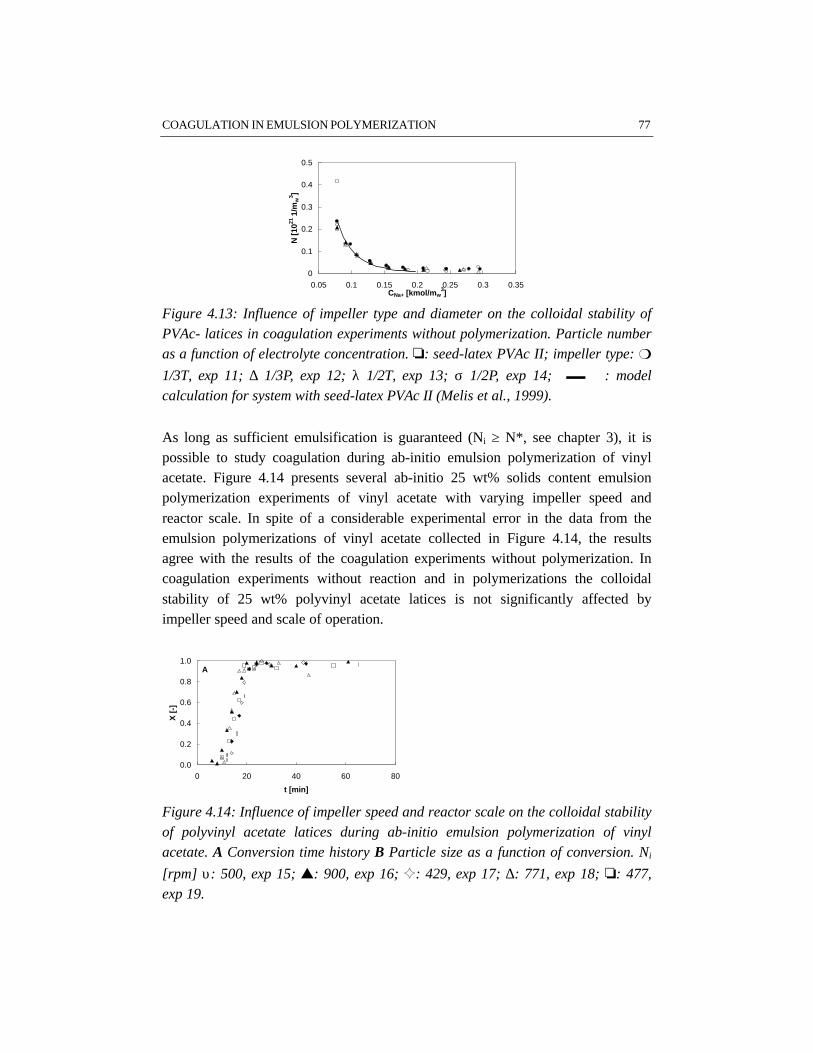
COAGULATION IN EMULSION POLYMERIZATION 77
0
0.1
0.2
0.3
0.4
0.5
0.05 0.1 0.15 0.2 0.25 0.3 0.35CNa+ [kmol/mw
3]N
[10
21 1
/mw
3 ]
Figure 4.13: Influence of impeller type and diameter on the colloidal stability ofPVAc- latices in coagulation experiments without polymerization. Particle numberas a function of electrolyte concentration. o: seed-latex PVAc II; impeller type: m
1/3T, exp 11; ∆ 1/3P, exp 12; λ 1/2T, exp 13; σ 1/2P, exp 14; : modelcalculation for system with seed-latex PVAc II (Melis et al., 1999).
As long as sufficient emulsification is guaranteed (Ni ≥ N*, see chapter 3), it ispossible to study coagulation during ab-initio emulsion polymerization of vinylacetate. Figure 4.14 presents several ab-initio 25 wt% solids content emulsionpolymerization experiments of vinyl acetate with varying impeller speed andreactor scale. In spite of a considerable experimental error in the data from theemulsion polymerizations of vinyl acetate collected in Figure 4.14, the resultsagree with the results of the coagulation experiments without polymerization. Incoagulation experiments without reaction and in polymerizations the colloidalstability of 25 wt% polyvinyl acetate latices is not significantly affected byimpeller speed and scale of operation.
0.0
0.2
0.4
0.6
0.8
1.0
0 20 40 60 80
t [min]
X [
-]
A
Figure 4.14: Influence of impeller speed and reactor scale on the colloidal stabilityof polyvinyl acetate latices during ab-initio emulsion polymerization of vinylacetate. A Conversion time history B Particle size as a function of conversion. Ni
[rpm] υ: 500, exp 15; s: 900, exp 16; G: 429, exp 17; ∆: 771, exp 18; o: 477,exp 19.
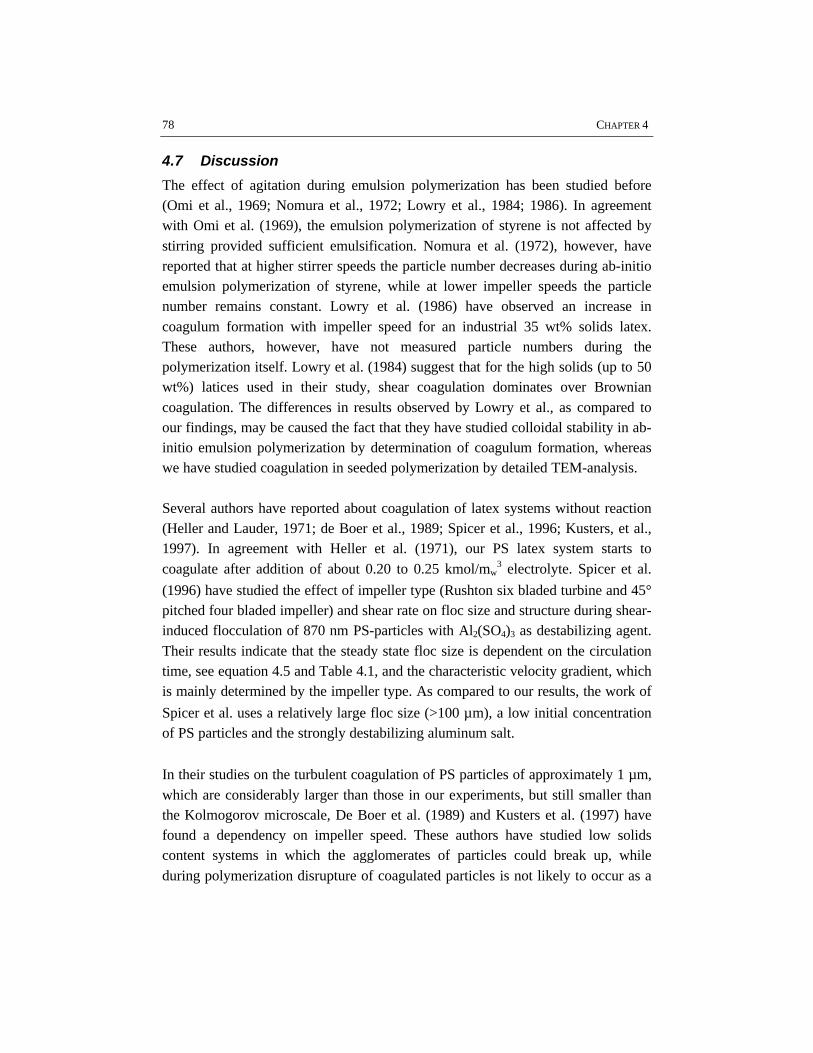
78 CHAPTER 4
4.7 Discussion
The effect of agitation during emulsion polymerization has been studied before(Omi et al., 1969; Nomura et al., 1972; Lowry et al., 1984; 1986). In agreementwith Omi et al. (1969), the emulsion polymerization of styrene is not affected bystirring provided sufficient emulsification. Nomura et al. (1972), however, havereported that at higher stirrer speeds the particle number decreases during ab-initioemulsion polymerization of styrene, while at lower impeller speeds the particlenumber remains constant. Lowry et al. (1986) have observed an increase incoagulum formation with impeller speed for an industrial 35 wt% solids latex.These authors, however, have not measured particle numbers during thepolymerization itself. Lowry et al. (1984) suggest that for the high solids (up to 50wt%) latices used in their study, shear coagulation dominates over Browniancoagulation. The differences in results observed by Lowry et al., as compared toour findings, may be caused the fact that they have studied colloidal stability in ab-initio emulsion polymerization by determination of coagulum formation, whereaswe have studied coagulation in seeded polymerization by detailed TEM-analysis.
Several authors have reported about coagulation of latex systems without reaction(Heller and Lauder, 1971; de Boer et al., 1989; Spicer et al., 1996; Kusters, et al.,1997). In agreement with Heller et al. (1971), our PS latex system starts tocoagulate after addition of about 0.20 to 0.25 kmol/mw
3 electrolyte. Spicer et al.
(1996) have studied the effect of impeller type (Rushton six bladed turbine and 45°pitched four bladed impeller) and shear rate on floc size and structure during shear-induced flocculation of 870 nm PS-particles with Al2(SO4)3 as destabilizing agent.Their results indicate that the steady state floc size is dependent on the circulationtime, see equation 4.5 and Table 4.1, and the characteristic velocity gradient, whichis mainly determined by the impeller type. As compared to our results, the work of
Spicer et al. uses a relatively large floc size (>100 µm), a low initial concentrationof PS particles and the strongly destabilizing aluminum salt.
In their studies on the turbulent coagulation of PS particles of approximately 1 µm,which are considerably larger than those in our experiments, but still smaller thanthe Kolmogorov microscale, De Boer et al. (1989) and Kusters et al. (1997) havefound a dependency on impeller speed. These authors have studied low solidscontent systems in which the agglomerates of particles could break up, whileduring polymerization disrupture of coagulated particles is not likely to occur as a
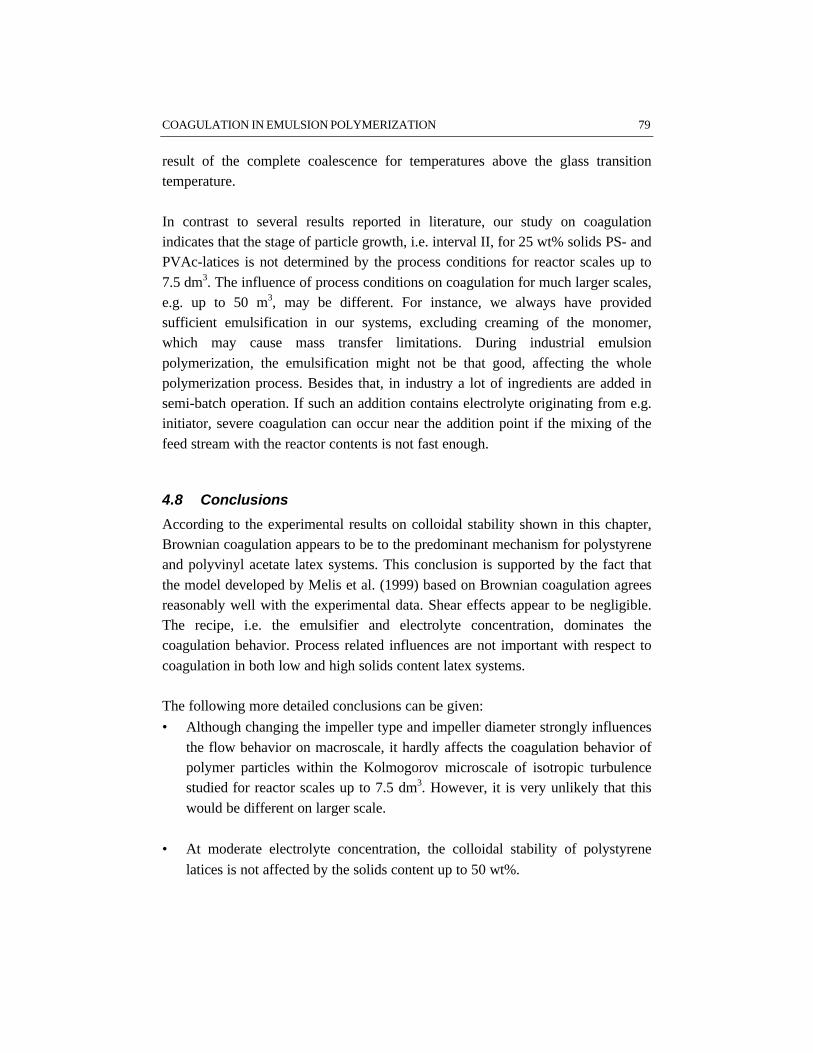
COAGULATION IN EMULSION POLYMERIZATION 79
result of the complete coalescence for temperatures above the glass transitiontemperature.
In contrast to several results reported in literature, our study on coagulationindicates that the stage of particle growth, i.e. interval II, for 25 wt% solids PS- andPVAc-latices is not determined by the process conditions for reactor scales up to7.5 dm3. The influence of process conditions on coagulation for much larger scales,e.g. up to 50 m3, may be different. For instance, we always have providedsufficient emulsification in our systems, excluding creaming of the monomer,which may cause mass transfer limitations. During industrial emulsionpolymerization, the emulsification might not be that good, affecting the wholepolymerization process. Besides that, in industry a lot of ingredients are added insemi-batch operation. If such an addition contains electrolyte originating from e.g.initiator, severe coagulation can occur near the addition point if the mixing of thefeed stream with the reactor contents is not fast enough.
4.8 Conclusions
According to the experimental results on colloidal stability shown in this chapter,Brownian coagulation appears to be to the predominant mechanism for polystyreneand polyvinyl acetate latex systems. This conclusion is supported by the fact thatthe model developed by Melis et al. (1999) based on Brownian coagulation agreesreasonably well with the experimental data. Shear effects appear to be negligible.The recipe, i.e. the emulsifier and electrolyte concentration, dominates thecoagulation behavior. Process related influences are not important with respect tocoagulation in both low and high solids content latex systems.
The following more detailed conclusions can be given:
• Although changing the impeller type and impeller diameter strongly influencesthe flow behavior on macroscale, it hardly affects the coagulation behavior ofpolymer particles within the Kolmogorov microscale of isotropic turbulencestudied for reactor scales up to 7.5 dm3. However, it is very unlikely that thiswould be different on larger scale.
• At moderate electrolyte concentration, the colloidal stability of polystyrene
latices is not affected by the solids content up to 50 wt%.
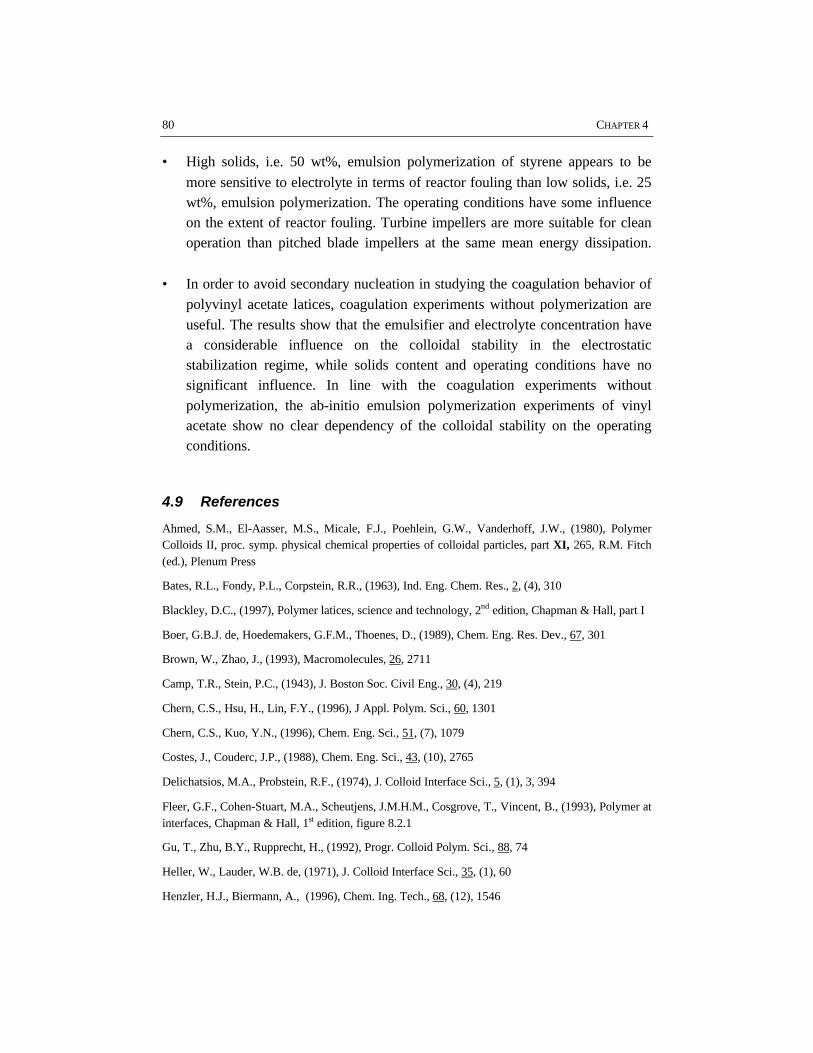
80 CHAPTER 4
• High solids, i.e. 50 wt%, emulsion polymerization of styrene appears to be
more sensitive to electrolyte in terms of reactor fouling than low solids, i.e. 25wt%, emulsion polymerization. The operating conditions have some influenceon the extent of reactor fouling. Turbine impellers are more suitable for cleanoperation than pitched blade impellers at the same mean energy dissipation.
• In order to avoid secondary nucleation in studying the coagulation behavior ofpolyvinyl acetate latices, coagulation experiments without polymerization areuseful. The results show that the emulsifier and electrolyte concentration havea considerable influence on the colloidal stability in the electrostaticstabilization regime, while solids content and operating conditions have nosignificant influence. In line with the coagulation experiments withoutpolymerization, the ab-initio emulsion polymerization experiments of vinylacetate show no clear dependency of the colloidal stability on the operatingconditions.
4.9 References
Ahmed, S.M., El-Aasser, M.S., Micale, F.J., Poehlein, G.W., Vanderhoff, J.W., (1980), PolymerColloids II, proc. symp. physical chemical properties of colloidal particles, part XI, 265, R.M. Fitch(ed.), Plenum Press
Bates, R.L., Fondy, P.L., Corpstein, R.R., (1963), Ind. Eng. Chem. Res., 2, (4), 310
Blackley, D.C., (1997), Polymer latices, science and technology, 2nd edition, Chapman & Hall, part I
Boer, G.B.J. de, Hoedemakers, G.F.M., Thoenes, D., (1989), Chem. Eng. Res. Dev., 67, 301
Brown, W., Zhao, J., (1993), Macromolecules, 26, 2711
Camp, T.R., Stein, P.C., (1943), J. Boston Soc. Civil Eng., 30, (4), 219
Chern, C.S., Hsu, H., Lin, F.Y., (1996), J Appl. Polym. Sci., 60, 1301
Chern, C.S., Kuo, Y.N., (1996), Chem. Eng. Sci., 51, (7), 1079
Costes, J., Couderc, J.P., (1988), Chem. Eng. Sci., 43, (10), 2765
Delichatsios, M.A., Probstein, R.F., (1974), J. Colloid Interface Sci., 5, (1), 3, 394
Fleer, G.F., Cohen-Stuart, M.A., Scheutjens, J.M.H.M., Cosgrove, T., Vincent, B., (1993), Polymer atinterfaces, Chapman & Hall, 1st edition, figure 8.2.1
Gu, T., Zhu, B.Y., Rupprecht, H., (1992), Progr. Colloid Polym. Sci., 88, 74
Heller, W., Lauder, W.B. de, (1971), J. Colloid Interface Sci., 35, (1), 60
Henzler, H.J., Biermann, A., (1996), Chem. Ing. Tech., 68, (12), 1546
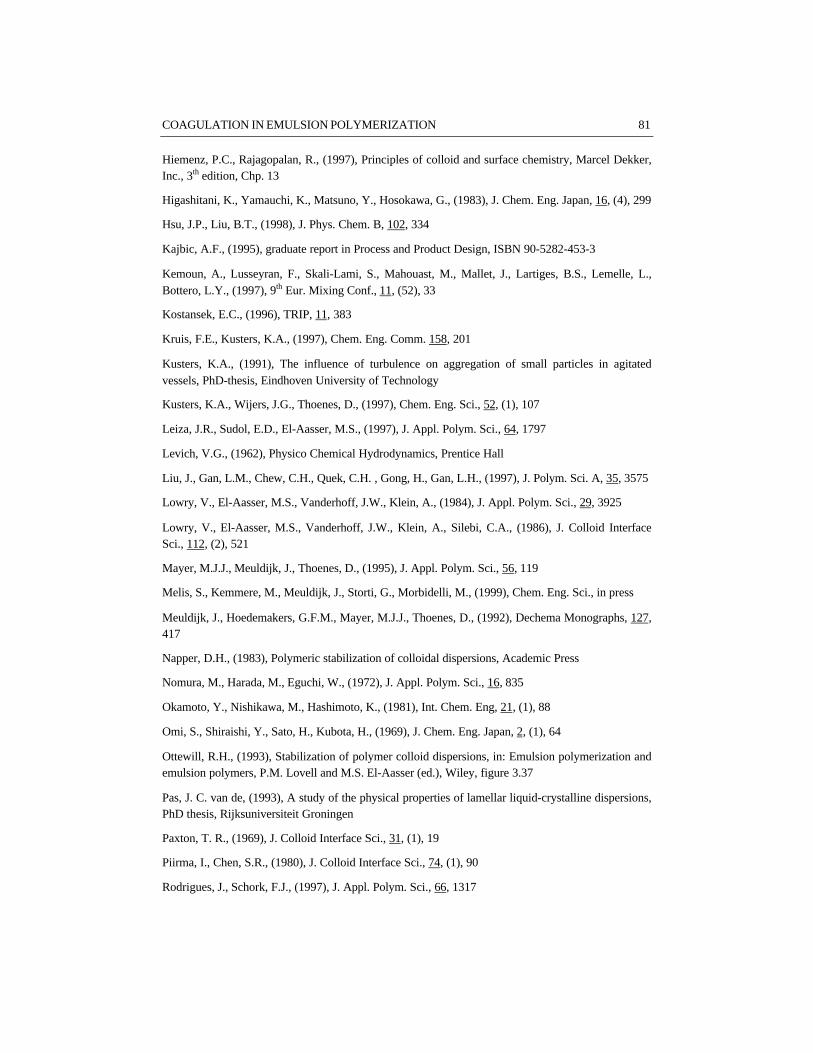
COAGULATION IN EMULSION POLYMERIZATION 81
Hiemenz, P.C., Rajagopalan, R., (1997), Principles of colloid and surface chemistry, Marcel Dekker,Inc., 3th edition, Chp. 13
Higashitani, K., Yamauchi, K., Matsuno, Y., Hosokawa, G., (1983), J. Chem. Eng. Japan, 16, (4), 299
Hsu, J.P., Liu, B.T., (1998), J. Phys. Chem. B, 102, 334
Kajbic, A.F., (1995), graduate report in Process and Product Design, ISBN 90-5282-453-3
Kemoun, A., Lusseyran, F., Skali-Lami, S., Mahouast, M., Mallet, J., Lartiges, B.S., Lemelle, L.,Bottero, L.Y., (1997), 9th Eur. Mixing Conf., 11, (52), 33
Kostansek, E.C., (1996), TRIP, 11, 383
Kruis, F.E., Kusters, K.A., (1997), Chem. Eng. Comm. 158, 201
Kusters, K.A., (1991), The influence of turbulence on aggregation of small particles in agitatedvessels, PhD-thesis, Eindhoven University of Technology
Kusters, K.A., Wijers, J.G., Thoenes, D., (1997), Chem. Eng. Sci., 52, (1), 107
Leiza, J.R., Sudol, E.D., El-Aasser, M.S., (1997), J. Appl. Polym. Sci., 64, 1797
Levich, V.G., (1962), Physico Chemical Hydrodynamics, Prentice Hall
Liu, J., Gan, L.M., Chew, C.H., Quek, C.H. , Gong, H., Gan, L.H., (1997), J. Polym. Sci. A, 35, 3575
Lowry, V., El-Aasser, M.S., Vanderhoff, J.W., Klein, A., (1984), J. Appl. Polym. Sci., 29, 3925
Lowry, V., El-Aasser, M.S., Vanderhoff, J.W., Klein, A., Silebi, C.A., (1986), J. Colloid InterfaceSci., 112, (2), 521
Mayer, M.J.J., Meuldijk, J., Thoenes, D., (1995), J. Appl. Polym. Sci., 56, 119
Melis, S., Kemmere, M., Meuldijk, J., Storti, G., Morbidelli, M., (1999), Chem. Eng. Sci., in press
Meuldijk, J., Hoedemakers, G.F.M., Mayer, M.J.J., Thoenes, D., (1992), Dechema Monographs, 127,417
Napper, D.H., (1983), Polymeric stabilization of colloidal dispersions, Academic Press
Nomura, M., Harada, M., Eguchi, W., (1972), J. Appl. Polym. Sci., 16, 835
Okamoto, Y., Nishikawa, M., Hashimoto, K., (1981), Int. Chem. Eng, 21, (1), 88
Omi, S., Shiraishi, Y., Sato, H., Kubota, H., (1969), J. Chem. Eng. Japan, 2, (1), 64
Ottewill, R.H., (1993), Stabilization of polymer colloid dispersions, in: Emulsion polymerization andemulsion polymers, P.M. Lovell and M.S. El-Aasser (ed.), Wiley, figure 3.37
Pas, J. C. van de, (1993), A study of the physical properties of lamellar liquid-crystalline dispersions,PhD thesis, Rijksuniversiteit Groningen
Paxton, T. R., (1969), J. Colloid Interface Sci., 31, (1), 19
Piirma, I., Chen, S.R., (1980), J. Colloid Interface Sci., 74, (1), 90
Rodrigues, J., Schork, F.J., (1997), J. Appl. Polym. Sci., 66, 1317
82 CHAPTER 4
Romero-Cano, M.S., Martin-Rodriguez, A., Chauveteau, G., Nievas, F.J. de las, (1998), J. ColloidInterface Sci., 198, 273
Rushton, J.H., Costich, E.W., Everett, H.J., (1950), Chem. Eng. Progress, 46, (467), 9
Russel, W.B., Saville, D.A., Schowalter, W.R., (1989), Colloidal dispersions, Cambridge UniversityPress
Saffman, P.G., Turner, J.S., (1956), J. Fluid Mech., 1, 16
Schoenmakers, J.H.A., Wijers, J.G., Thoenes, D., in preparation
SenGupta, A.K., Papadopoulos, K.D., (1998), J. Colloid Interface Sci., 203, 345
Sjöblom, J., (1996), Emulsions and emulsion stability, Marcel Dekker, inc., Chp 2
Smoluchowski, M von, (1917), Z. Phys. Chem., 92, 129
Spicer, P.T., Keller, W., Pratsinis, S.E., (1996), J. Colloid Interface Sci., 184, 112
Thoenes, D., (1994), Chemical Reactor Development, from laboratory to industrial production,Kluwer Academic Publishers
Vanderhoff, J.W., (1981), The Formation of Coagulum in Emulsion Polymerization, in: EmulsionPolymers and Emulsion Polymerization, D.R. Bassett and A.E. Hamielec (ed.), ACS Symp. Ser., 165,(11), 199
Vasilenko, A.I., Zuikov, A.V., Eliseeva, V.I., (1983), Kolloidn. Zh., 45, (5), 858
Ven, T.G.M. van de, (1998), Colloids Surf. A, 138, 207
Verezhikov, V.N., Kashlinskaya, P.E., Lozhkina, S.A., (1993), Kolloidn. Zh., 55, (5), 194
Vijayendran, B.R., (1979), J. Appl. Polym. Sci., 23, 733
Vijayendran, B.R., (1980), in Polymer Colloids II, R.M. Fitch (ed.), Plenum, 209
Walker, H.W., Grant, S.B., (1998), Colloids Surf. A, 135, 123
Wu, H., Patterson, G.K., (1989), Chem Eng. Sci., 44, (10), 2207
Yeliskeyeva, V.I., Petrova, S.A., Zuikov, Z.A., (1973), J. Polym. Sci., symp. 42, 63
Zhu, B.Y., Gu, T., (1991), Adv. Colloid Interface Sci., 37, 1,
Zuikov, A.V., Vasilenko, A.I., (1975), Kolloidn. Zh., 37, (4), 640
RHEOLOGY AND FLOW IN HIGH SOLIDS EMULSION POLYMERIZATION 83
5 RHEOLOGY AND FLOW IN HIGH SOLIDS
EMULSION POLYMERIZATION
AbstractCommercial emulsion polymerization processes are often carried out with highsolids recipes (50 percent monomer by weight), resulting in relatively viscous,pseudo-plastic reaction mixtures. Upon reaction, the increasing volume fraction ofmonomer swollen polymer particles causes an increase in viscosity. At the sametime the rheology changes from Newtonian into pseudo-plastic behavior, whichresults from the orientation of the polymer particles in the flow. The change inrheological behavior during high solids emulsion polymerization potentiallycomplicates the process operation in terms of imperfect mixing and reactor fouling.This chapter discusses the rheological properties and flow during high solidsemulsion polymerization of styrene. The particle size distribution stronglyinfluences the rheology and consequently the course of the reaction.
This chapter has been published as M.F. Kemmere, J. Meuldijk, A.A.H. Drinkenburg, and A.L.German, ‘Rheology and flow during high solids emulsion polymerization’ Polym. React. Eng,(1998), 6, (3&4), 243
84 CHAPTER 5
5.1 Introduction
Industrial emulsion polymerization is usually performed with high solids recipes.One of the advantages of producing high solids latices is that for latex applicationsthere is little or no need to remove water after production (Leiza et al., 1997). Thedifference between high and low solids polymerization is caused by the higherfinal solids content (50 wt% versus e.g. 25 wt% of polymer) as well as a strongerincrease in solids content during ab-initio emulsion polymerization. In contrastwith low solids emulsion polymerization, the apparent viscosity of the reactionmixture increases significantly during high solids emulsion polymerization,resulting in a viscous pseudo-plastic reaction medium. The change in rheologicalbehavior during high solids emulsion polymerization complicates the processoperation in terms of imperfect mixing and reactor fouling.
5.2 Rheology
For the purpose of describing the rheological behavior of a high solids emulsionpolymerization, the reaction process can conveniently be divided into two stages:interval I and the intervals II and III taken together.
5.2.1 Interval I
At the beginning of the polymerization the monomer is mainly present in droplets,dispersed in the continuous aqueous phase. Typical size of the monomer droplets is
about 5 µm (Gilbert, 1995). The droplet size can be controlled by adjusting theenergy dissipated into the vessel as well as by adjusting the interfacial tension(emulsifier concentration). The droplets break up easily and coalesce. A pseudosteady state is reached for equal rates of break-up and coalescence (Skelland andKanel, 1990), see chapter 3. Since the flow is disturbed by the monomer droplets,the viscosity of the emulsion will be somewhat higher than that of any of theseparate components (Macosko, 1994).
During interval I the monomer droplets dominate the rheological behavior, becausethe volume fraction of the polymer phase is still low. At the end of the nucleationperiod the reaction mixture still exhibits Newtonian rheological behavior and theviscosity has not changed from the initial situation.
RHEOLOGY AND FLOW IN HIGH SOLIDS EMULSION POLYMERIZATION 85
5.2.2 Intervals II and III
After the particle nucleation during interval I, the polymerization takes place in themonomer swollen polymer particles at the expense of the monomer droplets. Thenthe small polymer particles (order of magnitude of 100 nm) start to govern therheological behavior of the reaction mixture. The viscosity increases withincreasing volume fraction of the polymer particles. In interval III the particlevolume fraction decreases slightly due to shrinkage of the monomer swollenparticles, since the polymer has a higher density than the monomer. Figure 5.1shows the particle volume fraction as a function of conversion. The volume ofmonomer swollen polymer particles in intervals II and III can be calculated byequations 5.1 and 5.2, respectively.
( )
−+=
mm
m
pmonIIp MXV
ρφφ
ρ 1
1, (5.1)
−+=
mpmonIIIp
XXMV
ρρ1
, (5.2)
The mass fraction of monomer in the polymer particles, φm, can be determinedfrom the conversion at which the monomer droplets disappear (Xm), assumingthermodynamic equilibrium between the different phases involved. Thisassumption is valid, since mass transfer rates are very much higher than reactionrates. In the case of styrene emulsion polymerization Xm equals 0.43 (Harada et al.,
1972) and consequently φm equals 0.57. The real changeover from interval II to IIIis more gradual than suggested by Figure 5.1. The discontinuity in Figure 5.1 iscaused by the switch in calculation from equation 5.1 to equation 5.2 at aconversion of 0.43.
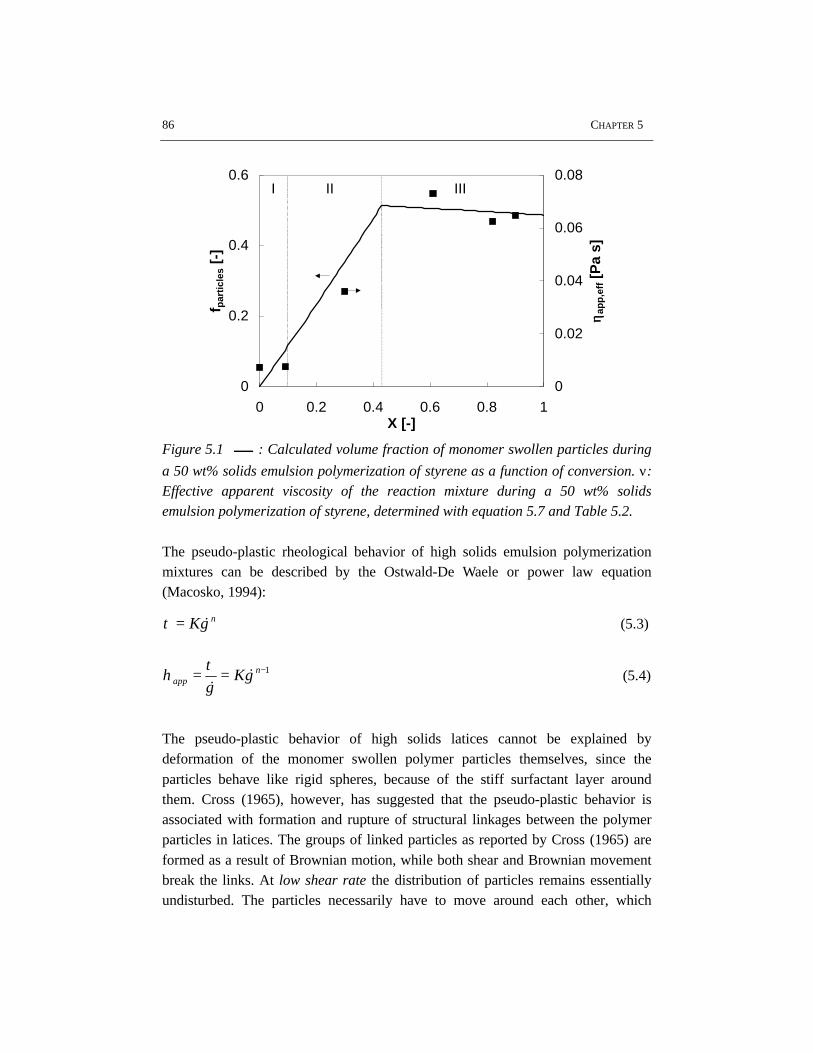
86 CHAPTER 5
0
0.2
0.4
0.6
0 0.2 0.4 0.6 0.8 1X [-]
f par
ticl
es [
-]
0
0.02
0.04
0.06
0.08
ηη ap
p,e
ff [
Pa
s]
I II III
Figure 5.1 : Calculated volume fraction of monomer swollen particles during
a 50 wt% solids emulsion polymerization of styrene as a function of conversion. ν:Effective apparent viscosity of the reaction mixture during a 50 wt% solidsemulsion polymerization of styrene, determined with equation 5.7 and Table 5.2.
The pseudo-plastic rheological behavior of high solids emulsion polymerizationmixtures can be described by the Ostwald-De Waele or power law equation(Macosko, 1994):
nKγτ &= (5.3)
1−== napp Kγ
γτ
η &&
(5.4)
The pseudo-plastic behavior of high solids latices cannot be explained bydeformation of the monomer swollen polymer particles themselves, since theparticles behave like rigid spheres, because of the stiff surfactant layer aroundthem. Cross (1965), however, has suggested that the pseudo-plastic behavior isassociated with formation and rupture of structural linkages between the polymerparticles in latices. The groups of linked particles as reported by Cross (1965) areformed as a result of Brownian motion, while both shear and Brownian movementbreak the links. At low shear rate the distribution of particles remains essentiallyundisturbed. The particles necessarily have to move around each other, which
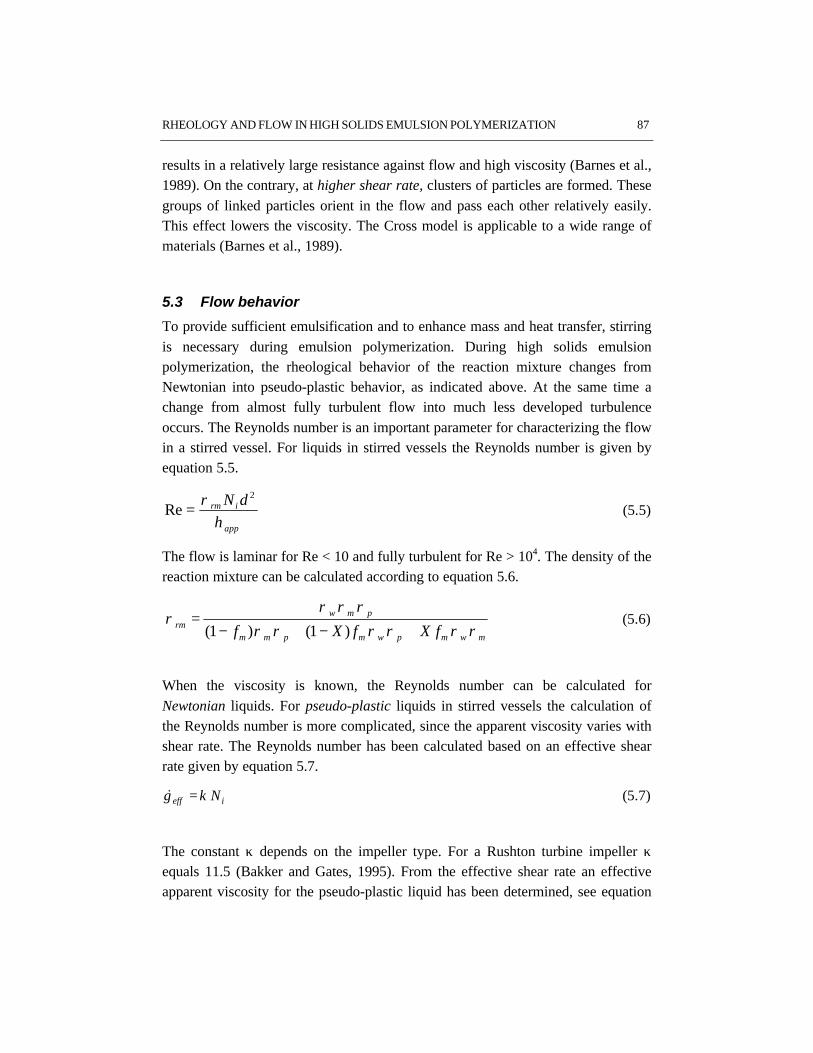
RHEOLOGY AND FLOW IN HIGH SOLIDS EMULSION POLYMERIZATION 87
results in a relatively large resistance against flow and high viscosity (Barnes et al.,1989). On the contrary, at higher shear rate, clusters of particles are formed. Thesegroups of linked particles orient in the flow and pass each other relatively easily.This effect lowers the viscosity. The Cross model is applicable to a wide range ofmaterials (Barnes et al., 1989).
5.3 Flow behavior
To provide sufficient emulsification and to enhance mass and heat transfer, stirringis necessary during emulsion polymerization. During high solids emulsionpolymerization, the rheological behavior of the reaction mixture changes fromNewtonian into pseudo-plastic behavior, as indicated above. At the same time achange from almost fully turbulent flow into much less developed turbulenceoccurs. The Reynolds number is an important parameter for characterizing the flowin a stirred vessel. For liquids in stirred vessels the Reynolds number is given byequation 5.5.
app
irm dN
ηρ 2
Re = (5.5)
The flow is laminar for Re < 10 and fully turbulent for Re > 104. The density of thereaction mixture can be calculated according to equation 5.6.
mwmpwmpmm
pmwrm fXfXf ρρρρρρ
ρρρρ
+−+−=
)1()1( (5.6)
When the viscosity is known, the Reynolds number can be calculated forNewtonian liquids. For pseudo-plastic liquids in stirred vessels the calculation ofthe Reynolds number is more complicated, since the apparent viscosity varies withshear rate. The Reynolds number has been calculated based on an effective shearrate given by equation 5.7.
ieff Nκγ =& (5.7)
The constant κ depends on the impeller type. For a Rushton turbine impeller κequals 11.5 (Bakker and Gates, 1995). From the effective shear rate an effectiveapparent viscosity for the pseudo-plastic liquid has been determined, see equation
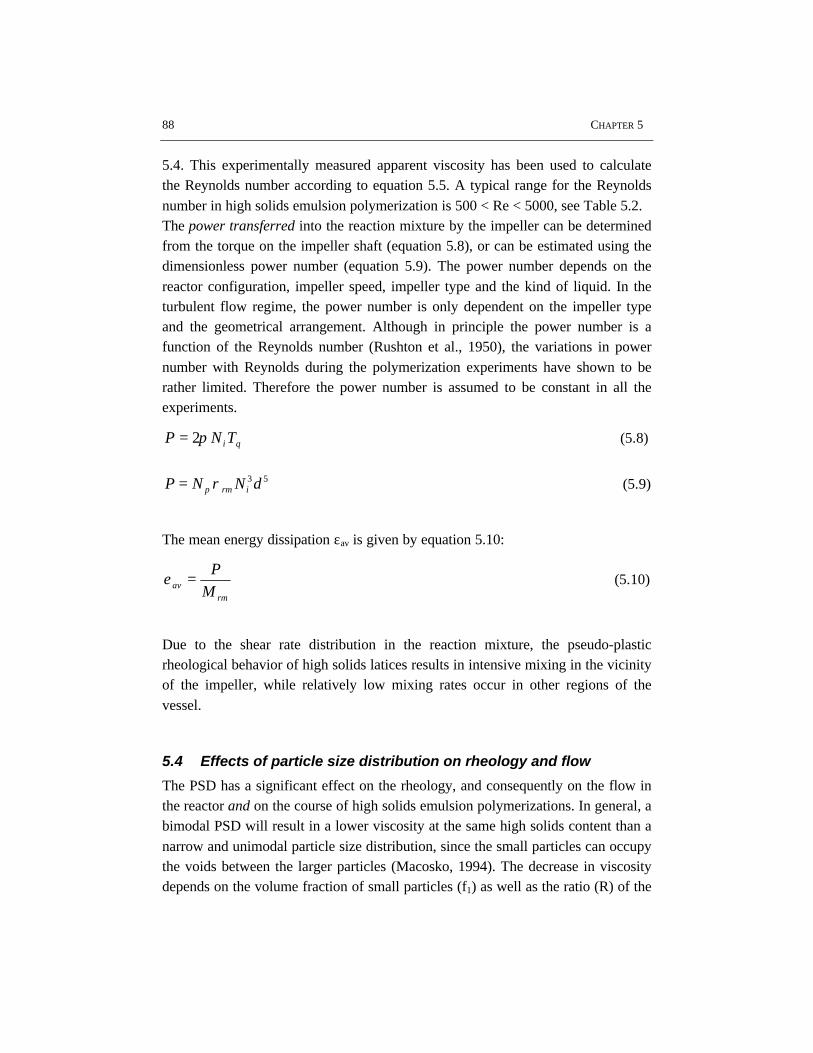
88 CHAPTER 5
5.4. This experimentally measured apparent viscosity has been used to calculatethe Reynolds number according to equation 5.5. A typical range for the Reynoldsnumber in high solids emulsion polymerization is 500 < Re < 5000, see Table 5.2.The power transferred into the reaction mixture by the impeller can be determinedfrom the torque on the impeller shaft (equation 5.8), or can be estimated using thedimensionless power number (equation 5.9). The power number depends on thereactor configuration, impeller speed, impeller type and the kind of liquid. In theturbulent flow regime, the power number is only dependent on the impeller typeand the geometrical arrangement. Although in principle the power number is afunction of the Reynolds number (Rushton et al., 1950), the variations in powernumber with Reynolds during the polymerization experiments have shown to berather limited. Therefore the power number is assumed to be constant in all theexperiments.
qi TNP π2= (5.8)
53dNNP irmp ρ= (5.9)
The mean energy dissipation εav is given by equation 5.10:
rmav M
P=ε (5.10)
Due to the shear rate distribution in the reaction mixture, the pseudo-plasticrheological behavior of high solids latices results in intensive mixing in the vicinityof the impeller, while relatively low mixing rates occur in other regions of thevessel.
5.4 Effects of particle size distribution on rheology and flow
The PSD has a significant effect on the rheology, and consequently on the flow inthe reactor and on the course of high solids emulsion polymerizations. In general, abimodal PSD will result in a lower viscosity at the same high solids content than anarrow and unimodal particle size distribution, since the small particles can occupythe voids between the larger particles (Macosko, 1994). The decrease in viscositydepends on the volume fraction of small particles (f1) as well as the ratio (R) of the
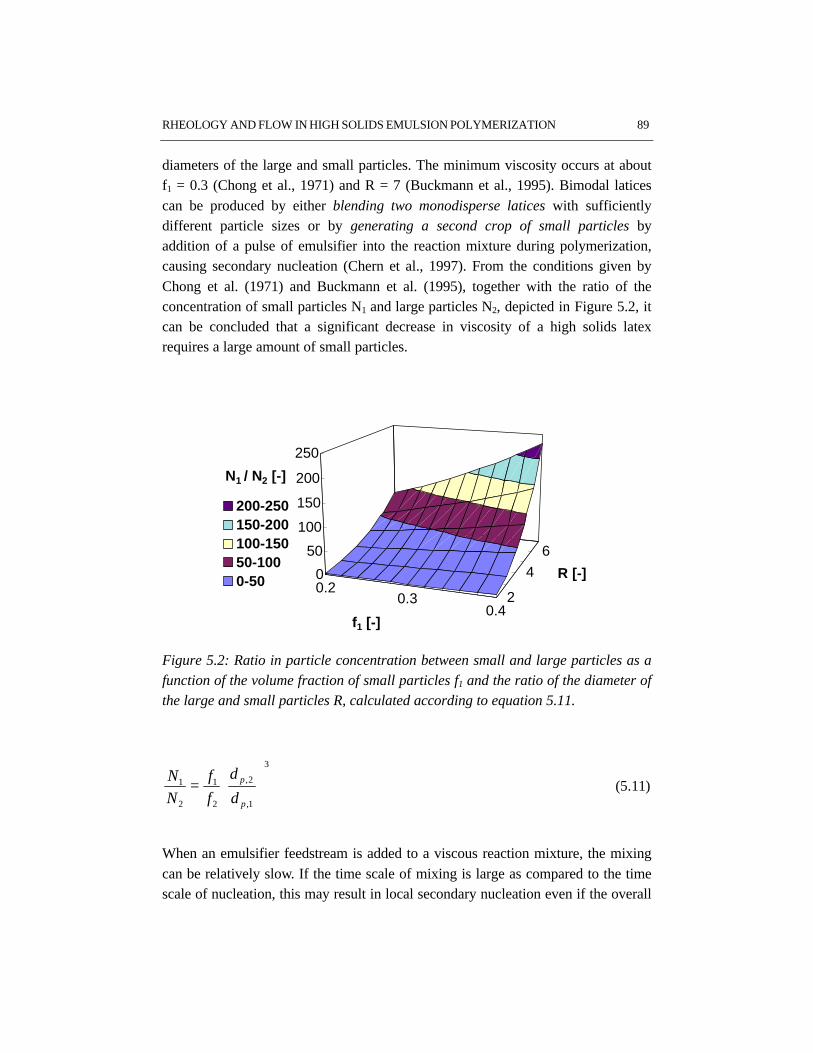
RHEOLOGY AND FLOW IN HIGH SOLIDS EMULSION POLYMERIZATION 89
diameters of the large and small particles. The minimum viscosity occurs at aboutf1 = 0.3 (Chong et al., 1971) and R = 7 (Buckmann et al., 1995). Bimodal laticescan be produced by either blending two monodisperse latices with sufficientlydifferent particle sizes or by generating a second crop of small particles byaddition of a pulse of emulsifier into the reaction mixture during polymerization,causing secondary nucleation (Chern et al., 1997). From the conditions given byChong et al. (1971) and Buckmann et al. (1995), together with the ratio of theconcentration of small particles N1 and large particles N2, depicted in Figure 5.2, itcan be concluded that a significant decrease in viscosity of a high solids latexrequires a large amount of small particles.
0.20.3
0.42
4
6
0
50
100
150
200
250
N1 / N2 [-]
f1 [-]
R [-]
200-250150-200100-15050-1000-50
Figure 5.2: Ratio in particle concentration between small and large particles as afunction of the volume fraction of small particles f1 and the ratio of the diameter ofthe large and small particles R, calculated according to equation 5.11.
3
1,
2,
2
1
2
1
=
p
p
d
d
f
f
N
N (5.11)
When an emulsifier feedstream is added to a viscous reaction mixture, the mixingcan be relatively slow. If the time scale of mixing is large as compared to the timescale of nucleation, this may result in local secondary nucleation even if the overall
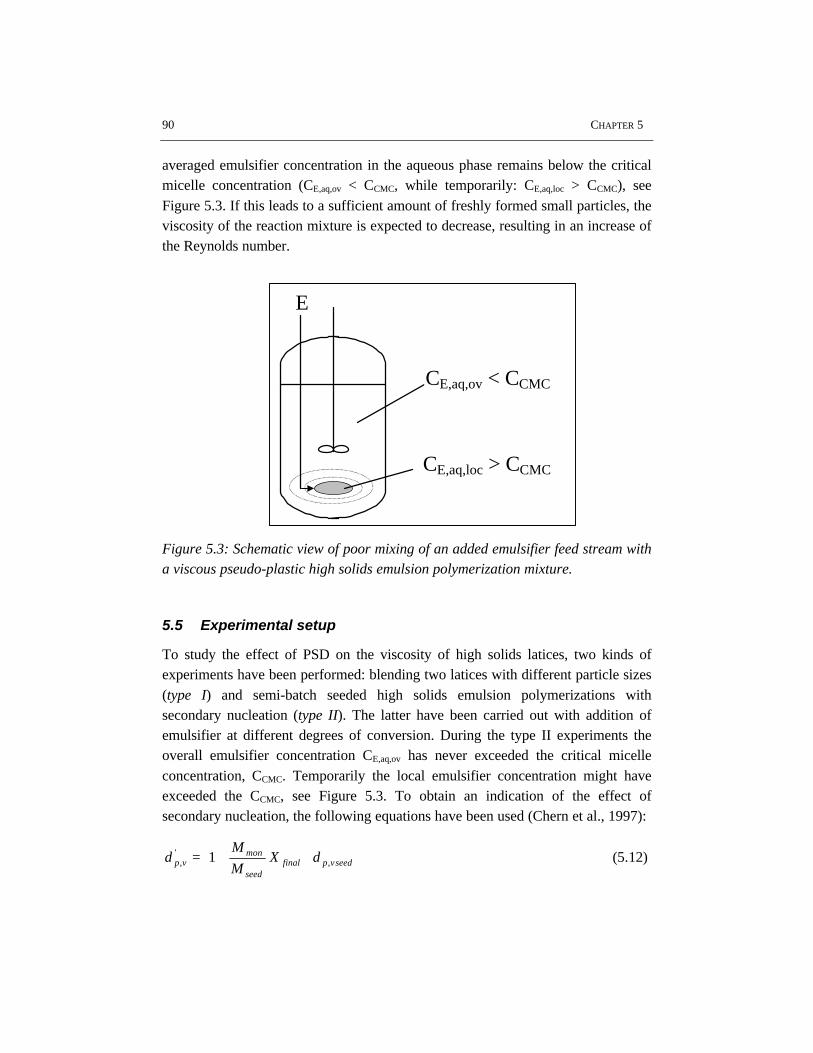
90 CHAPTER 5
averaged emulsifier concentration in the aqueous phase remains below the criticalmicelle concentration (CE,aq,ov < CCMC, while temporarily: CE,aq,loc > CCMC), seeFigure 5.3. If this leads to a sufficient amount of freshly formed small particles, theviscosity of the reaction mixture is expected to decrease, resulting in an increase ofthe Reynolds number.
Figure 5.3: Schematic view of poor mixing of an added emulsifier feed stream witha viscous pseudo-plastic high solids emulsion polymerization mixture.
5.5 Experimental setup
To study the effect of PSD on the viscosity of high solids latices, two kinds ofexperiments have been performed: blending two latices with different particle sizes(type I) and semi-batch seeded high solids emulsion polymerizations withsecondary nucleation (type II). The latter have been carried out with addition ofemulsifier at different degrees of conversion. During the type II experiments theoverall emulsifier concentration CE,aq,ov has never exceeded the critical micelleconcentration, CCMC. Temporarily the local emulsifier concentration might haveexceeded the CCMC, see Figure 5.3. To obtain an indication of the effect ofsecondary nucleation, the following equations have been used (Chern et al., 1997):
seedvpfinalseed
monvp dX
M
Md ,
', 1
+= (5.12)
CE,aq,ov < CCMC
CE,aq,loc > CCMC
E
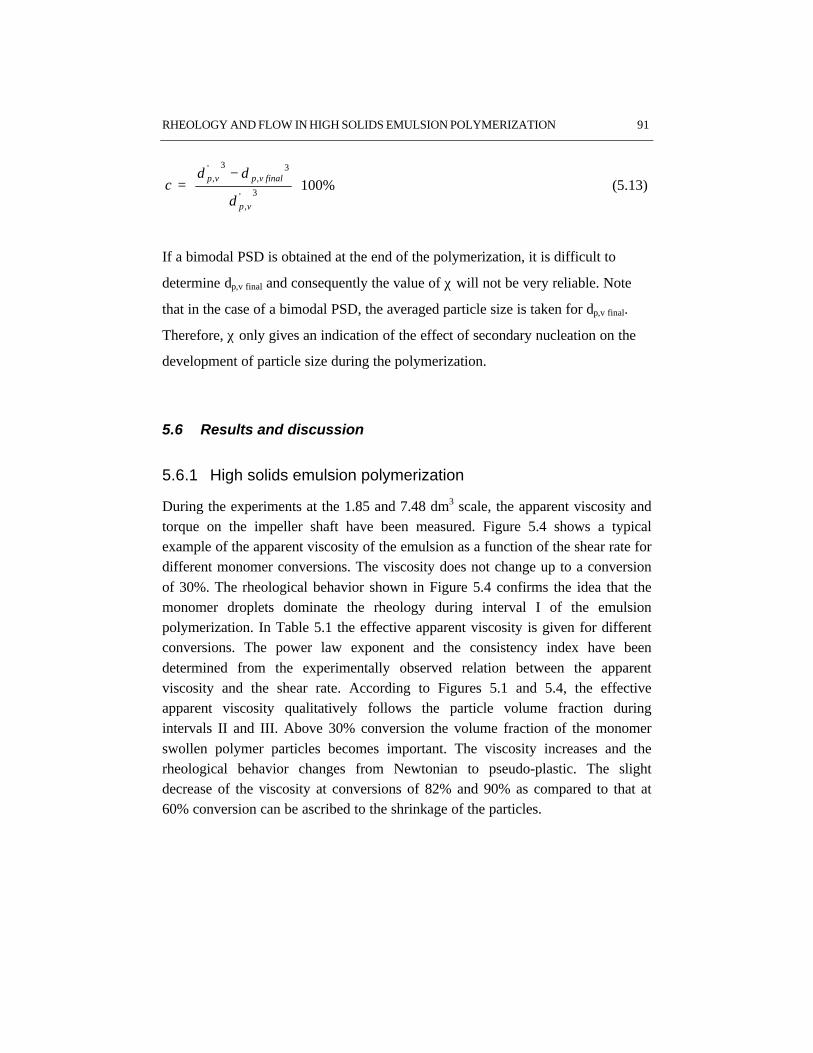
RHEOLOGY AND FLOW IN HIGH SOLIDS EMULSION POLYMERIZATION 91
%1003'
,
3,
3',
−=
vp
finalvpvp
d
ddχ (5.13)
If a bimodal PSD is obtained at the end of the polymerization, it is difficult to
determine dp,v final and consequently the value of χ will not be very reliable. Note
that in the case of a bimodal PSD, the averaged particle size is taken for dp,v final.
Therefore, χ only gives an indication of the effect of secondary nucleation on the
development of particle size during the polymerization.
5.6 Results and discussion
5.6.1 High solids emulsion polymerization
During the experiments at the 1.85 and 7.48 dm3 scale, the apparent viscosity andtorque on the impeller shaft have been measured. Figure 5.4 shows a typicalexample of the apparent viscosity of the emulsion as a function of the shear rate fordifferent monomer conversions. The viscosity does not change up to a conversionof 30%. The rheological behavior shown in Figure 5.4 confirms the idea that themonomer droplets dominate the rheology during interval I of the emulsionpolymerization. In Table 5.1 the effective apparent viscosity is given for differentconversions. The power law exponent and the consistency index have beendetermined from the experimentally observed relation between the apparentviscosity and the shear rate. According to Figures 5.1 and 5.4, the effectiveapparent viscosity qualitatively follows the particle volume fraction duringintervals II and III. Above 30% conversion the volume fraction of the monomerswollen polymer particles becomes important. The viscosity increases and therheological behavior changes from Newtonian to pseudo-plastic. The slightdecrease of the viscosity at conversions of 82% and 90% as compared to that at60% conversion can be ascribed to the shrinkage of the particles.
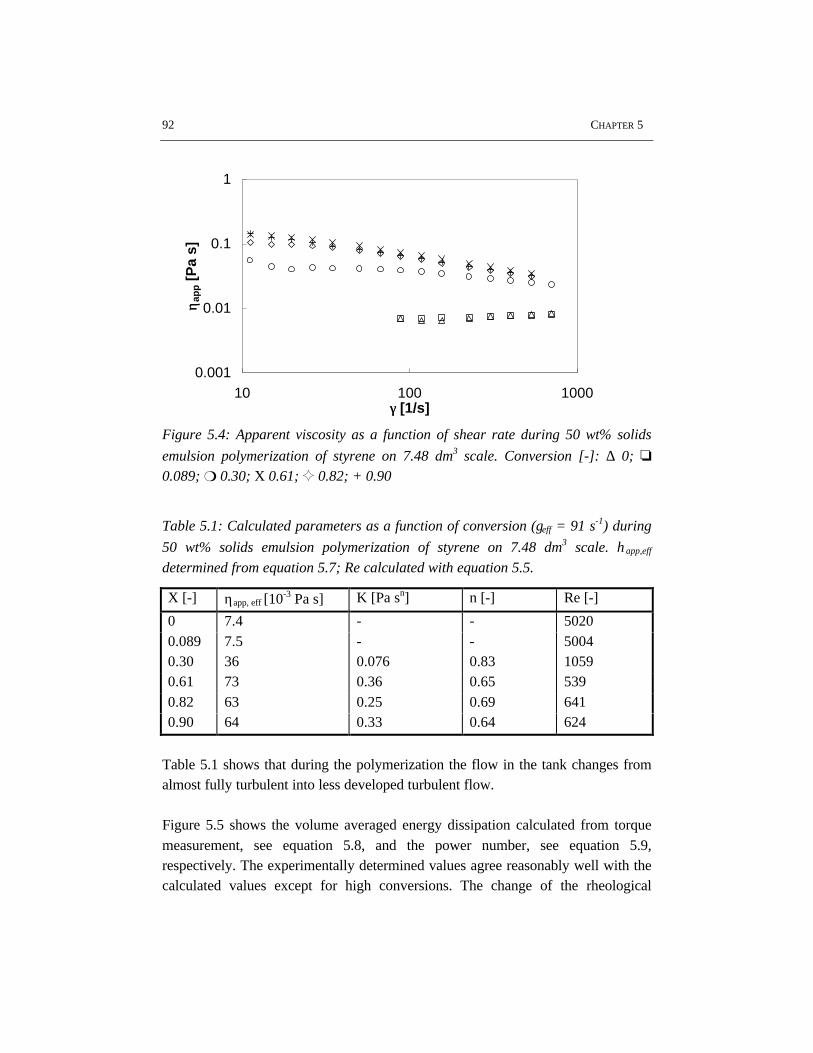
92 CHAPTER 5
0.001
0.01
0.1
1
10 100 1000γγ [1/s]
ηη ap
p [
Pa
s]
Figure 5.4: Apparent viscosity as a function of shear rate during 50 wt% solids
emulsion polymerization of styrene on 7.48 dm3 scale. Conversion [-]: ∆ 0; o
0.089; m 0.30; X 0.61; G 0.82; + 0.90
Table 5.1: Calculated parameters as a function of conversion (γeff = 91 s-1) during
50 wt% solids emulsion polymerization of styrene on 7.48 dm3 scale. ηapp,eff
determined from equation 5.7; Re calculated with equation 5.5.
X [-] ηapp, eff [10-3 Pa s] K [Pa sn] n [-] Re [-]
0 7.4 - - 50200.089 7.5 - - 50040.30 36 0.076 0.83 10590.61 73 0.36 0.65 5390.82 63 0.25 0.69 6410.90 64 0.33 0.64 624
Table 5.1 shows that during the polymerization the flow in the tank changes fromalmost fully turbulent into less developed turbulent flow.
Figure 5.5 shows the volume averaged energy dissipation calculated from torquemeasurement, see equation 5.8, and the power number, see equation 5.9,respectively. The experimentally determined values agree reasonably well with thecalculated values except for high conversions. The change of the rheological
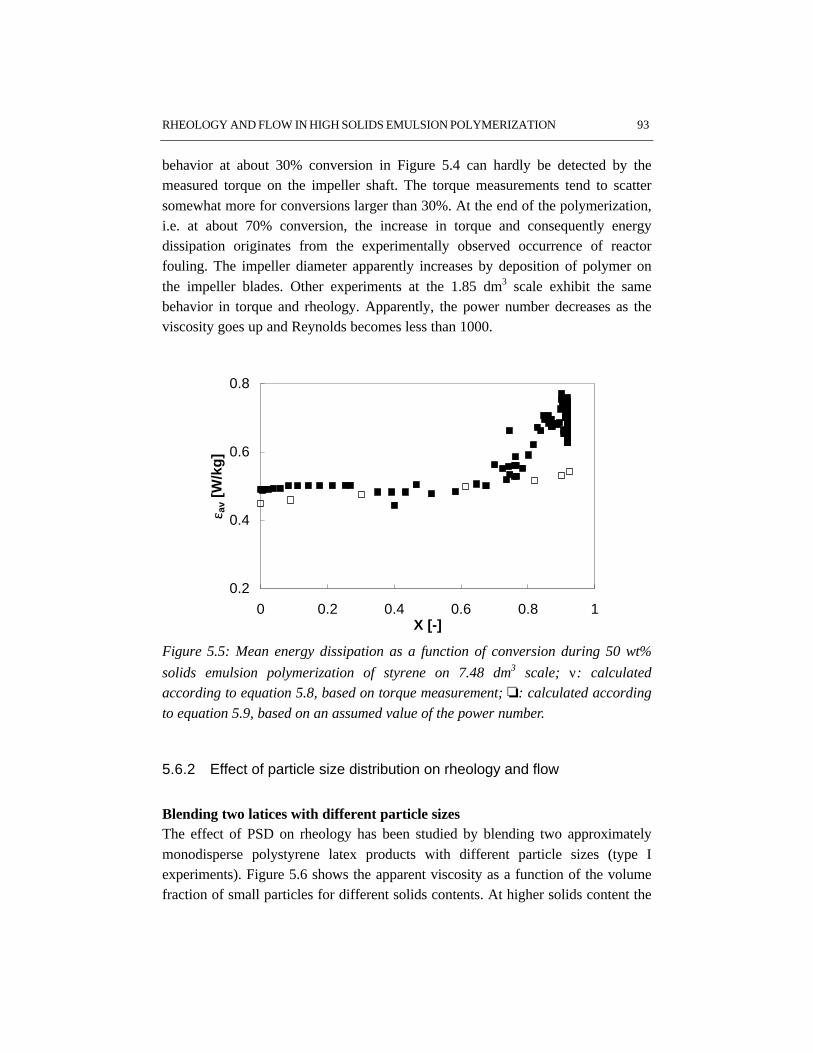
RHEOLOGY AND FLOW IN HIGH SOLIDS EMULSION POLYMERIZATION 93
behavior at about 30% conversion in Figure 5.4 can hardly be detected by themeasured torque on the impeller shaft. The torque measurements tend to scattersomewhat more for conversions larger than 30%. At the end of the polymerization,i.e. at about 70% conversion, the increase in torque and consequently energydissipation originates from the experimentally observed occurrence of reactorfouling. The impeller diameter apparently increases by deposition of polymer onthe impeller blades. Other experiments at the 1.85 dm3 scale exhibit the samebehavior in torque and rheology. Apparently, the power number decreases as theviscosity goes up and Reynolds becomes less than 1000.
0.2
0.4
0.6
0.8
0 0.2 0.4 0.6 0.8 1X [-]
εε av
[W/k
g]
Figure 5.5: Mean energy dissipation as a function of conversion during 50 wt%
solids emulsion polymerization of styrene on 7.48 dm3 scale; ν: calculatedaccording to equation 5.8, based on torque measurement; o: calculated according
to equation 5.9, based on an assumed value of the power number.
5.6.2 Effect of particle size distribution on rheology and flow
Blending two latices with different particle sizesThe effect of PSD on rheology has been studied by blending two approximatelymonodisperse polystyrene latex products with different particle sizes (type Iexperiments). Figure 5.6 shows the apparent viscosity as a function of the volumefraction of small particles for different solids contents. At higher solids content the
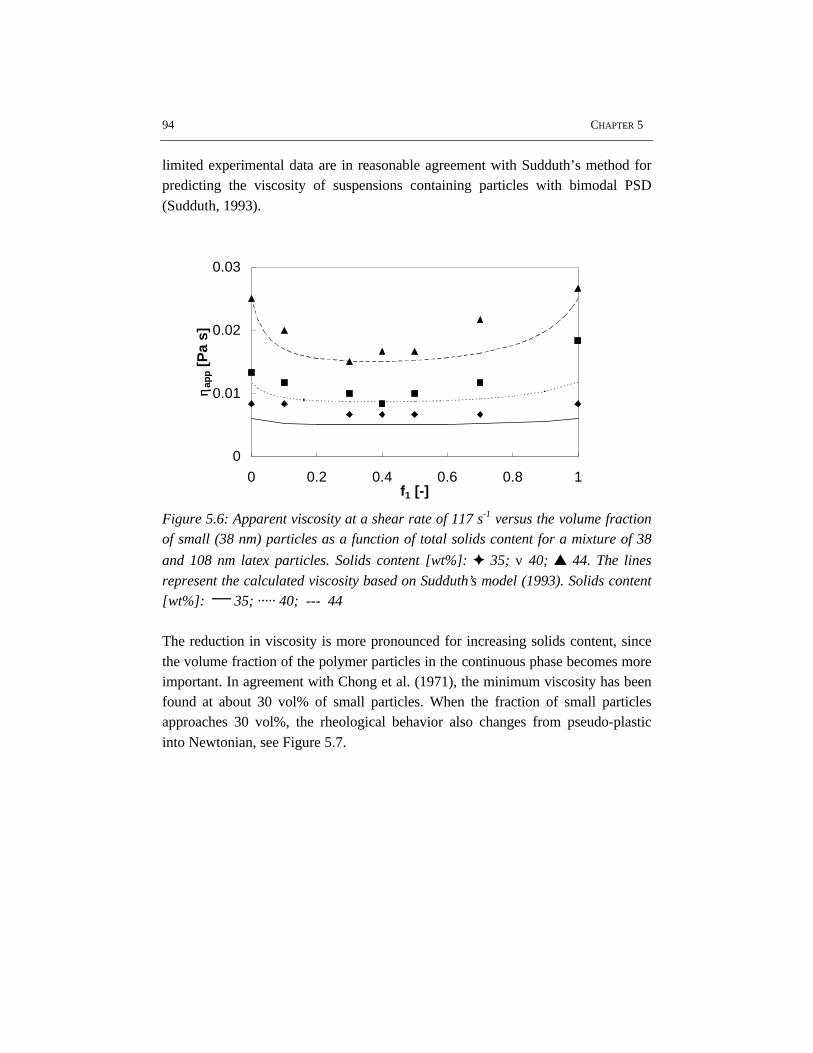
94 CHAPTER 5
limited experimental data are in reasonable agreement with Sudduth’s method forpredicting the viscosity of suspensions containing particles with bimodal PSD(Sudduth, 1993).
0
0.01
0.02
0.03
0 0.2 0.4 0.6 0.8 1f1 [-]
ηη ap
p [
Pa
s]
Figure 5.6: Apparent viscosity at a shear rate of 117 s-1 versus the volume fractionof small (38 nm) particles as a function of total solids content for a mixture of 38
and 108 nm latex particles. Solids content [wt%]: F 35; ν 40; s 44. The lines
represent the calculated viscosity based on Sudduth’s model (1993). Solids content[wt%]: 35; ····· 40; --- 44
The reduction in viscosity is more pronounced for increasing solids content, sincethe volume fraction of the polymer particles in the continuous phase becomes moreimportant. In agreement with Chong et al. (1971), the minimum viscosity has beenfound at about 30 vol% of small particles. When the fraction of small particlesapproaches 30 vol%, the rheological behavior also changes from pseudo-plasticinto Newtonian, see Figure 5.7.
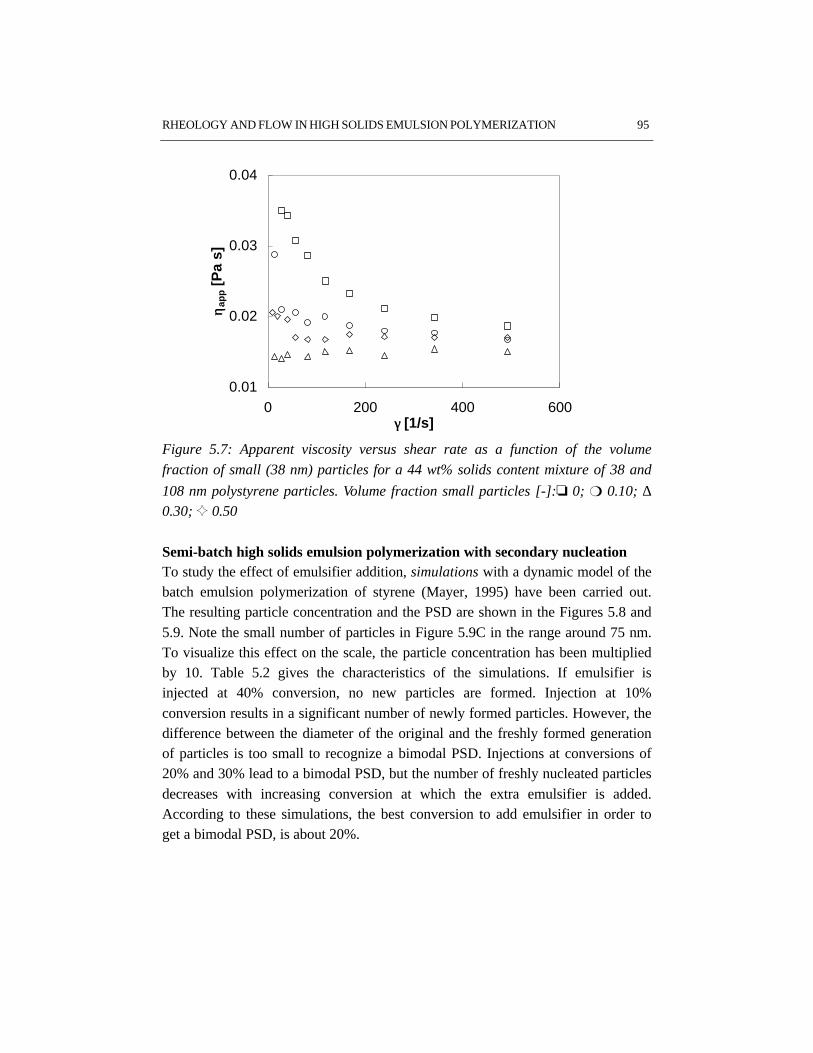
RHEOLOGY AND FLOW IN HIGH SOLIDS EMULSION POLYMERIZATION 95
0.01
0.02
0.03
0.04
0 200 400 600γγ [1/s]
ηη ap
p [
Pa
s]
Figure 5.7: Apparent viscosity versus shear rate as a function of the volume
fraction of small (38 nm) particles for a 44 wt% solids content mixture of 38 and
108 nm polystyrene particles. Volume fraction small particles [-]:o 0; m 0.10; ∆0.30; G 0.50
Semi-batch high solids emulsion polymerization with secondary nucleationTo study the effect of emulsifier addition, simulations with a dynamic model of thebatch emulsion polymerization of styrene (Mayer, 1995) have been carried out.The resulting particle concentration and the PSD are shown in the Figures 5.8 and5.9. Note the small number of particles in Figure 5.9C in the range around 75 nm.To visualize this effect on the scale, the particle concentration has been multipliedby 10. Table 5.2 gives the characteristics of the simulations. If emulsifier isinjected at 40% conversion, no new particles are formed. Injection at 10%conversion results in a significant number of newly formed particles. However, thedifference between the diameter of the original and the freshly formed generationof particles is too small to recognize a bimodal PSD. Injections at conversions of20% and 30% lead to a bimodal PSD, but the number of freshly nucleated particlesdecreases with increasing conversion at which the extra emulsifier is added.According to these simulations, the best conversion to add emulsifier in order toget a bimodal PSD, is about 20%.
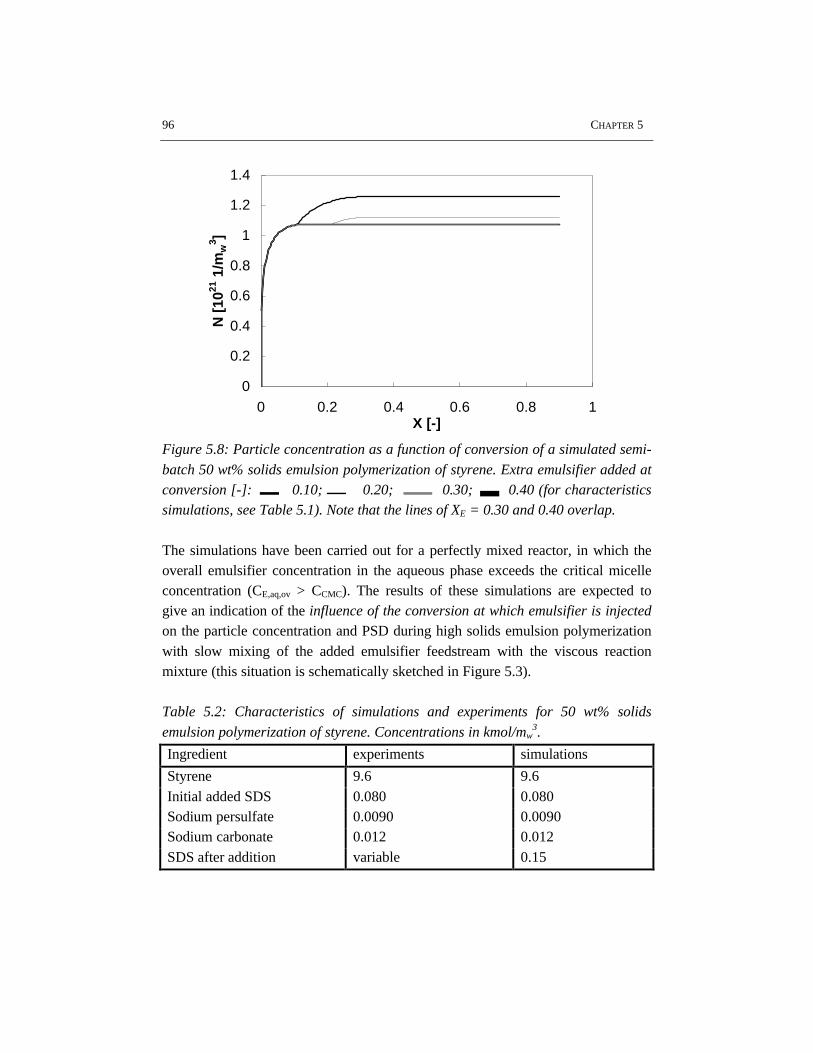
96 CHAPTER 5
0
0.2
0.4
0.6
0.8
1
1.2
1.4
0 0.2 0.4 0.6 0.8 1X [-]
N [
1021
1/m
w3 ]
Figure 5.8: Particle concentration as a function of conversion of a simulated semi-
batch 50 wt% solids emulsion polymerization of styrene. Extra emulsifier added atconversion [-]: 0.10; 0.20; 0.30; 0.40 (for characteristicssimulations, see Table 5.1). Note that the lines of XE = 0.30 and 0.40 overlap.
The simulations have been carried out for a perfectly mixed reactor, in which theoverall emulsifier concentration in the aqueous phase exceeds the critical micelleconcentration (CE,aq,ov > CCMC). The results of these simulations are expected togive an indication of the influence of the conversion at which emulsifier is injectedon the particle concentration and PSD during high solids emulsion polymerizationwith slow mixing of the added emulsifier feedstream with the viscous reactionmixture (this situation is schematically sketched in Figure 5.3).
Table 5.2: Characteristics of simulations and experiments for 50 wt% solids
emulsion polymerization of styrene. Concentrations in kmol/mw3.
Ingredient experiments simulations
Styrene 9.6 9.6Initial added SDS 0.080 0.080Sodium persulfate 0.0090 0.0090Sodium carbonate 0.012 0.012SDS after addition variable 0.15
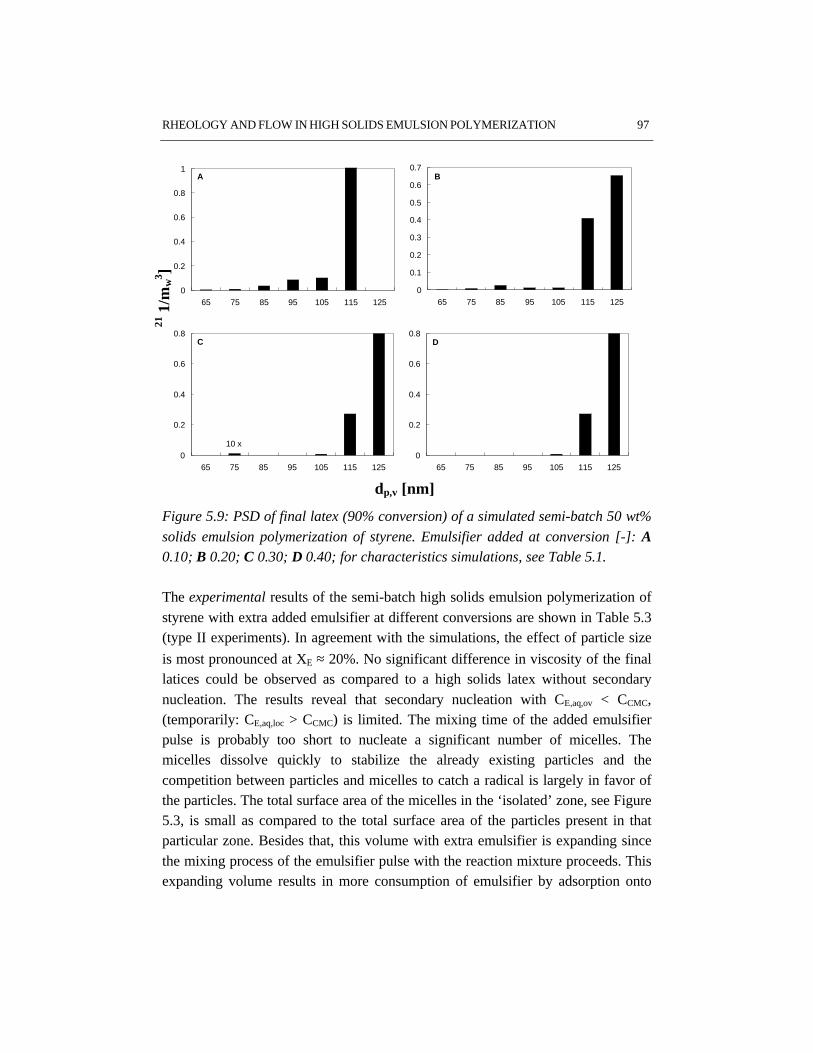
RHEOLOGY AND FLOW IN HIGH SOLIDS EMULSION POLYMERIZATION 97
0
0.2
0.4
0.6
0.8
1
65 75 85 95 105 115 125
A
0
0.1
0.2
0.3
0.4
0.5
0.6
0.7
65 75 85 95 105 115 125
B
0
0.2
0.4
0.6
0.8
65 75 85 95 105 115 125
C
10 x0
0.2
0.4
0.6
0.8
65 75 85 95 105 115 125
D
Figure 5.9: PSD of final latex (90% conversion) of a simulated semi-batch 50 wt%
solids emulsion polymerization of styrene. Emulsifier added at conversion [-]: A0.10; B 0.20; C 0.30; D 0.40; for characteristics simulations, see Table 5.1.
The experimental results of the semi-batch high solids emulsion polymerization ofstyrene with extra added emulsifier at different conversions are shown in Table 5.3(type II experiments). In agreement with the simulations, the effect of particle size
is most pronounced at XE ≈ 20%. No significant difference in viscosity of the finallatices could be observed as compared to a high solids latex without secondarynucleation. The results reveal that secondary nucleation with CE,aq,ov < CCMC,(temporarily: CE,aq,loc > CCMC) is limited. The mixing time of the added emulsifierpulse is probably too short to nucleate a significant number of micelles. Themicelles dissolve quickly to stabilize the already existing particles and thecompetition between particles and micelles to catch a radical is largely in favor ofthe particles. The total surface area of the micelles in the ‘isolated’ zone, see Figure5.3, is small as compared to the total surface area of the particles present in thatparticular zone. Besides that, this volume with extra emulsifier is expanding sincethe mixing process of the emulsifier pulse with the reaction mixture proceeds. Thisexpanding volume results in more consumption of emulsifier by adsorption onto
dp,v [nm]
21 1
/mw
3 ]
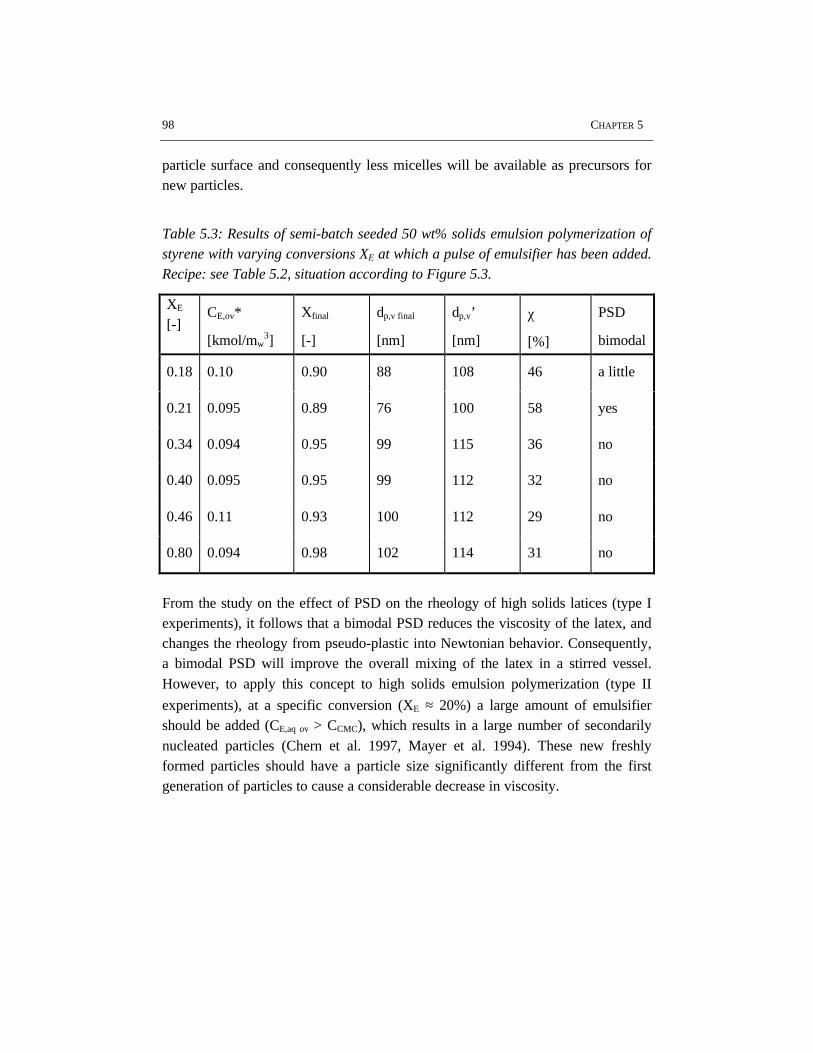
98 CHAPTER 5
particle surface and consequently less micelles will be available as precursors fornew particles.
Table 5.3: Results of semi-batch seeded 50 wt% solids emulsion polymerization ofstyrene with varying conversions XE at which a pulse of emulsifier has been added.Recipe: see Table 5.2, situation according to Figure 5.3.
XE
[-]CE,ov*
[kmol/mw3]
Xfinal
[-]
dp,v final
[nm]
dp,v’
[nm]
χ
[%]
PSD
bimodal
0.18 0.10 0.90 88 108 46 a little
0.21 0.095 0.89 76 100 58 yes
0.34 0.094 0.95 99 115 36 no
0.40 0.095 0.95 99 112 32 no
0.46 0.11 0.93 100 112 29 no
0.80 0.094 0.98 102 114 31 no
From the study on the effect of PSD on the rheology of high solids latices (type Iexperiments), it follows that a bimodal PSD reduces the viscosity of the latex, andchanges the rheology from pseudo-plastic into Newtonian behavior. Consequently,a bimodal PSD will improve the overall mixing of the latex in a stirred vessel.However, to apply this concept to high solids emulsion polymerization (type II
experiments), at a specific conversion (XE ≈ 20%) a large amount of emulsifiershould be added (CE,aq ov > CCMC), which results in a large number of secondarilynucleated particles (Chern et al. 1997, Mayer et al. 1994). These new freshlyformed particles should have a particle size significantly different from the firstgeneration of particles to cause a considerable decrease in viscosity.
RHEOLOGY AND FLOW IN HIGH SOLIDS EMULSION POLYMERIZATION 99
5.7 Conclusions
The rheological properties and flow in high solids emulsion polymerization ofstyrene have been studied. The observed increase in viscosity duringpolymerization is caused by the increasing volume fraction of monomer swollenpolymer particles in the latex. At the same time the rheology changes fromNewtonian into pseudo-plastic behavior. The pseudo-plasticity results from theorientation of the polymer particles in the flow according to the Cross model. Thechange in rheological behavior during high solids emulsion polymerization atabout 30% conversion can hardly be detected by measuring the torque exerted onthe impeller shaft. However, at the end of the polymerization an increase in torqueis observed, due to the occurrence of reactor fouling. The energy dissipationcalculated from the power number agrees reasonably well with the one derivedfrom the measured torque applied on the impeller shaft, except for highconversions if reactor fouling occurs.
In a high solids latex system with a bimodal particle size distribution, a minimumin viscosity occurs at about 30 vol% of small particles. This is in agreement withChong et al. (1971). A possibility to improve the overall mixing rate during highsolids emulsion polymerization is the generation of a bimodal particle sizedistribution, which induces a lower viscosity at the same high solids content.However, to create a significant decrease in viscosity due to secondary nucleation,a large amount of small freshly formed particles is needed with a significantdifference in particle size from the first generation of particles. Therefore a specificrecipe should be applied (Chern, et al., 1997, Mayer et al., 1994).
5.8 References
Bakker, A., Gates, L.E., (1995), Chem. Eng. Progr., December, 25
Barnes, H.A., Hutton, J.F., Walters, K., (1989), An introduction to rheology, Elsevier
Buckmann, A.J.P., Overbeek, G.C., Peters, A.C.I.A., Padget, J.C., Annable, T., Bakker, F., (1995),Double Liaison Chim. Peint., 475, III
Chern, C.S., Chen, T.J., Wu, S.Y., Chu, H.B., Huang, C.F., (1997), J. Macromol. Sci. - Pure Appl.Chem., A34, (7), 1221
Chong, J.S., Christiansen, E.B., Baer, A.D., (1971), J. Appl. Polym. Sci., 15, 2007
Cross, M.M., (1965), J. Colloid Sci., 20, 417
100 CHAPTER 5
Gilbert, R.G., (1995), Emulsion polymerization, A mechanistic approach, Academic Press
Harada, M., Nomura, M., Kojima, H., Eguchi, W., Nagata, S. J., (1972), J. Appl. Polym. Sci., 16,811
Leiza, J.R., Sudol, E.D., El-Aasser, M.S., (1997), J. Appl. Polym. Sci., 64, 1797
Mascosko, C.W., (1994), Rheology principles, measurement, and applications, VCH Publishers
Mayer, M.J.J., (1995), The dynamics of batch and continuous emulsion polymerization. PhD thesis,Eindhoven University of Technology
Mayer, M.J.J., Meuldijk, J., Thoenes, D., (1994), Chem. Eng. Sci., 49, (24B), 4971
Rushton, J.H., Costich, E.W., Everett, H.J., (1950), Chem. Eng. Progr., 46, (9), 467
Skelland, A.H.P., Kanel, J.S., (1990), Ind. Eng. Chem. Res., 29, 1300
Sudduth, R.D., (1993), J. Appl. Polym. Sci., 48, 37
HEAT TRANSFER IN EMULSION POLYMERIZATION 101
6 HEAT TRANSFER IN EMULSION POLYMERIZATION
AbstractThe heat transfer in batch emulsion polymerization of styrene and vinyl acetate hasbeen studied using reaction calorimetry. The effect of the properties of the reactionmixture (monomer to water ratio, polymer to water ratio, type ofmonomer/polymer used in the system and the conversion from monomer topolymer) as well as the influence of process conditions (impeller speed andimpeller type) on the overall heat transfer coefficient (U) have been investigated. Inorder to apply these results to heat transfer during emulsion polymerization ingeneral, the partial heat transfer coefficients inside the vessel (hi) have beencalculated from the overall heat transfer coefficient. Once hi is known fromreaction calorimetric measurements on laboratory scale, the heat transfer on largerscale can reliably be estimated using dimensionless correlations. System propertiessuch as solids content and monomer type have a strong influence on the rate ofheat transfer.
This chapter has been submitted for publication as M.F. Kemmere, J. Meuldijk, A.A.H. Drinkenburg,and A.L. German, ‘Heat transfer in batch emulsion polymerization ’, Polym. React. Eng.
102 CHAPTER 6
6.1 Introduction
In industry emulsion polymerization processes are, among other advantages,applied for their proper control of heat transfer. The heat generated by the freeradical polymerization reaction is in the first place taken up and dispersed by theaqueous phase. Heat transfer to the cooling jacket, however, can be a major scale-up problem in emulsion polymerization. If geometric similarity is part of the scale-up criteria, the area for heat transfer per unit volume of reaction mixture changesinversely to the diameter for a jacketed stirred tank reactor. A change in reactiontemperature severely affects the course and outcome of the polymerization process,since the reaction rate increases exponentially with increasing temperatureaccording to Arrhenius’ law. Proper knowledge of the heat transfer is essential forcontrolling product properties by the reaction temperature and for preventingthermal runaway (Riesen and Choudbury, 1987).
6.2 Heat transfer in agitated vessels
Jacketed stirred (semi-)batch reactors are widely used in the chemical industry. Theheat flux q through the reactor wall is proportional to the driving force of theoverall temperature difference between the hot and cold liquid (Th-Tc). The heatflow through the reactor wall depends on the chemical process (type of reaction,reaction rate and heat of reaction), the physico-chemical properties of the liquidinside the vessel, the heating or cooling liquid in the jacket as well as theequipment used (reactor wall, thickness and material, impeller type, diameter andspeed). In stirred batch reactors heat transfer is governed by forced convection andconduction.
( )ch TTUq −= (6.1)
The proportionality factor U is denoted as the overall heat transfer coefficient, seee.g. McCabe and Smith, 1976. Several resistances in series determine the value ofU. Note that the heat transfer coefficient Ui in equation 6.2 is based on the insidearea.
o
i
doo
i
oi
o
w
i
diii D
D
hD
D
hD
D
k
D
hhU
11ln
2
111 ++++= (6.2)
HEAT TRANSFER IN EMULSION POLYMERIZATION 103
in which hi and ho represent the partial heat transfer coefficients in the vessel andthe jacket, respectively; kw stands for the thermal conductivity coefficient of thewall; hdi and hdo are the fouling factors for the inner and outer side of the wall; Di
and Do are the inner and outer diameter of the vessel. In a reasonably clean reactor,a typical fouling factor for common industrial fluids lies in the range of 1500-6000W/(m2 K) (McCabe and Smith, 1976).
For estimation of the partial heat transfer coefficient hi, the following empiricalrelation for the Nusselt number Nui can be applied (Brooks and Su, 1959):
14.03/13/2 PrRe75.0 Vik
DhNu ii
i
iii == (6.3)
where the Reynolds number Rei, and the Prandtl number Pri stand for:
i
iii
dN
ηρ 2
Re = (6.4)
i
rpii k
C ,Prη
= (6.5)
For Newtonian liquids, the viscosity number Vi is the ratio of the viscosities of thereaction mixture at the temperature in the bulk and at the temperature at the innerwall.
For the partial heat transfer coefficient ho the following empirical relation for theNusselt number Nuo can be applied (Oldshue and Gretton, 1954; Thoenes, 1994):
14.03/18.0 PrRe023.0 Vik
dhNu oo
o
hoo == (6.6)
where Reo and Pro stand for:
o
hooo
dv
ηρ
=Re (6.7)
o
opoo k
C ,Prη
= (6.8)
104 CHAPTER 6
in which dh represents the hydraulic diameter of the jacket defined as:
=jacketwallinner
jacket
h A
Vd 4 (6.9)
In general for scaling-up chemical processes, proper scale-up of the heat transferhas to be considered. The ratio of the partial heat transfer coefficients hi in alaboratory reactor (hi,L) and a plant reactor (hi,P) is then via equation 6.3 given by:
14.03/23/1
=
wP
wL
iL
iP
L
P
iL
iP
N
N
d
d
h
h
ηη
(6.10)
If full geometric similarity of the equipment, i.e. reactor configuration andimpeller, is applied in scaling-up a chemical process, the rule hiP = hiL can bechosen to scale-up the process, see Siegmüller et al. (1992).
The relations 6.3-6.8 reveal that both process conditions in terms of impellerdiameter and speed as well as the properties of the liquid in the vessel and thejacket are important for the rate of heat transfer in agitated vessels. The physicalliquid properties are commonly integrated into the thermal diffusivity:
irp
i
C
ka
ρ,
= (6.11)
6.3 Experimental part and procedures
The overall heat transfer coefficient of several monomer/water and polymer/watermixtures has been determined with reaction calorimetry as a function of impellerspeed, impeller type and monomer/polymer fraction in the system. Beside the
standard impellers described in chapter 2, a 45° pitched downflow four-bladedimpeller (4P, d = 0.44 D) has been used as well. In Table 6.1 the physical propertiesof the relevant components used in this study are collected. Note that the valuesmarked with 3 are estimated values, calculated from empirical equations. The heatcapacities obtained in this way are probably slightly different from the actualvalues. The calculated value of the thermal diffusivity for vinyl acetate mightdeviate from its actual value. Conversion of styrene into polystyrene decreases the
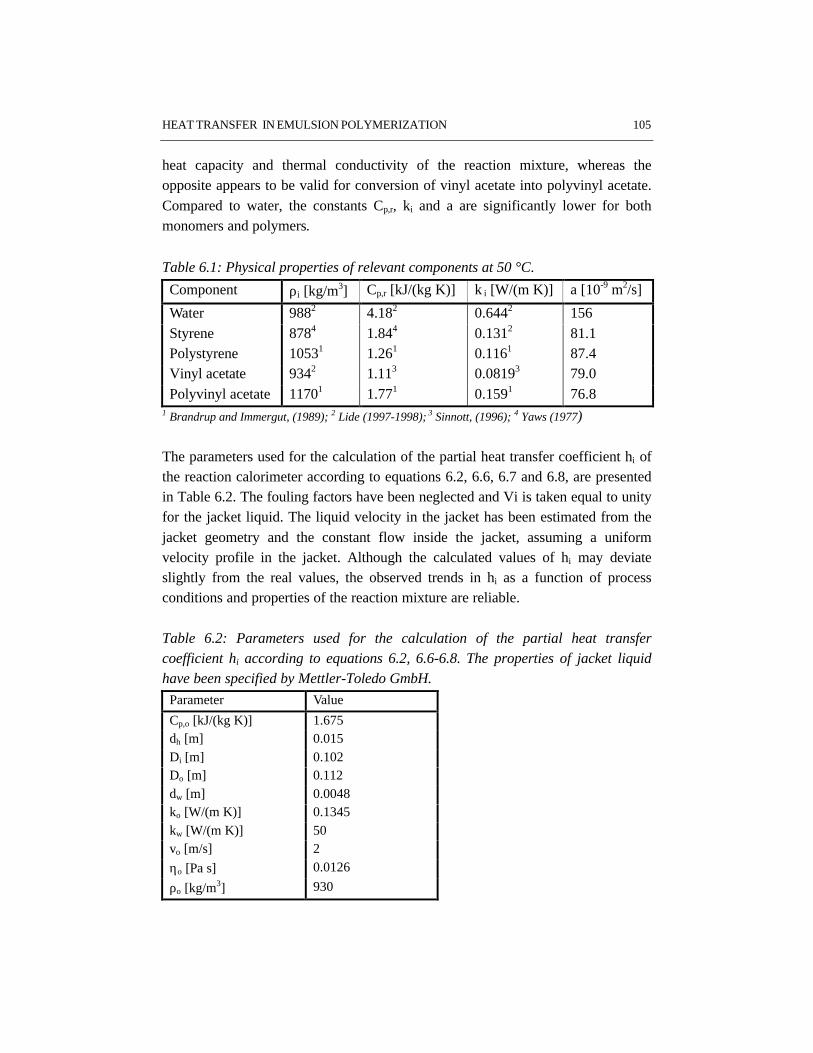
HEAT TRANSFER IN EMULSION POLYMERIZATION 105
heat capacity and thermal conductivity of the reaction mixture, whereas theopposite appears to be valid for conversion of vinyl acetate into polyvinyl acetate.Compared to water, the constants Cp,r, ki and a are significantly lower for bothmonomers and polymers.
Table 6.1: Physical properties of relevant components at 50 °C.
Component ρi [kg/m3] Cp,r [kJ/(kg K)] k i [W/(m K)] a [10-9 m2/s]
Water 9882 4.182 0.6442 156Styrene 8784 1.844 0.1312 81.1Polystyrene 10531 1.261 0.1161 87.4Vinyl acetate 9342 1.113 0.08193 79.0Polyvinyl acetate 11701 1.771 0.1591 76.8
1 Brandrup and Immergut, (1989); 2 Lide (1997-1998); 3 Sinnott, (1996); 4 Yaws (1977)
The parameters used for the calculation of the partial heat transfer coefficient hi ofthe reaction calorimeter according to equations 6.2, 6.6, 6.7 and 6.8, are presentedin Table 6.2. The fouling factors have been neglected and Vi is taken equal to unityfor the jacket liquid. The liquid velocity in the jacket has been estimated from thejacket geometry and the constant flow inside the jacket, assuming a uniformvelocity profile in the jacket. Although the calculated values of hi may deviateslightly from the real values, the observed trends in hi as a function of processconditions and properties of the reaction mixture are reliable.
Table 6.2: Parameters used for the calculation of the partial heat transfercoefficient hi according to equations 6.2, 6.6-6.8. The properties of jacket liquidhave been specified by Mettler-Toledo GmbH.
Parameter Value
Cp,o [kJ/(kg K)] 1.675dh [m] 0.015Di [m] 0.102Do [m] 0.112dw [m] 0.0048ko [W/(m K)] 0.1345kw [W/(m K)] 50vo [m/s] 2
ηo [Pa s] 0.0126
ρo [kg/m3] 930
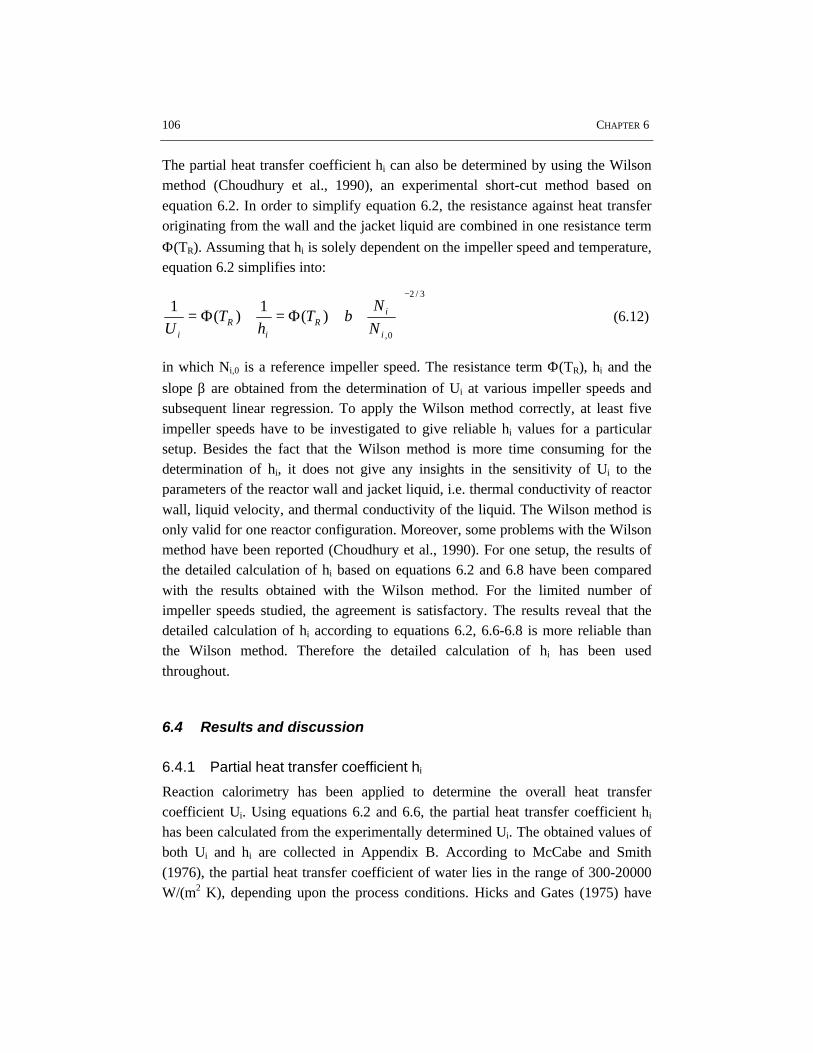
106 CHAPTER 6
The partial heat transfer coefficient hi can also be determined by using the Wilsonmethod (Choudhury et al., 1990), an experimental short-cut method based onequation 6.2. In order to simplify equation 6.2, the resistance against heat transferoriginating from the wall and the jacket liquid are combined in one resistance term
Φ(TR). Assuming that hi is solely dependent on the impeller speed and temperature,equation 6.2 simplifies into:
3/2
0,
)(1
)(1
−
+Φ=+Φ=
i
iR
iR
i N
NT
hT
Uβ (6.12)
in which Ni,0 is a reference impeller speed. The resistance term Φ(TR), hi and the
slope β are obtained from the determination of Ui at various impeller speeds andsubsequent linear regression. To apply the Wilson method correctly, at least fiveimpeller speeds have to be investigated to give reliable hi values for a particularsetup. Besides the fact that the Wilson method is more time consuming for thedetermination of hi, it does not give any insights in the sensitivity of Ui to theparameters of the reactor wall and jacket liquid, i.e. thermal conductivity of reactorwall, liquid velocity, and thermal conductivity of the liquid. The Wilson method isonly valid for one reactor configuration. Moreover, some problems with the Wilsonmethod have been reported (Choudhury et al., 1990). For one setup, the results ofthe detailed calculation of hi based on equations 6.2 and 6.8 have been comparedwith the results obtained with the Wilson method. For the limited number ofimpeller speeds studied, the agreement is satisfactory. The results reveal that thedetailed calculation of hi according to equations 6.2, 6.6-6.8 is more reliable thanthe Wilson method. Therefore the detailed calculation of hi has been usedthroughout.
6.4 Results and discussion
6.4.1 Partial heat transfer coefficient hi
Reaction calorimetry has been applied to determine the overall heat transfercoefficient Ui. Using equations 6.2 and 6.6, the partial heat transfer coefficient hi
has been calculated from the experimentally determined Ui. The obtained values ofboth Ui and hi are collected in Appendix B. According to McCabe and Smith(1976), the partial heat transfer coefficient of water lies in the range of 300-20000W/(m2 K), depending upon the process conditions. Hicks and Gates (1975) have
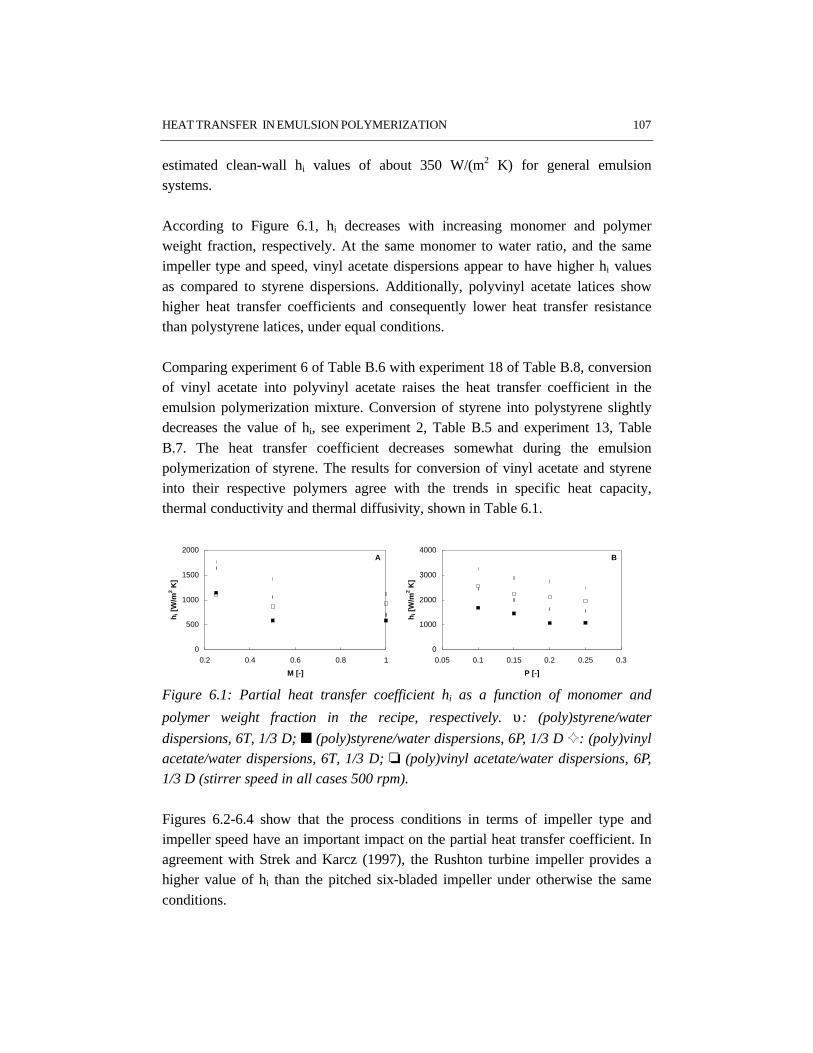
HEAT TRANSFER IN EMULSION POLYMERIZATION 107
estimated clean-wall hi values of about 350 W/(m2 K) for general emulsionsystems.
According to Figure 6.1, hi decreases with increasing monomer and polymerweight fraction, respectively. At the same monomer to water ratio, and the sameimpeller type and speed, vinyl acetate dispersions appear to have higher hi valuesas compared to styrene dispersions. Additionally, polyvinyl acetate latices showhigher heat transfer coefficients and consequently lower heat transfer resistancethan polystyrene latices, under equal conditions.
Comparing experiment 6 of Table B.6 with experiment 18 of Table B.8, conversionof vinyl acetate into polyvinyl acetate raises the heat transfer coefficient in theemulsion polymerization mixture. Conversion of styrene into polystyrene slightlydecreases the value of hi, see experiment 2, Table B.5 and experiment 13, TableB.7. The heat transfer coefficient decreases somewhat during the emulsionpolymerization of styrene. The results for conversion of vinyl acetate and styreneinto their respective polymers agree with the trends in specific heat capacity,thermal conductivity and thermal diffusivity, shown in Table 6.1.
0
500
1000
1500
2000
0.2 0.4 0.6 0.8 1
M [-]
hi [
W/m
2 K]
A
0
1000
2000
3000
4000
0.05 0.1 0.15 0.2 0.25 0.3
P [-]
hi [
W/m
2 K]
B
Figure 6.1: Partial heat transfer coefficient hi as a function of monomer and
polymer weight fraction in the recipe, respectively. υ: (poly)styrene/water
dispersions, 6T, 1/3 D; n (poly)styrene/water dispersions, 6P, 1/3 D G: (poly)vinylacetate/water dispersions, 6T, 1/3 D; o (poly)vinyl acetate/water dispersions, 6P,1/3 D (stirrer speed in all cases 500 rpm).
Figures 6.2-6.4 show that the process conditions in terms of impeller type andimpeller speed have an important impact on the partial heat transfer coefficient. Inagreement with Strek and Karcz (1997), the Rushton turbine impeller provides ahigher value of hi than the pitched six-bladed impeller under otherwise the sameconditions.
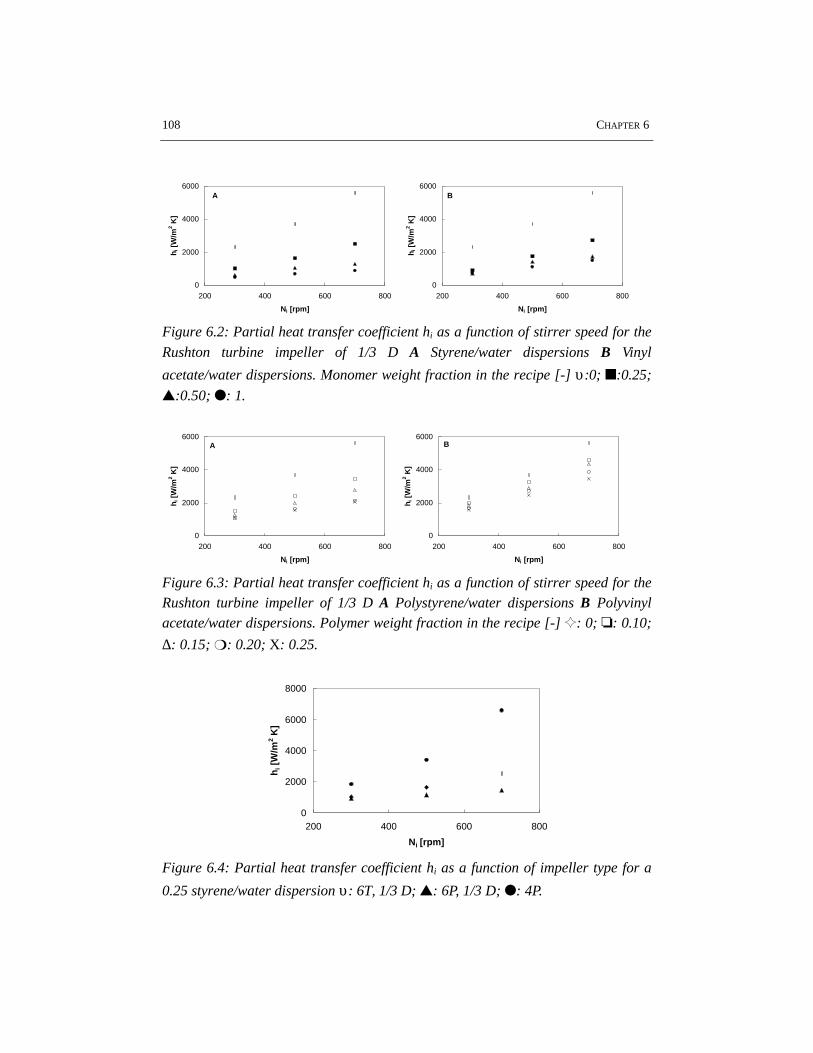
108 CHAPTER 6
0
2000
4000
6000
200 400 600 800
Ni [rpm]
h i [
W/m
2 K]
A
0
2000
4000
6000
200 400 600 800
Ni [rpm]
h i [
W/m
2 K]
B
Figure 6.2: Partial heat transfer coefficient hi as a function of stirrer speed for the
Rushton turbine impeller of 1/3 D A Styrene/water dispersions B Vinyl
acetate/water dispersions. Monomer weight fraction in the recipe [-] υ:0; n:0.25;
s:0.50; l: 1.
0
2000
4000
6000
200 400 600 800
Ni [rpm]
h i [
W/m
2 K]
A
0
2000
4000
6000
200 400 600 800
Ni [rpm]
h i [
W/m
2 K]
B
Figure 6.3: Partial heat transfer coefficient hi as a function of stirrer speed for theRushton turbine impeller of 1/3 D A Polystyrene/water dispersions B Polyvinylacetate/water dispersions. Polymer weight fraction in the recipe [-] G: 0; o: 0.10;
∆: 0.15; m: 0.20; X: 0.25.
0
2000
4000
6000
8000
200 400 600 800
Ni [rpm]
hi [
W/m
2 K]
Figure 6.4: Partial heat transfer coefficient hi as a function of impeller type for a
0.25 styrene/water dispersion υ: 6T, 1/3 D; s: 6P, 1/3 D; l: 4P.
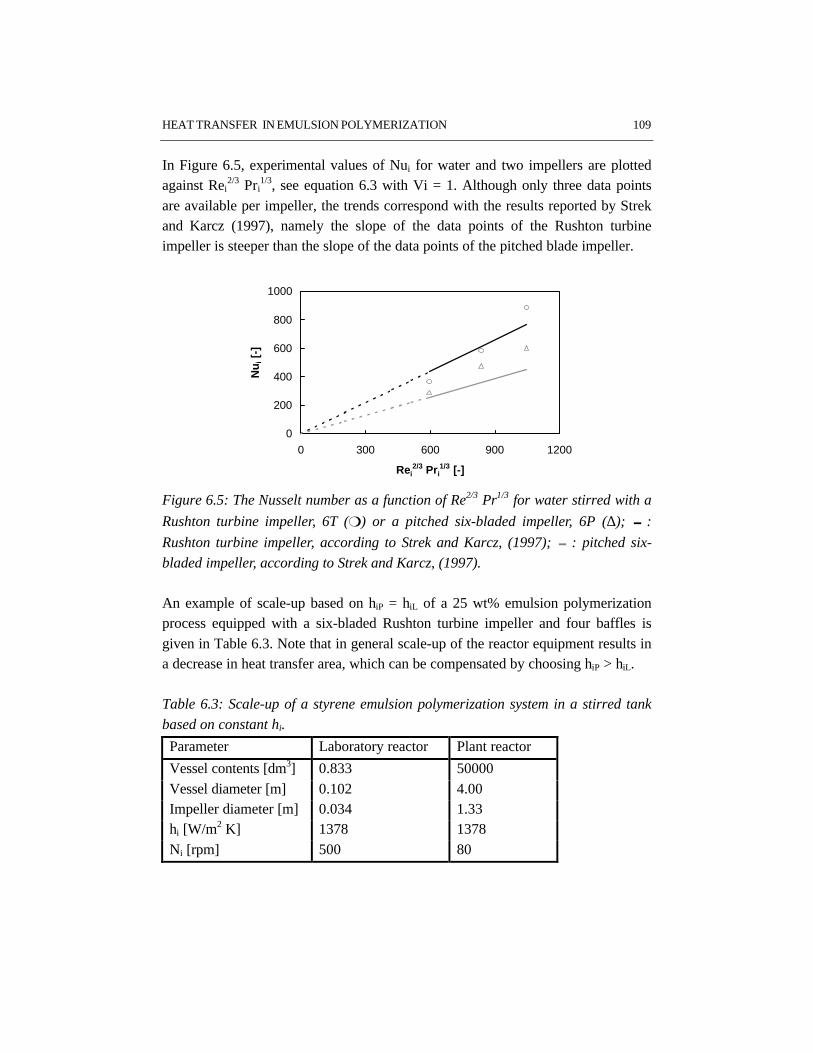
HEAT TRANSFER IN EMULSION POLYMERIZATION 109
In Figure 6.5, experimental values of Nui for water and two impellers are plottedagainst Rei
2/3 Pri1/3, see equation 6.3 with Vi = 1. Although only three data points
are available per impeller, the trends correspond with the results reported by Strekand Karcz (1997), namely the slope of the data points of the Rushton turbineimpeller is steeper than the slope of the data points of the pitched blade impeller.
0
200
400
600
800
1000
0 300 600 900 1200
Rei2/3 Pri
1/3 [-]
Nu i
[-]
Figure 6.5: The Nusselt number as a function of Re2/3 Pr1/3 for water stirred with a
Rushton turbine impeller, 6T (m) or a pitched six-bladed impeller, 6P (∆); 0:
Rushton turbine impeller, according to Strek and Karcz, (1997); 0: pitched six-
bladed impeller, according to Strek and Karcz, (1997).
An example of scale-up based on hiP = hiL of a 25 wt% emulsion polymerizationprocess equipped with a six-bladed Rushton turbine impeller and four baffles isgiven in Table 6.3. Note that in general scale-up of the reactor equipment results ina decrease in heat transfer area, which can be compensated by choosing hiP > hiL.
Table 6.3: Scale-up of a styrene emulsion polymerization system in a stirred tank
based on constant hi.
Parameter Laboratory reactor Plant reactor
Vessel contents [dm3] 0.833 50000Vessel diameter [m] 0.102 4.00Impeller diameter [m] 0.034 1.33hi [W/m2 K] 1378 1378Ni [rpm] 500 80
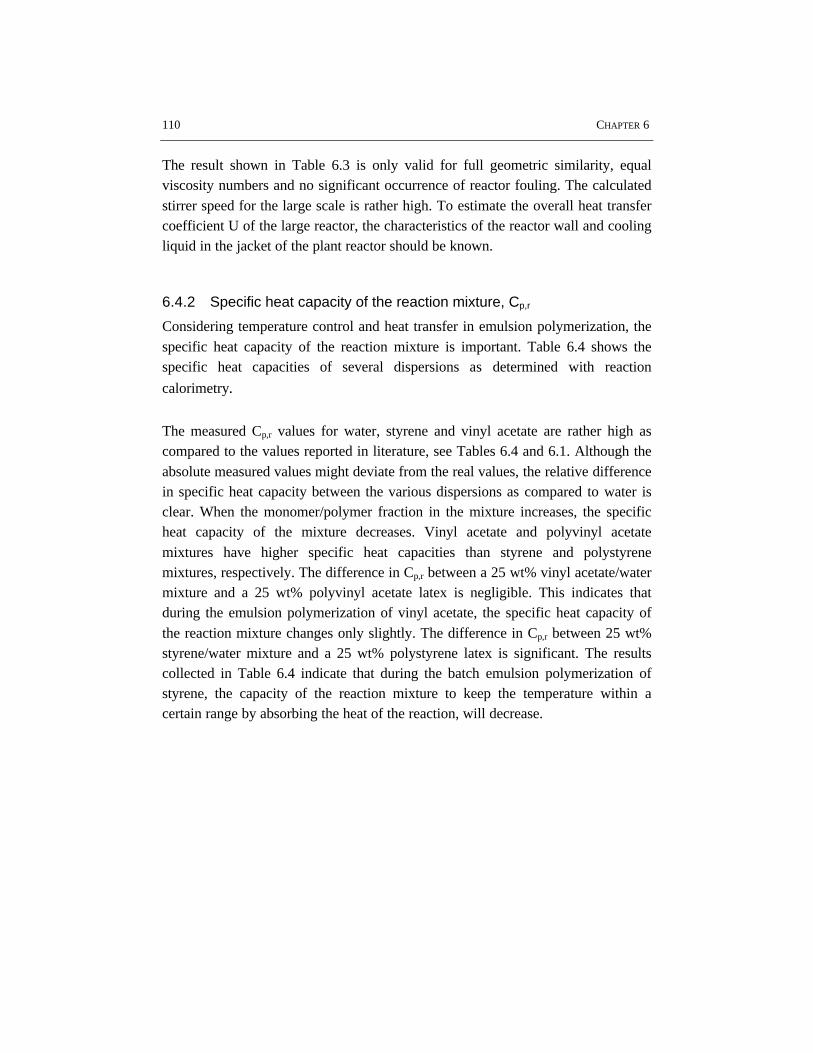
110 CHAPTER 6
The result shown in Table 6.3 is only valid for full geometric similarity, equalviscosity numbers and no significant occurrence of reactor fouling. The calculatedstirrer speed for the large scale is rather high. To estimate the overall heat transfercoefficient U of the large reactor, the characteristics of the reactor wall and coolingliquid in the jacket of the plant reactor should be known.
6.4.2 Specific heat capacity of the reaction mixture, Cp,r
Considering temperature control and heat transfer in emulsion polymerization, thespecific heat capacity of the reaction mixture is important. Table 6.4 shows thespecific heat capacities of several dispersions as determined with reaction
calorimetry.
The measured Cp,r values for water, styrene and vinyl acetate are rather high ascompared to the values reported in literature, see Tables 6.4 and 6.1. Although theabsolute measured values might deviate from the real values, the relative differencein specific heat capacity between the various dispersions as compared to water isclear. When the monomer/polymer fraction in the mixture increases, the specificheat capacity of the mixture decreases. Vinyl acetate and polyvinyl acetatemixtures have higher specific heat capacities than styrene and polystyrenemixtures, respectively. The difference in Cp,r between a 25 wt% vinyl acetate/watermixture and a 25 wt% polyvinyl acetate latex is negligible. This indicates thatduring the emulsion polymerization of vinyl acetate, the specific heat capacity ofthe reaction mixture changes only slightly. The difference in Cp,r between 25 wt%styrene/water mixture and a 25 wt% polystyrene latex is significant. The resultscollected in Table 6.4 indicate that during the batch emulsion polymerization ofstyrene, the capacity of the reaction mixture to keep the temperature within acertain range by absorbing the heat of the reaction, will decrease.
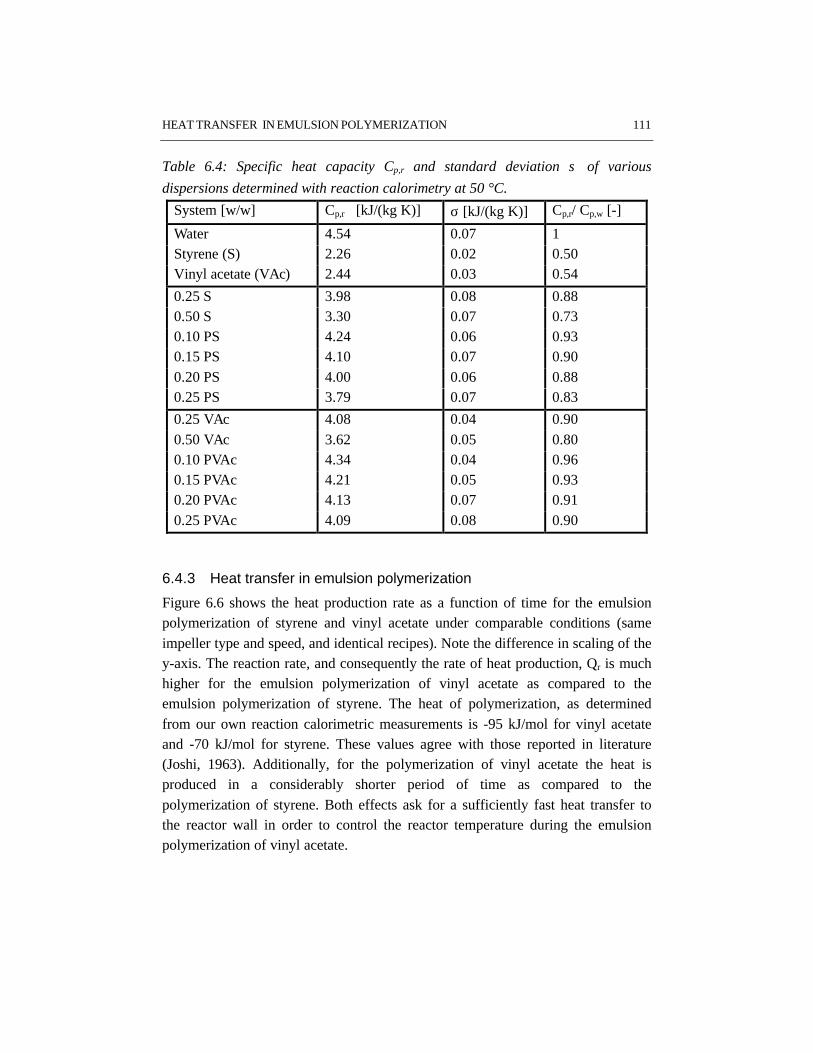
HEAT TRANSFER IN EMULSION POLYMERIZATION 111
Table 6.4: Specific heat capacity Cp,r and standard deviation σ of various
dispersions determined with reaction calorimetry at 50 °C.
System [w/w] Cp,r [kJ/(kg K)] σ [kJ/(kg K)] Cp,r/ Cp,w [-]
Water 4.54 0.07 1Styrene (S) 2.26 0.02 0.50Vinyl acetate (VAc) 2.44 0.03 0.54
0.25 S 3.98 0.08 0.880.50 S 3.30 0.07 0.730.10 PS 4.24 0.06 0.930.15 PS 4.10 0.07 0.900.20 PS 4.00 0.06 0.880.25 PS 3.79 0.07 0.83
0.25 VAc 4.08 0.04 0.900.50 VAc 3.62 0.05 0.800.10 PVAc 4.34 0.04 0.960.15 PVAc 4.21 0.05 0.930.20 PVAc 4.13 0.07 0.910.25 PVAc 4.09 0.08 0.90
6.4.3 Heat transfer in emulsion polymerization
Figure 6.6 shows the heat production rate as a function of time for the emulsionpolymerization of styrene and vinyl acetate under comparable conditions (sameimpeller type and speed, and identical recipes). Note the difference in scaling of they-axis. The reaction rate, and consequently the rate of heat production, Qr is muchhigher for the emulsion polymerization of vinyl acetate as compared to theemulsion polymerization of styrene. The heat of polymerization, as determinedfrom our own reaction calorimetric measurements is -95 kJ/mol for vinyl acetateand -70 kJ/mol for styrene. These values agree with those reported in literature(Joshi, 1963). Additionally, for the polymerization of vinyl acetate the heat isproduced in a considerably shorter period of time as compared to thepolymerization of styrene. Both effects ask for a sufficiently fast heat transfer tothe reactor wall in order to control the reactor temperature during the emulsionpolymerization of vinyl acetate.
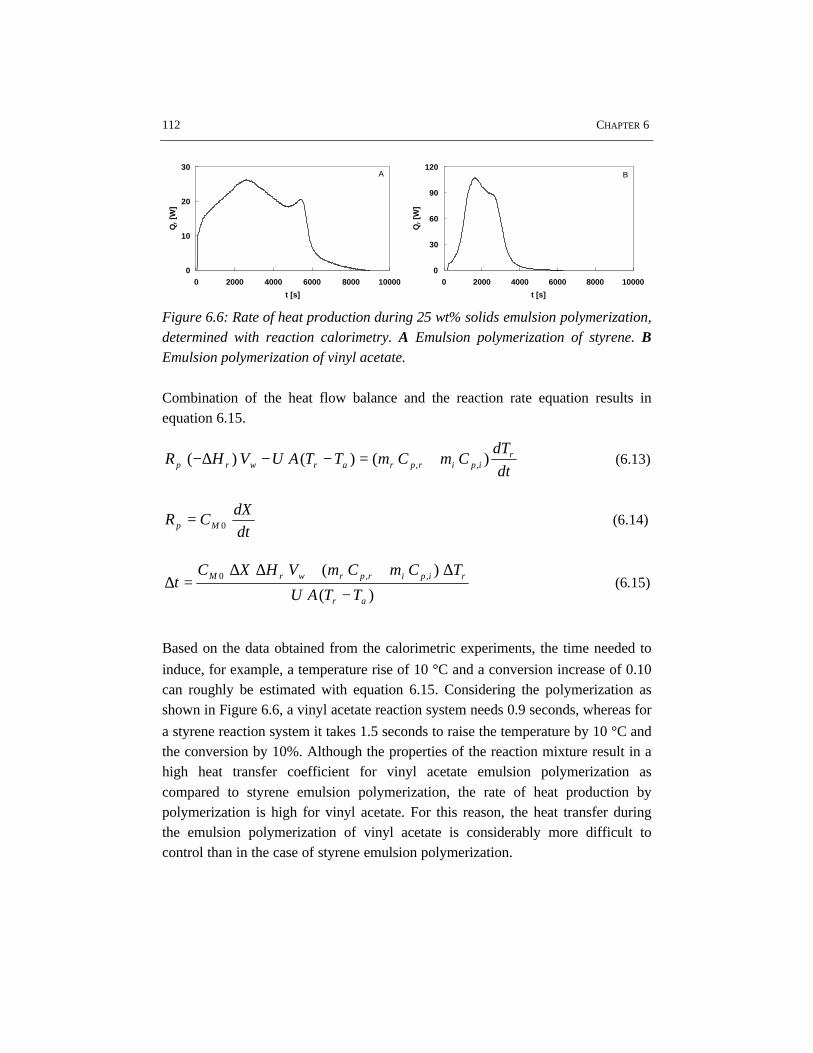
112 CHAPTER 6
0
10
20
30
0 2000 4000 6000 8000 10000
t [s]
Qr [
W]
A
0
30
60
90
120
0 2000 4000 6000 8000 10000
t [s]
Qr [
W]
B
Figure 6.6: Rate of heat production during 25 wt% solids emulsion polymerization,determined with reaction calorimetry. A Emulsion polymerization of styrene. BEmulsion polymerization of vinyl acetate.
Combination of the heat flow balance and the reaction rate equation results inequation 6.15.
dt
dTCmCmTTAUVHR r
ipirprarwrp )()()( ,, +=−−∆− (6.13)
dt
dXCR Mp 0= (6.14)
)(
)( ,,0
ar
ripirprwrM
TTAU
TCmCmVHXCt
−
∆++∆∆=∆ (6.15)
Based on the data obtained from the calorimetric experiments, the time needed to
induce, for example, a temperature rise of 10 °C and a conversion increase of 0.10can roughly be estimated with equation 6.15. Considering the polymerization asshown in Figure 6.6, a vinyl acetate reaction system needs 0.9 seconds, whereas for
a styrene reaction system it takes 1.5 seconds to raise the temperature by 10 °C andthe conversion by 10%. Although the properties of the reaction mixture result in ahigh heat transfer coefficient for vinyl acetate emulsion polymerization ascompared to styrene emulsion polymerization, the rate of heat production bypolymerization is high for vinyl acetate. For this reason, the heat transfer duringthe emulsion polymerization of vinyl acetate is considerably more difficult tocontrol than in the case of styrene emulsion polymerization.
HEAT TRANSFER IN EMULSION POLYMERIZATION 113
6.4.4 Heat transfer in high solids emulsion polymerization
Since the calorimeter used in this study is based on the heat flux through thereactor wall, it is not possible to measure heat transfer effects in non ideally mixedsystems such as high solids latices. Industrial emulsion polymerization processesare often carried out with high solids recipes (up to 50 wt% of polymer in the latexproduced). The viscosity and the amount of reactor fouling increase with solidscontent, and the rheology changes from Newtonian into pseudo-plastic behavior(Mayer et al., 1994; Kemmere et al., 1998). During high solids emulsionpolymerization, process operation in terms of proper heat transfer is seriouslyhampered (Meuldijk et al., 1998). Moreover, the results of the present study revealthat the partial heat transfer coefficient hi, as well as the specific heat capacity Cp,r
and thermal diffusivity a, decrease with increasing solids content. To raise the heattransfer coefficient in high solids emulsion polymerization systems, severalapproaches can be considered:
Lower jacket temperaturesLowering the jacket temperature may not be adequate since the viscosity of thereaction mixture at the wall temperature may become very high. Heat transfer andmixing will then be reduced by formation of stagnant regions near the wall(Reichert and Moritz, 1989). Additionally, the cooling capacity of large-scalereactors is often limited by the specific heat transfer area.
Installation of additional heat transfer areaExtra heat transfer area can be installed inside or outside (external loop) the reactorto enhance the rate of heat removal (Poehlein, 1997). However, introduction ofextra surface may be accompanied with additional reactor fouling.
Increasing power input due to stirringIn agreement with Hicks and Gates (1975) and Meuldijk et al. (1998), the results ofthis study reveal that a larger impeller diameter as well as increasing the stirrerspeed will raise the heat transfer coefficient. Application of this concept toindustrial high solids emulsion polymerization faces limitations with regard to theimpeller investment capital and operation costs due to the pseudo-plasticity of thehigh solids reaction mixture (power input). Note that a larger impeller and a higherspeed may also increase reactor fouling due to shear. This would result in adecreasing heat transfer coefficient.
114 CHAPTER 6
Application of a close contact impellerIn order to improve the mixing and increase the heat transfer in the entire pseudo-plastic high solids emulsion polymerization mixture, a close contact impeller, suchas a helical ribbon impeller can be used. In general, helical ribbon impellers aremore suitable than turbines, for pseudo-plastic liquids. They create a bettercirculation, less chances for fouling, and they will probably result in a better heattransfer to the vessel wall (Choplin and Villermaux, 1996). However, in thebeginning of the emulsion polymerization, turbulent flow conditions are necessaryfor proper emulsification of the monomer in the aqueous phase. Our experimentsshow that a double helical ribbon impeller with two additional Rushton impellersall mounted on the same shaft have not provided sufficient emulsification duringhigh solids emulsion polymerization, since the rotational speed is much too low forthe turbine. A low conversion has been obtained and severe reactor fouling hasoccurred on the surface of the impellers. Analogous to the stirrer device proposedby van Dierendonck et al. (1980), a helical ribbon impeller with turbine impellersassembled on separate shafts might be much better. For radical additionpolymerization, Yamamoto et al. (1998) have developed a special impeller suitablefor a wide viscosity range. The impeller is a combination of paddle impellers forthe low viscosity range and half ellipse impellers for the pseudo-plastic rheologicalbehavior. These kinds of impellers may be suitable for high solids emulsionpolymerization. Another approach is to use a premixer for the emulsificationprocess and to adapt the stirring device in the reactor to the pseudo-plasticrheology, assuming good emulsion stability during polymerization, see chapter 3.
Non-isothermal operationNon-isothermal operation might also be a solution to the limited capacity of heatremoval during industrial high solids emulsion polymerization. The reaction can bestarted at a lower temperature and the heat capacities of the reactor and the reactionmixture can be used to take up part of the heat of reaction (Poehlein, 1997). Notethat non-isothermal operation also affects the product properties, such as themolecular weight distribution, which may or may not be beneficial.
6.5 Conclusions
The heat transfer in batch emulsion polymerization dispersions has been studiedwith reaction calorimetry. Both the properties of the reaction mixture and the
HEAT TRANSFER IN EMULSION POLYMERIZATION 115
process conditions determine the partial heat transfer coefficient at the reactionside, hi. The following conclusions can be formulated from this study:
The process conditions strongly influence the partial heat transfer coefficient. Inagreement with Hicks and Gates (1975) and Meuldijk et al. (1998), a largerimpeller diameter will increase the heat transfer coefficient at the same specificenergy dissipation rate. The impeller type used is important for the values of hi. Inagreement with Strek and Karcz (1997), the Rushton turbine impeller provides ahigher heat transfer coefficient than the pitched six-bladed impeller under the sameconditions.
Concerning the influence of the reaction mixture, emulsion polymerization of vinylacetate provides a higher heat transfer coefficient than emulsion polymerization ofstyrene at the same low volume fraction of polymer, i.e. 25 wt%. The determinedvalues of the heat transfer coefficient are higher for both vinyl acetate andpolyvinyl acetate in water dispersions as compared to styrene and polystyrenedispersions. At increasing solids content, the heat transfer coefficient decreases. Inhigh solids emulsion polymerization, i.e. 50 wt% of polymer, the effect of theparticle size has to be considered as well. Conversion of vinyl acetate intopolyvinyl acetate raises the heat transfer coefficient in the emulsion polymerizationmixture. Conversion of styrene into polystyrene slightly reduces the value of theheat transfer coefficient.
6.6 References
Brandrup, J., Immergut, E.H., (1989), Polymer Handbook, Wiley, 3th edition
Brooks, G., Su, G.J., (1959), Chem. Eng. Progr., 55, (10), 54
Choplin, L., Villermaux, J., (1996), AIChE Symp. Ser., 299, (90), 123
Choudbury, S., Utiger, L., Riesen, R., (1990), Chem. Ing. Tech., 62, (2), 154
Dierendonck, L.L. van, de Leeuw den Bouter, J.A., Ostendorf, H.K., (1980), Chem. Eng. Sci., 35,476
Hicks, R.W., Gates, L.E., (1975), Chem. Eng. Progr., 71, (8), 74
Joshi, R.M., (1963), Makromol. Chem., 66, 114
Kemmere, M.F., Meuldijk, J., Drinkenburg, A.A.H., German, A.L., (1998), Pol. React. Eng., 6,(3&4), 243
Lide, D.R., (1997-1998), Handbook of chemistry and physics, CRC Press, 78th edition
116 CHAPTER 6
McCabe, W.L., Smith, J.C., (1976) Unit operations of chemical engineering, McGraw-Hill, 3th
edition
Mayer, M.J.J., Meuldijk, J., Thoenes, D., (1994), Chem. Eng. Sci., 49, (24B), 4971
Meuldijk, J., Boomen, van den F.H.A.M., Kemmere, M.F., Wijers, J.G., (1998), Entropie, 212/213,13
Oldshue, J.Y., Gretton, A.T., (1954), Chem. Eng. Progr., 50, (12), 615
Poehlein, G.W., (1997), Reaction engineering for emulsion polymerization, Polymer dispersions:principles and applications, J.M. Asua (ed.), Kluwer Academic Publishers
Reichert, K.H., Moritz, H.U., (1989), Polymer reaction engineering, Compr. Polymer Science, G.Allen (ed.), 3, 317
Riesen, R., Choudbury, S., (1987), Technical application No 2, Mettler Toledo publication
Siegmüller, C., Velo, E., Recasens, F., (1992), Chem. Eng. Comm., 117, 455
Sinnott, R.K., (1996), Coulson & Richardson ’s Chemical Engineering, 6, Butterworth/Heinemann,2nd edition
Strek, F., Karcz, J., (1997), Proceedings of 9th European Mixing Conference, 11, (52), 105
Thoenes, D., (1994), Chemical reactor development, from laboratory to industrial production, KluwerAcademic Publishers
Yamamoto, K., Abe, K., Tarumoto, A., Nishi, K., Kaminoyama, M., Kamiwano, M., (1998), J. Chem.Eng. Japan, 31, (3), 355
Yaws, C.L., (1977), Physical properties, A guide to the physical, thermodynamic and transportproperty data of industrially important chemical compounds, McGraw-Hill
IMPLICATIONS OF THE CURRENT RESULTS FOR INDUSTRIAL PROCESS DESIGN 117
7 IMPLICATIONS OF THE CURRENT RESULTS FORINDUSTRIAL PROCESS DESIGN
In the preceding chapters various key issues involved in batch emulsionpolymerization have been addressed. This chapter describes how the combinedresults obtained in this work can be used to improve the operation of runningemulsion polymerization processes. Additionally, this leads to guidelines for thedesign of novel emulsion polymerization processes.
7.1 Introduction
Typically, an industrial polymerization process consists of three steps: preparation,polymerization and post-processing (Reichert and Moritz, 1989). The preparationstep involves purification and mixing of the reactants. Purification is importantsince inhibitors, which have been added to the monomers in order to preventundesired autopolymerization during storage, can significantly affect thepolymerization process (Kemmere et al., 1999). Proper mixing of the reactionmixture before and during the polymerization is essential to minimizeconcentration and temperature gradients as well as to provide sufficient dispersionof the monomers into the aqueous phase (Oldshue, 1983). The polymerizationreaction itself has special physical features which require specific reactor design(Brooks, 1997). For example the reactants usually have a relatively low viscosity,as compared to the viscosity of the final product. Moreover, emulsionpolymerization is a rather complex process as it is based on a multiphase reactionsystem. Since almost all polymerization reactions are exothermic, isothermaloperation asks for proper heat removal from the reaction mixture (Klostermann,1998). With regard to the postprocessing step, emulsion polymerization has amajor advantage, since in many latex applications the product latex can be used assuch. Nevertheless, in order to meet product specification sometimes a purificationstep such as filtering of coagulum is necessary.
In the following sections some chemical engineering aspects concerning batchemulsion polymerization are discussed, as well as the impact of the polymerizationprocess on product properties in terms of the particle size distribution.
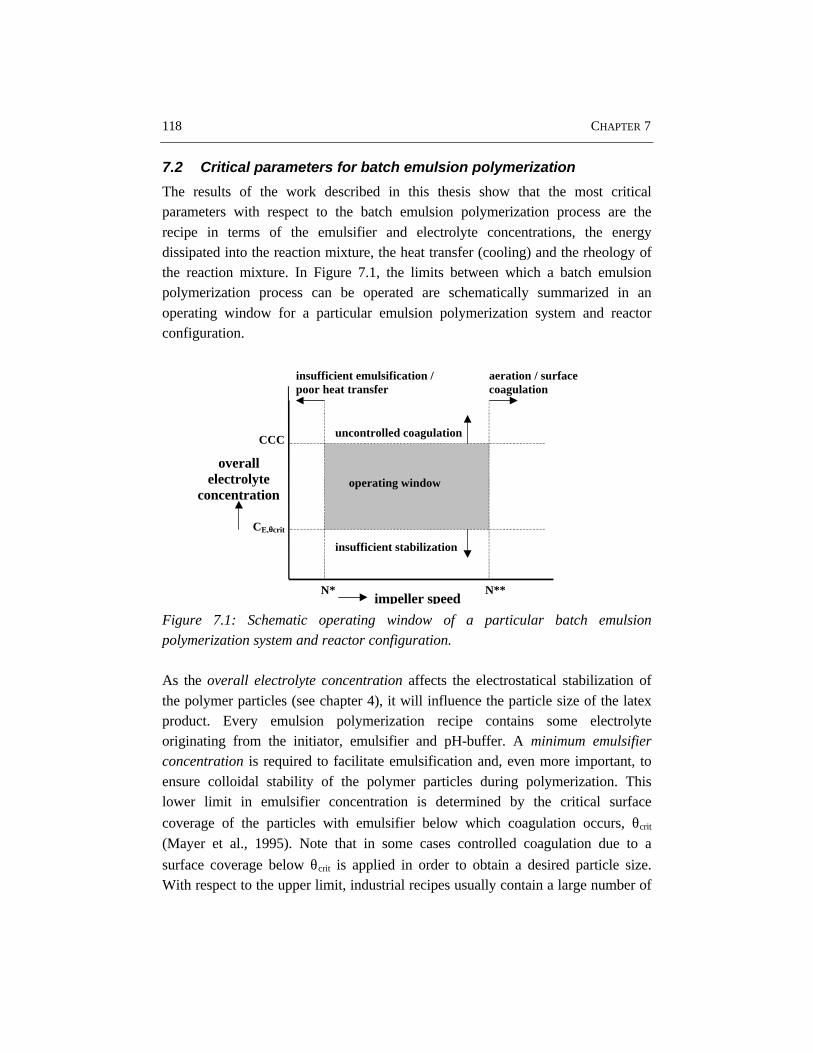
118 CHAPTER 7
7.2 Critical parameters for batch emulsion polymerization
The results of the work described in this thesis show that the most criticalparameters with respect to the batch emulsion polymerization process are therecipe in terms of the emulsifier and electrolyte concentrations, the energydissipated into the reaction mixture, the heat transfer (cooling) and the rheology ofthe reaction mixture. In Figure 7.1, the limits between which a batch emulsionpolymerization process can be operated are schematically summarized in anoperating window for a particular emulsion polymerization system and reactorconfiguration.
overallelectrolyte
concentration
CE,θθcrit
CCC
N** N*
insufficient stabilization
uncontrolled coagulation
impeller speed
aeration / surfacecoagulation
insufficient emulsification /poor heat transfer
operating window
Figure 7.1: Schematic operating window of a particular batch emulsionpolymerization system and reactor configuration.
As the overall electrolyte concentration affects the electrostatical stabilization ofthe polymer particles (see chapter 4), it will influence the particle size of the latexproduct. Every emulsion polymerization recipe contains some electrolyteoriginating from the initiator, emulsifier and pH-buffer. A minimum emulsifierconcentration is required to facilitate emulsification and, even more important, toensure colloidal stability of the polymer particles during polymerization. Thislower limit in emulsifier concentration is determined by the critical surface
coverage of the particles with emulsifier below which coagulation occurs, θcrit
(Mayer et al., 1995). Note that in some cases controlled coagulation due to a
surface coverage below θcrit is applied in order to obtain a desired particle size.With respect to the upper limit, industrial recipes usually contain a large number of
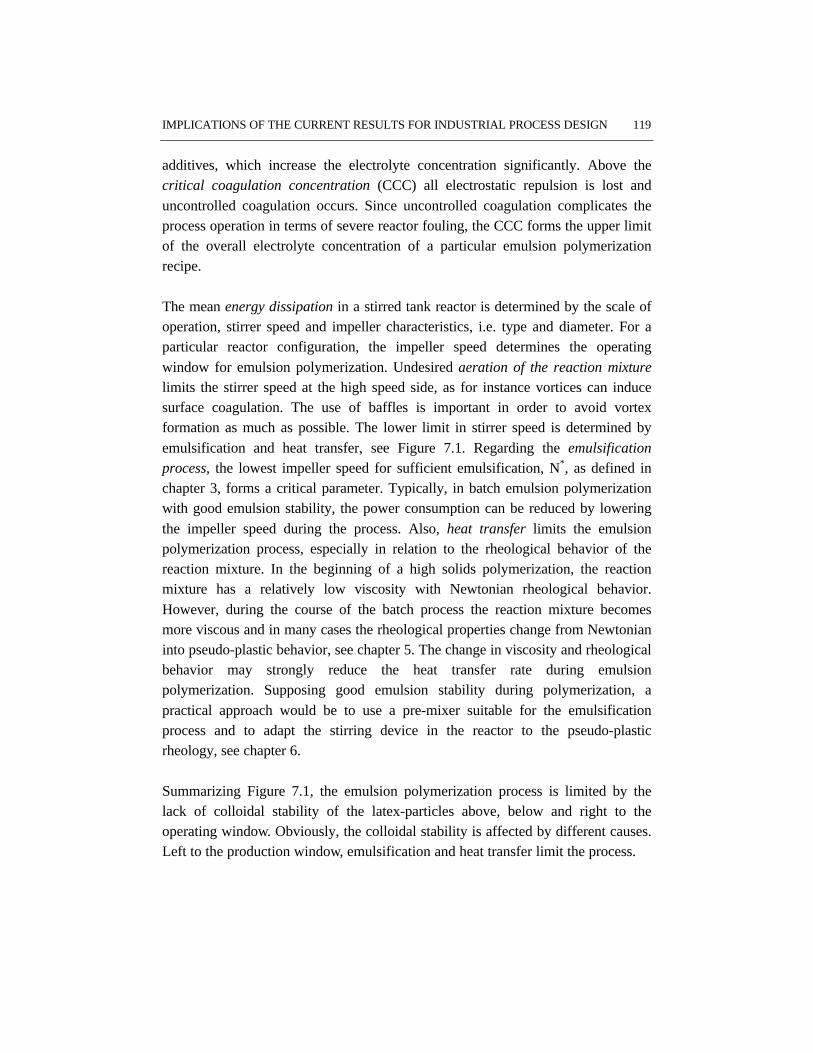
IMPLICATIONS OF THE CURRENT RESULTS FOR INDUSTRIAL PROCESS DESIGN 119
additives, which increase the electrolyte concentration significantly. Above thecritical coagulation concentration (CCC) all electrostatic repulsion is lost anduncontrolled coagulation occurs. Since uncontrolled coagulation complicates theprocess operation in terms of severe reactor fouling, the CCC forms the upper limitof the overall electrolyte concentration of a particular emulsion polymerizationrecipe.
The mean energy dissipation in a stirred tank reactor is determined by the scale ofoperation, stirrer speed and impeller characteristics, i.e. type and diameter. For aparticular reactor configuration, the impeller speed determines the operatingwindow for emulsion polymerization. Undesired aeration of the reaction mixturelimits the stirrer speed at the high speed side, as for instance vortices can inducesurface coagulation. The use of baffles is important in order to avoid vortexformation as much as possible. The lower limit in stirrer speed is determined byemulsification and heat transfer, see Figure 7.1. Regarding the emulsificationprocess, the lowest impeller speed for sufficient emulsification, N*, as defined inchapter 3, forms a critical parameter. Typically, in batch emulsion polymerizationwith good emulsion stability, the power consumption can be reduced by loweringthe impeller speed during the process. Also, heat transfer limits the emulsionpolymerization process, especially in relation to the rheological behavior of thereaction mixture. In the beginning of a high solids polymerization, the reactionmixture has a relatively low viscosity with Newtonian rheological behavior.However, during the course of the batch process the reaction mixture becomesmore viscous and in many cases the rheological properties change from Newtonianinto pseudo-plastic behavior, see chapter 5. The change in viscosity and rheologicalbehavior may strongly reduce the heat transfer rate during emulsionpolymerization. Supposing good emulsion stability during polymerization, apractical approach would be to use a pre-mixer suitable for the emulsificationprocess and to adapt the stirring device in the reactor to the pseudo-plasticrheology, see chapter 6.
Summarizing Figure 7.1, the emulsion polymerization process is limited by thelack of colloidal stability of the latex-particles above, below and right to theoperating window. Obviously, the colloidal stability is affected by different causes.Left to the production window, emulsification and heat transfer limit the process.
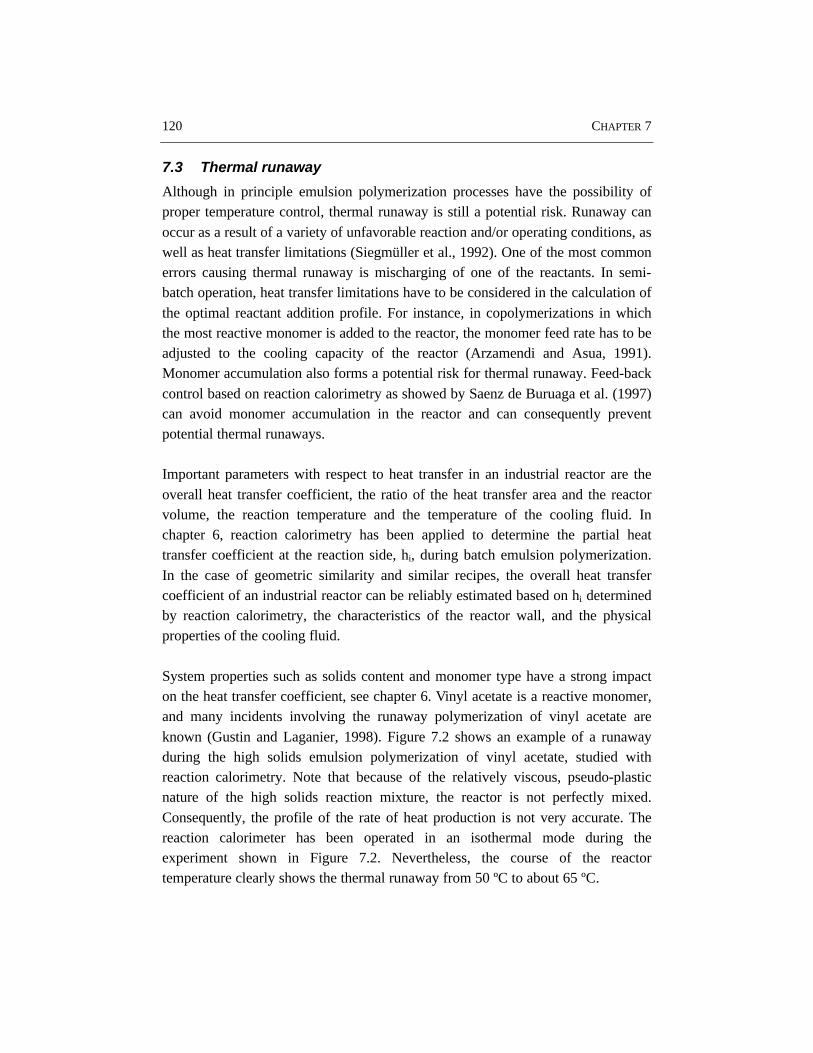
120 CHAPTER 7
7.3 Thermal runaway
Although in principle emulsion polymerization processes have the possibility ofproper temperature control, thermal runaway is still a potential risk. Runaway canoccur as a result of a variety of unfavorable reaction and/or operating conditions, aswell as heat transfer limitations (Siegmüller et al., 1992). One of the most commonerrors causing thermal runaway is mischarging of one of the reactants. In semi-batch operation, heat transfer limitations have to be considered in the calculation ofthe optimal reactant addition profile. For instance, in copolymerizations in whichthe most reactive monomer is added to the reactor, the monomer feed rate has to beadjusted to the cooling capacity of the reactor (Arzamendi and Asua, 1991).Monomer accumulation also forms a potential risk for thermal runaway. Feed-backcontrol based on reaction calorimetry as showed by Saenz de Buruaga et al. (1997)can avoid monomer accumulation in the reactor and can consequently preventpotential thermal runaways.
Important parameters with respect to heat transfer in an industrial reactor are theoverall heat transfer coefficient, the ratio of the heat transfer area and the reactorvolume, the reaction temperature and the temperature of the cooling fluid. Inchapter 6, reaction calorimetry has been applied to determine the partial heattransfer coefficient at the reaction side, hi, during batch emulsion polymerization.In the case of geometric similarity and similar recipes, the overall heat transfercoefficient of an industrial reactor can be reliably estimated based on hi determinedby reaction calorimetry, the characteristics of the reactor wall, and the physicalproperties of the cooling fluid.
System properties such as solids content and monomer type have a strong impacton the heat transfer coefficient, see chapter 6. Vinyl acetate is a reactive monomer,and many incidents involving the runaway polymerization of vinyl acetate areknown (Gustin and Laganier, 1998). Figure 7.2 shows an example of a runawayduring the high solids emulsion polymerization of vinyl acetate, studied withreaction calorimetry. Note that because of the relatively viscous, pseudo-plasticnature of the high solids reaction mixture, the reactor is not perfectly mixed.Consequently, the profile of the rate of heat production is not very accurate. Thereaction calorimeter has been operated in an isothermal mode during theexperiment shown in Figure 7.2. Nevertheless, the course of the reactortemperature clearly shows the thermal runaway from 50 ºC to about 65 ºC.
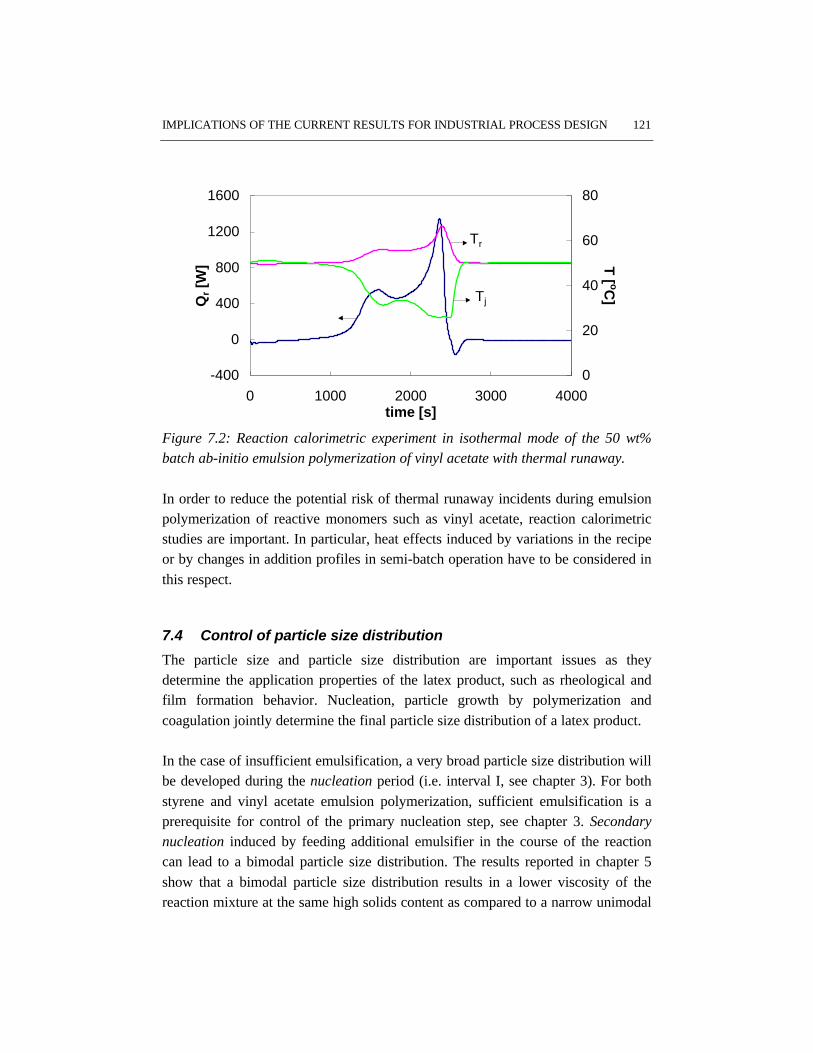
IMPLICATIONS OF THE CURRENT RESULTS FOR INDUSTRIAL PROCESS DESIGN 121
-400
0
400
800
1200
1600
0 1000 2000 3000 4000time [s]
Qr [
W]
0
20
40
60
80T
[ oC]
Tr
Tj
Figure 7.2: Reaction calorimetric experiment in isothermal mode of the 50 wt%batch ab-initio emulsion polymerization of vinyl acetate with thermal runaway.
In order to reduce the potential risk of thermal runaway incidents during emulsionpolymerization of reactive monomers such as vinyl acetate, reaction calorimetricstudies are important. In particular, heat effects induced by variations in the recipeor by changes in addition profiles in semi-batch operation have to be considered inthis respect.
7.4 Control of particle size distribution
The particle size and particle size distribution are important issues as theydetermine the application properties of the latex product, such as rheological andfilm formation behavior. Nucleation, particle growth by polymerization andcoagulation jointly determine the final particle size distribution of a latex product.
In the case of insufficient emulsification, a very broad particle size distribution willbe developed during the nucleation period (i.e. interval I, see chapter 3). For bothstyrene and vinyl acetate emulsion polymerization, sufficient emulsification is aprerequisite for control of the primary nucleation step, see chapter 3. Secondarynucleation induced by feeding additional emulsifier in the course of the reactioncan lead to a bimodal particle size distribution. The results reported in chapter 5show that a bimodal particle size distribution results in a lower viscosity of thereaction mixture at the same high solids content as compared to a narrow unimodal
122 CHAPTER 7
particle size distribution. Secondary nucleation, induced by a momentary additionof emulsifier during high solids emulsion polymerization, leads to a considerableimprovement of temperature control as compared to a regular high solids emulsionpolymerization (Mayer et al., 1994). In this mode of operation, the heat transfer isfacilitated, because the lower viscosity prevents stagnant zones near the reactorwall, see e.g. Meuldijk et al. (1998).
Proper mixing of monomer, initiator and emulsifier streams in semi-batch emulsionpolymerization processes is essential in controlling the particle growth by
polymerization. For example, if the time constant for mixing of an initiator feedstream with the reaction mixture is larger than the time constant for coagulation,severe coagulation may occur near the addition point due to a locally highelectrolyte concentration. In case of poor mixing of an emulsifier feed stream withthe reaction mixture, the added emulsifier cannot provide sufficient colloidalstability over the entire reactor contents, while locally high emulsifierconcentrations may give rise to some secondary nucleation, see chapter 5.
It follows from the results with sodium dodecyl sulfate as the emulsifier (chapter 4)that coagulation of the latex particles can be controlled by a ‘robust’ recipe interms of proper stabilization with emulsifier and a low ionic strength. In this case,Brownian coagulation is the predominant mechanism, whereas shear effects arenegligible. Operating conditions in terms of reactor scale, impeller type, diameterand speed do not affect the colloidal stability of the submicron polymer particles(Kemmere, et al, 1998; Melis et al., 1999).
In this chapter some major implications of the work described in this thesis forindustrial emulsion polymerization processes have been discussed. The results ofthe emulsion polymerization of styrene and vinyl acetate with sodium dodecylsulfate as the emulsifier are representative for many other emulsion polymerizationprocesses. Styrene and vinyl acetate emulsion polymerizations are systems thatdiffer extremely in their properties in terms of water solubility (nucleationmechanism) and reactivity of the monomers. This implies that most monomersshow intermediate behavior. Some differences might occur between laboratorywork and industrial practice. For instance, in industry purification of monomers bydistillation is not common practice. The presence of inhibitors in the reactionmixture influences both the course of the emulsion polymerization and the productproperties (Kemmere et al., 1999). Another example is the application of
IMPLICATIONS OF THE CURRENT RESULTS FOR INDUSTRIAL PROCESS DESIGN 123
disproportionated rosin acid soap (DRAS), which is commonly used as theemulsifier in the industrial production of rubbers. Since DRAS is a natural productobtained from pine trees, it contains all kinds of inhibiting and/or retardingcomponents, in varying amounts. Significant effects of the retarders present inDRAS on the polymerization rate have been shown by Mayer et al. (1995). Inindustrial emulsion polymerization processes, control of product propertiesrequires to work with well-defined raw materials. This implies that at least theeffects of impurities on the kinetics of emulsion polymerization have to be known.
The present insights enable the selection of a process design that guaranteessufficient emulsification, colloidal stability, control of particle size distribution, andproper heat transfer. Nevertheless, it has to be kept in mind that only a properbalance between the recipe and process conditions allows for a robust operation,yielding high-quality products.
7.5 References
Arzamendi, G, Asua, J.M., (1991), Ind. Eng. Chem. Res., 30 1342
Brooks, B.W., (1997), Ind. Eng. Chem. Res., 36, 1158
Gustin, J.L., Laganier, F., (1998), Dechema Monographs, 134, 613
Kemmere, M.F., Mayer, M.J.J., Meuldijk, J., Drinkenburg, A.A.H., (1999), J. Appl. Polym. Sci., 71,2419
Kemmere, M.F., Meuldijk, J., Drinkenburg, A.A.H., German, A.L., (1998), J. Appl. Polym. Sci., 69,2409
Klosterman, R., Behnke, S., Hungenberg, K.D., Kröner, H., Manders, B., Morrison, B., (1998),Dechema Monographs, 134, 295
Mayer, M.J.J., Meuldijk, J., Thoenes, D., (1994), Chem. Eng. Sci., 49, 24B, 4971
Mayer, M.J.J., Meuldijk, J., Thoenes, D., (1995), J. Appl. Polym. Sci., 56, 119
Melis S., Kemmere, M., Meuldijk, J., Storti, G. Morbidelli, M., (1999), Chem. Eng. Sci., in press
Meuldijk J., Boomen, F.H.A.M.van den, Kemmere, M.F., Wijers, J.G., (1998), Entropie, 212/213, 13
Oldshue, J.Y., (1983), Fluid mixing technology, McGraw-Hill
Reichert, K.H. and Moritz, H.U., (1989), Compr. Polym. Sci., 3, 327
Sáenz de Buruaga, I., Echevarrío, A., Armitage, P.D., Cal de la, J.C., Leiza, J.R., Asua, J.M., (1997),AIChE J., 43, (4), 1069
Siegmüller, C., Velo., E., Recasens, F., (1992), Chem. Eng. Comm., 117, 455

124 CHAPTER 7
NOTATION 125
8 NOTATION
1/2 P 45º pitched six-bladed impeller with d = 1/2 D1/2 T Rushton turbine impeller with d = 1/2 D1/3 P 45º pitched six-bladed impeller with d = 1/3 D1/3 T Rushton turbine impeller with d = 1/3 D4P 45º pitched downflow four-bladed impeller6P 45º pitched downflow six-bladed impeller6T Rushton turbine impellera thermal diffusivity [m2/s]A heat transfer area [m2]AE area occupied by one emulsifier molecule [m2/mol]Ainner jacket wall total internal wall surface of jacket [m2]Ap particle surface per unit volume of aqueous phase [m2/mw
3]C clearance of impeller from tank bottom [m]C’ constant for maximum droplet size equation 3.2 [-]C’’ constant for minimal droplet size equation 3.3 [-]C’’’ constant for N*
vis equation 3.5 [-]CB buffer concentration [kmol/mw
3]CCMC critical micelle concentration [kmol/mw
3]CE overall emulsifier concentration [kmol/mw
3]CE
* hypothetical emulsifier concentration, needed to occupycompletely empty particle surface [kmol/mw
3]CE,aq,loc local emulsifier concentration in the aqueous phase near added
emulsifier feed stream [kmol/mw3]
CE,aq,ov overall emulsifier concentration in the aqueous phase[kmol/mw
3]CE,ov overall emulsifier concentration [kmol/mw
3]CE,ov* overall emulsifier concentration after addition of extra emulsifier
[kmol/mw3]
CE,solution emulsifier concentration in titration solution [kmol/mw3]
CI initiator concentration [kmol/mw3]
CM0 initial monomer concentration [kmol/mw3]
CMC carboxy methyl cellulosesCNa+ overall electrolyte concentration [kmol/mw
3]Cp,i specific heat capacity of inserts in reactor [J/(kg K)]
126 CHAPTER 8
Cp,o specific heat capacity of liquid inside jacket [J/(kg K)]Cp,r specific heat capacity of liquid inside reactor [J/(kg K)]CSh coefficient for shear coagulation [-]d impeller diameter [m]D mass of dry cups, equations 2.3 and 2.4 [kg]D internal tank diameter [m]ddrop droplet size [m]d’p,v calculated volume averaged diameter of final latex when there is
neither secondary nucleation nor limited coagulation duringpolymerization [m]
db diameter baffles [m]dh hydraulic diameter given by equation 6.9 [m]DI inner diameter of reactor [m]dL impeller diameter of lab reactor [m]DLS dynamic light scatteringdmax maximum stable droplet size before break up occurs [m]dmin minimal stable droplet size before coalescence occurs [m]do outer diameter of reactor [m]dP impeller diameter of plant reactor [m]dp particle diameter [m]dp,s surface averaged particle diameter [m]dp,v volume averaged particle diameter [m]dp,v final volume averaged particle diameter of final latex [m]dw thickness of reactor wall [m]E mass of empty cups [kg]EGDMA ethylene glycol dimethacrylateF mass of full cups, equations 2.3 and 2.4 [kg]F interaction force between two droplets [N]f1 volume fraction of small particles [-]f2 volume fraction of large particles [-]fds mass fraction of solids except for polymer [-]fm mass fraction of monomer in the recipe [-]fm+s mass fraction of monomer and seed [-]fparticles volume fraction of monomer swollen particles in the reaction
mixture [-]g acceleration due to gravity [m/s2]H height of reactor [m]
NOTATION 127
hdi fouling factor of wall inside reactor [W/(m2 K)]hdo fouling factor of wall outside reactor [W/(m2 K)]Hfill height of reactor filled with liquid [m]hi partial heat transfer coefficient inside reactor [W/(m2 K)]ho partial heat transfer coefficient outside reactor [W/(m2 K)]JBr coagulation rate for Brownian coagulation [1/mw
3 s]JSh coagulation rate for shear coagulation [1/mw
3 s]K consistency index [Pa sn]kB Boltzmann constant [J/K]ki conductivity of liquid inside reactor [W/(m K)]ko conductivity of liquid inside jacket [W/(m K)]kw conductivity of reactor wall [W/(m K)]l impeller blade length [m]LDV laser doppler velocimetryM monomer weight fraction in recipe [-]MEA mono ethanol aminemE,tot,added amount of emulsifier added at intersection point [mol]mE,p amount of emulsifer taken up by latex particles [mol]mi mass of inserts in reactor [kg]MM mass of liquid-liquid mixture [kg]Mmon mass of initial added monomer [kg]mr mass of liquid in reactor [kg]Mrm mass of reaction mixture [kg]Mseed mass of polymer in seed-latex [kg]Mwt molecular weightN particle number [1/mw
3]n power law exponent [-]N* lowest impeller speed for proper emulsification [1/s]N*
pol lowest impeller speed for proper emulsification as determinedby polymerization experiments [1/s]
N*seed lowest impeller speed for proper emulsification with polymer
particles present in the mixture [1/s]N*
vis lowest impeller speed for proper emulsification as determinedby visualization experiments [1/s]
N0 initial particle number [1/mw3]
N1 particle number of small particles [1/mw3]
N2 particle number of large particles [1/mw3]
128 CHAPTER 8
Nc circulation number [-]Ni impeller speed [1/s]Ni,0 reference impeller speed in Wilson method, equation 6.12 [s-1]NiL stirrer speed of lab reactor [s-1]NiP stirrer speed of plant reactor [s-1]NP power number [-]Nui Nusselt number of liquid inside reactor [-]Nuo Nusselt number of liquid inside jacket [-]P polymer weight fraction [-]P power input [W]Pri Prandtl number of liquid inside reactor [-]Pro Prandtl number of liquid inside jacket [-]PS polystyrenePSD particle size distributionPTA phosphotungstic acidPVAc polyvinyl acetateq heat flux [W/m2]Q discharge rate [m3/s]Qc calibration heat [W]Qr rate of heat production [W]R ratio in particle size between large and small particlesRe Reynolds number [-]Rei Reynolds number of liquid inside reactor [-]Reo Reynolds number of liquid inside jacket [-]Rp reaction rate [mol/mw
3 s]S StyreneSDS sodium dodecyl sulfateSPS sodium persulfatet time [s]Ta corrected temperature inside jacket [K]tb thickness baffles [m]tc circulation time [s]Tc temperature of cold liquid [K]TEM transmission electron microscopyTg glass transition temperature [ºC]Th temperature of hot liquid [K]Tq torque [N m]
NOTATION 129
Tr temperature inside reactor [K]U overall heat transfer coefficient [W/(m2 K)]u2(d) mean square of relative velocity fluctuations between two
diametrically opposite points on the surface of droplets [m2/s2]UAc uranyl acetateVAc vinyl acetateVE electrostatic repulsion energy [J]Vi viscosity number [-]Vjacket volume of jacket [m3]VM volume of liquid-liquid system [m3]vo liquid velocity inside jacket [m/s]Vos osmotic interaction energy [J]Vp volume of monomer swollen polymer particles [m3]VR volume of reaction mixture [m3]VS steric repulsion energy [J]Vtot overall potential energy [J]VVDW Van der Waals attraction energy [J]Vvr volume restriction interaction energy [J]Vw,int.point volume of aqueous phase at intersection point [mw
3]Vw,latex volume of aqueous phase in latex sample [mw
3]w impeller blade width [m]WBr stability coefficient for Brownian coagulation [-]We Weber number [-]WSh stability coefficient for shear coagulation [-]X conversion [-]XE conversion at which a pulse of extra emulsifier is added [-]Xfinal conversion of final latex [-]Xm conversion at which the monomer droplets disappear [-]
Greek
α constant of the Cross model [sβ]
α constant of N*vis equation, characteristic for impeller type 3.5 [-]
β index of the Cross model [-]
β proportionality factor in Wilson method, eq. 6.12 [(m2 K)/W]
β exponent of relation between droplet size and mean energydissipation (equation 3.10) [-]
130 CHAPTER 8
χ parameter which indicates the effect of secondary nucleation orcoagulation during polymerization [%] (see equation 5.13)
ε energy dissipation in the vessel [W/kg]
εav average energy dissipation [W/kg]
εav,power mean energy dissipation based on power number [W/kg]
εav,torque mean energy dissipation based on torque measurement [W/kg]
φ mass fraction monomer in the recipe [-]
Φ(ηd/ηc) function dependent on the ratio of dynamic viscosity ofcontinuous and dispersed phase [-]
φM mass fraction of monomer in the mixture [-]
Φ(TR) resistance term in Wilson method, equation 6.12 [(m2 K)/W]
φV volume fraction of monomer in the mixture [-]
γ shear rate [1/s]
γeff effective shear rate [1/s]
η viscosity [Pa s]
η∞ viscosity at infinite shear rate [Pa s]
η0 viscosity at zero shear rate [Pa s]
ηapp apparent viscosity [Pa s]
ηapp,eff effective apparent viscosity [Pa s]
ηc dynamic viscosity of continuous phase [Pa s]
ηd dynamic viscosity of dispersed phase [Pa s]
ηi viscosity of liquid inside reactor [Pa s]
ηM dynamic viscosity of liquid-liquid mixture [Pa s]
ηo viscosity of liquid inside jacket [Pa s]
ηwL viscosity at wall temperature in lab reactor [Pa s]
ηwP viscosity at wall temperature in plant reactor [Pa s]
κ constant for the equation 5.7 of effective shear rate [-]
νc kinematic viscosity of continuous phase [m2/s]
θ fractional surface coverage [-]
θcrit critical surface coverage of the polymer particles with emulsifierbelow which coagulation occurs [-]
ρ density [kg/m3]
∆ρ difference in density between continuous and dispersed phase[kg/ m3]
ρc density of continuous phase [kg/m3]
NOTATION 131
ρi density of liquid inside reactor [kg/m3]
ρm density of monomer [kg/m3]
ρM density of liquid-liquid system [kg/m3]
ρo density of liquid inside jacket [kg/m3]
ρp density of polymer [kg/m3]
ρrm density of reaction mixture [kg/m3]
ρw density of water [kg/m3]
σ interfacial tension [N/m]
σ deviation of given value [AU]
τ shear stress [Pa]

132 CHAPTER 8

APPENDIX A 133

134 APPENDIX A

APPENDIX A 135

136 APPENDIX A

APPENDIX A 137

138 APPENDIX A

APPENDIX A 139

140 APPENDIX A

APPENDIX A 141

142 APPENDIX A
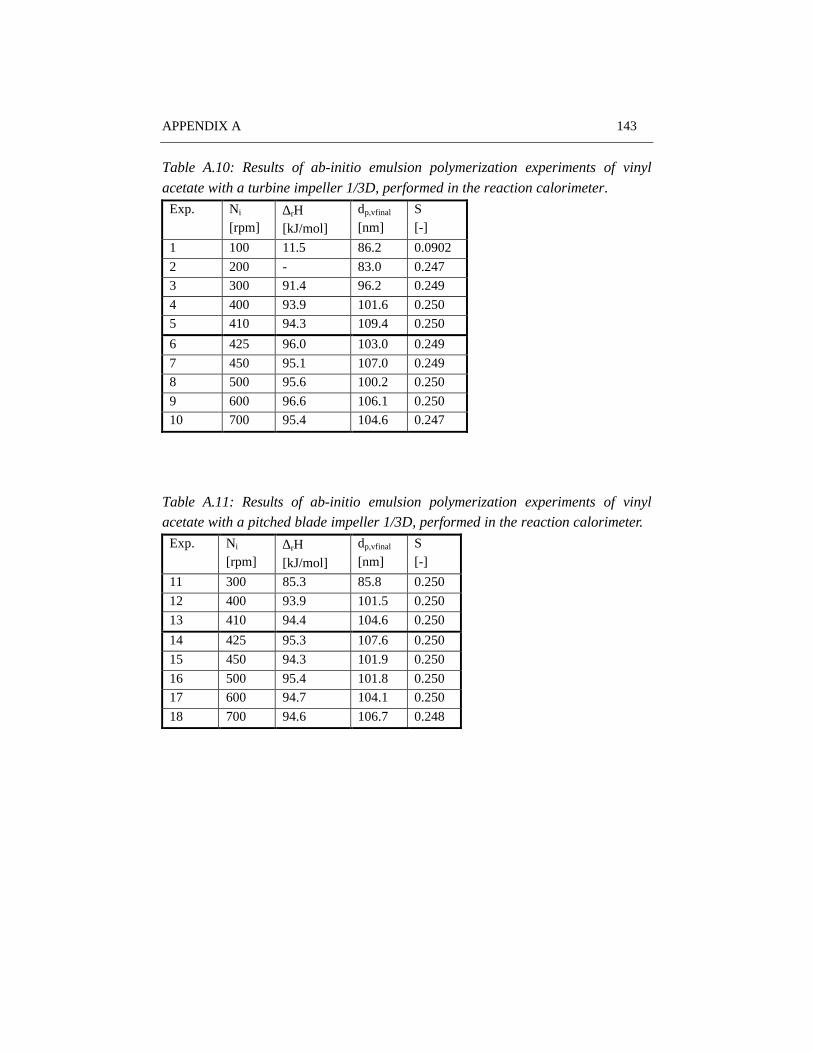
APPENDIX A 143
Table A.10: Results of ab-initio emulsion polymerization experiments of vinyl
acetate with a turbine impeller 1/3D, performed in the reaction calorimeter.
Exp. Ni
[rpm]∆rH[kJ/mol]
dp,vfinal
[nm]S[-]
1 100 11.5 86.2 0.0902
2 200 - 83.0 0.247
3 300 91.4 96.2 0.249
4 400 93.9 101.6 0.250
5 410 94.3 109.4 0.250
6 425 96.0 103.0 0.249
7 450 95.1 107.0 0.249
8 500 95.6 100.2 0.250
9 600 96.6 106.1 0.250
10 700 95.4 104.6 0.247
Table A.11: Results of ab-initio emulsion polymerization experiments of vinylacetate with a pitched blade impeller 1/3D, performed in the reaction calorimeter.
Exp. Ni
[rpm]∆rH[kJ/mol]
dp,vfinal
[nm]S[-]
11 300 85.3 85.8 0.250
12 400 93.9 101.5 0.250
13 410 94.4 104.6 0.250
14 425 95.3 107.6 0.250
15 450 94.3 101.9 0.250
16 500 95.4 101.8 0.250
17 600 94.7 104.1 0.250
18 700 94.6 106.7 0.248
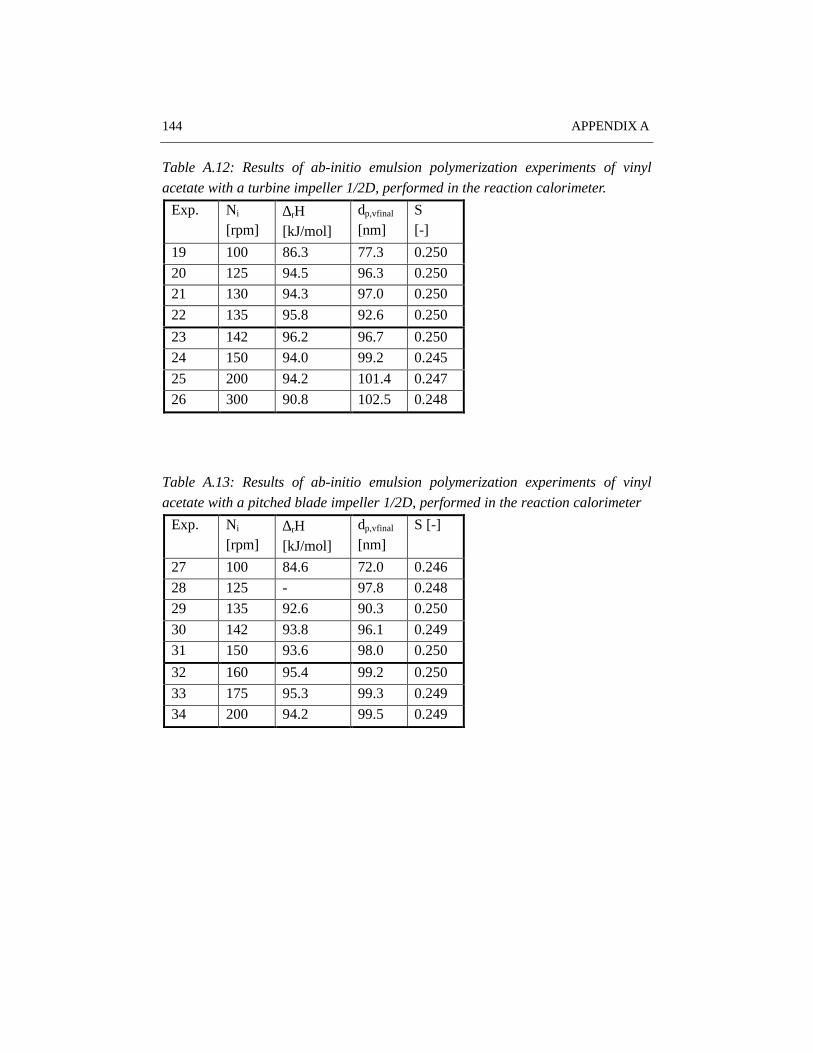
144 APPENDIX A
Table A.12: Results of ab-initio emulsion polymerization experiments of vinyl
acetate with a turbine impeller 1/2D, performed in the reaction calorimeter.
Exp. Ni
[rpm]∆rH[kJ/mol]
dp,vfinal
[nm]S[-]
19 100 86.3 77.3 0.250
20 125 94.5 96.3 0.250
21 130 94.3 97.0 0.250
22 135 95.8 92.6 0.250
23 142 96.2 96.7 0.250
24 150 94.0 99.2 0.245
25 200 94.2 101.4 0.247
26 300 90.8 102.5 0.248
Table A.13: Results of ab-initio emulsion polymerization experiments of vinyl
acetate with a pitched blade impeller 1/2D, performed in the reaction calorimeter
Exp. Ni
[rpm]∆rH[kJ/mol]
dp,vfinal
[nm]S [-]
27 100 84.6 72.0 0.246
28 125 - 97.8 0.248
29 135 92.6 90.3 0.250
30 142 93.8 96.1 0.249
31 150 93.6 98.0 0.250
32 160 95.4 99.2 0.250
33 175 95.3 99.3 0.249
34 200 94.2 99.5 0.249
APPENDIX B 145
APPENDIX B
ADDITIONAL DATA FOR CHAPTER 6
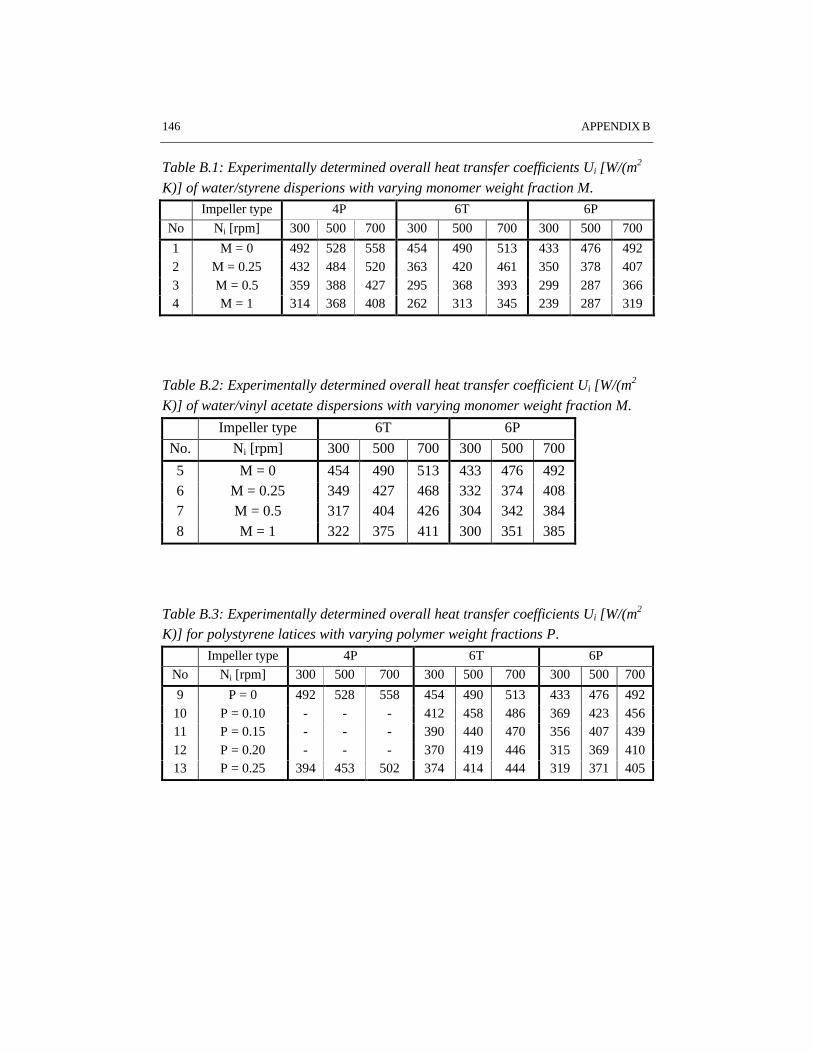
146 APPENDIX B
Table B.1: Experimentally determined overall heat transfer coefficients Ui [W/(m2
K)] of water/styrene disperions with varying monomer weight fraction M.
Impeller type 4P 6T 6P
No Ni [rpm] 300 500 700 300 500 700 300 500 700
1 M = 0 492 528 558 454 490 513 433 476 4922 M = 0.25 432 484 520 363 420 461 350 378 4073 M = 0.5 359 388 427 295 368 393 299 287 3664 M = 1 314 368 408 262 313 345 239 287 319
Table B.2: Experimentally determined overall heat transfer coefficient Ui [W/(m2
K)] of water/vinyl acetate dispersions with varying monomer weight fraction M.
Impeller type 6T 6P
No. Ni [rpm] 300 500 700 300 500 700
5 M = 0 454 490 513 433 476 4926 M = 0.25 349 427 468 332 374 4087 M = 0.5 317 404 426 304 342 3848 M = 1 322 375 411 300 351 385
Table B.3: Experimentally determined overall heat transfer coefficients Ui [W/(m2
K)] for polystyrene latices with varying polymer weight fractions P.
Impeller type 4P 6T 6P
No Ni [rpm] 300 500 700 300 500 700 300 500 700
9 P = 0 492 528 558 454 490 513 433 476 49210 P = 0.10 - - - 412 458 486 369 423 45611 P = 0.15 - - - 390 440 470 356 407 43912 P = 0.20 - - - 370 419 446 315 369 41013 P = 0.25 394 453 502 374 414 444 319 371 405
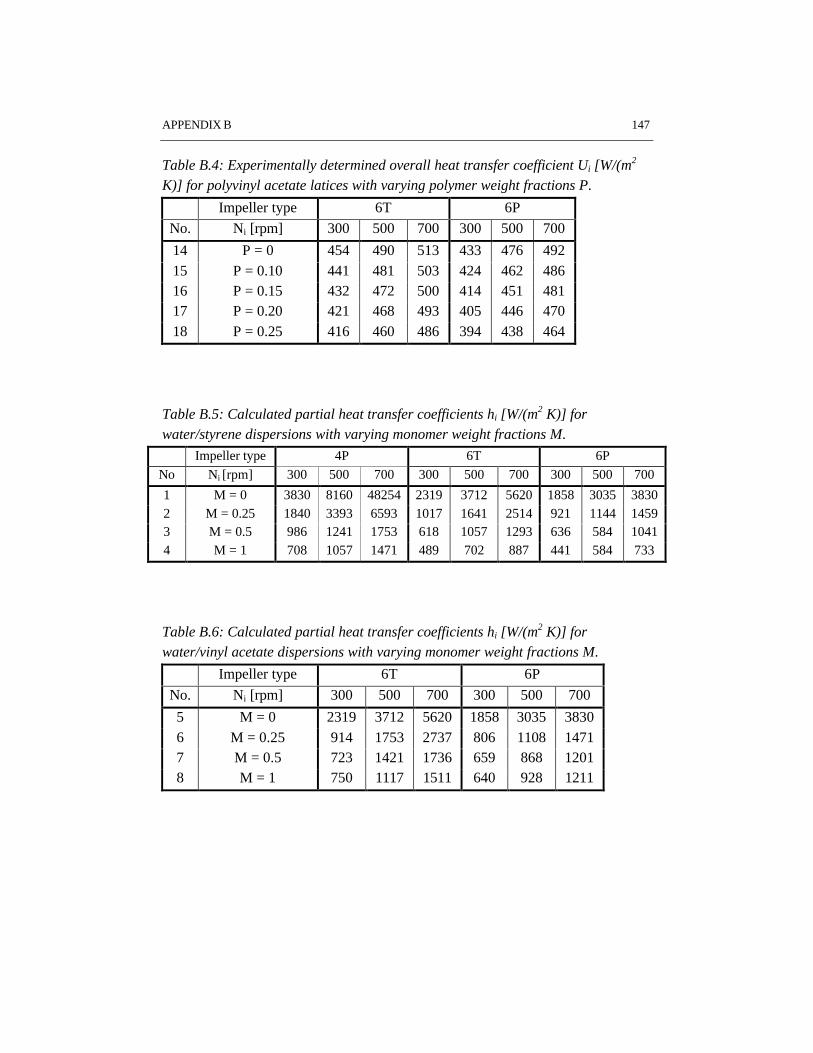
APPENDIX B 147
Table B.4: Experimentally determined overall heat transfer coefficient Ui [W/(m2
K)] for polyvinyl acetate latices with varying polymer weight fractions P.
Impeller type 6T 6P
No. Ni [rpm] 300 500 700 300 500 700
14 P = 0 454 490 513 433 476 49215 P = 0.10 441 481 503 424 462 48616 P = 0.15 432 472 500 414 451 48117 P = 0.20 421 468 493 405 446 47018 P = 0.25 416 460 486 394 438 464
Table B.5: Calculated partial heat transfer coefficients hi [W/(m2 K)] forwater/styrene dispersions with varying monomer weight fractions M.
Impeller type 4P 6T 6P
No Ni [rpm] 300 500 700 300 500 700 300 500 700
1 M = 0 3830 8160 48254 2319 3712 5620 1858 3035 38302 M = 0.25 1840 3393 6593 1017 1641 2514 921 1144 14593 M = 0.5 986 1241 1753 618 1057 1293 636 584 10414 M = 1 708 1057 1471 489 702 887 441 584 733
Table B.6: Calculated partial heat transfer coefficients hi [W/(m2 K)] forwater/vinyl acetate dispersions with varying monomer weight fractions M.
Impeller type 6T 6P
No. Ni [rpm] 300 500 700 300 500 700
5 M = 0 2319 3712 5620 1858 3035 38306 M = 0.25 914 1753 2737 806 1108 14717 M = 0.5 723 1421 1736 659 868 12018 M = 1 750 1117 1511 640 928 1211
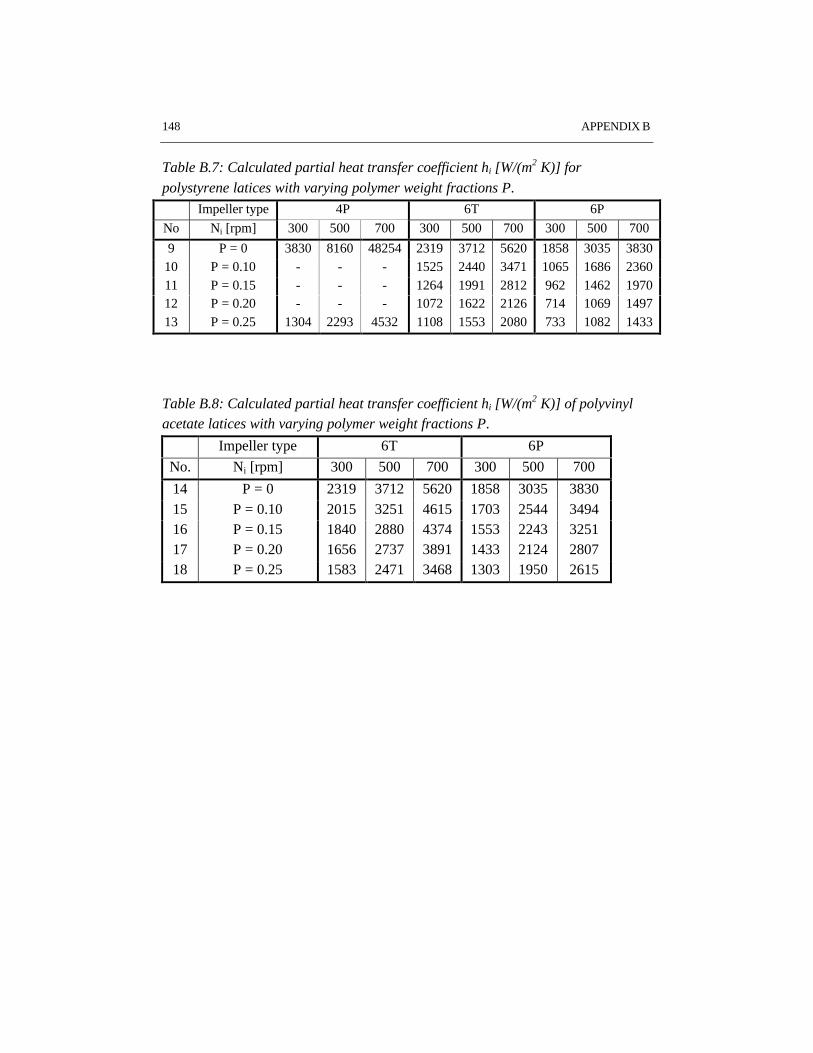
148 APPENDIX B
Table B.7: Calculated partial heat transfer coefficient hi [W/(m2 K)] for
polystyrene latices with varying polymer weight fractions P.
Impeller type 4P 6T 6P
No Ni [rpm] 300 500 700 300 500 700 300 500 700
9 P = 0 3830 8160 48254 2319 3712 5620 1858 3035 383010 P = 0.10 - - - 1525 2440 3471 1065 1686 236011 P = 0.15 - - - 1264 1991 2812 962 1462 197012 P = 0.20 - - - 1072 1622 2126 714 1069 149713 P = 0.25 1304 2293 4532 1108 1553 2080 733 1082 1433
Table B.8: Calculated partial heat transfer coefficient hi [W/(m2 K)] of polyvinylacetate latices with varying polymer weight fractions P.
Impeller type 6T 6P
No. Ni [rpm] 300 500 700 300 500 700
14 P = 0 2319 3712 5620 1858 3035 383015 P = 0.10 2015 3251 4615 1703 2544 349416 P = 0.15 1840 2880 4374 1553 2243 325117 P = 0.20 1656 2737 3891 1433 2124 280718 P = 0.25 1583 2471 3468 1303 1950 2615
149
DANKWOORD
Op de eerste plaats wil ik alle medewerkers van de capaciteitsgroepProcesontwikkeling bedanken voor de collegialiteit en de prima sfeer binnen degroep. Speciale dank gaat uit naar mijn copromotor Jan Meuldijk voor zijn grotebetrokkenheid en het nimmer aflatende enthousiasme voor dit onderzoek. Graagwil ik mijn promotor Bart Drinkenburg bedanken voor het in mij gesteldevertrouwen en zijn doortastendheid. De introductie in de emulsiepolymerisatiewereld door mijn tweede promotor Ton German heb ik erg gewaardeerd, alsmedede inhoudelijke discussies tijdens mijn onderzoek. Dick Thoenes en JohnCongalidis wil ik hartelijk danken voor het kritisch lezen van mijn proefschrift.
I would like to thank Stefano Melis and Massimo Morbidelli for the fruitfulcooperation concerning the colloidal stability in latex systems. The financialsupport by the Foundation of Emulsion Polymerization (SEP) is gratefullyacknowledged.
In het bijzonder bedank ik de afstudeerders Eline Beulens, Jorg Coolen, MarkJetten, Marianne Kuppens, Remco Lensing, Laurens Limpens, Peter van Loon,Henk Meulendijks en Freek Ulkeman, alsmede de stagiaires Bram Arets, ArminBoonstra, Graham Gaffney, Roland Groenen, Jeroen Groenhagen, Peter van Loon,Mike Schellekens en Emile Snijders voor de uitstekende samenwerking en voor hetleveren van de enorme schat aan experimentele data.
Tenslotte wil ik mijn vrienden en familie bedanken voor de morele steun in deafgelopen jaren, in het bijzonder Hub, Mia, Alice en Rob.

150
151
PUBLICATIONS
1. I.M.J.J. van de Ven-Lucassen, M.F. Kemmere, and P.J.A.M. Kerkhof,‘Complications in the use of the Taylor dispersion method for the ternarydiffusion measurements methanol + acetone + water mixtures’, (1997), J. Sol.Chem., 26, (12), 1145
2. M.F. Kemmere, J. Meuldijk, A.A.H. Drinkenburg, and A.L. German, ‘Aspectsof coagulation during emulsion polymerization of styrene and vinyl acetate’,(1998), J. Appl. Polym. Sci., 69, 2409
3. M.F. Kemmere, J. Meuldijk, A.A.H. Drinkenburg, and A.L. German,‘Rheology and flow during high solids emulsion polymerization of styrene’,(1998), Polym. React. Eng., 6, (3&4), 243
4. J. Meuldijk, F.H.A.M. van den Boomen, M.F. Kemmere and J.G. Wijers,‘Scale sensitivity of emulsion (co)polymerisation’, (1998), Entropie, 212/213,13
5. J. Meuldijk, M.F. Kemmere and A.A.H. Drinkenburg, ‘Some aspects ofemulsion polymerization process development’, (1998), DechemaMonographien, 134, 387
6. M.F. Kemmere, M.J.J. Mayer, J. Meuldijk, and A.A.H. Drinkenburg, ‘Theinfluence of 4-tert.-butylcatechol on the emulsion polymerization process ofstyrene’, (1999), J. Appl. Polym. Sci., 71, 2419
7. M.F. Kemmere, J. Meuldijk, A.A.H. Drinkenburg, and A.L. German,‘Colloidal stability in high solids emulsion polymerization’, J. Appl. Polym.Sci., in press
8. Stefano Melis, Maartje Kemmere, Jan Meuldijk, Giuseppe Storti and MassimoMorbidelli, ‘A model for the aggregation of polyvinyl acetate particles inemulsion’, Chem. Eng. Sci., in press
152
9. M.F. Kemmere, J. Meuldijk, A.L. German, and A.A.H. Drinkenburg, ‘Batchemulsion polymerization A chemical engineering approach’, Hung. J. Ind.Chem., in press
10. M.F. Kemmere, J. Meuldijk, A.A.H. Drinkenburg, and A.L. German,‘Emulsification in batch emulsion polymerization’, accepted for publication inJ. Appl. Polym. Sci.
11. M.F. Kemmere, J. Meuldijk, A.A.H. Drinkenburg, and A.L. German, ‘Heattransfer in batch emulsion polymerization’, submitted to Polym. React. Eng.
12. M.F. Kemmere, J. Meuldijk, A.A.H. Drinkenburg, and A.L. German,‘Emulsification in emulsion polymerization of styrene and vinyl acetate Areaction calorimetric study’, in preparation
Parts of the work described in this thesis have been presented at the followingmeetings: SON Procestechnologie (Lunteren, 1997); Polymer ReactionEngineering III (Palm Coast, Florida, 1997); 7th Meeting of the Working Party onPolymer Reaction Engineering (Lyon, France, 1997); International Workshop onPolymer Reaction Engineering (Berlin, Germany, 1998); annual AICHE-meeting(Miami, Florida, 1998); 3rd Annual Polymer Producers Conference at the AIChESpring meeting (Houston, Texas, 1999), 16th Meeting of the Working Party onChemical Reaction Engineering (Veszprém, Hungary, 1999), 8th Meeting of theWorking Party on Polymer Reaction Engineering (Amsterdam, 1999).
153
CURRICULUM VITAE
Maartje Kemmere was born on December 24 1971 in Loon op Zand, The
Netherlands. After graduation from secondary school (Gymnasium β) at theTheresia Lyceum in Tilburg, she studied Chemical Engineering at the EindhovenUniversity of Technology. In August 1995 she graduated cum laude on diffusionphenomena in ternary liquid systems. The work was performed at the Laboratoryof Separation Technology of prof. dr. ir. P.J.A.M. Kerkhof. In October 1995 shestarted her PhD project on engineering aspects of batch emulsion polymerizationsupervised by dr. J. Meuldijk, prof. dr. ir. A.A.H. Drinkenburg and prof. dr. ir. A.L.German. Since January 1999 she has been working as an assistant professor in theProcess Development Group headed by prof. dr. ir. J.T.F. Keurentjes. Researchtopics include polymer reaction engineering and polymer systems for biomedicalapplications.

154