basin impacts of irrigation water conservation
DESCRIPTION
Basin Impacts of Irrigation Water Conservation. University of California Department of Environmental Sciences Riverside Frank A. Ward (NM State University) February 25, 2011. Background. Climate Change: more floods/droughts Continued Population Growth (esp poor countries) - PowerPoint PPT PresentationTRANSCRIPT

1
Basin Impacts of Irrigation Water Conservation
University of CaliforniaDepartment of Environmental Sciences
RiversideFrank A. Ward (NM State University)
February 25, 2011

2
Background• Climate Change: more floods/droughts• Continued Population Growth (esp poor countries)• Growing values reduced supplies of ecological assets• Growing values of treated urban water • Search for ways to conserve water in irrigated agriculture• Special search for ag water conservation, esp if it
protects the farm economy (food security) – technology (drip, sprinkler, water saving crops)– policy (subsidies, regulations, pricing)– Projects (infrastructure, leveling, … )

3
Road Map• Pose questions
– What is water conservation in agriculture?– What policies could promote it? – Can river basin policy models help
discover?– Findings about effects of water
conservation incentives in the Rio Grande Basin?
– Lessons learned?• About water conservation
• Generally
• Possibly for California

41
Basin Scale ChoicesWatershed runoff
Reservoir
Irrigated crops
Flooding
Urban water supply
Groundwater
Fish and wildlife
Treaty obligation
Hydropower
Compact Obligation

5
Rio Grand
e Basin

Journey down the Rio Grande
6
Snow melt: 1 a-f Rio Grande Silvery Minnow
CBP pumped water Elephant Butte, Caballo
SLV Irrigation EBID Irrigation
Sangre De Cristo Headwaters El Paso urban (sw +gw)
Heron, El Vado, Abiquiu , Cochiti West TX Irrigation
Albuquerque urban (sw + gw) Mexico Ag
MRGCD Irrigation Mexico Urban

7
High Valued Uses of Water in RGB, Albuquerque, El Paso

High Valued Use: Rio Grande Silvery Minnow
8

High Uses of Water in RGB, Irrigation
9

10
Approach

• Water Pricing and Cost Recovery• Timing, sizing, sequencing of new storage• Population growth, increased food demands, ‘more crop
per drop.’• Water rights adjudication• Meeting growing demands for environment• How to develop/allocate water for food security • Cheapest way to reduce water use (conservation)
11
Policy Debates Basin Models Can Inform

Basin Models: The Dark Side
• Too academic, too theoretical, too little use to inform real policy debates
• Nobody understands them
• Models are hungry for data that aren’t there.
• Expensive and slow to build
• Who wants to work with a bunch of academics with uncertain use of results?
12
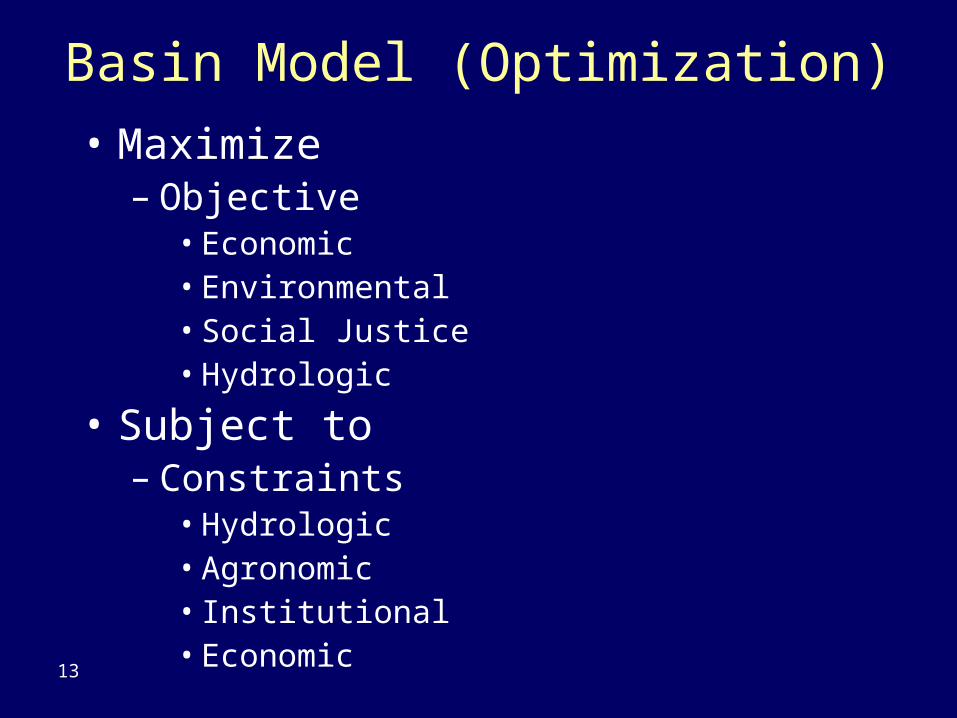
• Maximize– Objective
• Economic• Environmental• Social Justice• Hydrologic
• Subject to – Constraints
• Hydrologic• Agronomic• Institutional• Economic
13
Basin Model (Optimization)
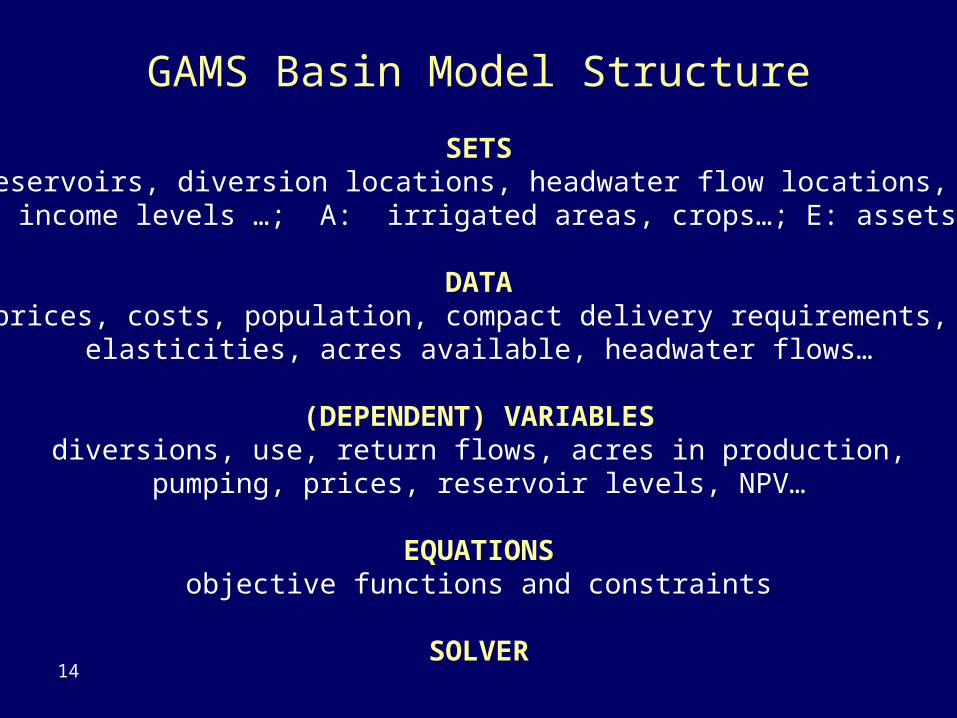
GAMS Basin Model Structure
SETSH: time, reservoirs, diversion locations, headwater flow locations, aquifers,
U: cities, income levels …; A: irrigated areas, crops…; E: assets, services
DATAprices, costs, population, compact delivery requirements,
elasticities, acres available, headwater flows…
(DEPENDENT) VARIABLESdiversions, use, return flows, acres in production,
pumping, prices, reservoir levels, NPV…
EQUATIONSobjective functions and constraints
SOLVER14

Policy Assessment Framework
15
Data
Headwater supplies
Min FlowsSharing rulesOutflows
Crop pricesCrop costsWater priceTreat costElasticitiesLand supply
Outcomes
Crop prodnCrop ET
Urban water diversions, use,Return flows,Flows by gauge
Urban, farm, environmental benefits
NPV
Baseline: no new policy
Alt 1: Constrain aquifers to return to start
Alt 2: Renew aquifers to historical levels
Policy

Connections• Connections: River basin models
– Hydrologic: stocks, flows, over time, space– Economic: optimizes total benefits from use– Agronomic: acreage, water use, crops– Demographic: urban income, population, demand– Institutional: rules that limit use or require delivery
• Use connections to gain insights for policies that best adapt to climate: resilient conservation institutions – For basin as a whole– For targeted users (farm, city, environment)
16

Aquifer mass balance
17
Inflow – Outflow = Change in Storage
Stream to Aquifer
groundwater inflow
Seepage to Aquifer
Pumping from Aquifer
Aquifer to Stream
Return flows
390 440
220
70
80

Reservoir mass balance
18
Inflow – Outflow = Change in Storage
Upstream inflow
Precipitation on Reservoir
Evaporation
Reservoir Release
390 440
220
70
80

19
Water Balance

20
Crop Water Use Data, RG Basin, NM
Crop Tech
A ET DP
Yield tons/a
cTech
A ET DPYield
tons/acac-ft/ac/yr ac-ft/ac/yr
Alfalfa f 5.0 2.2 2.9 8.0 d 2.7 2.7 0.0 10.0
Cotton f 2.8 1.2 1.6 0.4 d 1.5 1.5 0.0 0.5
Lettuce f 2.5 1.1 1.4 12.5 d 1.4 1.4 0.0 15.6
Onions f 4.0 2.3 1.7 16.9 d 2.9 2.9 0.0 21.1
Sorghum f 2.0 0.9 1.1 2.0 d 1.1 1.1 0.0 2.5
Wheat f 2.5 1.1 1.4 4.6 d 1.4 1.4 0.0 5.8Green Chile f 4.6 2.0 2.6 11.0 d 2.5 2.5 0.0 13.8Red Chile f 5.0 2.2 2.9 1.7 d 2.7 2.7 0.0 2.2Pecans f 6.0 2.6 3.4 0.6 d 3.2 3.2 0.0 0.7

NM Pecans: Water Balance
21
Drip 6’
2.6’
3.4’
Flood
3.2’ 3.2’
0
0

22
Under the Hood

23
Objective
(1 ) (1 )ut ett t
u t e tu e
NBu NBeMax NPV
r r
[ ]uckt ct uckt uckt ucktNBA P Yield Cost L
(1 )uckt
tu c k t u
NBANPV Ag
r
( . , ), ( . ., )ut etNB e g urban NB e g wetlands

• Irrigable land, Headwater supplies• Sustain key ecological assets• Hydrologic balance• Reservoir starting levels (sw, gw)• Reservoir sustainability constraints (sw, gw)• Institutional
– Endangered Species Act
– Rio Grande Compact (CO-NM; NM-TX)
– US Mexico Treaty of 1906
– Rio Grande Project water sharing history (NM/TX)
24
Constraints

• E.g.: Lobatos gauge (CO-NM border): X(Lobatos_v,1) = X(RG_h,1) - X(SLV_d,1) + X(SLV_r,1)
25
hv ht vv dvh v d
vt vt dt
rt LLr L
trv v
B X B BX X X
XB B X
Gauged Flows: Hydro Balance

26
( , , ,...)
ut uck ucktc k
X B L
u irrigated region
c crop
k irrigationtech flood drip pivot
Ag water use

27
Z Z Xrt rt L t 1
Reservoir Stocks

28
_0 1
Lobatos RG hvt h h htX B B X
0 1SA Otowi
vt h h vtX C C X
Institutions: e.g. Rio Grande Compact

• U.S. Mexico Groundwater Sharing Treaty• U.S. Mexico Water Quality Treaty• Limiting domestic well development• Adjudicate MRG water rights
29
Potential Institutional Constraints

•Ag Water Use and Savings–Status Quo–Sustain Natural Capital–Renew Natural Capital
30
Results

31
Water Use by Technology and Policy
LRGB (AF/yr, ET)
Tech UnitsBase
Alternative 1: Sustaining
Natural Capital
Alternative 2: Renewing Natural
Capital
use use change use change
Floodabsolute 146,266 94,917 -51,349 94,375 -51,891
pct 100 65 -35 65 -35
Dripabsolute 52,604 4,402 -48,202 1 -52,602
pct 100 8 -92 0 -100
Totalabsolute 198,869 99,318 -99,551 94,376 -104,493
pct 100 50 -50 47 -53

32
Lessons Learned: Water Conservation
• Farmers seek income, not conservation. Conservation must be profitable for irrigators to do it. – Subsidizing water conserving irrigation technology will
reduce water applied per unit land for a given crop– But if a water right is for total water applied to a farm
• Acreage may increase to maintain total water applied• Crop mix may change to maintain total water applied
– Reduced water applied doesn’t mean reduced water depleted by the crop.
– Requiring sustainable reservoirs and aquifers in NM reduces the use of drip irrigation.

33
Lessons Learned: Research Challenges
• Water conservation is hard to define, measure, forecast, evaluate, alter.
• Counterfactual: How much less water would have been (will be) used if X irrigation technology would have been (is) subsidized.
• River basin models are fun to build and write about, if you start small and grow them
• Check that your model re-produces what you publish.• Mathematically document model, data, assumptions.• Calculate sensitivities: i
j
Y
a

Lessons learned for California: “California Water Myths”
• California is running out of water.• ________ is responsible for California’s water problems.• We can build our way out of California’s water problems.• We can conserve our way out of California’s water problems.
– Effectiveness of conservation is often overstated. – Principle: Look for cheapest ways to reduce use. – Practice: Requires defining use, comparing B, C of saving.
• Water markets can solve California’s water problems• Healthy aquatic ecosystems conflict with a healthy economy.• More water will lead to healthy fish populations.• California’s water laws impede sustainable management.
34

35
Top 10 Lies told by Watershed Policy Modelers
1. The model is well-documented with all limits
2. The model is user-friendly
3. The model fits the data
4. Results make sense
5. The model does that
6. We did a sensitivity analysis
7. Anyone can run this model
8. This model links to other models
9. The model will be in the public domain
10. The new version fixes all previous problems