basic survey: external dose estimation radiation medical science center for the fukushima health...
TRANSCRIPT

Basic Survey: External dose estimation
Radiation Medical Science Center for the
Fukushima Health Management Survey,
Fukushima Medical University
The International Workshop on Radiation and Thyroid Cancer
Tetsuo Ishikawa, Seiji Yasumura, Akira Ohtsuru,
Akira Sakai, Kenji Kamiya, and Masafumi Abe
1
Background
2
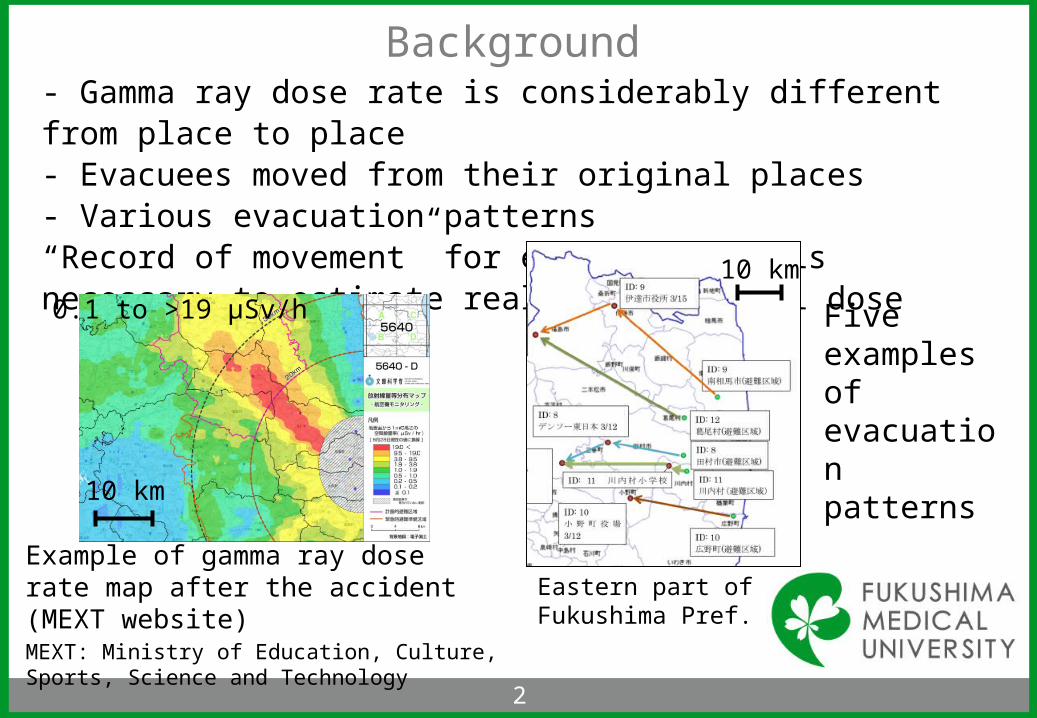
- Gamma ray dose rate is considerably different from place to place- Evacuees moved from their original places- Various evacuation patterns“Record of movement” for each resident is necessary to estimate realistic external dose
Example of gamma ray dose rate map after the accident (MEXT website)MEXT: Ministry of Education, Culture, Sports, Science and Technology
Five examples of evacuation patterns
10 km
10 km
0.1 to >19 μSv/h
Eastern part of Fukushima Pref.

Background
3
Projected dose:
The dose that would be received if no countermeasures were to be taken (IAEA Basic Safety Standard, 1996)
Similar definition in ICRP Publication 63.
Many dose estimation studies have been done after the accident
In some cases, dose estimation is based on conservative assumptions to avoid underestimation Ex. People stay outdoor all day long a kind of “projected dose” (see below) More realistic dose based on actual situations Basic Survey

Outline of Basic Survey
4
Items:
Whereabouts for each day in the period ( locations and Indoor, outdoor, or moving )
Period: March 11, 2011 – July 11, 2011
Fukushima Health Management Survey・ Basic Survey・ Four detailed Surveys
Questionnaire targeting roughly 2,050,000 people who were living, or were present, in Fukushima Prefecture as of March 11, 2011.
Changes in gamma ray dose rate in Iitate Village:After four months, gamma ray dose rate seems to be plateau
Mar
15
Apr
15
May
15
Jun
15
Jul 1
5
Aug
15
Period for dose estimation

Questionnaire of Basic Survey
5
Sample of response sheet
Children under 20y: signatures by their parents are necessary

Dose calculation (check of response sheets)
6
NIRS: National Institute of Radiological Sciences, Chiba, Japan
Records of the movement of respondents are digitized
The response sheet is sufficient ?
(any blank items?)
Sending the records to NIRS
Checking response sheets returned from the residents
Contact each respondent to completely fill in the response sheet (by telephone or mail,
more than 70,000 respondents)
NIRS dose calculation program
7
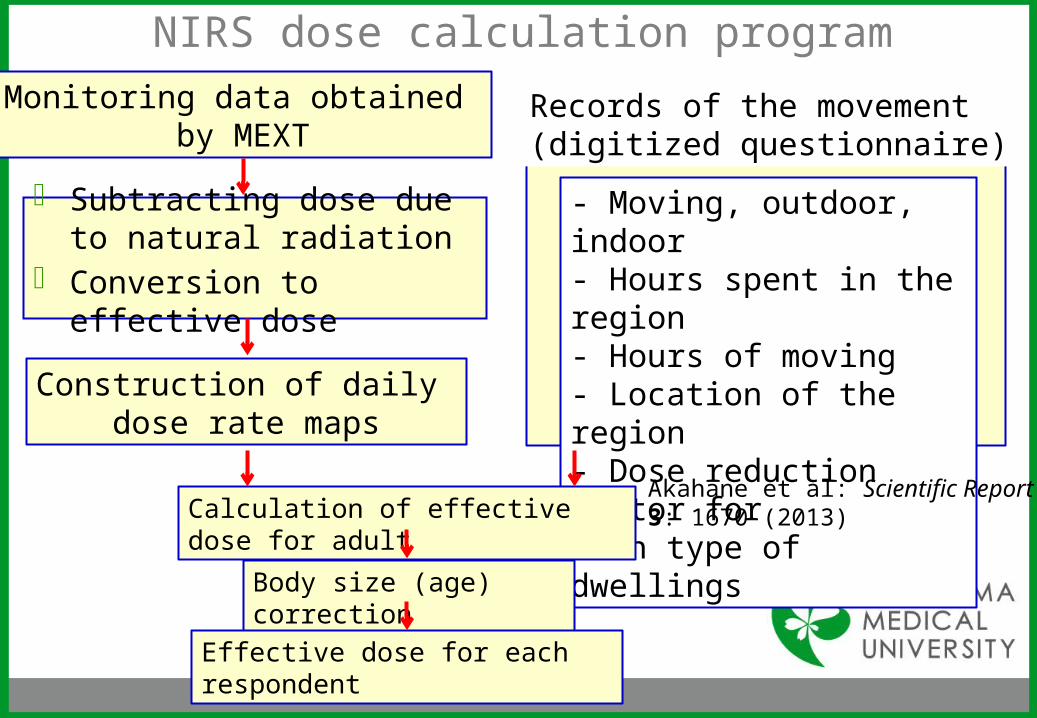
Construction of daily dose rate maps
- Moving, outdoor, indoor- Hours spent in the region- Hours of moving- Location of the region- Dose reduction factor for each type of dwellings
- Subtracting dose due to natural radiation
- Conversion to effective dose
Monitoring data obtained by MEXT
Calculation of effective dose for adult
Body size (age) correction
Effective dose for each respondent
Records of the movement(digitized questionnaire)
Akahane et al: Scientific Report 3: 1670 (2013)

How to report the results
8
FMU reports the individual external dose to each respondent by mail
The individual doses are statistically processed at FMU
Individual estimates of external dose
The results are discussed at Fukushima Prefectural Oversight Committee Meeting (once in about three months) http://www.fmu.ac.jp/radiationhealth/
Doses have been estimated for 470,234 / 515,212 respondents (91.3 %) as of 31 December 2013.

Results (whole prefecture)
9
Effective dose (mSv)
Number of respondents (excluding
radiation workers)
Ratio
< 1 305,286 66.3 %1 - 2 131,606 28.6 %2 - 3 20,403 4.4 %3 - 44 - 5> 5
1,457 578
1078
0.3 %0.1 %
0.2 % Total 460,408 100 %
Maximum: 25 mSvAverage: 0.8 mSv (As of December 31, 2013)

Results (dose distribution by regions)
10
Most of residents evacuated < 1 mSv: 78.0 %< 2 mSv: 94.7 %< 3 mSv: 97.2 %Maximum: 25 mSv
< 1 mSv: 99.38 %< 2 mSv: 99.98 %Maximum: 3.6 mSv

Results (dose distribution: adults vs. children)
11
Dose distribution was almost similar between adults ( 20y) and ≧children ( < 20y).
The number ratio of doses of > 3 mSv was higher for adults.
0 0.1 0.2 0.3 0.4 0.5 10 20 30 40 50 60 70
<11-22-33-44-55-66-77-88-9
9-1010-1111-1212-1313-1414-15
>15
Dose distribution (adults versus children)
Children
Adults
Ratio (%)
Dos
e (m
Sv)

Thyroid equivalent dose and effective dose
12
ISO irradiation geometry(adopted in the NIRS dose calculation system)
Thyroid equivalent doseEffective dose
≒ 1.1
(for gamma rays of 100-800 keV)ICRP 74
Effective doses estimated by the Basic survey Thyroid equivalent doses due to external radiation during the corresponding period

Summary
13
External doses (for the first four months after the accident) have been estimated for more than 470,000 respondents by the Basic Survey.
The effective dose distribution (excluding radiation workers): < 1 mSv, 66.3 %; <2 mSv, 94.9 %; <3 mSv, 99.3 % According to ICRP 74, the ratio of thyroid equivalent dose to
effective dose is around 1.1 in the case of isotropic irradiation geometry.
The effective dose values estimated in the Basic Survey could be similar to the thyroid equivalent doses due to external radiation during the first four months after the accident.