basic nmr hands-on operation manual - chem.umd.edu nmr hands... · for users who are not familiar...
TRANSCRIPT

NMR Facility, U. of Maryland. Fu Chen Page 1
Caution and Reminder: You are working very close to several strong super-conducting magnets in the NMR lab. Follow all safety procedures and policies as disclosed to you at the
safety orientation. To reserve spectrometer: Go to http://www2.chem.umd.edu/nmr/reservation/index.htm Use “umcp” as group name, your last name as User Name, and last four digits as your Password.
PLANNING ----- Your NMR measurements. Contact staff for additional assistance. Appointment is highly recommended for project
consultation.
Basic sample preparation:
NMR Tube: 5mm OD, 7” long. Quality grade at least for 400MHz field strength.
Amount of compound: (assuming M.W. < 1,000, soluble at room temperature, and pure)
o Solid compounds: ~ 1-- 4 mg for H-1; ~ 10 – 40 mg for C-13. o Liquid compounds: ~ 0.1 – 0.2 Volume % for H-1, ~ 5 – 15 % for C-13.
Volume of Solvent: ~ 0.5 to 0.6 ml. Deuterated solvent. Avoid mixed solvents.
Basic NMR Hands-on Operation Manual Suitable only for peer training by staff or Senior Peer ( Rev.1. 2017)
Download available at http://www2.chem.umd.edu/nmr/umcpnote/index.php

NMR Facility, U. of Maryland. Fu Chen Page 2
Prior to NMR measurement:
Insert NMR sample tube into a special holder : Select a blue plastic sample holder (also known as spinner).
Follow the recommended procedure as shown in the safety orientation.
Adjust proper position of the sample:
Improper adjustment leads to no detectable signals or breaking the NMR tube inside the
detector.
Insertion of NMR sample (with spinner) to the magnet:
1. Press “LIFT” button on the keypad (see description below). 2. A standby sample, if any, will slowly rise up to the top of the magnet. 3. Replace the sample with yours. Before releasing it, ensure the tube & spinner are supported by the
compressed air from the magnet entry port. 4. Press the “LIFT” button again to lower your sample into the magnet.
The Keypad: Located next to the console Computer.
The layout consists of a matrix of buttons. By pressing a specific button, a certain function can be modified by turning the wheel-knob. The LED flashes if a selected function fails. The value of adjustment is shown on the center LED bar. Three major groups: details will be described later in the instruction sessions. 1. Mechanical control on NMR sample. 2. Field controls (lock, sweep). 3. Shim gradient adjustments (details see Appendix A).

NMR Facility, U. of Maryland. Fu Chen Page 3
TO start TOPSPIN®, double click on PC desktop,
NMR Data: UM custom icons and pull down menu
Parameters
To execute a command: 3 options a) With the mouse: point; click; and/or drag. Icons. b) Click the command line and type in the command via key board! c) Use UM pull down menu or icons, examples as shown below
NMR Facility, U. of Maryland. Fu Chen Page 4
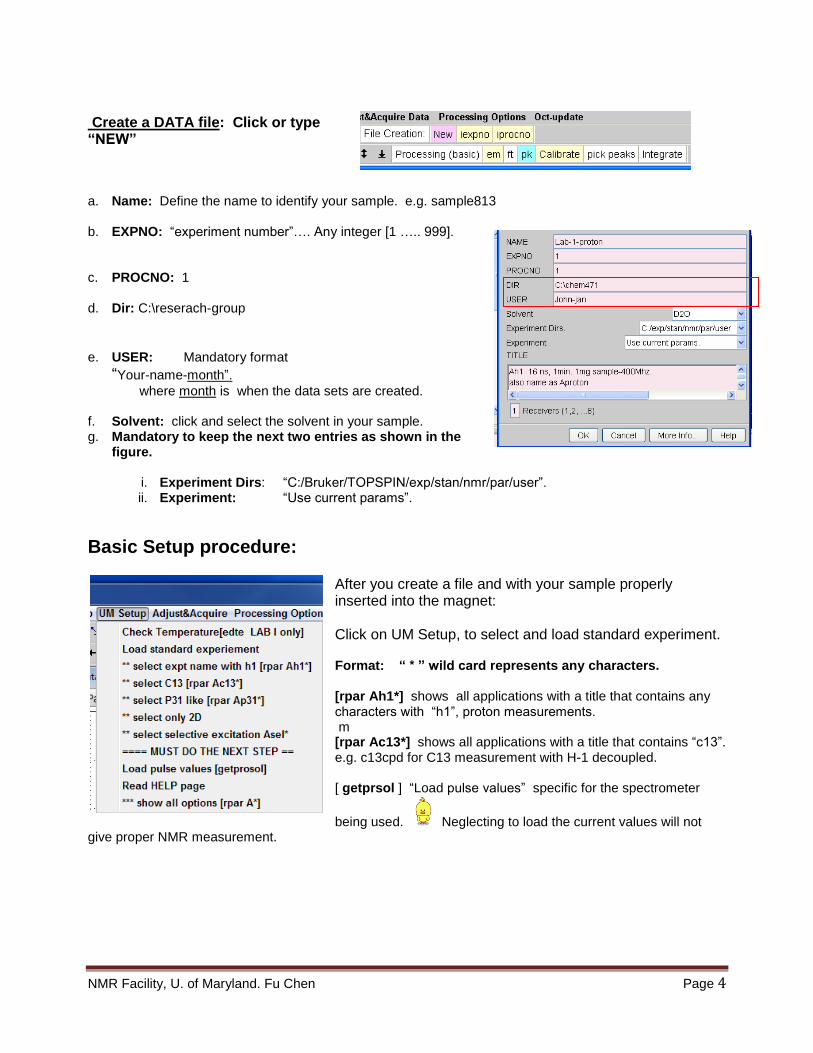
Create a DATA file: Click or type “NEW”
a. Name: Define the name to identify your sample. e.g. sample813
b. EXPNO: “experiment number”…. Any integer [1 ….. 999].
c. PROCNO: 1
d. Dir: C:\reserach-group
e. USER: Mandatory format
“Your-name-month”.
where month is when the data sets are created.
f. Solvent: click and select the solvent in your sample. g. Mandatory to keep the next two entries as shown in the
figure.
i. Experiment Dirs: “C:/Bruker/TOPSPIN/exp/stan/nmr/par/user”. ii. Experiment: “Use current params”.
Basic Setup procedure:
After you create a file and with your sample properly inserted into the magnet: Click on UM Setup, to select and load standard experiment. Format: “ * ” wild card represents any characters. [rpar Ah1*] shows all applications with a title that contains any characters with “h1”, proton measurements. m [rpar Ac13*] shows all applications with a title that contains “c13”. e.g. c13cpd for C13 measurement with H-1 decoupled. [ getprsol ] “Load pulse values” specific for the spectrometer
being used. Neglecting to load the current values will not give proper NMR measurement.

NMR Facility, U. of Maryland. Fu Chen Page 5
Basic procedure for a select NMR measurement: [ edti ] Read instruction for the selected measurement. Once you review them, one may replace the content with your comments relevant to your sample.
Or click the title page once you finish loading the parameter.
Optimization and data acquisition --- Adjust and Acquire menu: Execute the steps in sequence from top to bottom. Namely: Step 1 rsh shim.current Step 2 lock
Step 3 probe adjustment:
Remark: For H1 with routine pulse sequence, most concentrate sample doesn’t require probe tuning.
For complex sequence or/and dilute sample or X-nuclei, probe tuning is mandatory. Follow the procedure in the next page.
** Must getprosol before probe tune!
*** Probe Tuning: for improved sensitivity and transfer precise excitation pulses. Caution: Strong magnetic field, remove your credit card etc before approaching the probe.

NMR Facility, U. of Maryland. Fu Chen Page 6
Command: Manual adjust “ WOBB”: For all 400, 500 and 600 MHz spectrometers. Exception: “ATMA” for probe with automatic tuning--- 600 BBO probe.
Manual procedure:
Adjust M and T capacitors such that the dip is centered and shows the maxium absorption.
Figure shown is for X-nuclei tunning paddles.
o Click or type [WOBB] to start the tune
probe software.
o First-- adjust the capacitor in the flat
panels at the bottom of the probe on C13
(Request TA present the first time).
o Use the fine slider (far right) to adjust the
WOBB curve:
o T panel for centering the
positioning; M panel for maximize the absorption.
o Note the T and M adjustments could interact slightly with each other, cycle T
and M a couple of times to get the best fit.
o Once X-nuclei adjustment is done, click in the wobble window to switch to H-1
frequency.
o Screen will change to H-1 WOBB curve in a few seconds; adjust alternatively
the T and the M the capacitors similar conditions as for C13.
o When adjust is complete, click or type “halt”.
NMR Facility, U. of Maryland. Fu Chen Page 7
Optimization and data acquisition (Continued)
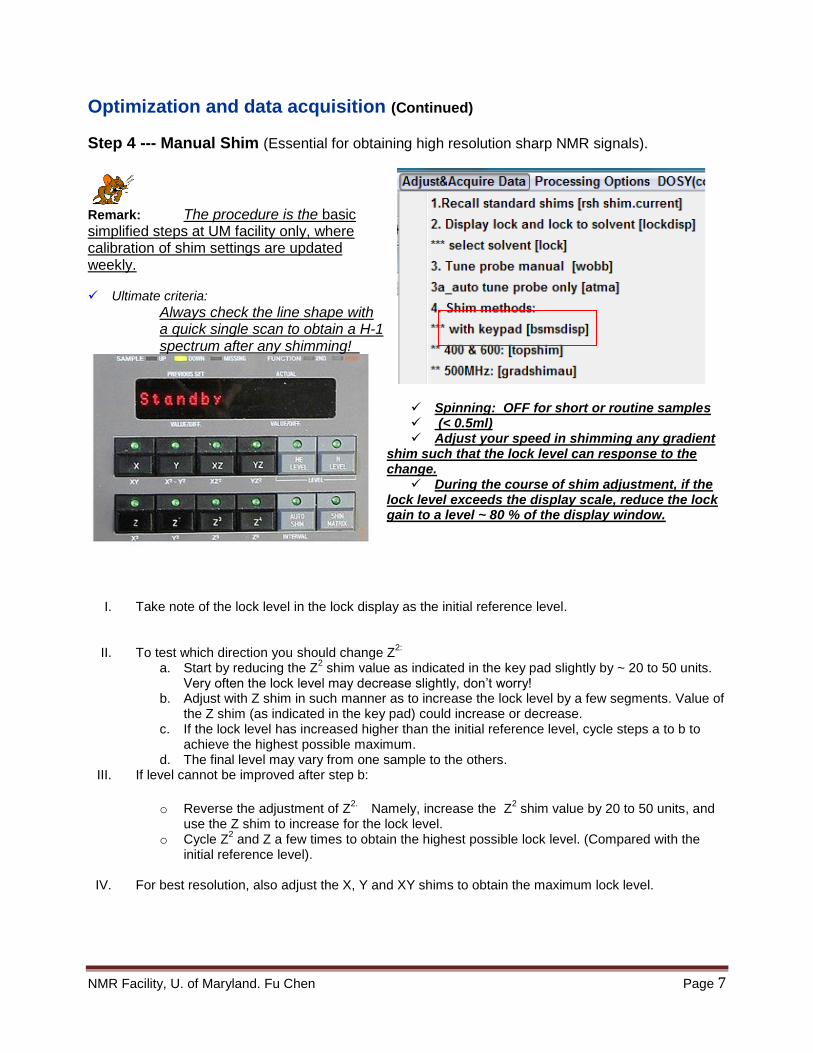
Step 4 --- Manual Shim (Essential for obtaining high resolution sharp NMR signals).
Remark: The procedure is the basic simplified steps at UM facility only, where calibration of shim settings are updated weekly. Ultimate criteria:
Always check the line shape with a quick single scan to obtain a H-1 spectrum after any shimming!
Spinning: OFF for short or routine samples (< 0.5ml) Adjust your speed in shimming any gradient
shim such that the lock level can response to the change.
During the course of shim adjustment, if the lock level exceeds the display scale, reduce the lock gain to a level ~ 80 % of the display window.
I. Take note of the lock level in the lock display as the initial reference level.
II. To test which direction you should change Z2:
a. Start by reducing the Z2 shim value as indicated in the key pad slightly by ~ 20 to 50 units.
Very often the lock level may decrease slightly, don’t worry! b. Adjust with Z shim in such manner as to increase the lock level by a few segments. Value of
the Z shim (as indicated in the key pad) could increase or decrease. c. If the lock level has increased higher than the initial reference level, cycle steps a to b to
achieve the highest possible maximum. d. The final level may vary from one sample to the others.
III. If level cannot be improved after step b:
o Reverse the adjustment of Z
2. Namely, increase the Z
2 shim value by 20 to 50 units, and
use the Z shim to increase for the lock level. o Cycle Z
2 and Z a few times to obtain the highest possible lock level. (Compared with the
initial reference level).
IV. For best resolution, also adjust the X, Y and XY shims to obtain the maximum lock level.

NMR Facility, U. of Maryland. Fu Chen Page 8
V. Finally, collect a quick one scan proton spectrum and review for sharp and symmetrical line shape.
.
Common Examples of Poor Shimming:
Example ONE: All NMR signals have humps towards the large ppm (figure below) at their base.
Reason ----- Z2 shim value is set too large.
Correction procedure: Use keypad, reduce the value of Z2 shim ~ 25—50
units (lock level may drop slightly at this moment); re-adjust Z1 shim to
maximize the lock level; re-collect another H-1 spectrum. If the line shape
improves and becomes more symmetrical, repeat the same adjustment
sequence till the humps disappear.
Example TWO: Line humps towards the small ppm region.
Reason --- Z2 shim value is set too small; not enough Z
2 current.
Reverse the correction procedure for example 1.
For spectrometers with gradient automatic shimming hardware:
600MHz and 400MHz (NMR LAB 1 in B0128) spectrometers:
Click menu or type “TOPSHIM”. Command line will echo
“topsphim finished”, and the lock level re-appears when auto-shimming is completed.
500MHz spectrometer:
Click GRADSHIMAU. Different graphic will appear in the spectral window. The process will take several minutes, please wait! When auto-shimming is completed, the lock level re-appears again.

NMR Facility, U. of Maryland. Fu Chen Page 9
Follow the rest of steps (5 to 7) to collect data.
Step 5: Sample dependent parameters.
Adjust as needed, otherwise use defaults. D1, NS, and TDO.
D1 – relaxation delay for proper integration. NS-- number of scans (concentration of your sample) Min. is 8. TD0 –Default set to 1 for H1. 5 or 10 for C13. Final number of accumulated scans = NS * TD0
Step 6: Receiver gain auto-adjust (for best digitizer scaling).
Step 7: “zg” collect data and delete the original content of the data file (if it is an old data file).
Optional feature ** [tr] optional step.
*** to preview an on-going experiment (such as a C-13), before its completion.
To find out the acquisition time, type [expt] Or click time
To halt the measurement before it completes the scans, Type [halt] or click
DO NOT TYPE STOP! [stop] will erase all the data collecte.

NMR Facility, U. of Maryland. Fu Chen Page 10
1D-NMR DATA PROCESSING: Ask your peer trainer or NMR T.A. for demo. Refer to Basic User manual Full version for details.
Data transfer (from spectrometer to workstations):
Data file must be transferred with its corresponding filename. Don’t transfer an EXPNO subfolder alone that cannot be processed via TOPSPIN software.
Visual display adjustments & commands: The content in the Spectrum window can be adjusted or processed by clicking/dragging the appropriate icon at the second &third rows: The UM short-cut (basic) commands are appended at the end of the 3
rd row.
e.g. Multiple displays: to compare spectra. Cut: Copy display to clipboard and paste to external word processing. Good for small
expansion only. For comprehensive plot, details will be explained in the PLOT section.
For users who are not familiar with the software, click the UM Processing (basic) icons, in sequence, one by one, from left to right.
“em” Exponential multiplication; one of the most popular “apodization” in data processing.
Apply an exponential weighting function with a value of {LB}. A positive LB value will attenuate the FID data in an exponential manner. The noise of the spectrum will be reduced. Typical LB 0.3 (Hz) is used for H-1, and 2 to 4 Hz for C-13. The larger the LB value, the greater amount of noise will be reduced, but the sharpness of signals will also be reduced [loss in resolution].
“ ft ” Fourier transform FID.
“apk” Automated reset phase “pk” applies phase correction values { PHC0 and PHC1 } stored with the data set. Useful when identical
phase adjustments are to be used.
When refined adjustment is required, click the icon to carry out phase correction manually
Ask your peer trainer or NMR T.A. for demo. You will be tested this procedure on your check out!!!!!!!

NMR Facility, U. of Maryland. Fu Chen Page 11
Chemical shift calibration, select and click either circled icons as shown in the figure --
TIPS:
Expand the spectrum first around the signal to be used for chemical shift calibration.
IF your sample contains no standard reference signal (such as TMS), use the residual H-1 signal from the solvent. This method is acceptable but not a universal standard. Some solvent signals may shift with temperature or pH.
When solvent doesn’t give any residual H-1 or C13 signals, the external reference method is to be used.
(Approximation method): o Prepare a reference sample that contains a suitable chemical with a known
chemical shift value in the same solvent as your sample. o Collect a 1 D NMR spectrum at the same temperature as your sample. o Calibrate the shift and type “ sr “ to obtain a value known as the spectral
reference . o Return to your original spectrum data file, import the value of sr obtained from the
reference sample.
Peak Picking:
Option: Click the pick peaks icon or the in software top menu row. Remark: Chemical shift calibration must be carried out before hand. Ask your peer trainer or NMR T.A. for demo. Refer to full User manual for description.
Option: Sensitivity of Peak picking factor “pc “.
Pick peaking sensitivity can be modified with a parameter pc,
The default value is 4.The smaller the value of PC, the larger the number of peaks will be indentified.
Integration: Caution: For routine 1D H-1 NMR, proper integration will reflect the relative population of spins in a
compound. This is only true when the processing is done properly sufficient relaxation delay time (D1) when the data is collected.

NMR Facility, U. of Maryland. Fu Chen Page 12
Procedure: Ask your peer trainer or NMR T.A. for demo. Refer to full User manual for description.
STEP 1: Auto integrate: Click the integrate icon or type [ abs ] at command line.
STEP 2: Modification and calibration (if needed) Click to review and/or modify the integrals:
Slope and bias on a particular Integral: a) Select the region: Place the mouse on the integral of interest, right click and a pop-up menu appears.
Click “Select/Deselect” once. The integral region turns yellowish-green.
b) Adjust the slope then bias:
SAVE INTEGRATION: When all adjustments and modification are completed, calibrate the
integral, and click “SAVE” to exit.
PLOT
Before printing: TAB the TITLE PAGE! Update as needed for your sample.

NMR Facility, U. of Maryland. Fu Chen Page 13
Two different plot procedures:
A) Using Older version TOPSPIN (3.1 or 2.x) In top row of main window File >>>> click Print
A Pop-up option appears:
1. Select the three options as shown:
o If the LAYOUT is not desirable. Click the LAYOUT pull down menu and select a different LAYOUT.
What is a LAYOUT? It is a template that defines the properties of objects in a plot. The objects can be a spectrum, a list of parameters, a title, an image, or a combination of all. The object can be further modified in the plot editor. The most common choices are: 1D_H.xwp for proton; 1D_BB.xwp for X-nuclei. Stack_3.xwp for stack plots of 3 spectra.
2. Once OK is clicked. A new window “Plot Editor “appears,.
Plot editor will automatically import the current spectrum as the main object defined in the layout.

NMR Facility, U. of Maryland. Fu Chen Page 14
To modify the size and/or content of an object (such as the spectrum), place the mouse inside the object, left click to select.
Select the 1D/2D-Editor: .
The Edit option (shown on the left) gives lots of options and is digital.
The 1D/2D-Edit option is much easier to use!
Check Spectrum to adjust Spectrum.
Check Integral to adjust Integral (uncheck Spectrum if you just want to adjust integral alone).
Be sure to check or uncheck the Spectrum or the integral pending your desirable adjustment!
When you finish modifying all the objects, click File and print within the Plot editor (Don’t use the File- print in the main NMR software window).
CAUTION: When you exit (close) the Plot editor window, don’t save the File when the software prompts. The file it’s asking to save is the layout. It is not your spectrum.
B) Plot using TOPSPIN (3.2): Click “Plot” Tab in the top manual bar. For rough adjustments, use the top icons (except the “e”).

NMR Facility, U. of Maryland. Fu Chen Page 15
Horizontal and vertical expansions:
Use buttons in “Limits” row for
o expansion (rubber band- click drag and release) ,
o R for reset
o Pan. Middle wheel of the mouse for vertical expansion. For visual inspection, use buttons in “Display” for:
o Full screen [browser Panel off]. o Reset or magnify (for visible effect only).
Click View at the tope menu bar and turn the browser
Panel on again. For adding additional plot features:
Put the mouse on the spectrum and left click:
Select the new options by checking the related buttons. e.g. Peaks
Click Curve to define the exact ppm horizontal expansions.
To obtain a hard copy plot or export to pdf file: Click File in the TOP software main menu bar and click to select the appropriate icon.

NMR Facility, U. of Maryland. Fu Chen Page 16
How to FTP data: 1) log on any workstation in the NMR labs as “share” or “share2” password is “sun1234”
2) Double click the CuteFTP icon; and select the corresponding spectrometer. 3) Example: double click “chem400.umd.edu”
a. For chem400 server, Username “share” and password have been automatically defined for you.
b. For all other spectrometers, Username: “advisor-last-name-as in your spectrometer”; password is “First four letters of advisor-last-name, followed by 123, or 1234.” There are some exceptions see Staff for details.
4) Left window (Local Drives): select C:\your advisor-folder 5) Right window (remote Drive): select your last name folder. 6) Right window: move down to your data location and drag data file to Local window: