basic ecg course part 1 - the egyptian cardiac … ecg. - dr...ventricular stimulation path spreads...
TRANSCRIPT

D R . M O H A M M E D S A R H A N
A S S . L E C T U R E R O F C A R D I O L O G Y
A L - A Z H A R U N I V E R S I T Y
Basic ECG Course
Part 1
Genesis of ECG & Techniques

Heart Mechanics
Process Action
Cardiac cycle Sequence of events in 1 heartbeat. Blood ispumped through the entire cardiovascularsystem.
Systole Contraction phase—usually refers toventricular contraction
Diastole Relaxation phase—the atria and ventricles arefilling. Lasts longer than systole
Stoke volume Amount of blood ejected from either ventriclein a single contraction.
Cardiac output Amount of blood pumped through thecardiovascular system per min.CO SV Heart rate (HR)
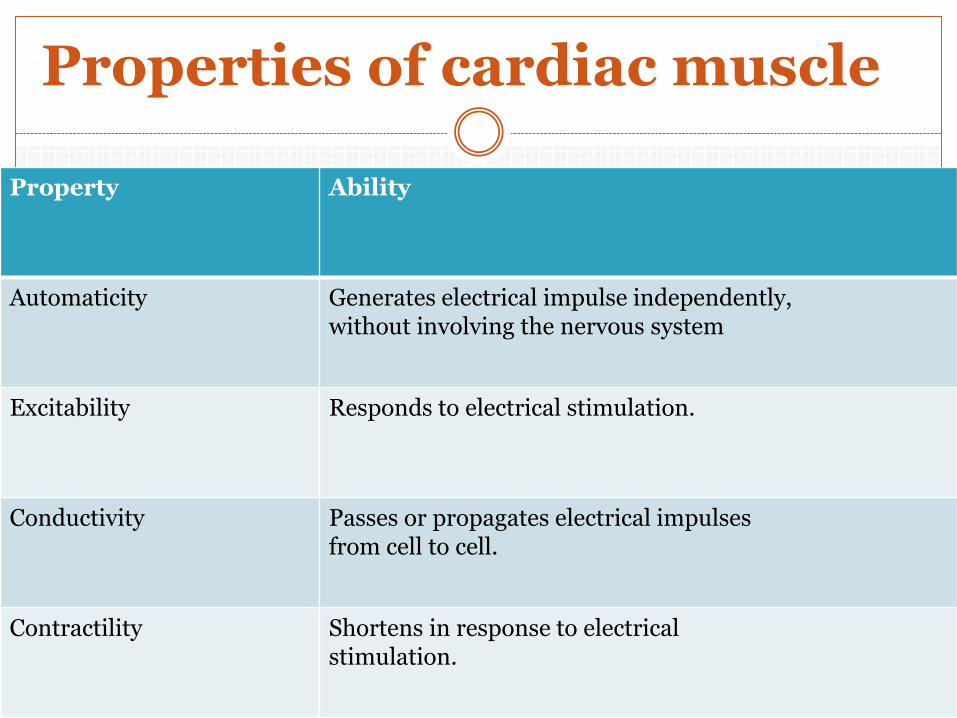
Properties of cardiac muscle
Property Ability
Automaticity Generates electrical impulse independently,without involving the nervous system
Excitability Responds to electrical stimulation.
Conductivity Passes or propagates electrical impulsesfrom cell to cell.
Contractility Shortens in response to electricalstimulation.
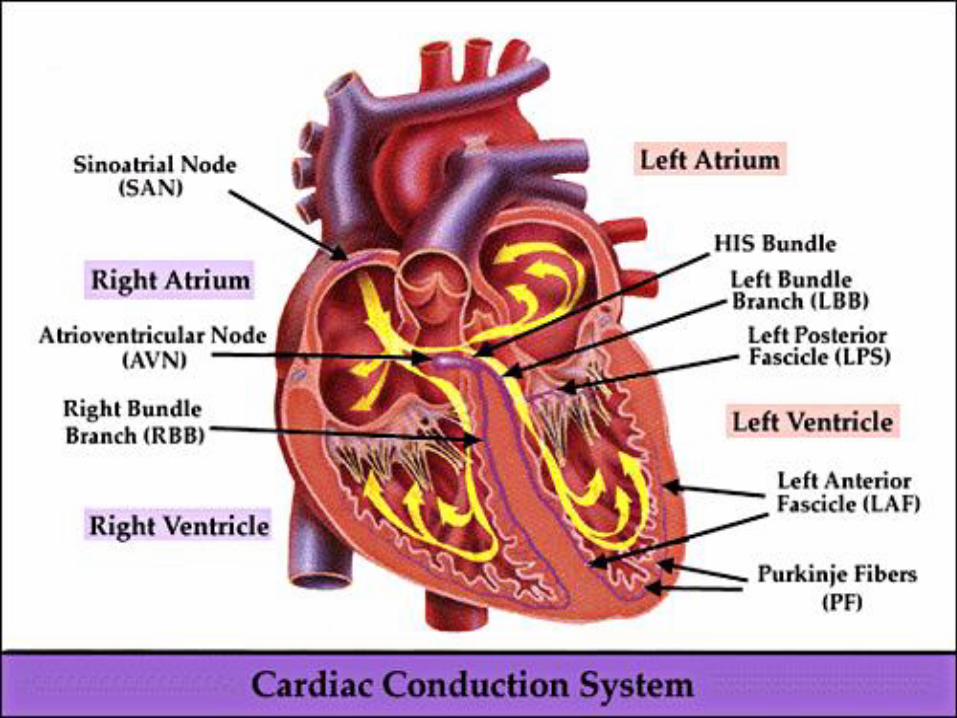
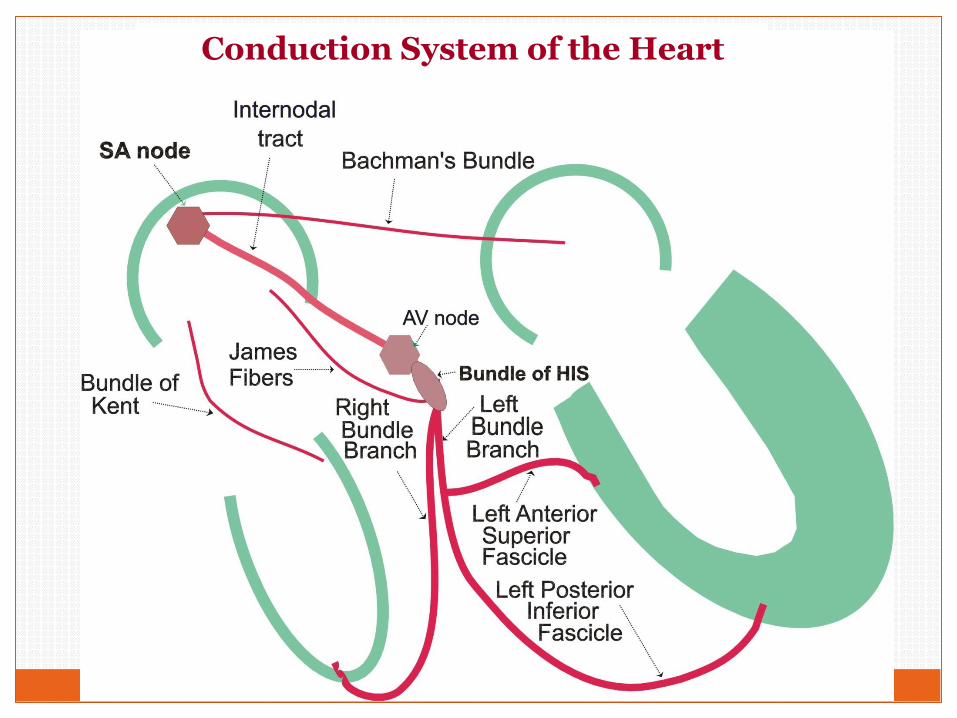
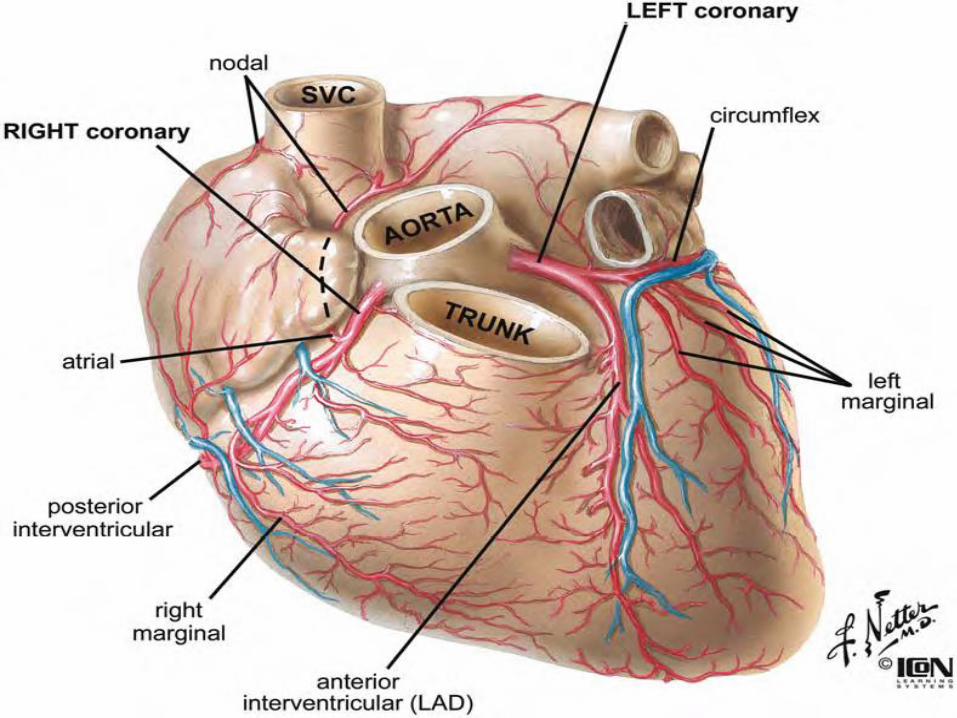
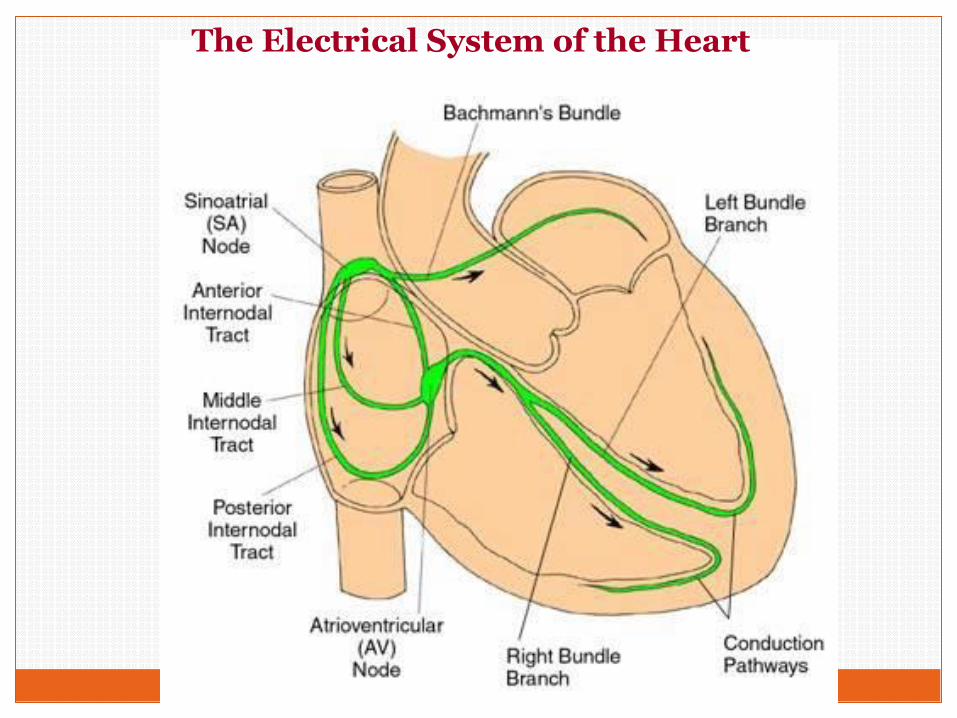
Conduction System of the Heart
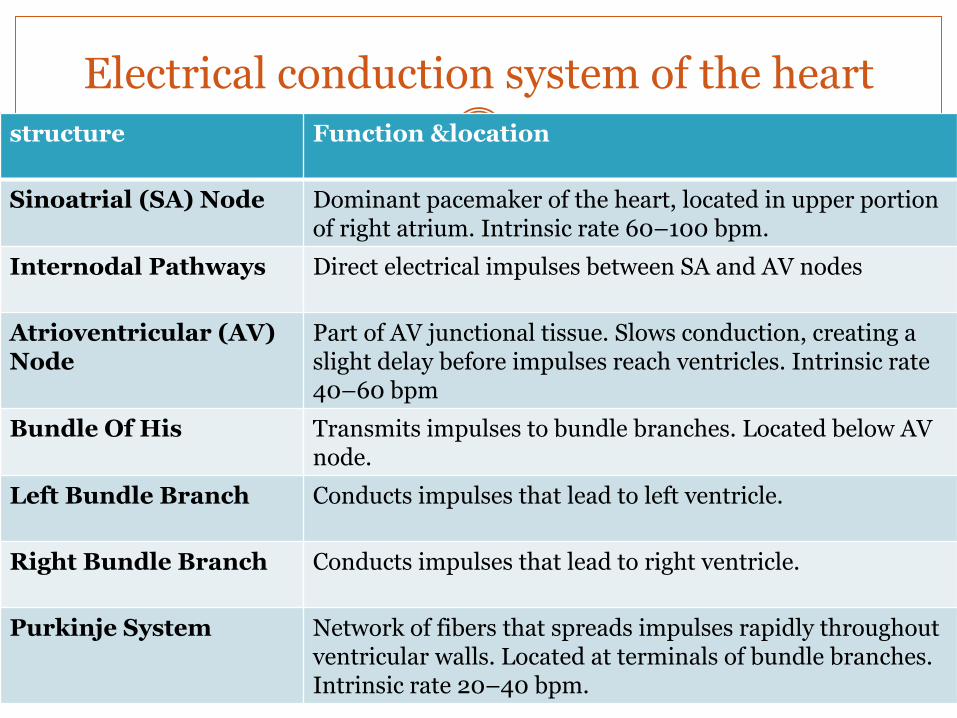
Electrical conduction system of the heartstructure Function &location
Sinoatrial (SA) Node Dominant pacemaker of the heart, located in upper portion of right atrium. Intrinsic rate 60–100 bpm.
Internodal Pathways Direct electrical impulses between SA and AV nodes
Atrioventricular (AV) Node
Part of AV junctional tissue. Slows conduction, creating a slight delay before impulses reach ventricles. Intrinsic rate 40–60 bpm
Bundle Of His Transmits impulses to bundle branches. Located below AV node.
Left Bundle Branch Conducts impulses that lead to left ventricle.
Right Bundle Branch Conducts impulses that lead to right ventricle.
Purkinje System Network of fibers that spreads impulses rapidly throughout ventricular walls. Located at terminals of bundle branches. Intrinsic rate 20–40 bpm.
The Electrical System of the Heart
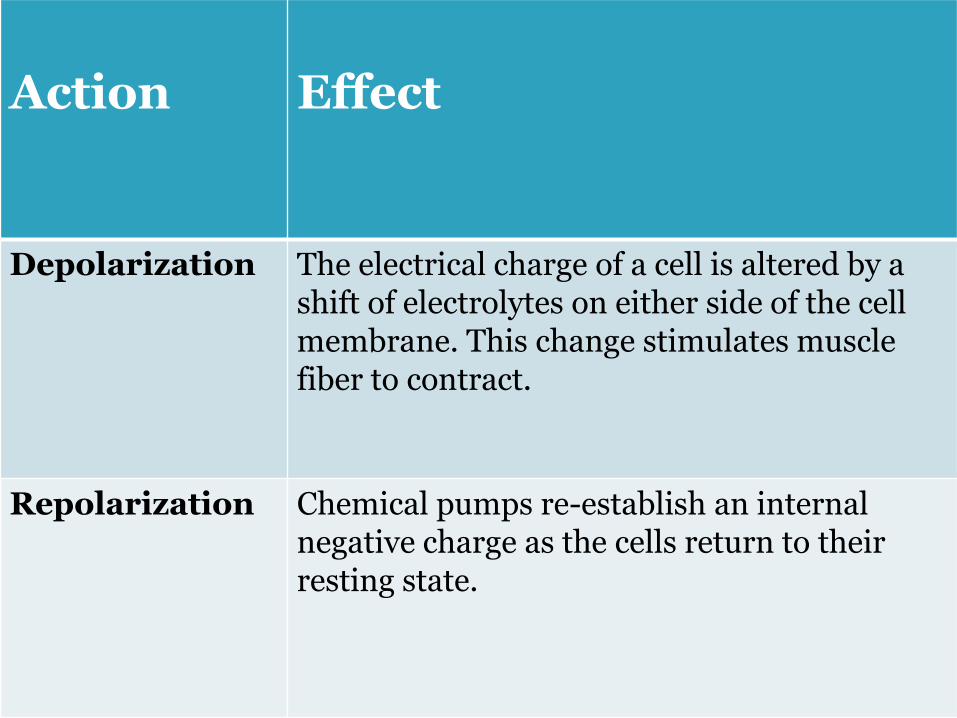
Action Effect
Depolarization The electrical charge of a cell is altered by a shift of electrolytes on either side of the cell membrane. This change stimulates muscle fiber to contract.
Repolarization Chemical pumps re-establish an internal negative charge as the cells return to their resting state.
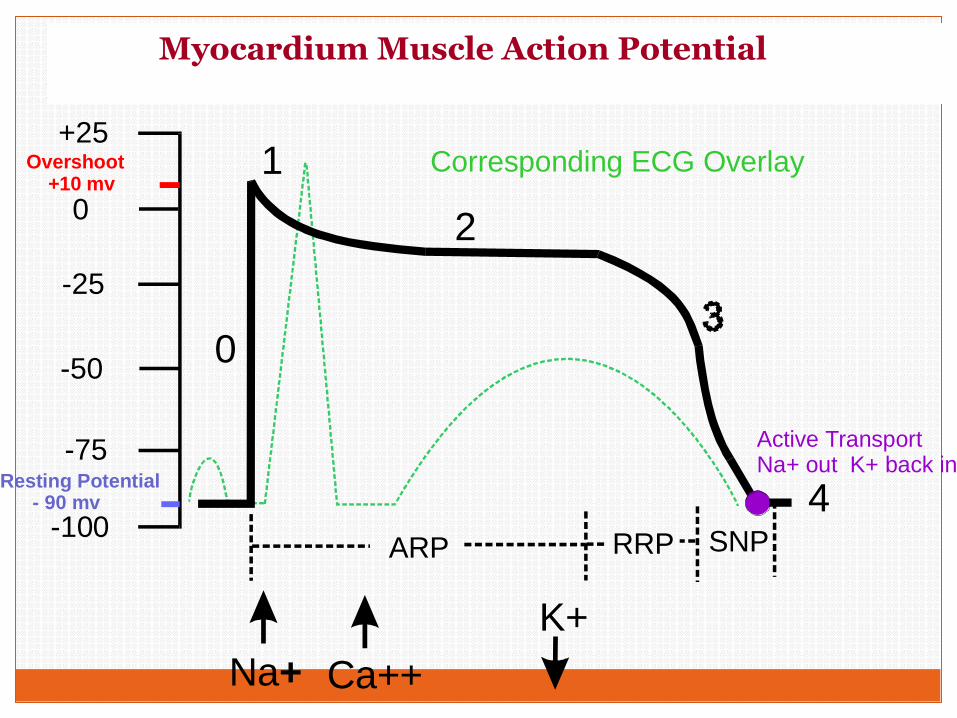
Action Potential of a Myocardial Cell
+25
0
-25
-50
-75
-100
Resting Potential - 90 mv
Overshoot +10 mv
Na+ Ca++
K+
0
1
2
4
Active TransportNa+ out K+ back in
ARP RRP SNP
Corresponding ECG Overlay
Myocardium Muscle Action Potential
Slow spontaneou
sInward Na+ ions
Outward K+
current (repolarizatio
n)
Inward Na+
and Ca+ +
ions (depolarizatio
n)
threshold
d
automaticity (d HR)
u
automaticity (u HR)
Atrial Muscle (Nodal) Action Potential
Automaticity - a pacemaker cell’s ability to spontaneously depolarize, reach threshold, and propagate an AP
0
4
3
1.
2.
3.
4.
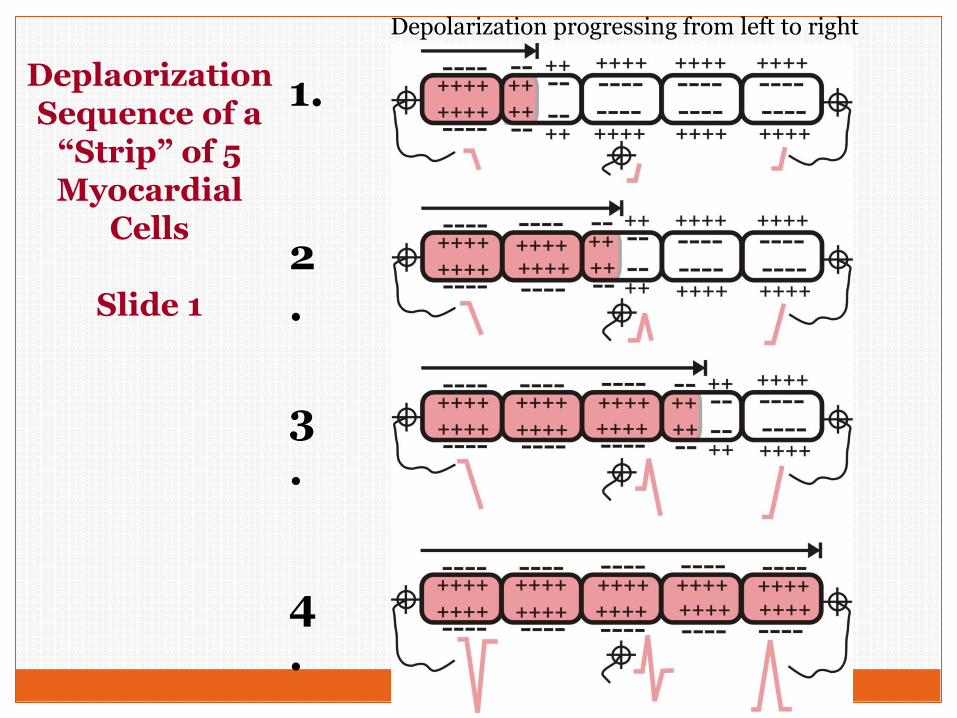
Deplaorization Sequence of a
“Strip” of 5 Myocardial
Cells
Slide 1
Depolarization progressing from left to right
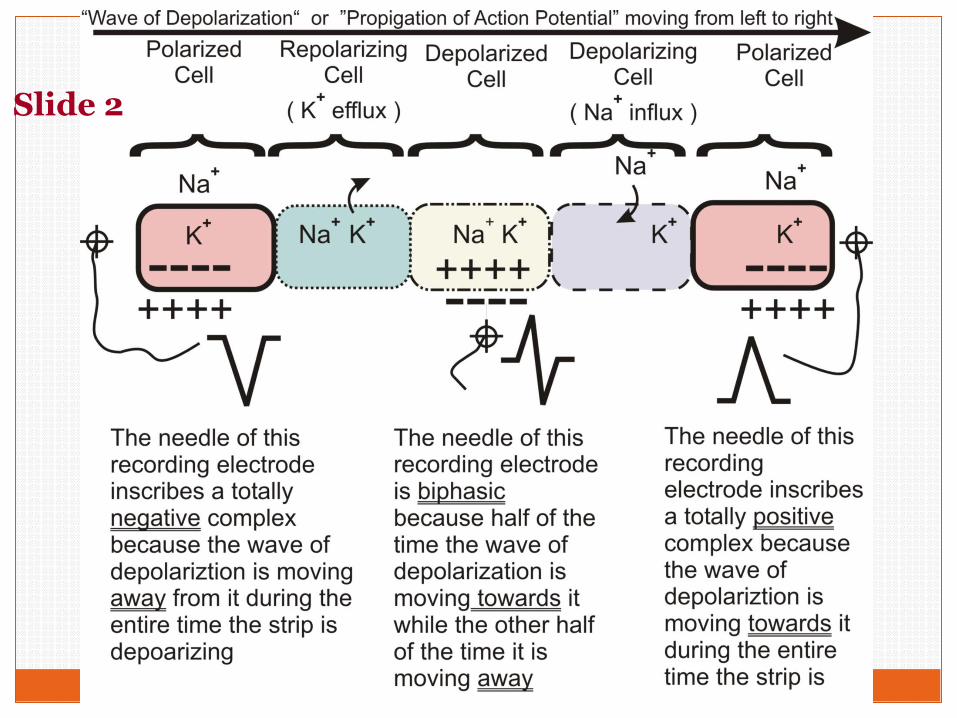
Slide 2
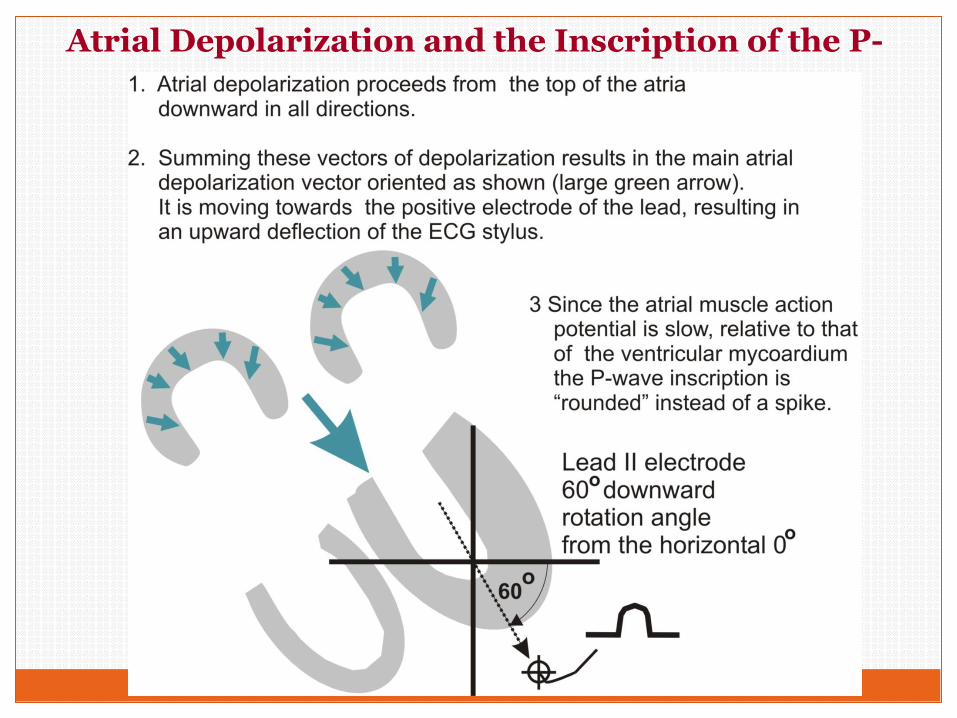
Atrial Depolarization and the Inscription of the P-wave
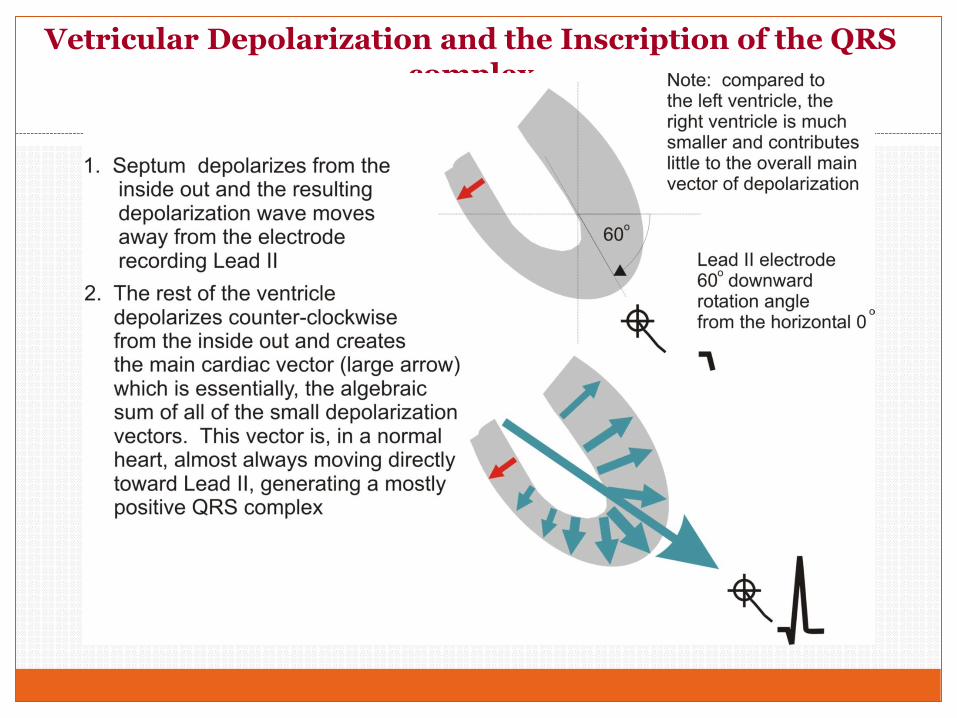
Vetricular Depolarization and the Inscription of the QRS complex
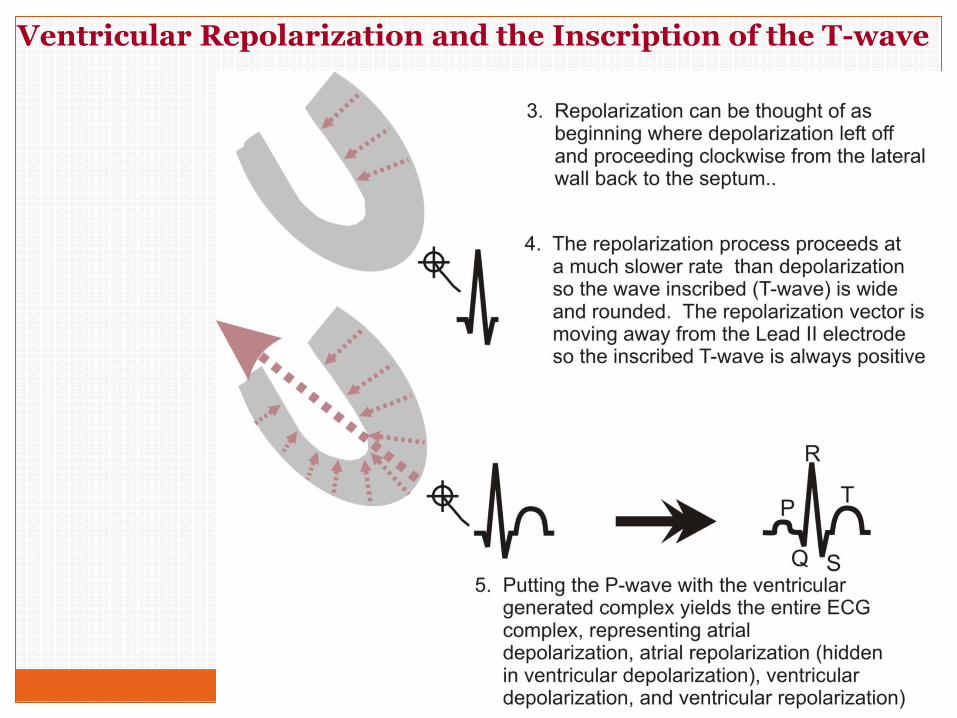
Ventricular Repolarization and the Inscription of the T-wave
The QRS Complex with Interval and Segment Measurements
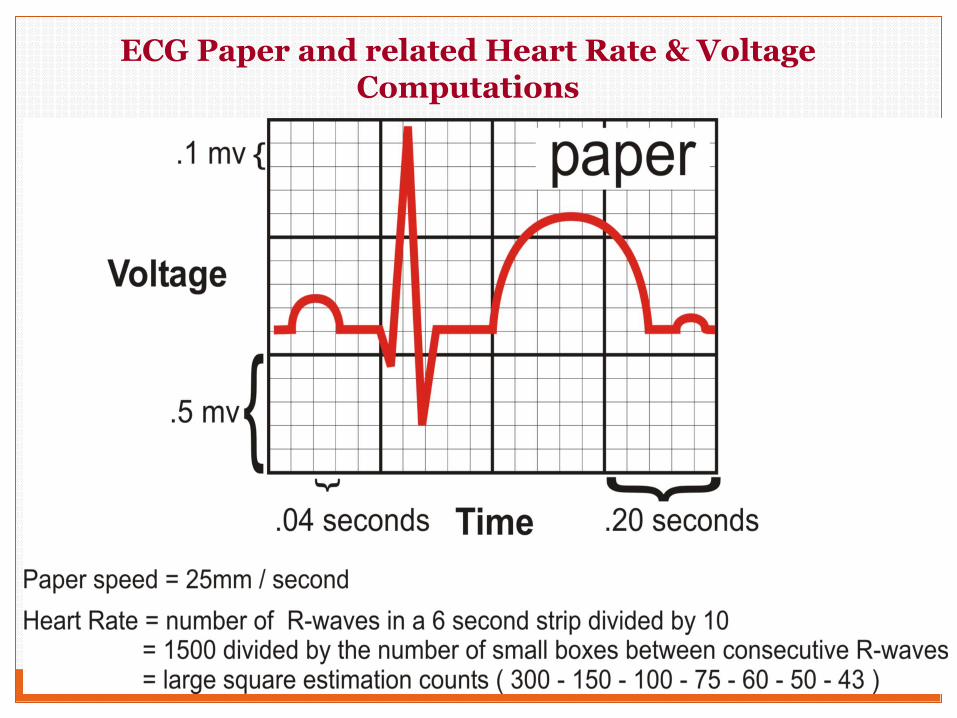
ECG Paper and related Heart Rate & Voltage Computations
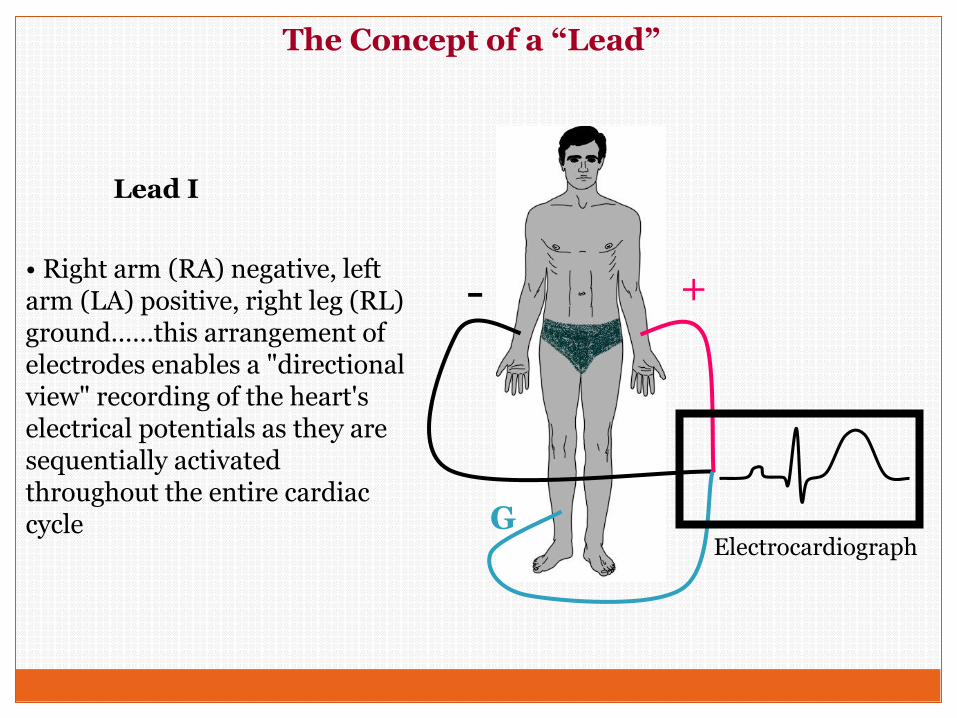
+-
G
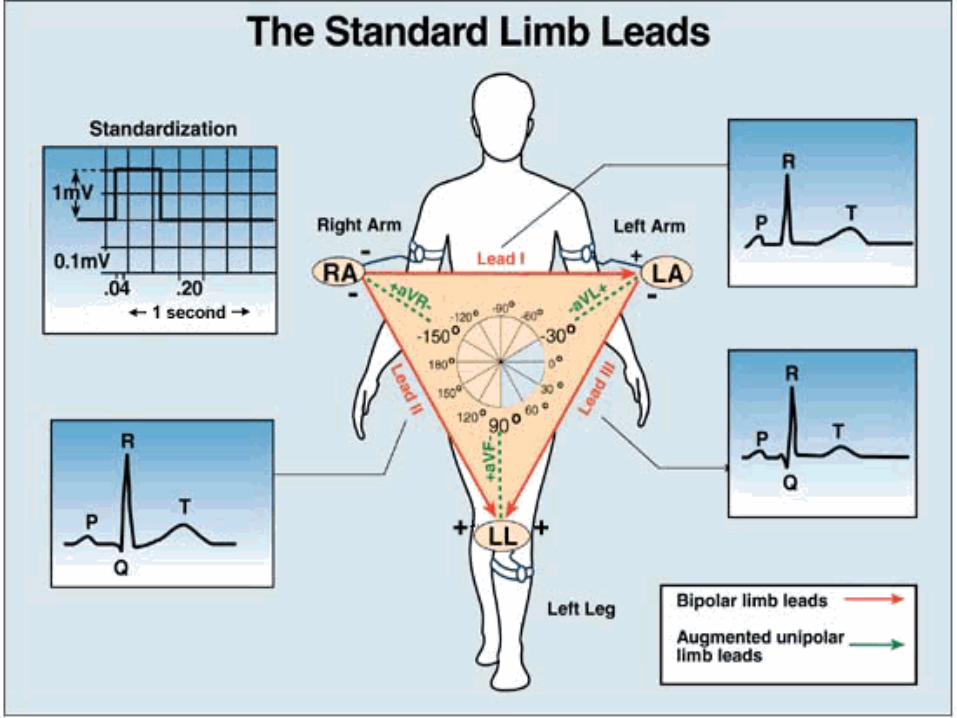
• Right arm (RA) negative, left arm (LA) positive, right leg (RL) ground……this arrangement of electrodes enables a "directional view" recording of the heart's electrical potentials as they are sequentially activated throughout the entire cardiac cycle
Electrocardiograph
Lead I
The Concept of a “Lead”
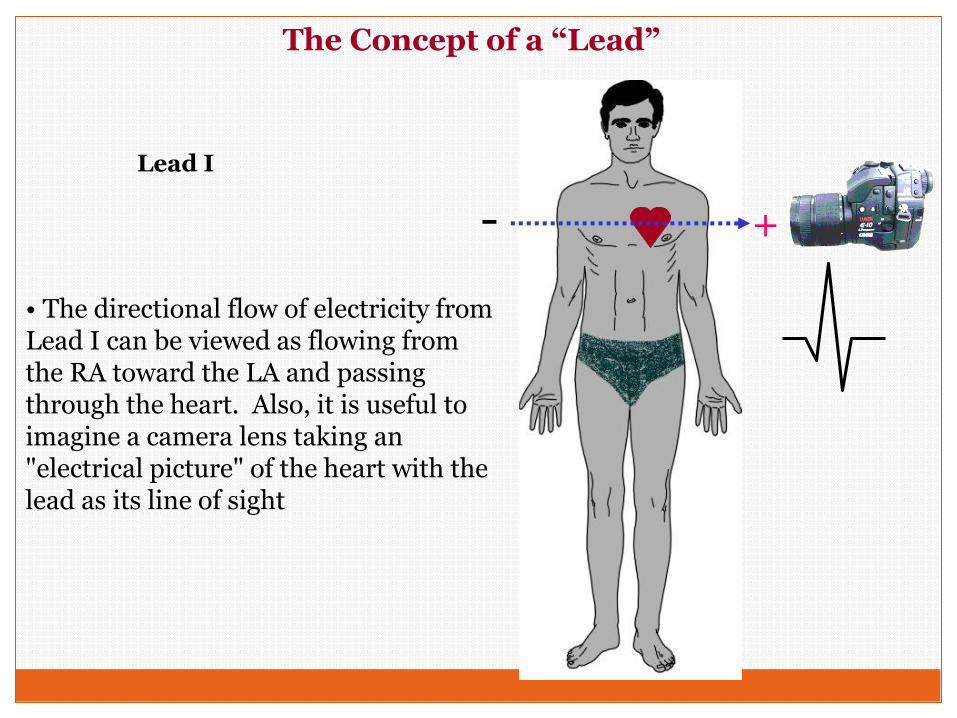
+-
• The directional flow of electricity from Lead I can be viewed as flowing from the RA toward the LA and passing through the heart. Also, it is useful to imagine a camera lens taking an "electrical picture" of the heart with the lead as its line of sight
The Concept of a “Lead”
Lead I
+-
RA
RA
LL+
+
--LA
LL
LA
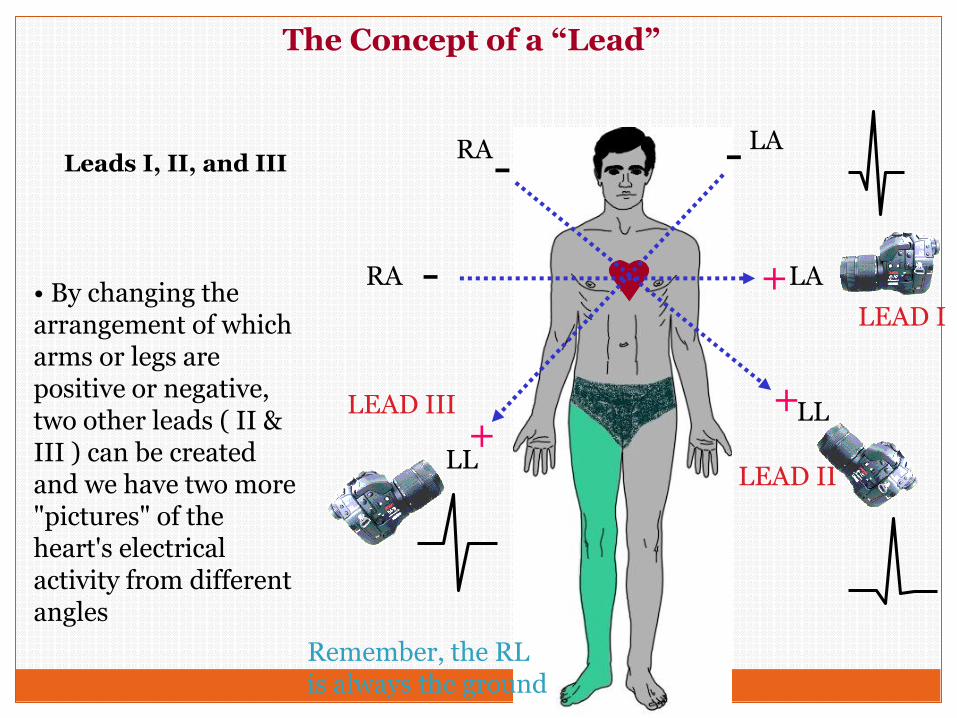
LEAD II
LEAD I
LEAD III
Remember, the RLis always the ground
• By changing the arrangement of which arms or legs are positive or negative, two other leads ( II & III ) can be created and we have two more "pictures" of the heart's electrical activity from different angles
The Concept of a “Lead”
Leads I, II, and III
The Concept of a “Lead”
+
-
RA
RA & RL LL & LA
+
+
-
LL
RA & LA
LA
LEAD AVR
-
LEAD AVL
LEAD AVF
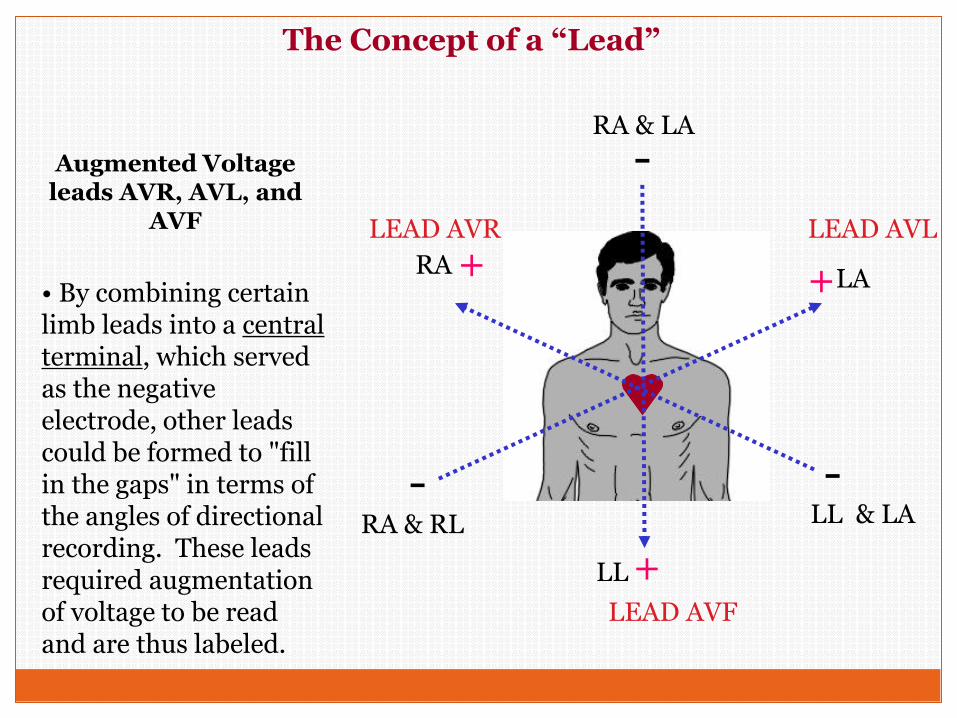
• By combining certain limb leads into a central terminal, which served as the negative electrode, other leads could be formed to "fill in the gaps" in terms of the angles of directional recording. These leads required augmentation of voltage to be read and are thus labeled.
Augmented Voltage leads AVR, AVL, and
AVF
0o
LEAD AVR LEAD AVL
LEAD AVF
LEAD II
LEAD I
LEAD III
60o
90o120o
-30o-150o
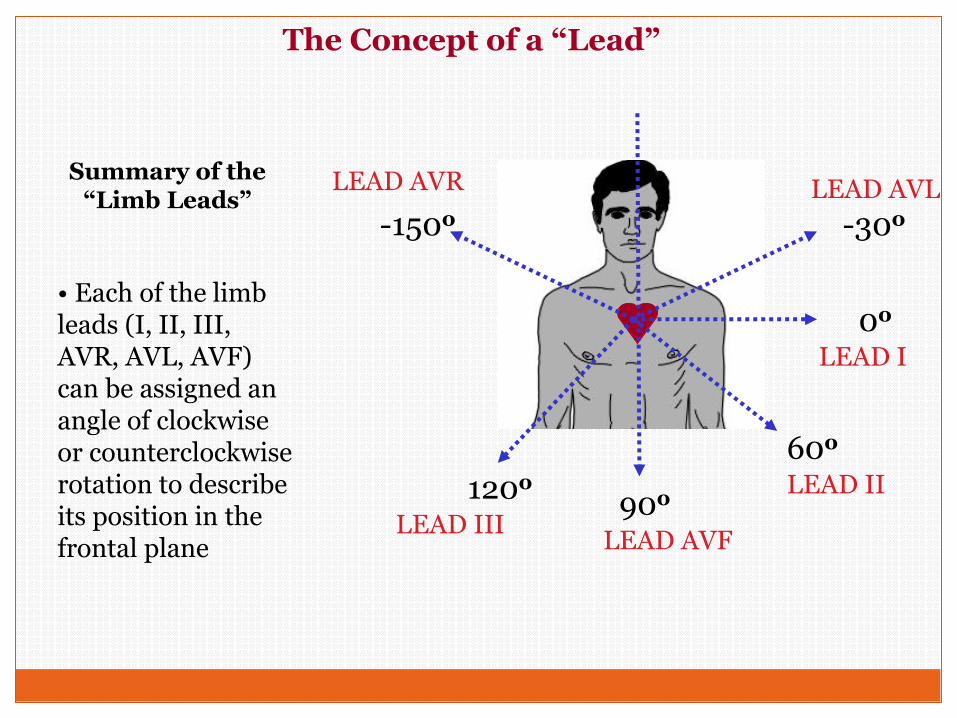
• Each of the limb leads (I, II, III, AVR, AVL, AVF) can be assigned an angle of clockwise or counterclockwise rotation to describe its position in the frontal plane
The Concept of a “Lead”
Summary of the “Limb Leads”
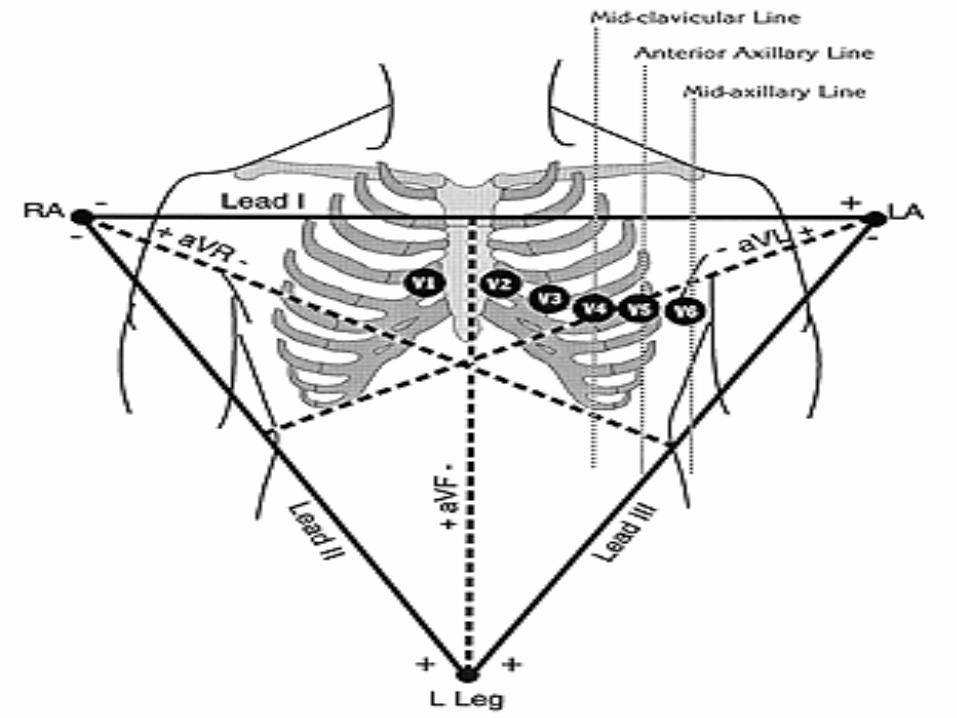
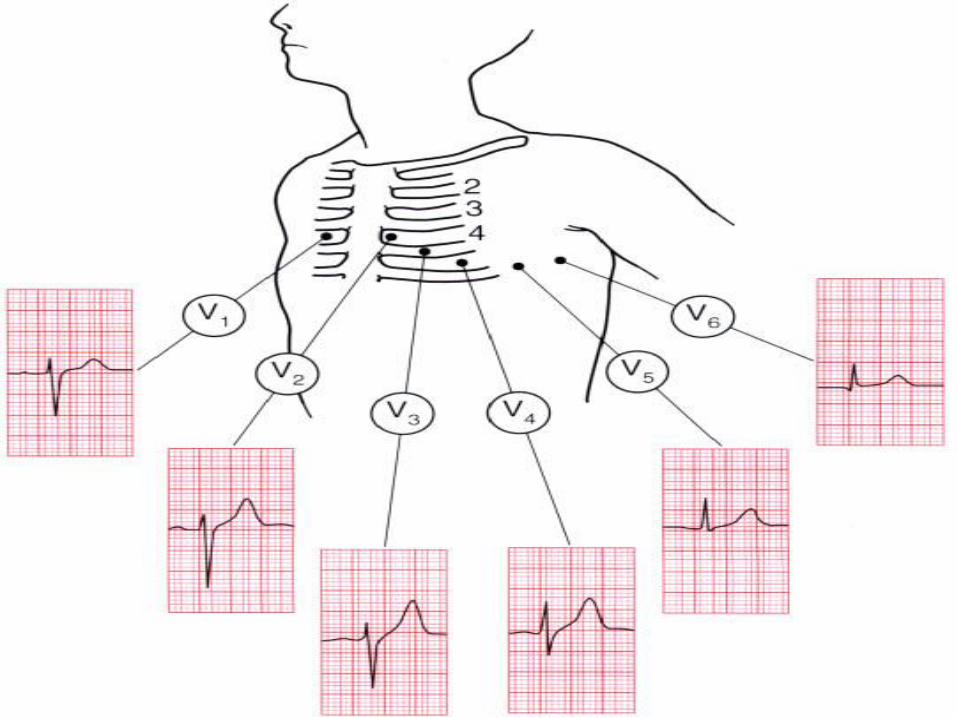
V1 V2
V4 V5V3 V6
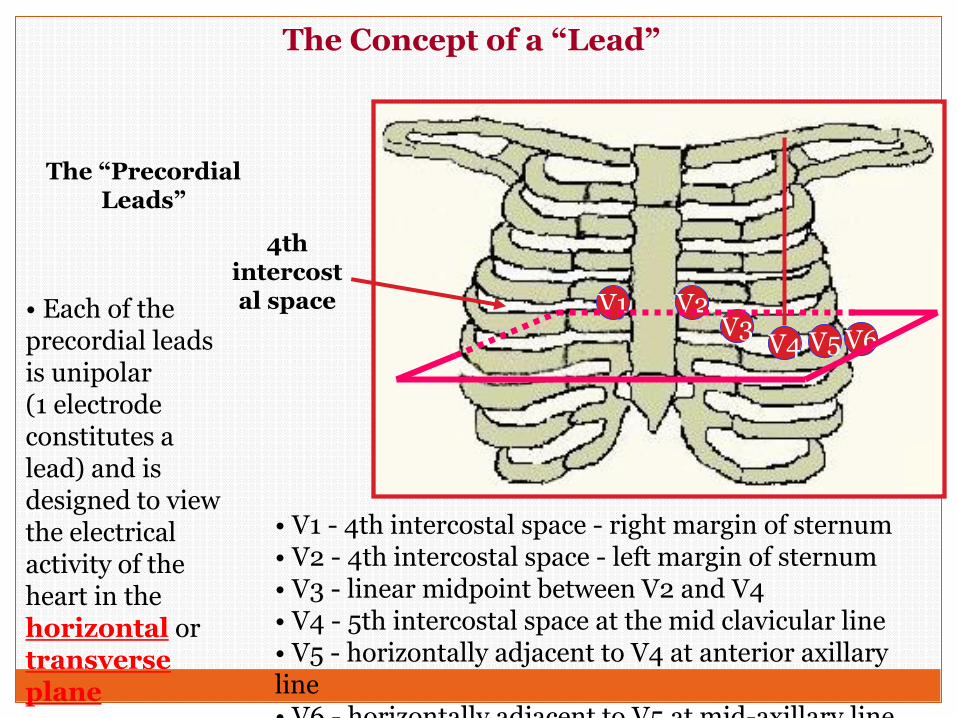
• V1 - 4th intercostal space - right margin of sternum• V2 - 4th intercostal space - left margin of sternum• V3 - linear midpoint between V2 and V4• V4 - 5th intercostal space at the mid clavicular line• V5 - horizontally adjacent to V4 at anterior axillary line• V6 - horizontally adjacent to V5 at mid-axillary line
• Each of the precordial leads is unipolar (1 electrode constitutes a lead) and is designed to view the electrical activity of the heart in the horizontal or transverseplane
The “Precordial Leads”
4th intercostal space
The Concept of a “Lead”
The Electrocardiogram(ECG)
■An ECG is a series of waves and deflections recordingthe heart’s electrical activity from a certain “view.”
■Many views, each called a lead, monitor voltagechanges between electrodes placed in differentpositions on the body.
■Leads I, II, and III are bipolar leads, which consist oftwo electrodes of opposite polarity (positive andnegative). The third (ground) electrode minimizeselectrical activity from other sources.
The Electrocardiogram(ECG)
■Leads aVR, aVL, and aVF are unipolar leads andconsist of a single positive electrode and a referencepoint (with zero electrical potential) that lies in thecenter of the heart’s electrical field.
■Leads V1–V6 are unipolar leads and consist of asingle positive electrode with a negative referencepoint found at the electrical center of the heart.
■Voltage changes are amplified and visually displayedon anoscilloscope and graph paper.
The Electrocardiogram(ECG)
■An ECG tracing looks different in each lead becausethe recorded angle of electrical activity changes witheach lead.
■Several different angles allow a more accurateperspective than a single one would.
■The ECG machine can be adjusted to make any skinelectrode positive or negative. The polarity dependson which lead the machine is recording.
The Electrocardiogram(ECG)
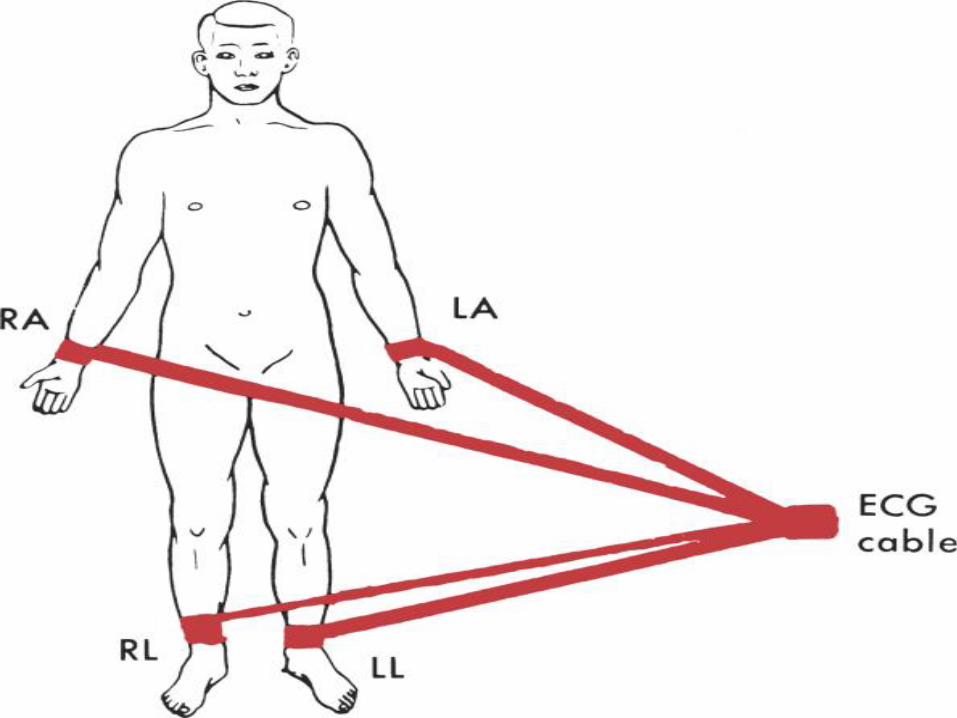
■ A cable attached to the patient is divided intoseveral different-colored wires: three, four, or five formonitoring purposes, or ten for a 12-lead ECG.
■ Incorrect placement of electrodes may turn a normalECG tracing into an abnormal one.
The Electrocardiogram(ECG)
♥ Clinical Tip: Patients should be treated according to their symptoms, not merely their ECG.
♥ Clinical Tip: To obtain a 12-lead ECG, four wires are attached to each limb and six wires are attached at different locations on the chest. The total of ten wires provides twelve views (12 leads).

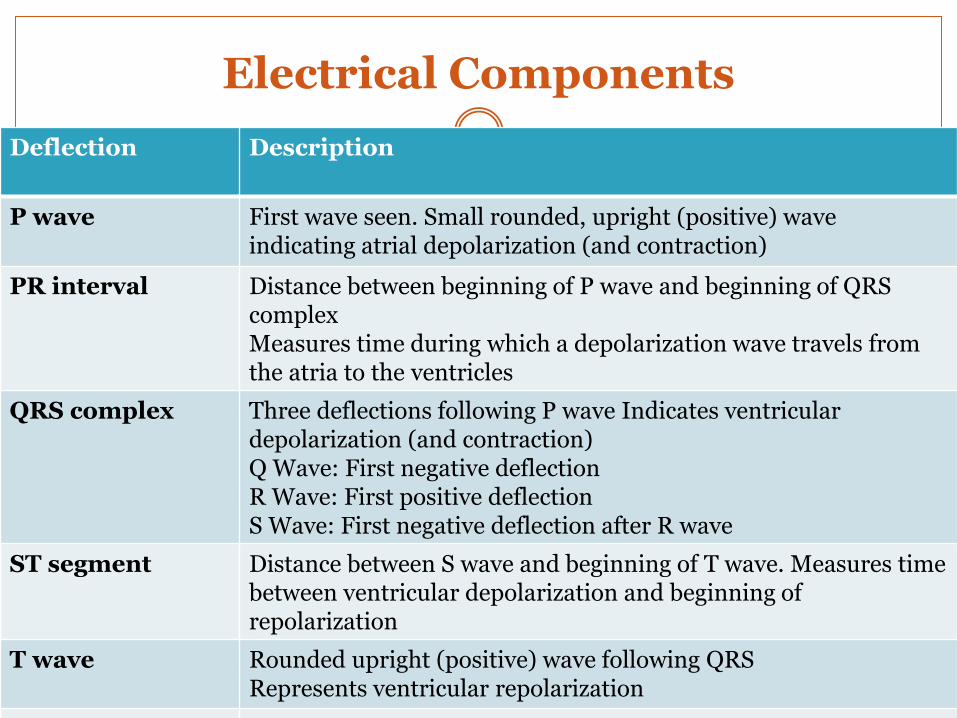
Electrical Components
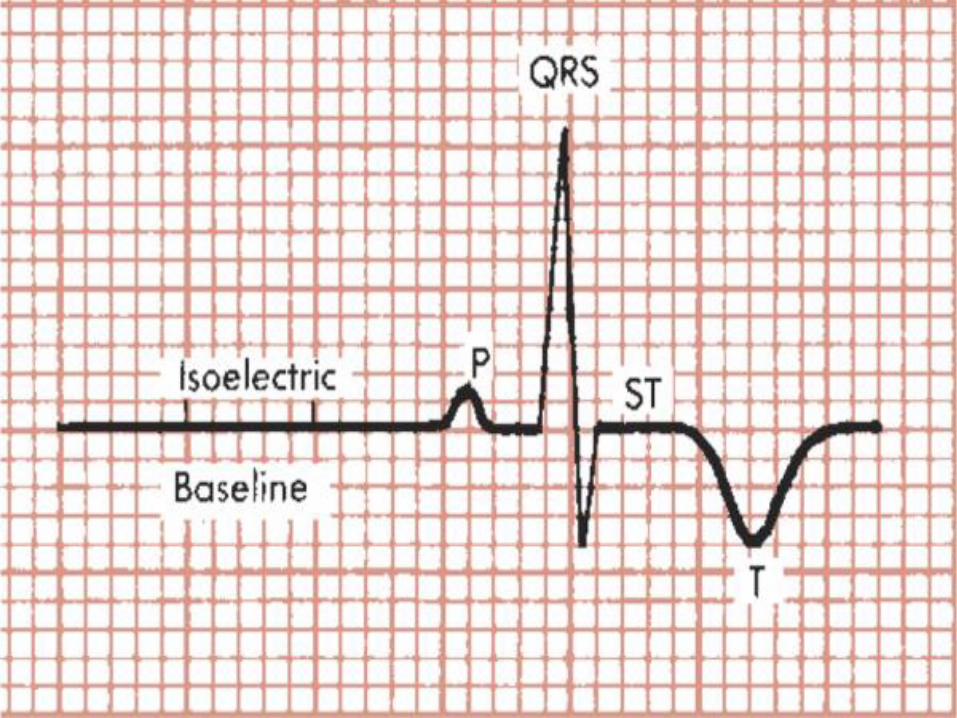
Deflection Description
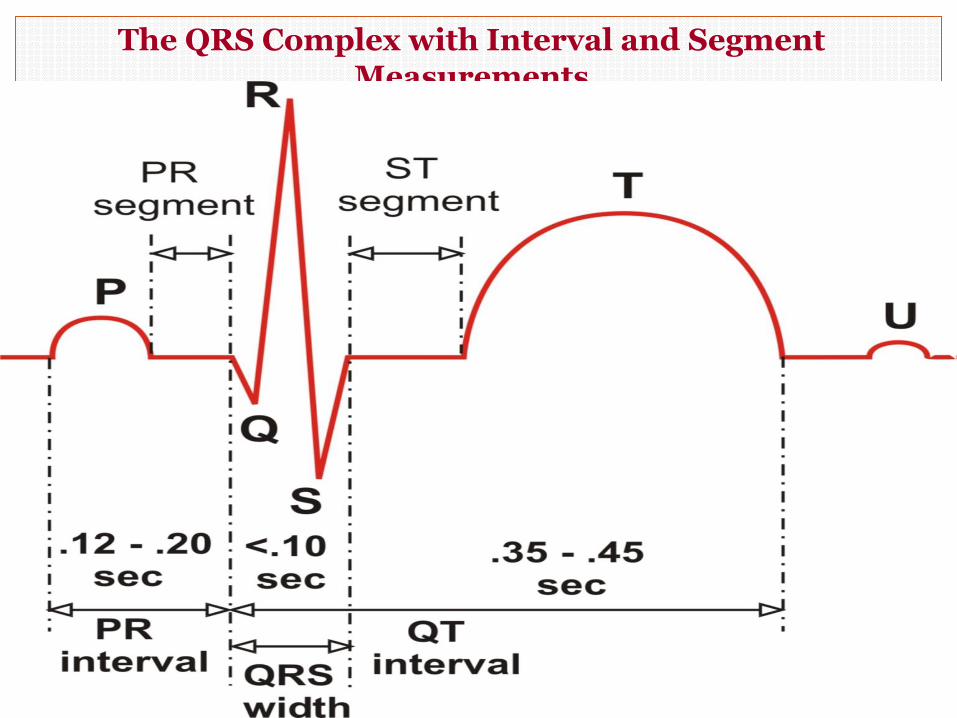
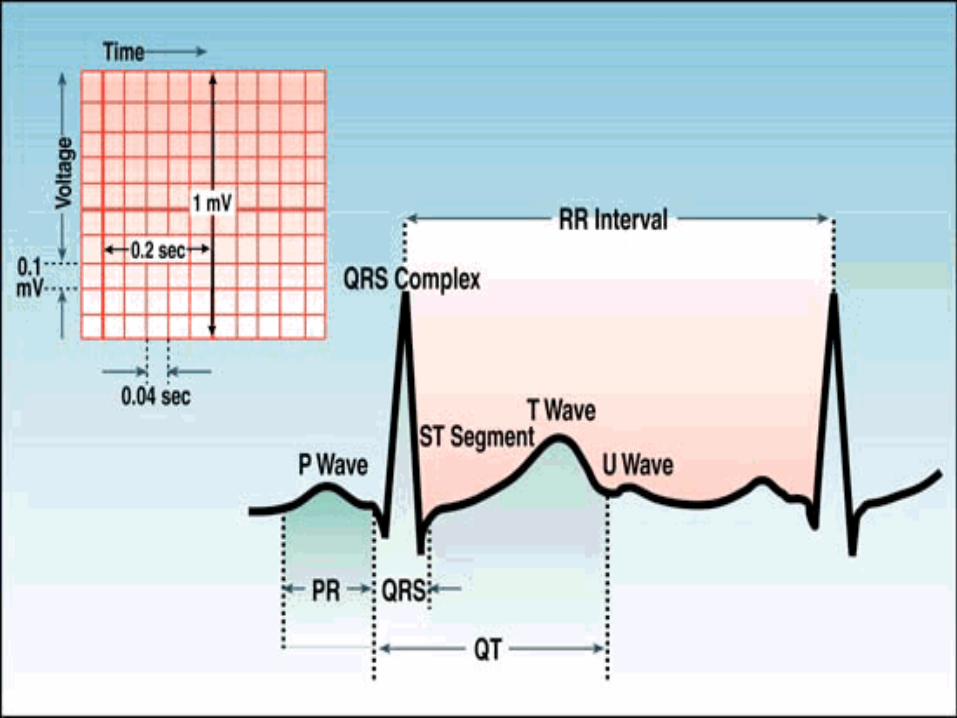
P wave First wave seen. Small rounded, upright (positive) wave indicating atrial depolarization (and contraction)
PR interval Distance between beginning of P wave and beginning of QRS complexMeasures time during which a depolarization wave travels from the atria to the ventricles
QRS complex Three deflections following P wave Indicates ventricular depolarization (and contraction)Q Wave: First negative deflectionR Wave: First positive deflectionS Wave: First negative deflection after R wave
ST segment Distance between S wave and beginning of T wave. Measures time between ventricular depolarization and beginning of repolarization
T wave Rounded upright (positive) wave following QRSRepresents ventricular repolarization
QT interval Measured from beginning of QRS to end of T wave.

ECG Analysis
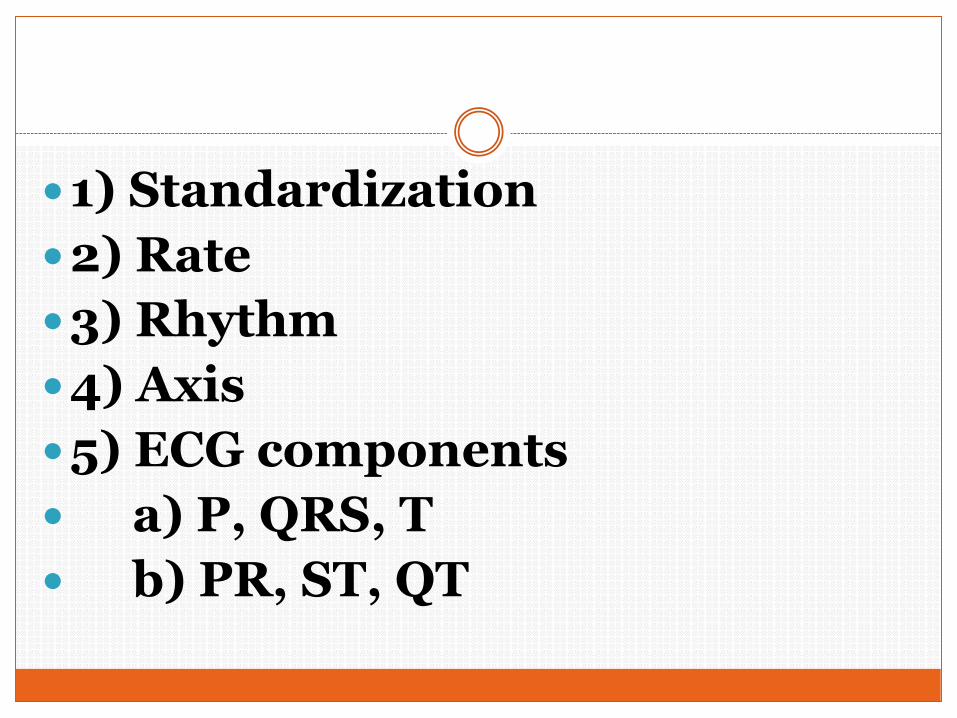
1) Standardization
2) Rate
3) Rhythm
4) Axis
5) ECG components
a) P, QRS, T
b) PR, ST, QT
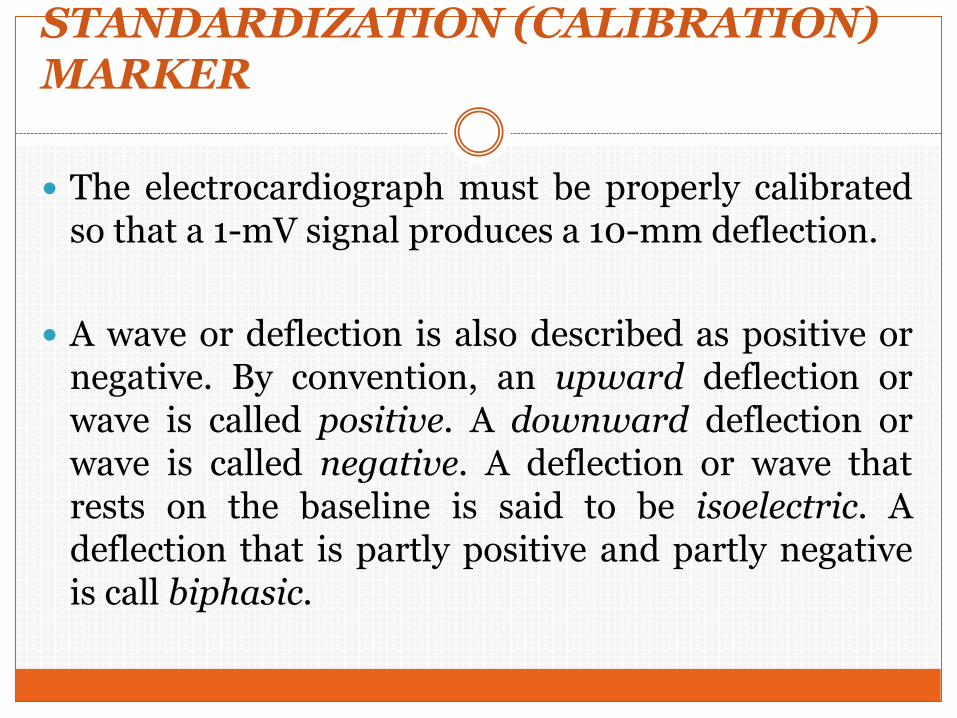
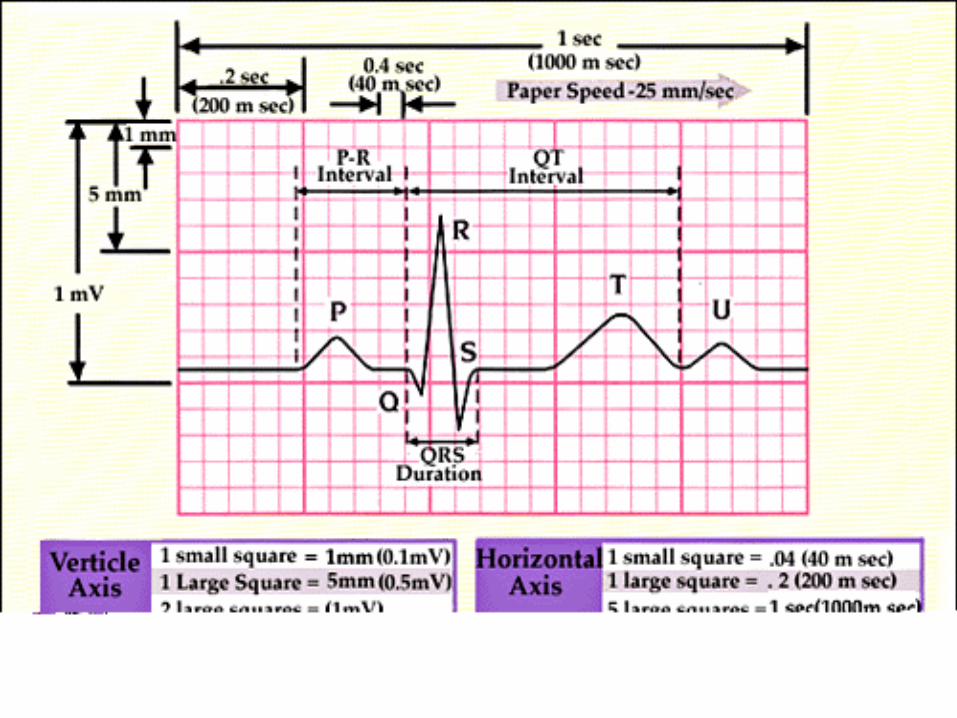
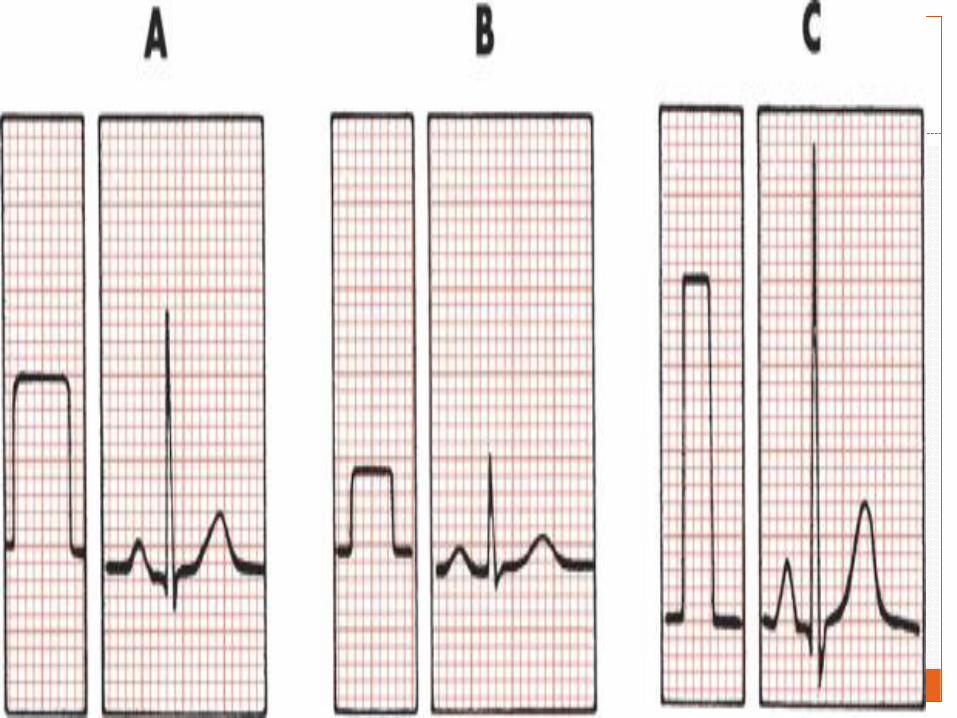
STANDARDIZATION (CALIBRATION) MARKER
The electrocardiograph must be properly calibratedso that a 1-mV signal produces a 10-mm deflection.
A wave or deflection is also described as positive ornegative. By convention, an upward deflection orwave is called positive. A downward deflection orwave is called negative. A deflection or wave thatrests on the baseline is said to be isoelectric. Adeflection that is partly positive and partly negativeis call biphasic.
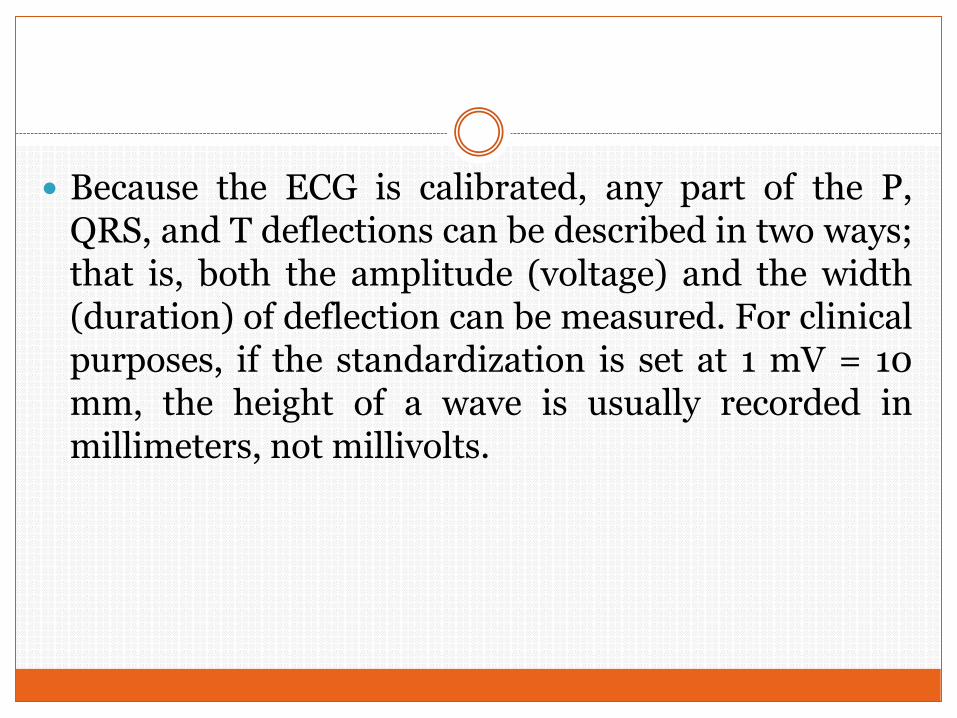
Because the ECG is calibrated, any part of the P,QRS, and T deflections can be described in two ways;that is, both the amplitude (voltage) and the width(duration) of deflection can be measured. For clinicalpurposes, if the standardization is set at 1 mV = 10mm, the height of a wave is usually recorded inmillimeters, not millivolts.
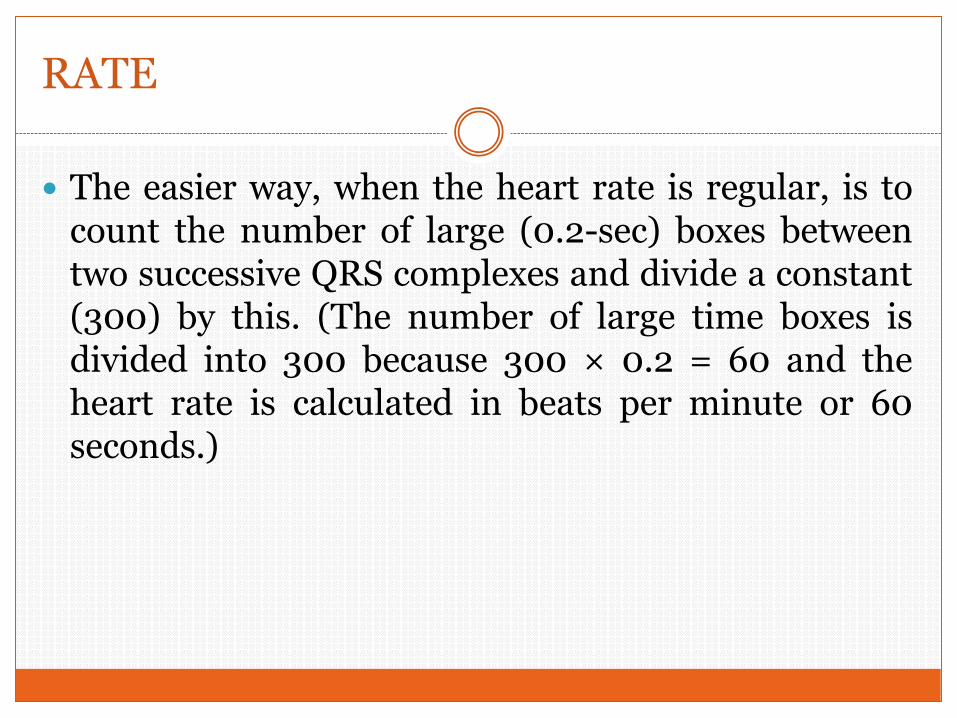
RATE
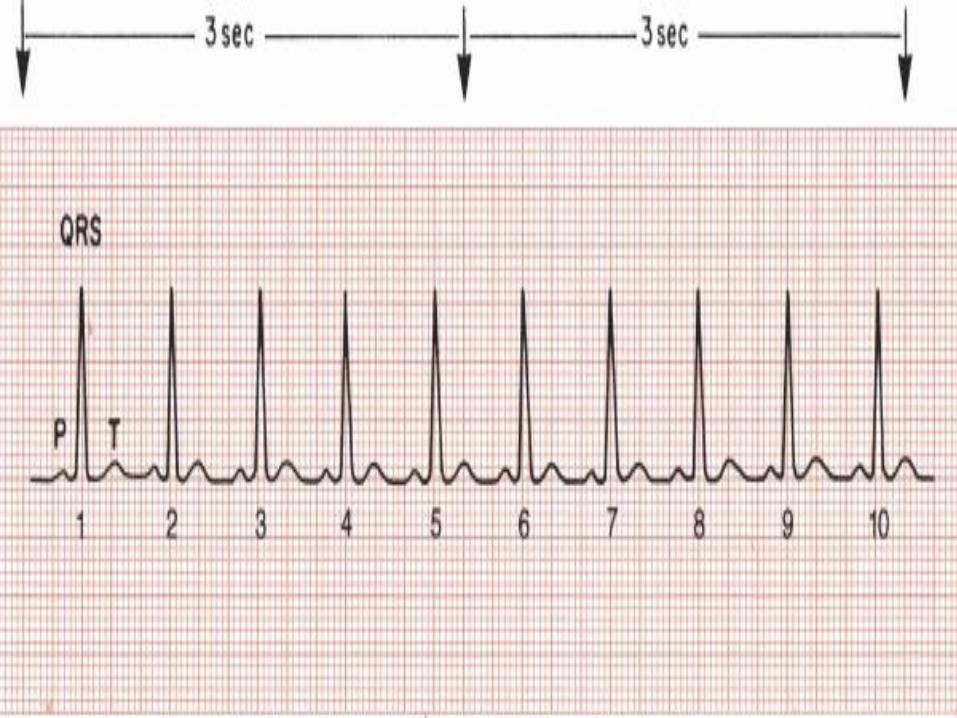
The easier way, when the heart rate is regular, is tocount the number of large (0.2-sec) boxes betweentwo successive QRS complexes and divide a constant(300) by this. (The number of large time boxes isdivided into 300 because 300 × 0.2 = 60 and theheart rate is calculated in beats per minute or 60seconds.)
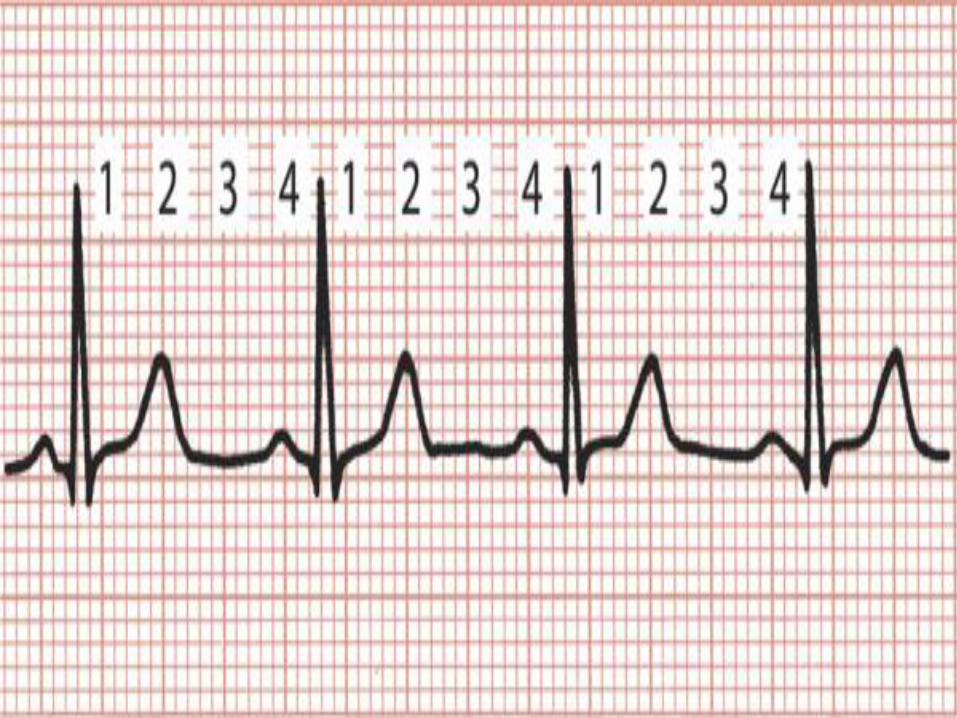
When the heart rate is fast or must be measured veryaccurately from the ECG, you can modify theapproach as follows: Count the number of small(0.04-sec) boxes between successive R waves anddivide a constant (1500) by this number. In previousfigure , 20 small time boxes are counted betweenQRS complexes. Therefore the heart rate is 1500 ÷20 = 75 beats/min. (The constant 1500 is usedbecause 1500 × 0.04 = 60 and the heart rate is beingcalculated in beats per 60 seconds.)
QRS counting method
If the heart rate is irregular, the first method will not be accurate because the intervals between QRS complexes vary from beat to beat. In such cases you can determine an average rate simply by counting the number of QRS complexes in some convenient time interval (e.g., every 6 seconds or every 10 seconds) and multiplying this number by the appropriate factor to obtain the rate in beats per 60 seconds.
ECG waves & intervals
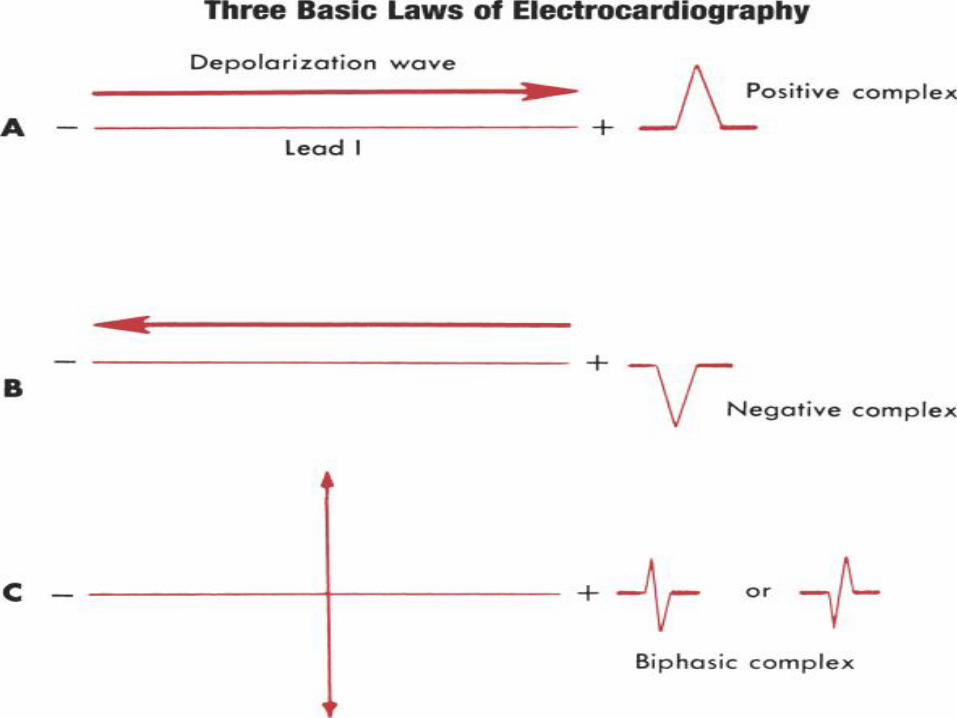
THREE BASIC “LAWS” OF ELECTROCARDIOGRAPHY:
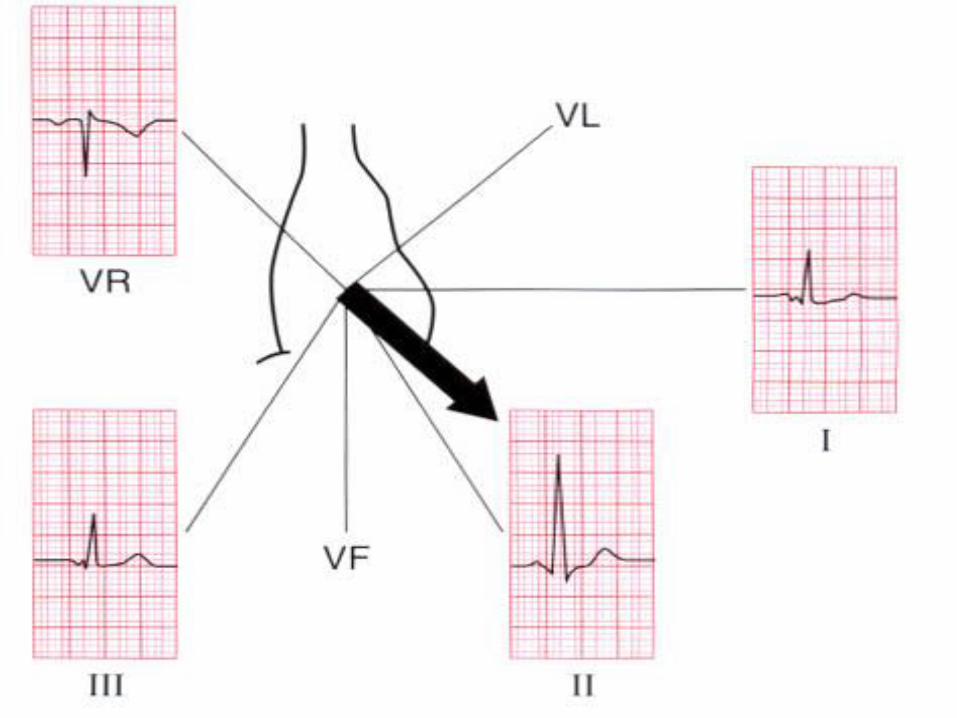
1. A positive (upward) deflection appears in anylead if the wave of depolarization spreads towardthe positive pole of that lead. Thus if the path ofatrial stimulation is directed downward and to thepatient's left, toward the positive pole of lead II, apositive (upward) P wave is seen in lead II .Similarly, if the ventricular stimulation path isdirected to the left, a positive deflection (R wave) isseen in lead I .
2. A negative (downward) deflection appears inany lead if the wave of depolarization spreads towardthe negative pole of that lead (or away from thepositive pole). Thus if the atrial stimulation pathspreads downward and to the left, a negative P waveis seen in lead aVR . If the ventricular stimulationpath is directed entirely away from the positive poleof any lead, a negative QRS complex (QS deflection)is seen .

3. If the mean depolarization path is directed atright angles (perpendicular) to any lead, asmall biphasic deflection (consisting of positive andnegative deflections of equal size) is usually seen. Ifthe atrial stimulation path spreads at right angles toany lead, a biphasic P wave is seen in that lead. If theventricular stimulation path spreads at right anglesto any lead, the QRS complex is biphasic . A biphasicQRS complex may consist of either an RS pattern ora QR pattern.
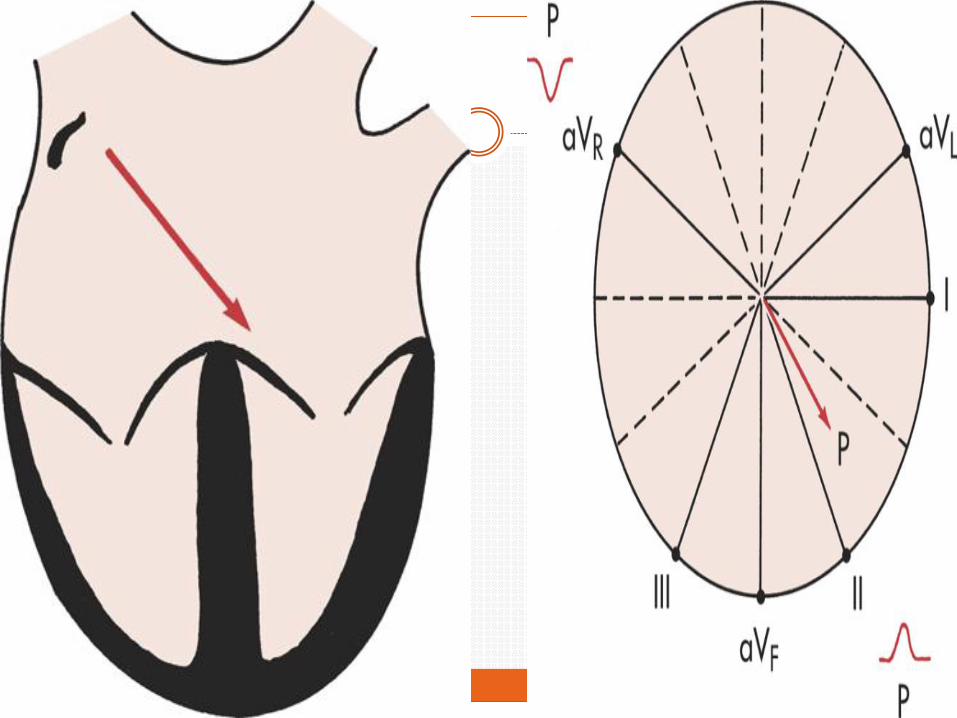
NORMAL P WAVE
The P wave, which represents atrial depolarization.
when normal sinus rhythm is present, the P wave isalways negative in lead aVr and positive in leadII(biphasic in V1)
P wave amplitude rarely exceeds two and a half smallsquares (0.25 mV). The duration of the P waveshould not exceed three small squares (0.12 s).
PR interval
The PR interval is the time between the onset ofatrial depolarisation and the onset of ventriculardepolarisation, and it is measured from thebeginning of the P wave to the first deflection of theQRS complex whether this be a Q wave or an R wave.
The normal duration of the PR interval is three tofive small squares (0.12-0.20 s).
Abnormalities of the conducting system may lead totransmission delays, prolonging the PR interval

NORMAL QRS COMPLEX
The QRS, which represents ventricular depolarization.
1. The first phase of ventricular depolarization is ofrelatively brief duration (shorter than 0.04 sec) andsmall amplitude. It results from spread of the stimulusthrough the interventricular septum. The septum is thefirst part of the ventricles to be stimulated. Furthermore,the left side of the septum is stimulated first (by a branchof the left bundle of His). Thus depolarization spreadsfrom the left ventricle to the right across the septum.Phase one of ventricular depolarization (septalstimulation) can therefore be represented by a smallarrow pointing from the left septal wall to the right
2. The second phase of ventricular depolarizationinvolves simultaneous stimulation of the main massof both the left and right ventricles from the inside(endocardium) to the outside (epicardium) of theheart muscle. In the normal heart, the left ventricleis electrically predominant. In other words, itelectrically overbalances the right ventricle.Therefore, an arrow representing phase two ofventricular stimulation points toward the leftventricle
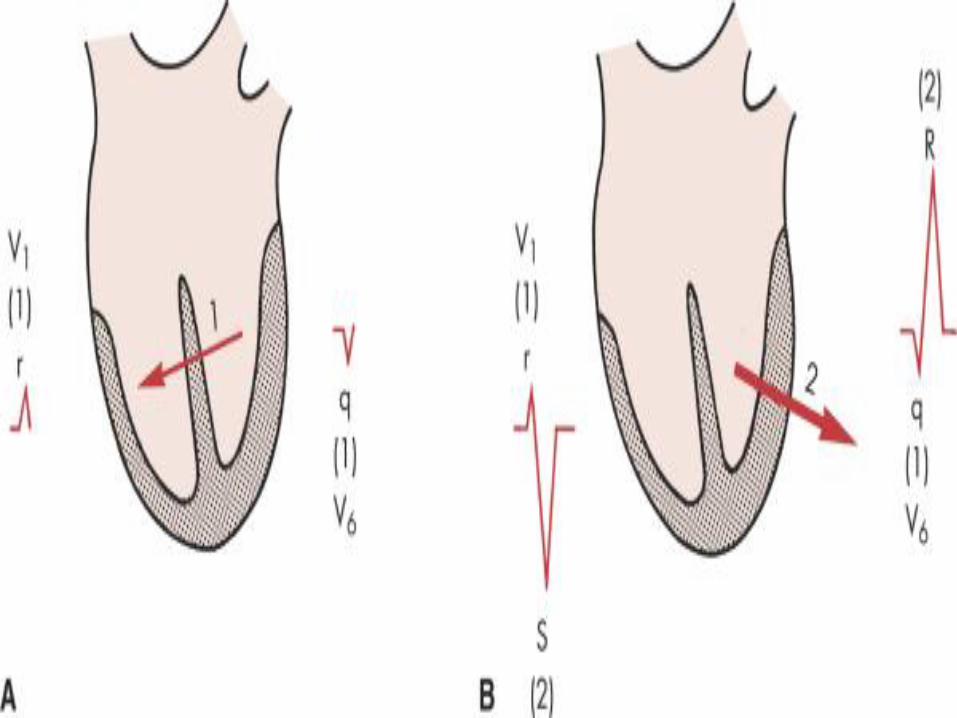
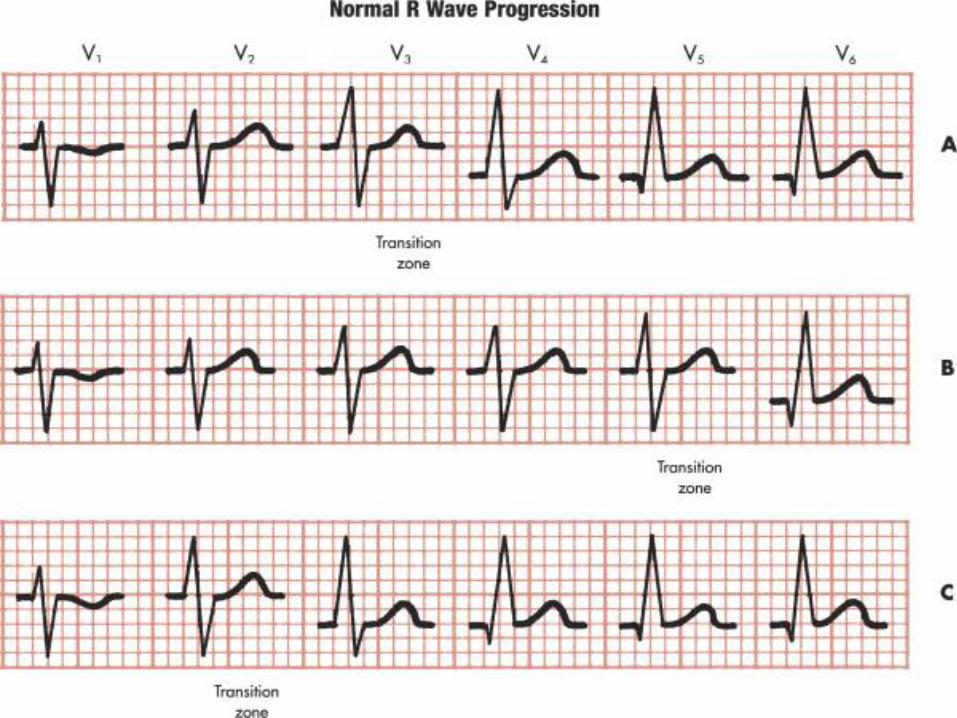
QRS in chest leads
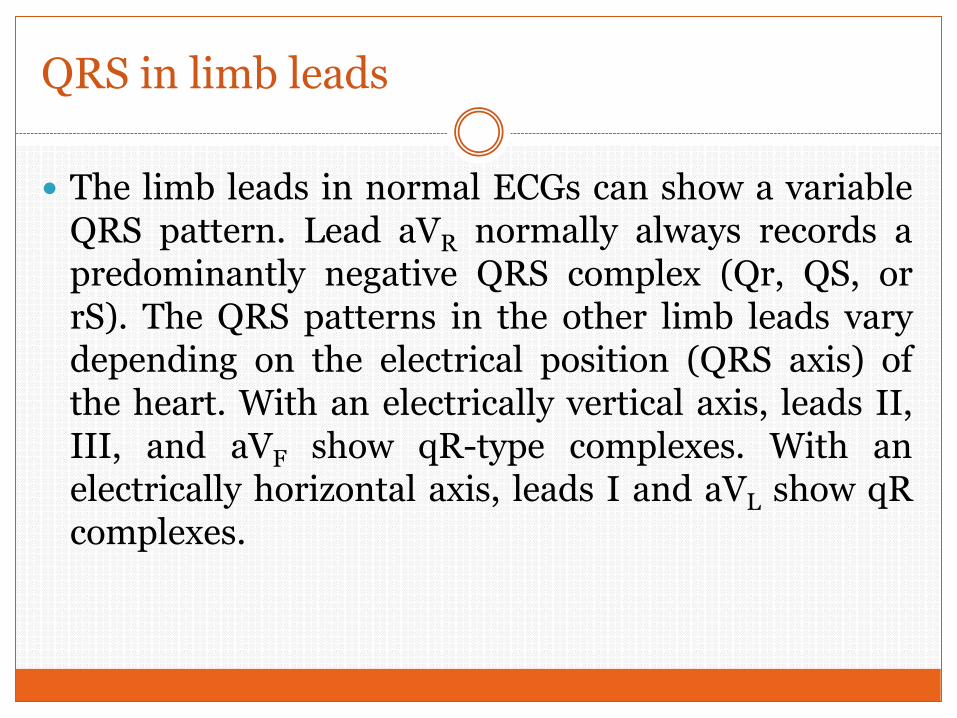
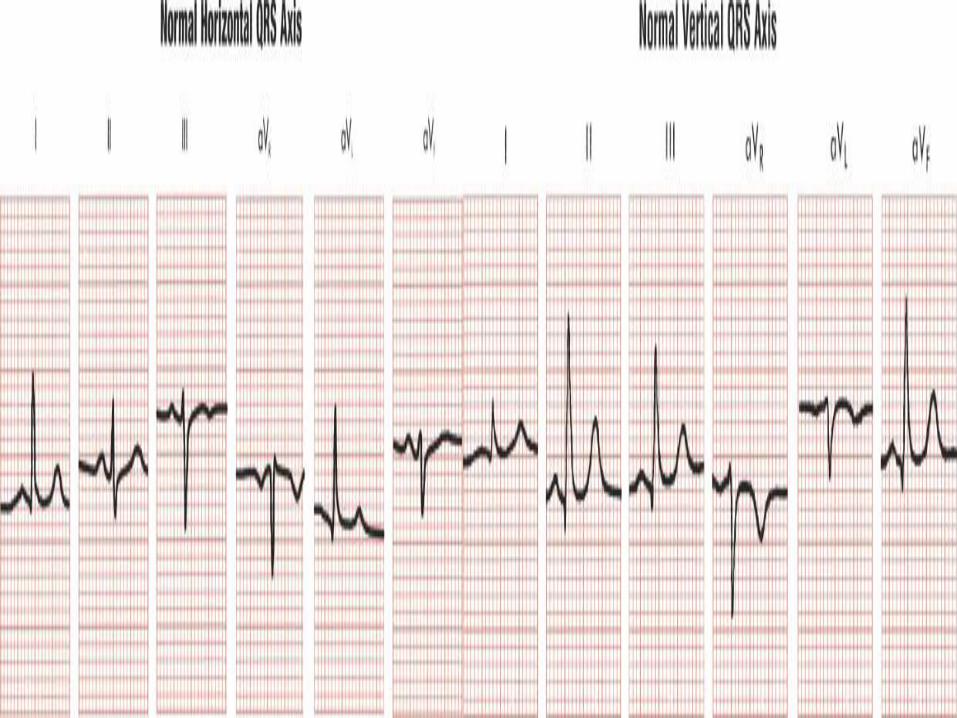
QRS in limb leads
The limb leads in normal ECGs can show a variableQRS pattern. Lead aVR normally always records apredominantly negative QRS complex (Qr, QS, orrS). The QRS patterns in the other limb leads varydepending on the electrical position (QRS axis) ofthe heart. With an electrically vertical axis, leads II,III, and aVF show qR-type complexes. With anelectrically horizontal axis, leads I and aVL show qRcomplexes.
NORMAL ST SEGMENT
The normal ST segment, representing the earlyphase of ventricular repolarization, is usuallyisoelectric (flat on the baseline). Slight deviations(generally less than 1mm) may be seen normally. TheECGs of certain healthy people show more markedST segment elevations as a normal variant (earlyrepolarization pattern).
NORMAL T WAVE
Ventricular repolarization—the return of stimulatedmuscle to the resting state—produces the STsegment, T wave, and U wave.
As a rule, the T wave follows the direction of themain QRS deflection. Thus when the main QRSdeflection is positive (upright), the T wave isnormally positive.

NORMAL T WAVE
The normal T wave is always negative in lead aVR but positive in lead II.
Left-sided chest leads such as V4 toV6 normally always show a positive T wave.
The T wave in the other leads may be variable.
If the T wave is positive in any chest lead, it must remain positive in all chest leads to the left of that lead
QT interval
The QT interval is measured from the beginning of the QRS complex to the end of the T wave and represents the total time taken for depolarisation and repolarisation of the ventricles.
As a general guide the QT interval should be 0.35-0.45 s, and should not be more than half of the interval between adjacent R waves (R-R interval).
(QTc): QTc = QT/√R-R (seconds).

U wave
The U wave is a small deflection that follows the Twave. It is generally upright except in the aVR leadand is often most prominent in leads V2 to V4.
U waves result from repolarisation of the mid-myocardial cells—that is, those between theendocardium and the epicardium—and the His-Purkinje system.
Many electrocardiograms have no discernible Uwaves. Prominent U waves may be found in athletesand are associated with hypokalaemia andhypercalcaemia.
Exam
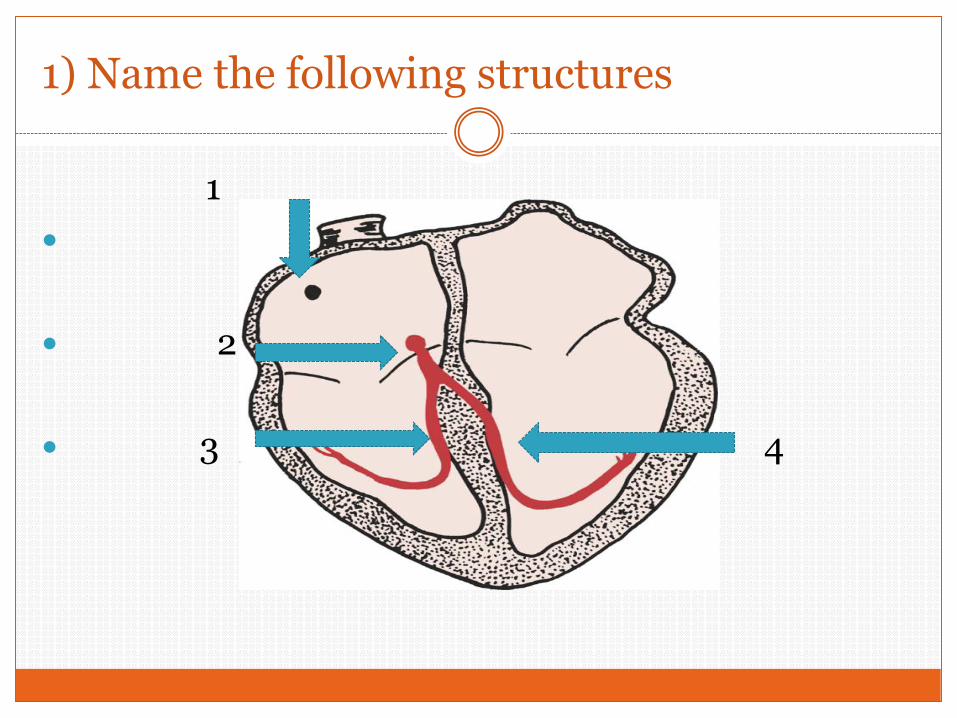
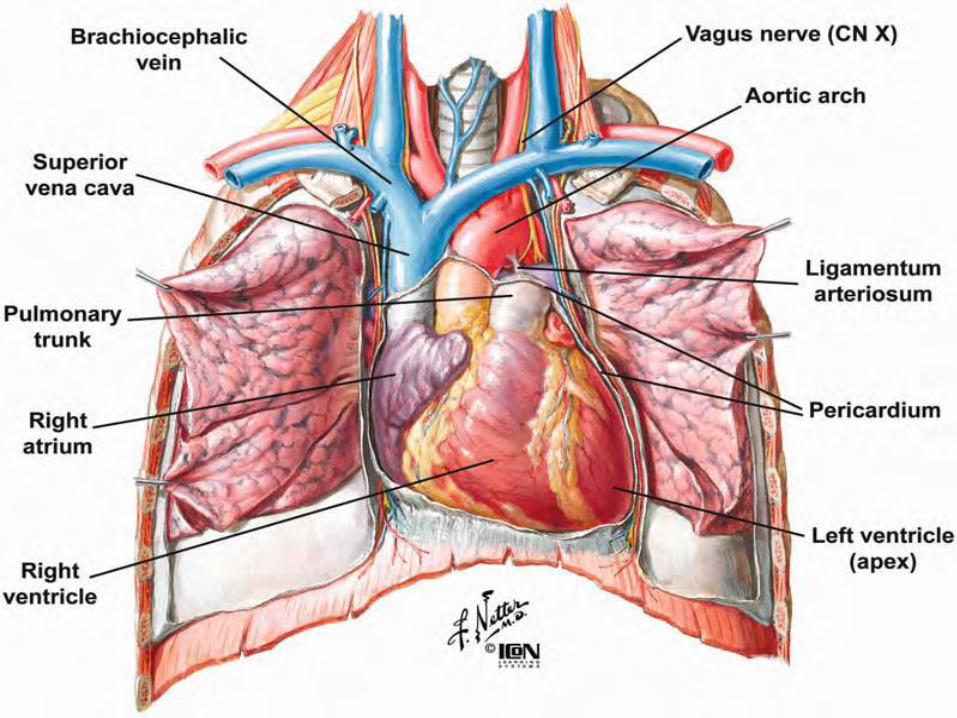
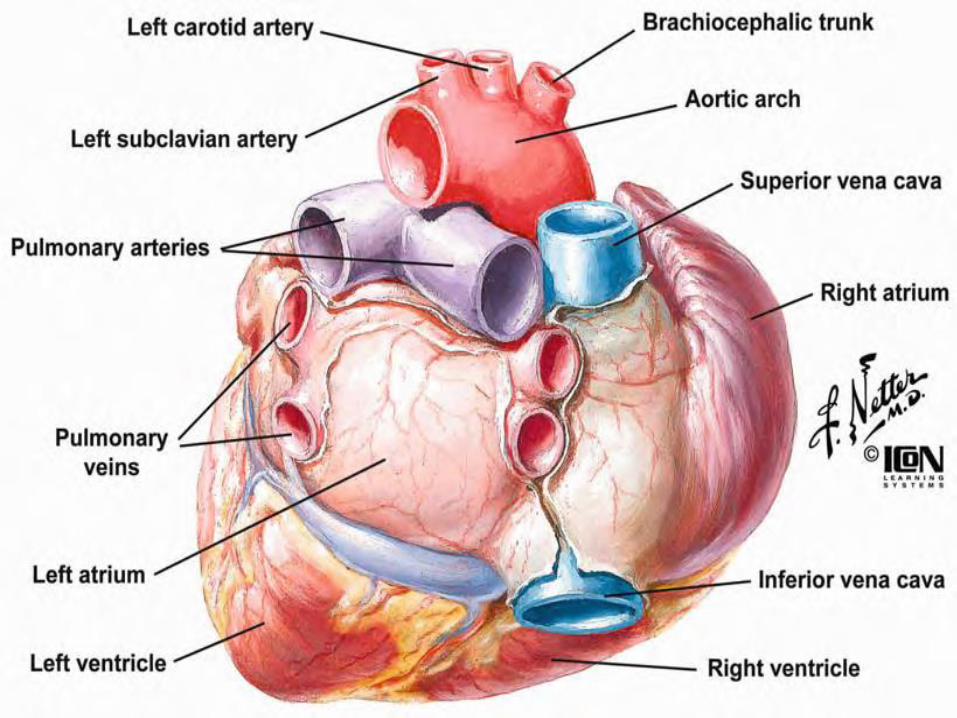
1) Name the following structures
1
2
3 4
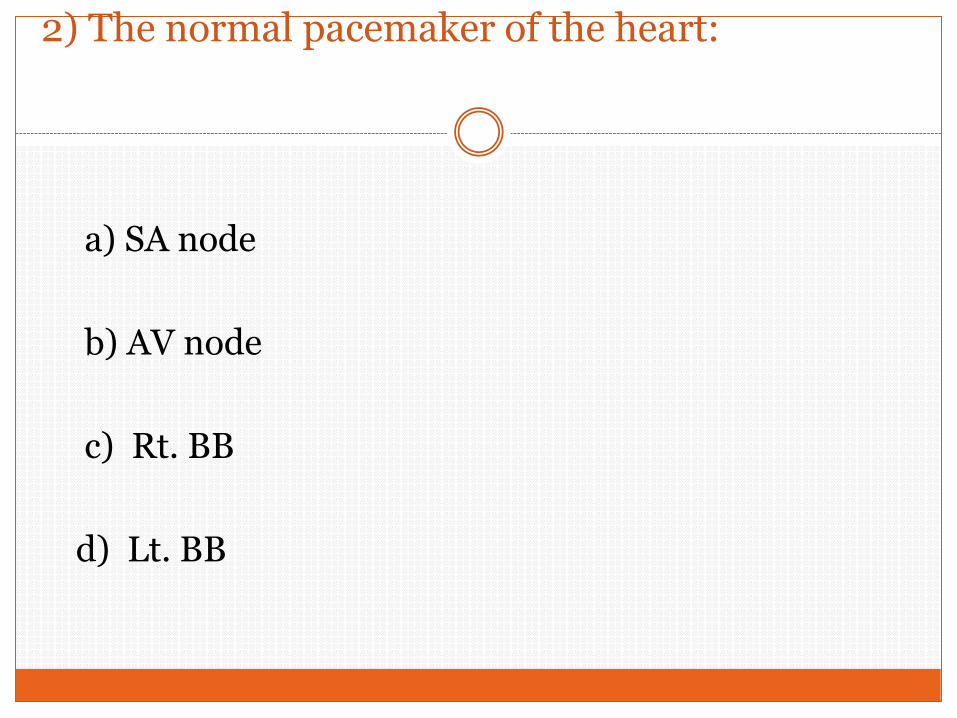
2) The normal pacemaker of the heart:
a) SA node
b) AV node
c) Rt. BB
d) Lt. BB
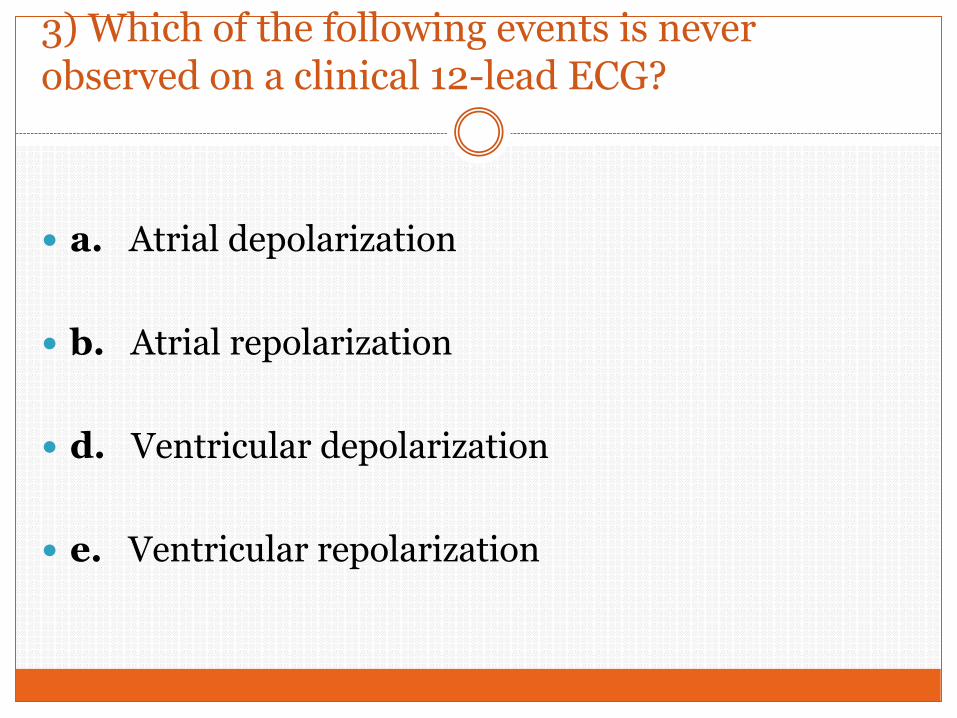
3) Which of the following events is never observed on a clinical 12-lead ECG?
a. Atrial depolarization
b. Atrial repolarization
d. Ventricular depolarization
e. Ventricular repolarization
4) A block in the left bundle branch is most likely to do which of the following?
a. Prolong the PR interval
b. Prolong the QRS complex
c. Prolong the ST segment
d. All of the above
5) Slowing of conduction in the atrioventricular (AV) node is most likely to do which of the following?
a. Prolong the PR interval
b. Prolong the QRS interval
c. Prolong the QT interval
d. All of the above
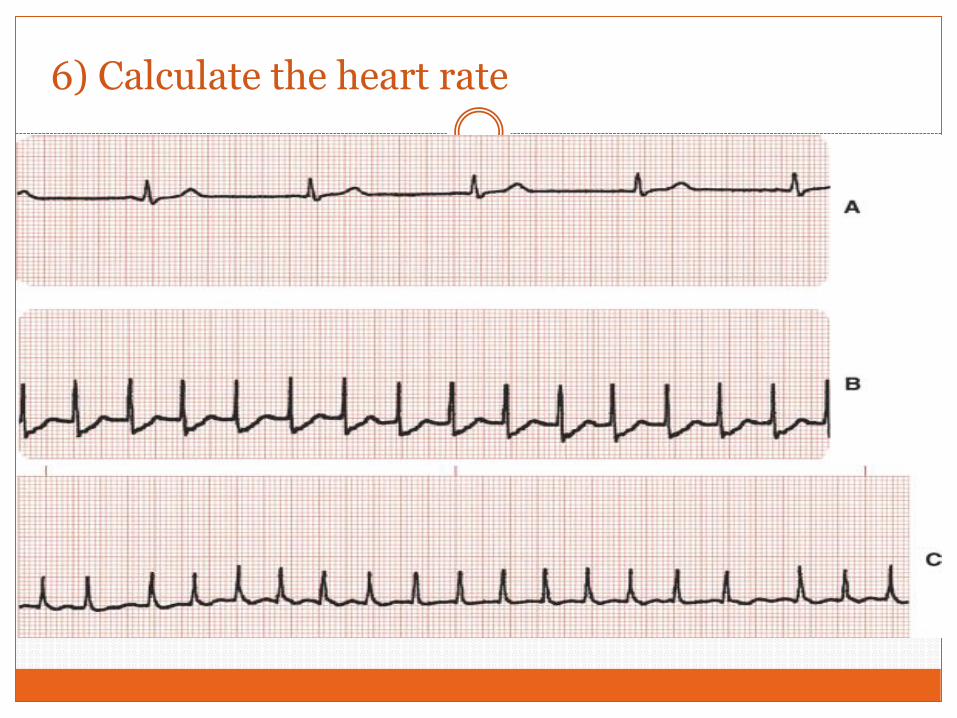
6) Calculate the heart rate
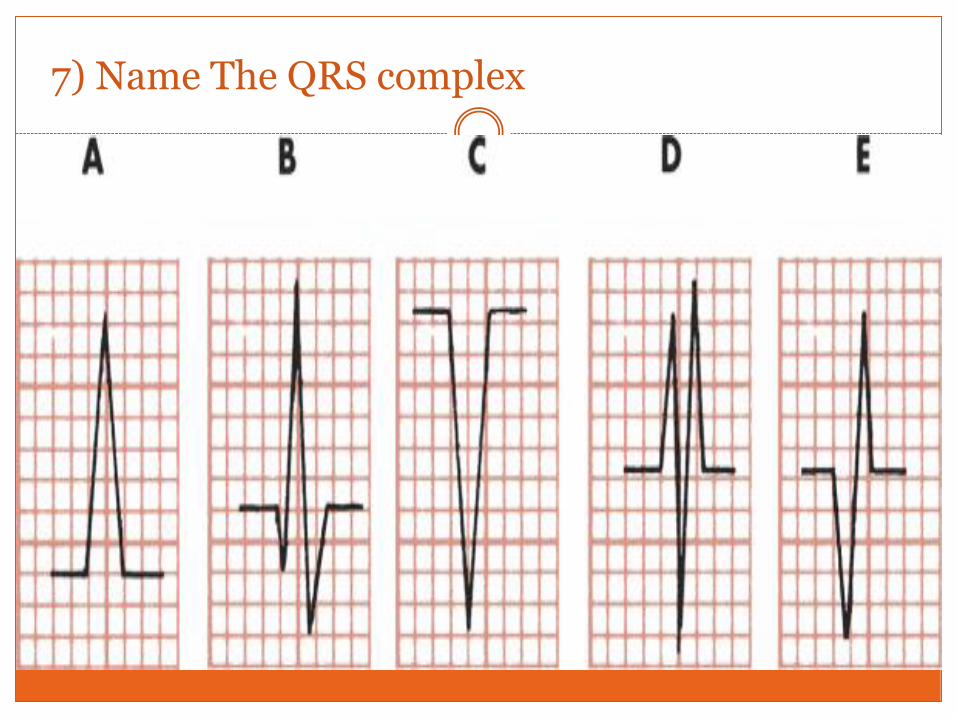
7) Name The QRS complex
8) The following leads are bipolar except
A) I
B) II
C) III
D) aVR
9) The lead in which all ECG waves are negative
A) a VL
B) II
C) V1
D) a VR
10)The normal duration of QRS complex
A) 100 msec
B) 200 msec
C) 300 msec
D) 400 msec
11) The atrial depolarization is represented by
A) P wave
B) QRS complex
C) T wave
D) U wave
12) Ventricular repolarization is represented by
A) P wave
B) QRS complex
C) T wave
D) U wave
13) The ECG Limb leads are
A) 3 leads
B) 6 leads
C) 9 leads
D) 12 leads
14) PR interval
A) End of P wave to end of QRS
B) Onset of P wave to onset of QRS
C) Onset of P wave to end of QRS
D) End of P wave to onset of QRS
15) Normal PR interval
A) 120-200 msec
B) 220- 320 msec
C) 100-150 msec
D) 250-300 msec
16) Early phase of ventricular repolarization is represented by
A) PR interval
B) QT interval
C) ST segment
D) T wave
17) Standardization means
A) 1mm = 10 mV
B) 10 mm = 1 m V
C) 5 mm = 1 m V
D) 20 mm = 0.5 m V
18) 2 seconds on ECG paper are
A) 2 large squares
B) 20 small squares
C) 50 small squares
D) 20 large squares
19) Lead III is between
A) Left arm & right arm
B) Right arm & right foot
C) Right arm & left foot
D) None of the above
20) a VF records electrical activity at
A) Right arm
B) Left arm
C) Right foot
D) None of the above
21) Tachycardia is defined as heart rate above
A) 70 bpm
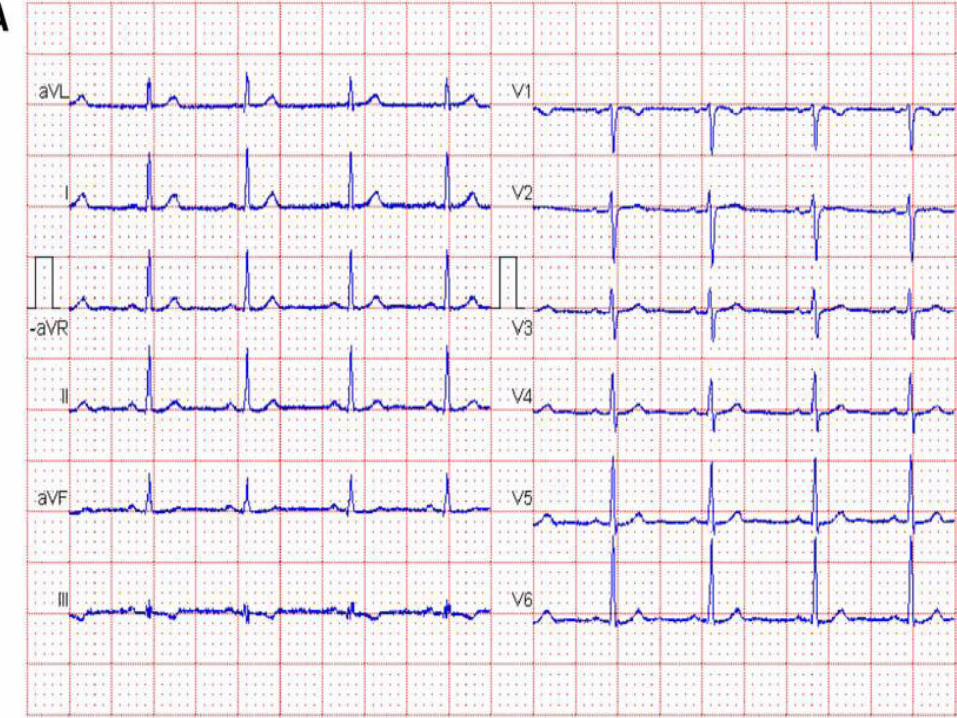
B) 80 bpm
C) 90 bpm
D) 100 bpm
22) Bradycardia means heart rate is less than
A) 70 bpm
B) 60 bpm
C) 50 bpm
D) 40 bpm
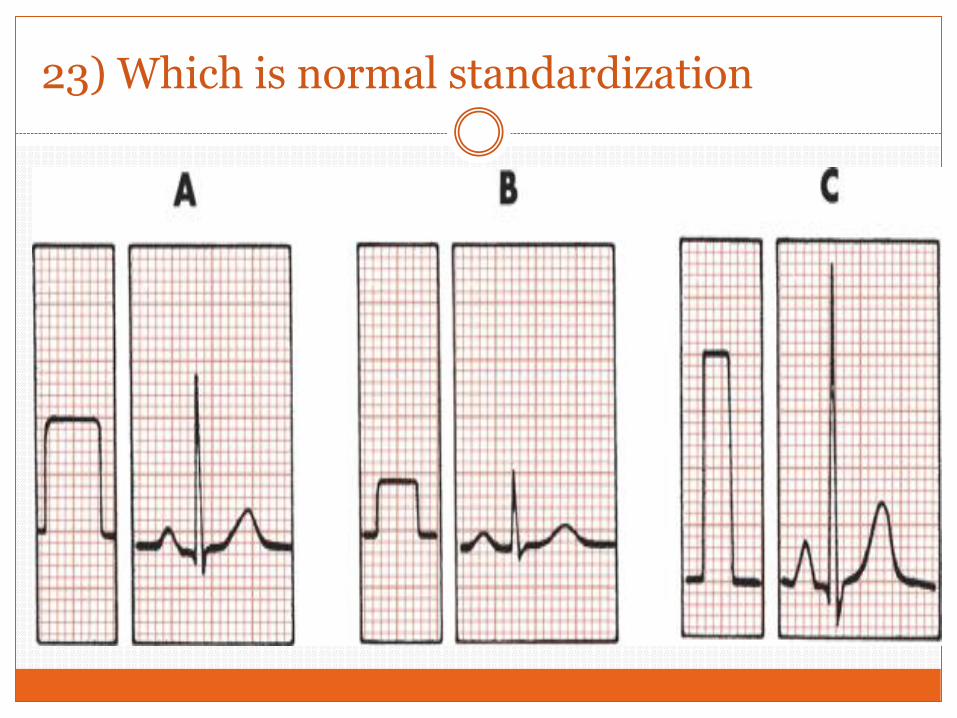
23) Which is normal standardization
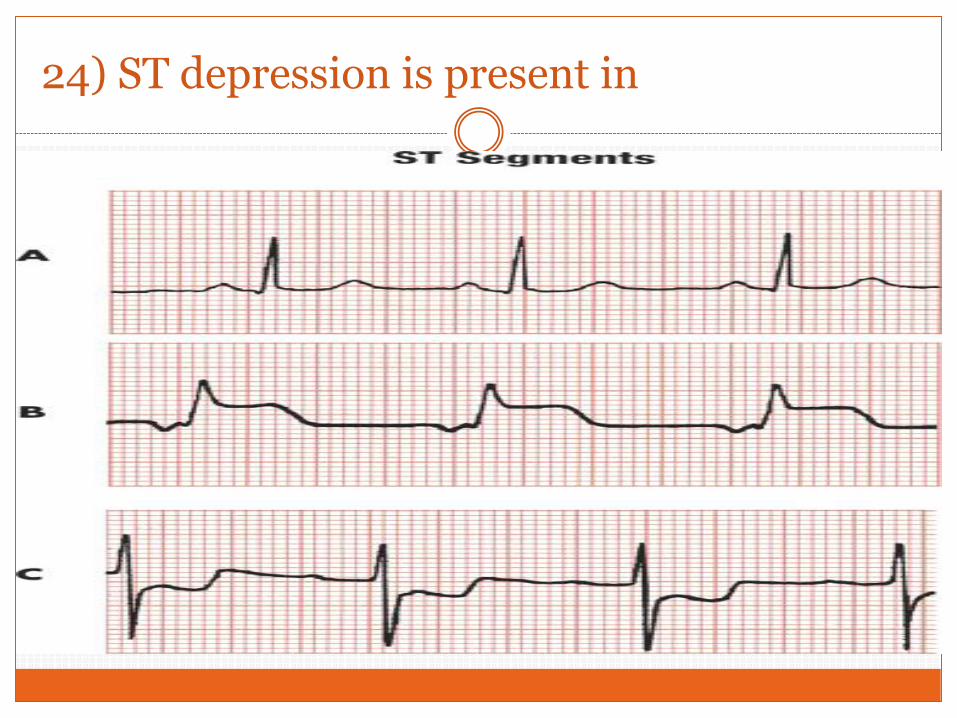
24) ST depression is present in
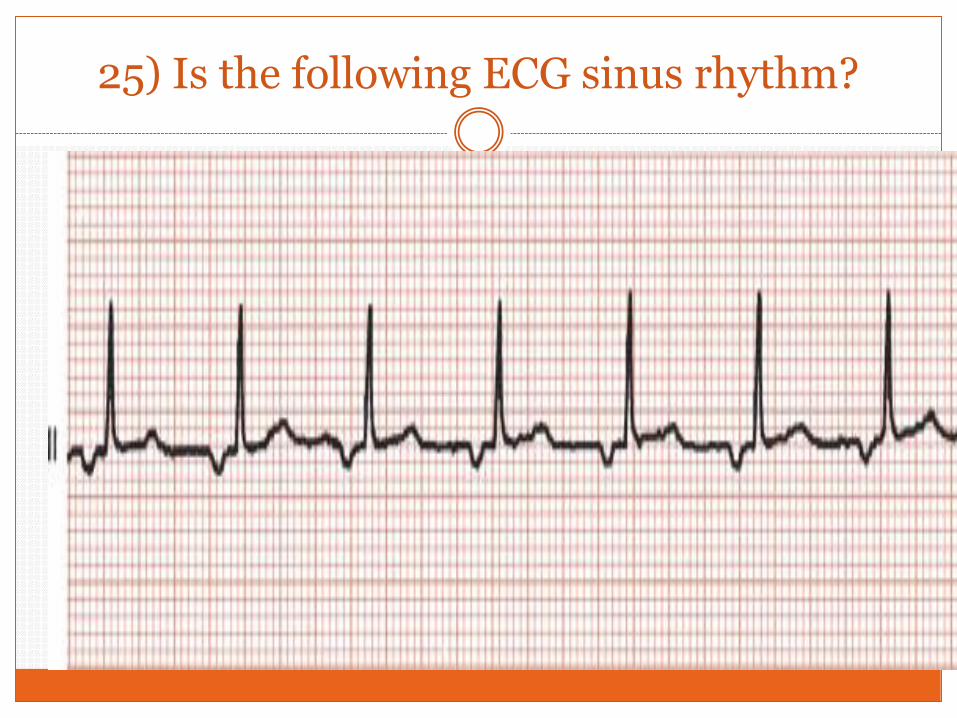
25) Is the following ECG sinus rhythm?