base-activated persulfate treatment of contaminated soils ... · base-activated persulfate...
TRANSCRIPT

BASE-ACTIVATED PERSULFATE TREATMENT OF CONTAMINATED
SOILS WITH pH DRIFT FROM ALKALINE TO CIRCUMNEUTRAL
By
MICHAEL ANDREW MIRAGLIO
A thesis submitted in partial fulfillment of
the requirements for the degree of
MASTER OF SCIENCE IN ENVIRONMENTAL ENGINEERING
WASHINGTON STATE UNIVERSITY
Department of Civil and Environmental Engineering
May 2009

ii
To the Faculty of Washington State University:
The members of the Committee appointed to examine the
dissertation/thesis of Michael Andrew Miraglio find it satisfactory and
recommend that it be accepted.
___________________________________
Richard Watts, Ph.D., Chair
___________________________________
Amy Teel, Ph.D.
___________________________________
Balasingam Muhunthan, Ph.D.

iii
ACKNOWLEDGMENTS
The culmination of my research with the completion of this thesis paper
symbolizes the apex and conclusion of my fantastic though sometimes academically
strenuous career at Washington State University. First and foremost, I would like to
thank my advisor Dr. Rick Watts, who generously allowed me join his research team. I
am truly grateful for the steady support, guidance, and patience he has shown me
throughout my graduate career.
I graciously appreciate the encouragement and guidance I have received from the
entire faculty, professors, and my friends in the Civil Engineering department. I would
like to thank Dr. Balasingam Muhunthan and Dr. Amy Teel for being on my committee.
I am very grateful for all the help I received from Rob, Joseph, Josh, Olga, Ana,
Jeremiah, Chase, and Mushtaque; thank you guys for always keeping the mood light, and
helping me overt disaster with your guidance and kindness.
Any acknowledgement would not be complete without mentioning my family.
My love and appreciation go to my mother and father, Mike and Carol, whom I draw
inspiration from and owe everything to for supporting and encouraging me throughout
my academic career. I also am grateful to have two loving sisters, Sophia and Angelina.
Thank you all!

iv
BASE-ACTIVATED PERSULFATE TREATMENT OF CONTAMINATED
SOILS WITH pH DRIFT FROM ALKALINE TO CIRCUMNEUTRAL
ABSTRACT
by Michael Andrew Miraglio, M.S.
Washington State University
May 2009
Chair: Richard J. Watts
Recent empirical evidence suggests that base-activated persulfate must be
conducted at pH > 10 to be effective. However, other data suggests that persulfate
reactivity remains as the pH drifts below pH 10. The potential for persulfate activation
after base addition as the pH drifts from alkaline to circumneutral was investigated in
four soil systems of varying soil organic matter (SOM) contents. Two probe compounds,
nitrobenzene and hexachloroethane, were used to quantify the relative reactivity of
hydroxyl radical and reductants, respectively. Hydroxyl radical activity was greatest in
persulfate-soil slurries at pH 12 with decreasing hydroxyl radical activity in the systems
in which the pH had drifted to pH 10 and pH 8. Furthermore, greater rates of hydroxyl
radical generation were found with decreasing SOM contents, which is likely due to a
lower degree of hydroxyl scavenging by SOM.
Superoxide radical and reductant generation also occurred at all pH systems with
lower rates as the pH drifted toward circumneutral. In all pH systems, hexachloroethane
degradation was greatest in soil systems with greater SOM content. Considerably less
reductant formation occurred for the systems at pH 10 and pH 8 once the SOM was
removed, but reductants were still formed.

v
Persulfate decomposition and pH drift were also monitored in conjunction with
hydroxyl radical and reductant experiments. Persulfate decomposition occurred most
rapidly in the soil slurries with greater SOM. Persulfate decomposition was minimal in
all other slurries with the least decomposition occurring once SOM was removed. pH
drift was approximately parallel to persulfate decomposition in all four soil systems with
the most rapid decline in the higher SOM soil systems. The results of this research
demonstrate that base-activated persulfate may be more active than previously thought as
the pH drifts towards neutral. From a practical treatment perspective, application of
base-activated persulfate in situ may potentially extend treatment longer than previously
thought making it a more efficient ISCO technology.

vi
TABLE OF CONTENTS
Page
ABSTRACT ....................................................................................................................... iv
LIST OF TABLES ............................................................................................................ vii
LIST OF FIGURES ......................................................................................................... viii
1. Introduction ................................................................................................................... 1
2. Methodology .................................................................................................................. 3
2.1 Materials ................................................................................................................... 3
2.2 Soils ........................................................................................................................... 3
2.3 Probe Compounds ..................................................................................................... 4
2.4 Screening of Base Dosages ....................................................................................... 4
2.5 Experimental Procedures ......................................................................................... 5
2.6 Analysis ..................................................................................................................... 6
3. Results and Discussion .................................................................................................. 6
3.1 Persulfate decomposition and pH changes in soil slurries ....................................... 6
3.2 pH drift in soil slurries .............................................................................................. 8
3.3 Hydroxyl radical generation as pH drifts to circumneutral ................................... 10
3.4 Superoxide radical and reductant generation as the pH drifts to circumneutral ... 11
4. Conclusion ................................................................................................................... 12
References ........................................................................................................................ 14
Tables ............................................................................................................................... 16
Figures .............................................................................................................................. 17
vii
LIST OF TABLES
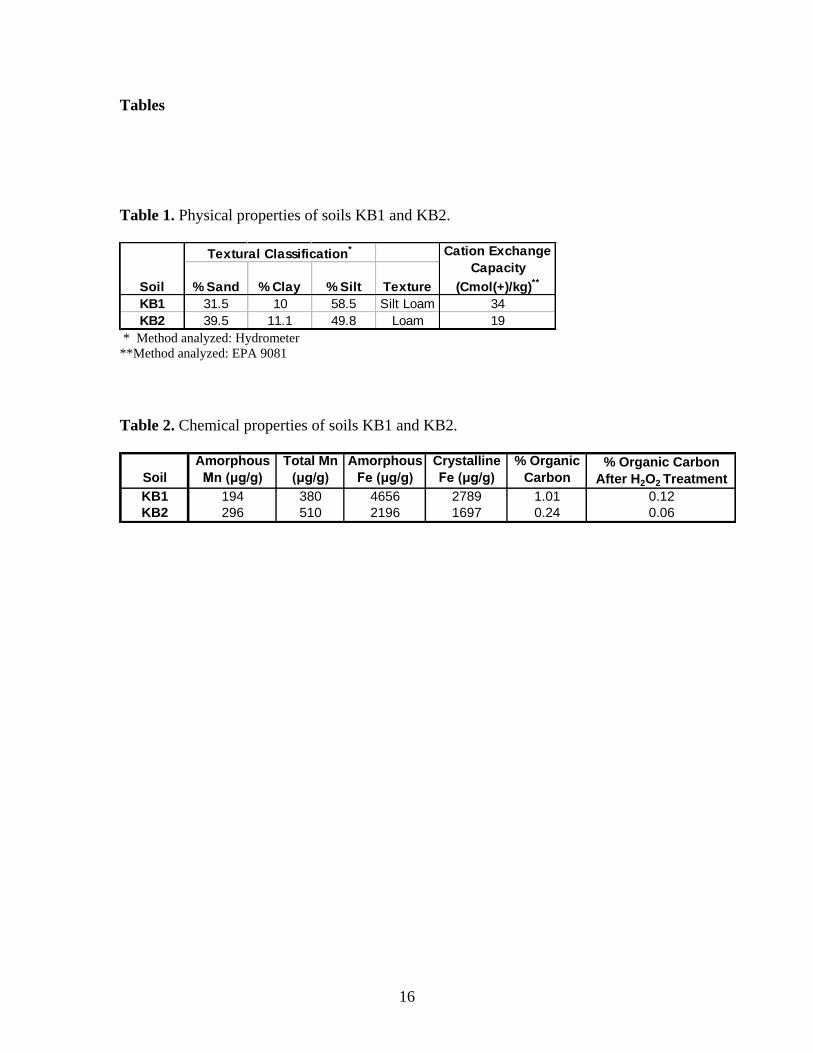
Table 1. Physical properties of soils KB1 and KB2. ........................................................ 16
Table 2. Chemical properties of soils KB1 and KB2. ...................................................... 16
viii
LIST OF FIGURES
Figure 1. pH profiles of various molar ratios of sodium hydroxide:sodium persulfate for
soils KB1 (a) and KB2 (b). ............................................................................................... 17
Figure 2. pH profiles of chosen molar ratios of sodium hydroxide:sodium persulfate for
soil slurries KB1 and KB2 indicating approximate spike times of probe compounds. .... 18
Figure 3. pH profiles of the selected molar ratio of 0.375:1 sodium hydroxide:sodium
persulfate for soil slurries KB1-No SOM and KB2-No SOM. ......................................... 18
Figure 4. Persulfate concentrations in soil slurries KB1(a) and KB2(b) in conjunction
with hydroxyl radical generation experiments. ................................................................. 19
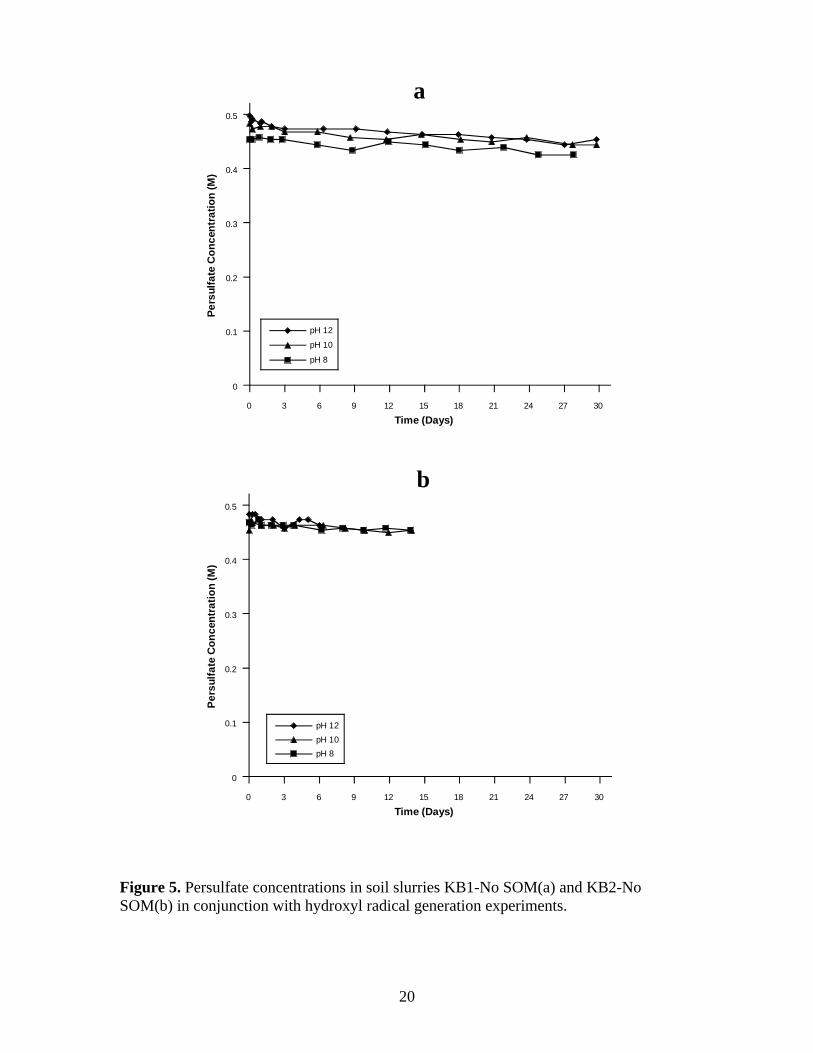
Figure 5. Persulfate concentrations in soil slurries KB1-No SOM(a) and KB2-No
SOM(b) in conjunction with hydroxyl radical generation experiments. .......................... 20
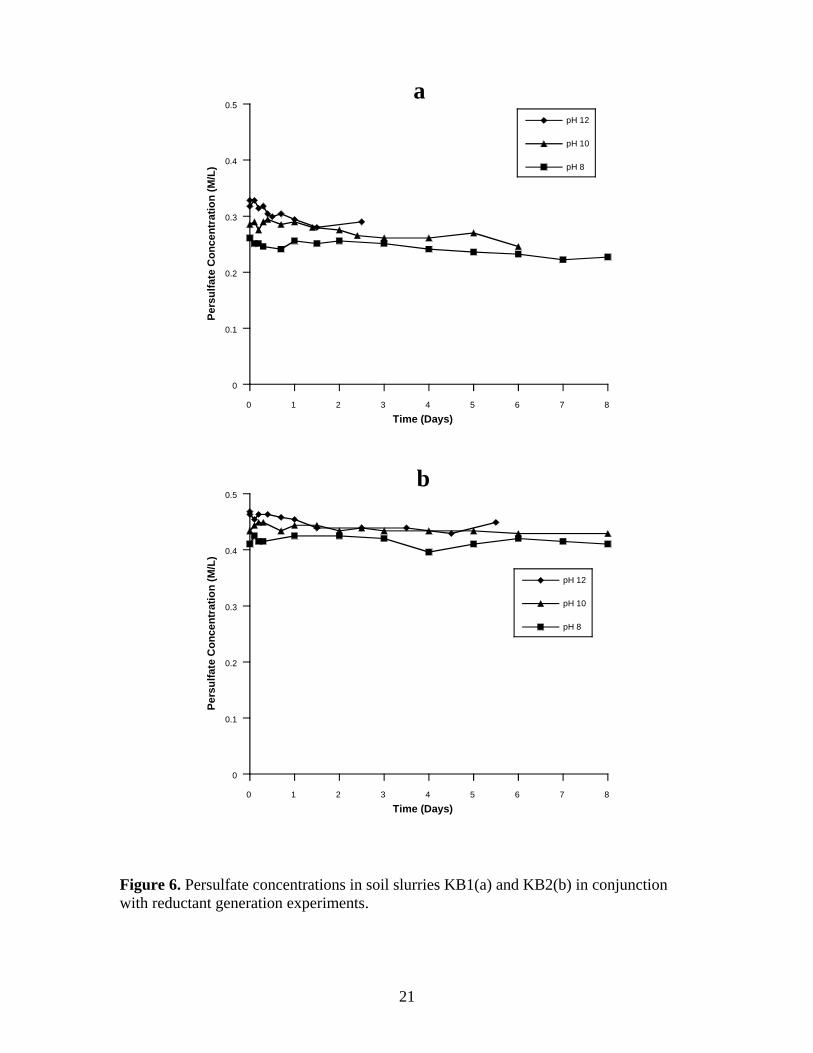
Figure 6. Persulfate concentrations in soil slurries KB1(a) and KB2(b) in conjunction
with reductant generation experiments. ............................................................................ 21
Figure 7. Persulfate concentrations in soil slurries KB1-No SOM(a) and KB2-No
SOM(b) ) in conjunction with reductant generation experiments. ................................... 22
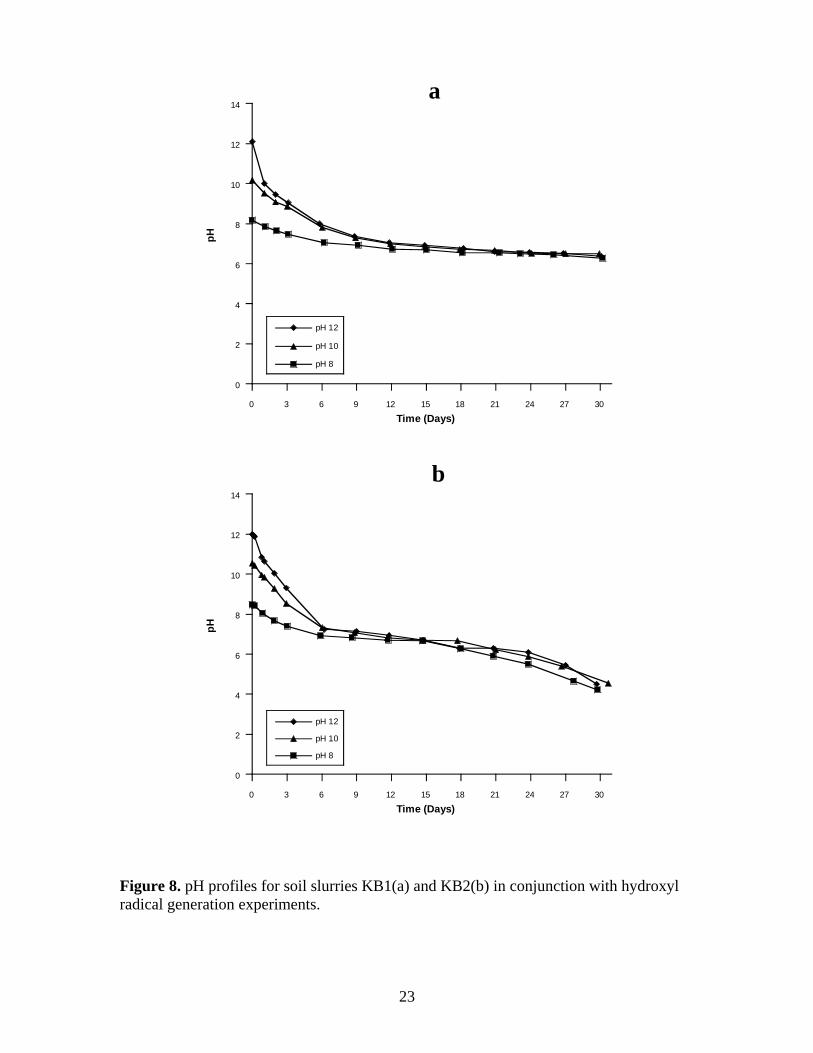
Figure 8. pH profiles for soil slurries KB1(a) and KB2(b) in conjunction with hydroxyl
radical generation experiments. ........................................................................................ 23
Figure 9. pH profiles for soil slurries KB1-No SOM(a) and KB2-No SOM(b) in
conjunction with hydroxyl radical generation experiments. ............................................. 24
Figure 10. pH profiles for soil slurries KB1(a) and KB2(b) in conjunction with reductant
generation experiments. .................................................................................................... 25
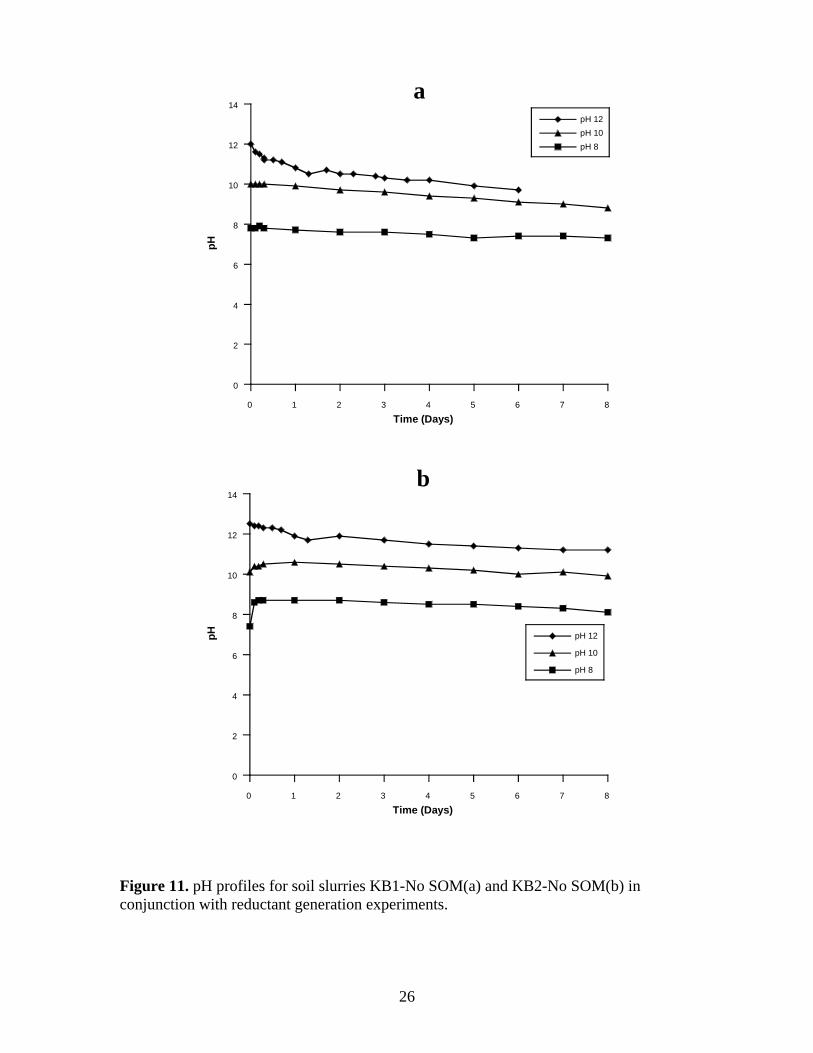
Figure 11. pH profiles for soil slurries KB1-No SOM(a) and KB2-No SOM(b) in
conjunction with reductant generation experiments. ........................................................ 26
Figure 12. Hydroxyl radical generation quantified through nitrobenzene degradation in
soil slurries KB1(a) and KB2(b). ...................................................................................... 27
Figure 13. Hydroxyl radical generation quantified through nitrobenzene degradation in
soil slurries KB1-No SOM(a) and KB2-No SOM(b). ...................................................... 28
Figure 14. Reductant generation quantified through hexachloroethane degradation in soil
slurries KB1(a) and KB2 (b). ............................................................................................ 29
Figure 15. Reductant generation quantified through hexachloroethane degradation in soil
slurries KB1-No SOM(a) and KB2-No SOM(b). ............................................................. 30

1
1. Introduction
Soils and groundwater contaminated with hazardous organic chemicals can often
present threats to public health and the environment. Therefore, continued efforts are
needed to develop remediation technologies. Many of the remediation technologies that
have evolved over the past 30 years have limitations. For example, pump-and-treat
systems are limited by rates of contaminant desorption and non-aqueous phase liquid
dissolution (Watts, 1998) and are characterized by high costs due to continued pumping
over long time periods (ITRC, 2005). Bioremediation may take significant time due to
difficulties in obtaining effective treatment, contaminant toxicity, insufficient nutrients,
and desorption and dissolution limitations (ITRC, 2008). Thermal remediation can be
heat transfer limited; furthermore, there are high costs involved with the transfer of heat
through the subsurface (Lighty et al., 1990).
An increasingly popular method for treating subsurface contamination is the use
of in situ chemical oxidation (ISCO), which involves the injection of strong oxidants into
the subsurface. Four ISCO oxidants have been developed over the past 20 years:
modified Fenton’s reagent, or catalyzed H2O2 propagations (CHP), permanganate, ozone,
and activated persulfate (Hulling and Pivetz, 2006). Permanganate is a relatively stable
and specific oxidant that reacts primarily with alkenes by addition to the C=C double
bond (Siegrist et al., 2001). CHP, ozone, and persulfate serve as oxidant sources for
radical based reactions that are relatively non-specific, providing the basis to destroy
most organic contaminants (Watts and Teel, 2006). Hydrogen peroxide and ozone are
short-lived in the subsurface, while persulfate can persist in the subsurface for months
(Brown et al., 2003). Therefore, the use of persulfate can be advantageous because it is a

2
nonspecific oxidant and has the potential to promote contact between the oxidant and
contaminants.
Two methods commonly used to activate persulfate are chelated iron and base.
One of the most commonly used chelated forms of iron is iron(II)-
ethylenediaminetetraacetic acid (Fe(II)-EDTA) (Block et al., 2004). Chelated iron
promotes the decomposition of persulfate to sulfate radicals:
EDTAFeEDTAFeOS 32
44
2
82 SOSO (1)
Base-activated persulfate is the most popular formulation currently used in field
applications. Furman et al. (2009) postulated that sulfate, hydroxyl, and superoxide
radicals are formed in base-activated persulfate systems:
HSOOHOHSOOOSO OH22
2
422233 (2)
75.11222 pKaHHOOH (3)
HOSOSOSOOOSOHO 2
2
44332 (4)
2
44 SOOHOHSO (5)
The generation of the suite of reactive oxygen species shown in equations 2-5 provides
widespread reactivity of base-activated persulfate formulations.
The effectiveness of base-activated persulfate in the subsurface is dependent on
pH. Empirical data from field investigations suggest that the reactivity of persulfate
formulations decreases dramatically at pH <10. Although Block et al. (2004), suggested
that base-activated persulfate is only effective at pH > 10, some results suggest that
contaminant oxidation may proceed at pH systems < 10, especially in the presence of
3
subsurface solids. The objective of this research was to investigate the reactivity of base-
activated persulfate formulations as the pH drifts from alkaline to circumneutral pH.
2. Methodology
2.1 Materials
Sodium persulfate (>98%) and hexachloroethane (99%) were purchased from
Sigma-Aldrich. Mixed hexanes, nitrobenzene (99%), sodium hydroxide, sodium
bicarbonate, and sodium carbonate were obtained from J.T. Baker. Sodium thiosulfate
(99%) and n-hexane were purchased from Fisher Chemical. Potassium iodide (99%) was
purchased from Alfa Aesar. Deionized water was purified to >18.0MΩ•cm with a
Barnstead Nanopure II deionizing system.
2.2 Soils
Two horizons of a surface soil, collected from an open slope near Kamiak Butte,
WA, were used in base-activated persulfate reactions. The two horizons (KB1 and KB2)
were chosen because of their varying soil organic carbon contents but similar mineralogy
(Table 1). The soils were crushed using a soil grinder and sieved through a 1.65 mm
sieve. Organic carbon content was determined by the Walkley-Black method (Walkley
and Black, 1934). Particle size distribution was analyzed using the pipette method (Gee
and Bauder, 1986). The citrate-bicarbonate-dithionite extraction method was used to
determine amorphous and crystalline iron and manganese oxyhydroxides content
(Jackson et al., 1986). Cation exchange capacity was analyzed by saturation with sodium
acetate at pH 8.2 (U.S. Soil Conservation Service, 1972). Physical and chemical
properties for the KB1 and KB2 soils are listed in Tables 1 and 2.

4
Soil organic matter (SOM) was removed from the two soils by addition of 20%
hydrogen peroxide (H2O2) (Robinson, 1927). Soil slurries received periodic additions of
H2O2 and were heated to 60° C until a visible color change of dark to light in the soil
occurred indicating that the SOM was removed. Soils were dried at 55° C, pulverized,
and sieved with a 1.65 mm sieve.
2.3 Probe Compounds
The probe compounds were selected based on their relative reactivities with each
of the reactive oxygen species. Nitrobenzene (NB) was used to detect hydroxyl radicals
(kOH• = 3.9 109 M
-1s
-1) but not sulfate radicals (kSO4•- ≤ 10
6 M
-1s
-1) (Buxton et al., 1988;
Neta et al., 1977). Hexachloroethane (HCA) was selected as a probe for superoxide and
other reductants (kO2.- = 400 M-1
s-1
) because it has negligible reactivity with oxidants;
e.g., hydroxyl radicals are nonreactive with perchlorinated aliphatic compounds (kOH. ≤ 1
x 106 M
-1 s
-1) (Haag and Yao, 1992; Afanas’ev, 1989).
2.4 Screening of Base Dosages
Several persulfate formulations of varied sodium hydroxide to persulfate molar
ratios were added to the KB1 and KB2 soils to obtain a base dosage that would drift from
basic to circumneutral (Figure 1a-b). Using a sodium persulfate concentration of 0.5 M,
molar ratios of 0.375:1 to 2.5:1 hydroxide:persulfate were prepared; 20 mL of each were
added to 10 g of soil in 40 mL volatile organic analysis (VOA) vials. The pH was
monitored over time to obtain pH profiles for each molar ratio; each vial was mixed prior
to pH measurements. The vials were incubated in a water bath at 25˚C (±2˚C) between
measurements.

5
From the results in Figure 1a-b, molar ratios of 1.25:1 were used in the KB1 soil
slurries and 0.375:1 were used in the KB2 soil slurries to evaluate persulfate reactivity as
the pH drifted from basic to circumneutral. Approximate spike times for the probe
compounds were determined from these profiles at pH levels of 12, 10, and 8 (Figure 2).
Furthermore, molar ratios of 0.375:1 were used once the SOM was removed for soils
KB1-No SOM and KB2-No SOM because a smaller ratio would not bring the starting pH
above 12 in these soil slurries. Changes in pH in these soil slurries with approximate
spike times are shown in Figure 3.
2.5 Experimental Procedures
VOA vials were prepared with 10 g of the KB1, KB2, KB1-No SOM, or KB2-No
SOM soils. Each vial received 18 mL of the sodium hydroxide:sodium persulfate
solution; the vials were mixed, and then incubated in a water bath at 25˚C (±2˚C).
Once the pH in the reactors declined to 12, a series of vials received 2 mL of one
of the concentrated probe compounds (10 mM NB or 0.005 mM HCA) which yielded
final solution concentrations of 1 mM NB or 0.0005 mM HCA, respectively. Probe
degradation was then monitored by periodically extracting the entire vial contents with 5
mL of hexane and analyzing the extract by gas chromatography. All vials were mixed
before samples were extracted to ensure homogeneity and minimize volatilization.
The pH in the remaining reactors was monitored until it decreased to 10 and then
to 8; these vials then received 2 mL each of the concentrated probe stock solution. Due
to lack of drift, the pH in the KB2-No SOM reactors had to be artificially lowered to pH
10 and pH 8 through the addition of dilute sulfuric acid. Control systems were

6
established in parallel using deionized water in place of base-activated persulfate for each
soil slurry system.
2.6 Analysis
Probe compound concentrations were quantified using Hewlett-Packard 5890A
gas chromatographs with an electron capture detector (for HCA) and a flame ionization
detector (for NB), each fit with 10 m × 0.53 mm DB-1 capillary columns. Program
conditions for HCA analysis included injector temperature of 220°C, detector
temperature of 270°C, initial oven temperature of 100°C, program rate of 30°C min-1
, and
final temperature of 240°C. Program conditions for NB analysis included injector
temperature of 200°C, detector temperature of 250°C, initial oven temperature of 60°C,
program rate of 30°C min-1
, and final temperature of 180°C. Persulfate concentrations
were measured by iodometric titration using 0.01 N sodium thiosulfate (Kolthoff and
Stenger, 1947). The pH was quantified using a Fisher Accumet Basic AB15 pH meter.
3. Results and Discussion
Four different soil systems were investigated for hydroxyl radical and reductant
activity as basic persulfate formulations were allowed to drift toward circumneutral pH:
soils KB1 and KB2 with 1.01% and 0.24% organic carbon, respectively, and soils KB1-
No SOM and KB2-No SOM on which the SOM was removed. Persulfate concentration,
pH, and either hydroxyl radical or reductant generation were quantified concurrently as
the reactions proceeded.
3.1 Persulfate decomposition and pH changes in soil slurries
Persulfate decomposition was monitored as the pH drifted toward neutral during
the experiments that tracked hydroxyl radical and reductant generation. Persulfate
7
decomposition in the KB1 and KB2 soil slurries in which hydroxyl radical generation
was tracked is shown in Figure 4a-b. The persulfate concentration decreased from 0.5 M
to 0.27 M as the pH in the KB1 reactors reached pH 12, likely due to persulfate
consumption by SOM. Initial persulfate concentrations for the three starting pH regimes
of pH 12, pH 10, and pH 8, were 0.27 M, 0.25 M, and 0.22 M, respectively. Persulfate
decomposed an additional 33%, 28%, and 23% in these systems over the 30 d reactions.
The bulk of the persulfate loss occurred in the first few days with less consumption over
the remaining 30 d.
The persulfate concentration decreased from 0.5 M to 0.48 M as the pH in the
KB2 reactors reached pH 12. Initial persulfate concentrations were 0.48 M, 0.47 M, and
0.46 M for the starting pH regimes of pH 12, pH 10, and pH 8. Persulfate decomposed
an additional 17%, 15%, and 13% in the three pH regimes over 30 d.
Persulfate concentrations in the KB1-No SOM and KB2-No SOM soil slurries in
which hydroxyl radical generation was tracked are shown in Figure 5a-b. Rates of
persulfate decomposition in persulfate slurries containing KB1-No SOM and KB2-No
SOM were less than in the slurries containing SOM; persulfate consumption was <2% in
these slurries once the pH reached 12. Initial persulfate concentrations in the KB1-No
SOM were 0.50 M, 0.48 M, and 0.45 M for the three pH regimes. Persulfate decomposed
an additional 10%, 8%, and 7% over 30 d. The rates of persulfate consumption in the
three pH regimes were relatively constant over the 30 d reactions compared to the KB1
and KB2 soil slurries.
Initial persulfate concentrations in the KB2-No SOM slurries were 0.48 M, 0.47
M, and 0.47 M; the initial persulfate concentrations in these systems were nearly identical

8
at pH 10 and pH 8 because the pH in these reactors had to be artificially lowered through
the addition of dilute sulfuric acid. Only 4% persulfate decomposition was observed in
the KB2-No SOM soil slurries over each reaction period for all three pH systems; 6 d for
pH 12 system, and 14 d for the pH 10 and pH 8 systems.
Persulfate concentrations monitored in conjunction with reductant generation
experiments are illustrated in Figure 6a-b for soil slurries KB1 and KB2, and Figure 7a-b
for soil slurries KB1-No SOM and KB2-No SOM. The persulfate decomposition trends
are nearly the same as the persulfate decomposition in the hydroxyl radical generation
experiments (Figure 4a-b and Figure 5a-b).
3.2 pH drift in soil slurries
pH was monitored in the four different soil systems in conjunction with hydroxyl
radical and reductant activity as basic persulfate formulations drifted from alkaline
circumneutral pH. The rate of pH change followed a pattern similar to persulfate
decomposition and decreased most rapidly in the early stages of the reactions. pH drift in
soil slurries is due to the generation of sulfuric acid as the persulfate decomposed; based
on reaction stoichiometry, two moles of sulfuric acid are produced from one mole of
persulfate;
422
2
82 2 SOHOHOS (6)
Changes in pH over time for the KB1 and KB2 soil slurries during the hydroxyl
radical generation experiments is shown in Figure 8a-b. In parallel to rapid persulfate
consumption, the pH dropped most rapidly in the early stages of persulfate
decomposition in the KB1 soil systems because of the greater SOD; e.g., the pH in the
KB1 soil slurries declined from pH 12 to pH 10 over 24 hours after addition of

9
nitrobenzene probe. After 24 hours, the rate of pH change in the KB1 soil slurries
continued to change somewhat rapidly but with a lower rate of change until day 15. At
that time, the rate of pH change in the three soil systems slowed and was nearly identical
for the remaining 30 d.
The rate of pH change in the KB2 soil slurries was less than the rate in the KB1
soil slurries. The pH declined most rapidly in the first 6 d in all three pH systems; e.g.,
the pH in the KB2 soil slurries declined from pH 12 to pH 10 over 48 hours after addition
of nitrobenzene probe. After 6 d, the rate of pH change in the three soil systems slowed
significantly and was nearly identical for the next 18 d. After 24 d, the rate of pH change
increased slightly as the pH in all three systems decreased below pH 6.
Changes in pH over time for the KB1-No SOM and KB2-No SOM soil slurries in
which relative hydroxyl radical generation was quantified is shown in Figure 9a-b. The
rate of pH change in both of these systems was less than in the soil systems with SOM; in
addition, less persulfate decomposed which decreased the rate of pH drift. The rates of
pH drift in the KB1-No SOM soil systems were slightly greater than the KB2-No SOM
soil systems, which may be due to the degree to which the SOM was removed; slightly
more SOM remained in the KB1-No SOM soil (0.12%) than in the KB2-No SOM soil
(0.06%) after SOM removal. The pH then declined linearly for both KB1-No SOM and
KB2-No SOM soil slurries throughout the reactions. A small pH increase was observed
in the early stages of the pH 8 and pH 10 systems of the KB2-No SOM after the injection
of the probe compounds (The probe solutions were added at acidic pH to obtain the
desired pH in the system).
10
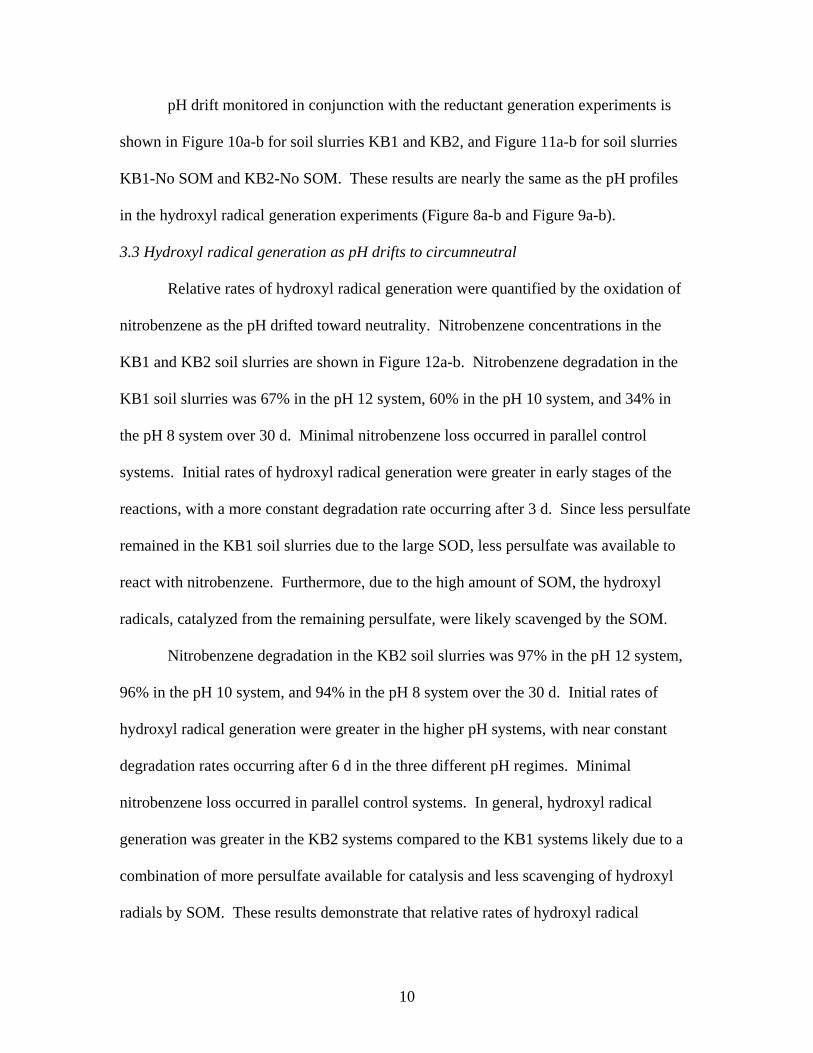
pH drift monitored in conjunction with the reductant generation experiments is
shown in Figure 10a-b for soil slurries KB1 and KB2, and Figure 11a-b for soil slurries
KB1-No SOM and KB2-No SOM. These results are nearly the same as the pH profiles
in the hydroxyl radical generation experiments (Figure 8a-b and Figure 9a-b).
3.3 Hydroxyl radical generation as pH drifts to circumneutral
Relative rates of hydroxyl radical generation were quantified by the oxidation of
nitrobenzene as the pH drifted toward neutrality. Nitrobenzene concentrations in the
KB1 and KB2 soil slurries are shown in Figure 12a-b. Nitrobenzene degradation in the
KB1 soil slurries was 67% in the pH 12 system, 60% in the pH 10 system, and 34% in
the pH 8 system over 30 d. Minimal nitrobenzene loss occurred in parallel control
systems. Initial rates of hydroxyl radical generation were greater in early stages of the
reactions, with a more constant degradation rate occurring after 3 d. Since less persulfate
remained in the KB1 soil slurries due to the large SOD, less persulfate was available to
react with nitrobenzene. Furthermore, due to the high amount of SOM, the hydroxyl
radicals, catalyzed from the remaining persulfate, were likely scavenged by the SOM.
Nitrobenzene degradation in the KB2 soil slurries was 97% in the pH 12 system,
96% in the pH 10 system, and 94% in the pH 8 system over the 30 d. Initial rates of
hydroxyl radical generation were greater in the higher pH systems, with near constant
degradation rates occurring after 6 d in the three different pH regimes. Minimal
nitrobenzene loss occurred in parallel control systems. In general, hydroxyl radical
generation was greater in the KB2 systems compared to the KB1 systems likely due to a
combination of more persulfate available for catalysis and less scavenging of hydroxyl
radials by SOM. These results demonstrate that relative rates of hydroxyl radical

11
generation decreased as the pH drifted from alkaline toward circumneutral conditions, but
hydroxyl radicals were still generated.
Relative rates of hydroxyl radical generation quantified through the oxidation of
nitrobenzene in the KB1-No SOM and KB2-No SOM slurries are shown in Figure 13a-b.
Nitrobenzene was oxidized to nondetectable concentrations in all KB1-No SOM pH
slurries after 30 d and after 14 d for the KB2-No SOM slurries with minimal
nitrobenzene loss in parallel soil control systems. The differing rates of hydroxyl radical
generation in these two systems may be partly from oxidant scavenging by lingering
SOM; slightly more SOM remained in the KB1-No SOM soil (0.12%) than the KB2-No
SOM soil (0.06%) after SOM removal. Another possible explanation may be varying
mechanisms that are activating persulfate in these two systems, which include catalysis
by the soil minerals or a radical chain reaction that is initiated at high pH.
3.4 Superoxide radical and reductant generation as the pH drifts to circumneutral
Relative rates of superoxide radical and reductant generation were quantified by
the reduction of hexachloroethane (HCA) as the pH drifted toward neutrality. HCA
concentrations in the KB1 and KB2 slurries are shown in Figure 14a-b. HCA in the KB1
soil slurries was degraded to near-nondectable concentrations after 2.5 d in the pH 12
system, 6 d in the pH 10 system, and 8 d in the pH 8 system. Reductant generation also
occurred in parallel control systems with 62% HCA degradation after 8 d. The apparent
reductant formation observed in the three soil slurries plus the control system indicate
that SOM promoted reductive dechlorination in all four systems; SOM provides reducing
conditions that likely degrade HCA by different pathways. Nevertheless, HCA degraded
more rapidly in base-activated persulfate systems than in control systems.

12
HCA was degraded to nondectable limits in the KB2 slurries after 5.5 d in the pH
12 system, and 8 d for both the pH 10 and pH 8 systems; 11% HCA degradation occurred
in parallel control systems after 8 d. In general, reductant generation was greater in
higher pH regimes for both the KB1 and KB2 soil systems. The pH 12 system of the
KB1 soil slurries showed faster HCA degradation than the pH 12 system of the KB2 soil
slurries with similar patterns for soil slurries in the pH 10 and pH 8 systems. Scavenging
did not appear to affect the reductants as much as the oxidants; i.e., there was no
significant difference in reductant formation between the KB1 and KB2 soils, with
approximately 33% of the persulfate consumed before addition of the HCA probe.
Relative rates of reductant generation for the KB1-No SOM and KB2-No SOM
slurries are shown in Figure 15a-b. HCA was degraded to nondectatable limits in the pH
12 system of the KB1-No SOM soil slurries after 6 d. HCA degradation of 90% occurred
in the pH 10 system, and 25% in the pH 8 system after 8 d. HCA degradation in the
KB2-No SOM soil slurries after 8 d was 83% in the pH 12 system, 27% in the pH 10
system, and 26% in the pH 8 system. Minimal HCA loss occurred in all parallel control
systems. The pH 10 KB1-No SOM system showed significantly greater reductant
generation than the parallel pH 10 KB2-No SOM system, which is likely due to slightly
more organic matter remaining in the KB1-No SOM soil than the KB2-No SOM after the
SOM removal procedure was completed. These results suggest that there is a minimum
SOM concentration at which SOM can promote the generation of reductants.
4. Conclusion
The potential for persulfate activation after base addition as the pH drifts from
alkaline to circumneutral was investigated in four soil systems with varying SOM
13
contents. Persulfate decomposition occurred most rapidly in the KB1 soil slurries due to
the greater SOM content. Persulfate decomposition was minimal in the other slurries
with the least occurring in the KB2-No SOM soil systems. pH drift was approximately
parallel to persulfate decomposition in all four soil systems with the most rapid decline
occurring in the presence of higher SOM.
In all soil slurries, hydroxyl radical and reductant formation occurred which was
demonstrated by nitrobenzene and hexachloroethane degradation. In general, hydroxyl
radical activity was greatest at higher pH systems, but still occurred in starting pH
regimes of pH 10 and pH 8. Furthermore, greater rates of hydroxyl radical generation
were found with decreasing SOM contents, which is likely due to a lower degree of
hydroxyl scavenging by SOM.
Superoxide radical and reductant generation also occurred in all pH systems with
lower generation rates as the pH drifted to circumneutral. In all pH systems, reductant
generation was greatest in soil systems with greater SOM content. Considerably less
reductant formation occurred for the systems at pH 10 and pH 8 once the SOM was
removed, but reductants still formed.
The results of this research demonstrate that in the presence of subsurface solids,
base-activated persulfate can generate reactive oxygen species in pH systems <10; these
results differ from recent findings in which persulfate reactivity was negligible at pH <10.
SOM plays a significant role in this process by lowering net oxidant generation rates but
promotes higher reductant activity. From a practical treatment perspective, application of
base-activated persulfate in situ may potentially extend treatment longer than previously
thought making it a more efficient ISCO technology.

14
References
Afanas'ev, I.B., 1989. Superoxide Ion: Chemistry and Biological Implications, vol. 1.
CRC Press, Boca Raton, FL.
Block, P.A., Brown, R.A., Robinson, D, 2004. Novel Activation Technologies for
Sodium Persulfate In Situ Chemical Oxidation. Proceedings of the Fourth
International Conference on the Remediation of Chlorinated and Recalcitrant
Compounds.
Brown, R.A., Robinson, D, and Skladany, G., 2003. Response to Naturally Occurring
Organic Material: Permanganate versus Persulfate. ConSoil, Ghent, Belgium.
Buxton, G.V., Greenstock, C.L., Helman,W.P., Ross, A.B., 1988. Critical review of rate
constants for reactions of hydrated electrons, hydrogen atoms and hydroxyl radicals
(•OH/•O–) in aqueous solution. J. Phys. Chem. Ref. Data. 17, 513–780.
Furman, O. S., Teel, A. L., and Watts, R.J. 2009. Mechanism and Contaminant
Destruction Pathways in Base-Activated Persulfate Systems. Environ. Sci. Technol.
In preparation.
Gee, B.W., Bauder, J.W., 1986. Particle size analysis in: A. Klute (Ed), Methods of soil
analysis; part 1. physical and mineralogical methods, American Society of
Agronomy, Madison, WI, p. 399.
Haag,W.R., Yao, C.C.D, 1992. Rate constants for reaction of hydroxyl radicals with
several drinking water contaminants. Environ. Sci. and Technol. 26, 1005-1013.
Huling, S.G., Pivetz, B.E., 2006. In-Situ Chemical Oxidation. United States
Environmental Protection Agency.
ITRC (Interstate Technology & Regulatory Council). 2008. In Situ Bioremediation of
Chlorinated Ethene: DNAPL Source Zones. BioDNAPL-3. Washington, D.C.:
Interstate Technology & Regulatory Council, Bioremediation of DNAPLs Team.
Interstate Technology Regulatory Council., (ITRC) 2005. Overview of Groundwater
Remediation Technologies for MTBE and TBA.
Jackson, M.L., Lim, C.H., Zelazny, L.W., 1986. In: A. Klute et al. (Eds.), Methods of
Soil Analysis, Part 1: Physical and Mineralogical Methods. American Society of
Agronomy and Soil Science Society of America, Madison, WI, p. 124
Kolthoff, I.M., Stenger, V.A., 1947. Volumetric Analysis, second Revised
ed Titration Methods: Acid-base, Precipitation, and Complex Reactions,
vol. II Interscience Publishers, Inc., New York.
15
Lighty, J.S., Silcox, G.D, Pershing, DW., 1990. Fundamentals for the Thermal
Remediation of Contaminated Soils. Particle and Bed Desorption Models.
Environ. Sci. and Technol. 24, 750-757.
Neta, P., Madhavan, V., Zemel, H., Fesseden, R.W., 1977. Rate Constants and
Mechanism of Reaction of SO4.- with Aromatic Compounds. J. Amer. Chem. Soc.
99, 163-164.
Robinson, W.O., 1927. The determination of organic matter in soils by means of
hydrogen peroxide. J. Agric. Res. 34, 339-356.
Siegrist R L, Urynowicz M A, West O R, Crimi M L and Lowe K S 2001 Principles and
Practices of In Situ Chemical Oxidation Using Permanganate (Columbus, OH:
Battelle)
U.S. Soil Conservation Service., 1972. Soil Survey Investigation: Report 1. U.S.
Government Printing Office, Washington, DC. Cation exchange capacity
Walkley A. and Black I. A., 1934. An examination of the Degtjareff method for
determining soil organic matter and a proposed modification of the chromic acid
titration method Soil Sci. 37, 29–38.
Watts , R.J., Teel, A. L., 2006. Treatment of Contaminated Soils and Groundwater using
ISCO. Prac. Period Hazard Toxic, and Radioact. Waste Manage. 10(1), 2-9.
Watts , R.J., 1998. Hazardous Wastes: Sources, Pathways, Receptors. Wiley and Sons
Inc. pp 553-554,
16
Tables
Table 1. Physical properties of soils KB1 and KB2.
Textural Classification*
% Sand % Clay % Silt Texture
KB1 31.5 10 58.5 Silt Loam 34
KB2 39.5 11.1 49.8 Loam 19
Soil
Cation Exchange
Capacity
(Cmol(+)/kg)**
* Method analyzed: Hydrometer
**Method analyzed: EPA 9081
Table 2. Chemical properties of soils KB1 and KB2.
Soil
Amorphous
Mn (μg/g)
Total Mn
(μg/g)
Amorphous
Fe (μg/g)
Crystalline
Fe (μg/g)
% Organic
Carbon% Organic Carbon
After H2O2 Treatment
KB1 194 380 4656 2789 1.01 0.12
KB2 296 510 2196 1697 0.24 0.06

17
Figures
7
8
9
10
11
12
13
14
0 1 2 3 4 5 6 7
2.5:12.25:12:11.75:11.5:11.25:1
pH
Time (Days)
7
8
9
10
11
12
13
14
0 1 2 3 4 5 6 7
1:1
0.75:1
0.5:1
0.375:1
pH
Time (Days)
Figure 1. pH profiles of various molar ratios of sodium hydroxide:sodium persulfate for
soils KB1 (a) and KB2 (b).
a
b

18
0
2
4
6
8
10
12
14
0 1 2 3 4 5 6
KB1
KB2
pH
Time (Days)
Figure 2. pH profiles of chosen molar ratios of sodium hydroxide:sodium persulfate for
soil slurries KB1 and KB2 indicating approximate spike times of probe compounds.
0
2
4
6
8
10
12
14
0 3 6 9 12 15 18 21 24 27 30
KB1-No SOM
KB2-No SOM
pH
Time (Days)
* Approximate spike times of probe compounds indicated by arrows.
**Star indicates that pH in KB2-No SOM soil system would not drift sufficiently fast.
Figure 3. pH profiles of the selected molar ratio of 0.375:1 sodium hydroxide:sodium
persulfate for soil slurries KB1-No SOM and KB2-No SOM.

19
0
0.1
0.2
0.3
0.4
0.5
0 3 6 9 12 15 18 21 24 27 30
pH 12
pH 10
pH 8
Pe
rsu
lfa
te C
on
cen
tra
tio
n (
M)
Time (Days)
0
0.1
0.2
0.3
0.4
0.5
0 3 6 9 12 15 18 21 24 27 30
pH 12
pH 10
pH 8
Pe
rsu
lfa
te C
on
cen
tra
tio
n (
M)
Time (Days)
Figure 4. Persulfate concentrations in soil slurries KB1(a) and KB2(b) in conjunction
with hydroxyl radical generation experiments.
a
b
20
0
0.1
0.2
0.3
0.4
0.5
0 3 6 9 12 15 18 21 24 27 30
pH 12
pH 10
pH 8
Pe
rsu
lfa
te C
on
cen
tra
tio
n (
M)
Time (Days)
0
0.1
0.2
0.3
0.4
0.5
0 3 6 9 12 15 18 21 24 27 30
pH 12
pH 10
pH 8
Pe
rsu
lfa
te C
on
cen
tra
tio
n (
M)
Time (Days)
Figure 5. Persulfate concentrations in soil slurries KB1-No SOM(a) and KB2-No
SOM(b) in conjunction with hydroxyl radical generation experiments.
a
b
21
0
0.1
0.2
0.3
0.4
0.5
0 1 2 3 4 5 6 7 8
pH 12
pH 10
pH 8
Pe
rsu
lfa
te C
on
ce
ntr
ati
on
(M
/L)
Time (Days)
0
0.1
0.2
0.3
0.4
0.5
0 1 2 3 4 5 6 7 8
pH 12
pH 10
pH 8
Pers
ulf
ate
Co
nce
ntr
ati
on
(M
/L)
Time (Days)
Figure 6. Persulfate concentrations in soil slurries KB1(a) and KB2(b) in conjunction
with reductant generation experiments.
a
b

22
0
0.1
0.2
0.3
0.4
0.5
0 1 2 3 4 5 6 7 8
pH 12
pH 10
pH 8
Pe
rsu
lfate
Co
nce
ntr
ati
on
(M
/L)
Time (Days)
0
0.1
0.2
0.3
0.4
0.5
0 1 2 3 4 5 6 7 8
pH 12
pH 10
pH 8
Pers
ulf
ate
Co
nce
ntr
ati
on
(M
/L)
Time (Days)
Figure 7. Persulfate concentrations in soil slurries KB1-No SOM(a) and KB2-No
SOM(b) ) in conjunction with reductant generation experiments.
a
b
23
0
2
4
6
8
10
12
14
0 3 6 9 12 15 18 21 24 27 30
pH 12
pH 10
pH 8
pH
Time (Days)
0
2
4
6
8
10
12
14
0 3 6 9 12 15 18 21 24 27 30
pH 12
pH 10
pH 8
pH
Time (Days)
Figure 8. pH profiles for soil slurries KB1(a) and KB2(b) in conjunction with hydroxyl
radical generation experiments.
a
b

24
0
2
4
6
8
10
12
14
0 3 6 9 12 15 18 21 24 27 30
pH 12
pH 10
pH 8
pH
Time (Days)
0
2
4
6
8
10
12
14
0 3 6 9 12 15 18 21 24 27 30
pH 12
pH 10
pH 8
pH
Time (Days)
Figure 9. pH profiles for soil slurries KB1-No SOM(a) and KB2-No SOM(b) in
conjunction with hydroxyl radical generation experiments.
a
b

25
0
2
4
6
8
10
12
14
0 1 2 3 4 5 6 7 8
pH 12
pH 10
pH 8
pH
Time (Days)
0
2
4
6
8
10
12
14
0 1 2 3 4 5 6 7 8
pH 12
pH 10
pH 8
pH
Time (Days)
Figure 10. pH profiles for soil slurries KB1(a) and KB2(b) in conjunction with reductant
generation experiments.
a
b
26
0
2
4
6
8
10
12
14
0 1 2 3 4 5 6 7 8
pH 12
pH 10
pH 8
pH
Time (Days)
0
2
4
6
8
10
12
14
0 1 2 3 4 5 6 7 8
pH 12
pH 10
pH 8
pH
Time (Days)
Figure 11. pH profiles for soil slurries KB1-No SOM(a) and KB2-No SOM(b) in
conjunction with reductant generation experiments.
a
b

27
0
0.1
0.2
0.3
0.4
0.5
0.6
0.7
0.8
0.9
1
0 3 6 9 12 15 18 21 24 27 30
Control
pH 12
pH 10
pH 8
Nit
rob
en
zen
e C
on
ce
ntr
ati
on
(C
/Co
)
Time (Days)
0
0.1
0.2
0.3
0.4
0.5
0.6
0.7
0.8
0.9
1
0 3 6 9 12 15 18 21 24 27 30
Control
pH 12
pH 10
pH 8
Nit
rob
en
zen
e C
on
ce
ntr
ati
on
(C
/Co
)
Time (Days)
Figure 12. Hydroxyl radical generation quantified through nitrobenzene degradation in
soil slurries KB1(a) and KB2(b).
a
b

28
0
0.1
0.2
0.3
0.4
0.5
0.6
0.7
0.8
0.9
1
0 3 6 9 12 15 18 21 24 27 30
Control
pH 12
pH 10
pH 8
Nit
rob
en
zen
e C
on
cen
trati
on
(C
/Co
)
Time (Days)
0
0.1
0.2
0.3
0.4
0.5
0.6
0.7
0.8
0.9
1
0 3 6 9 12 15 18 21 24 27 30
Control
pH 12
pH 10
pH 8
Nit
rob
en
zen
e C
on
ce
ntr
ati
on
(C
/Co
)
Time (Days)
Figure 13. Hydroxyl radical generation quantified through nitrobenzene degradation in
soil slurries KB1-No SOM(a) and KB2-No SOM(b).
a
b

29
0
0.1
0.2
0.3
0.4
0.5
0.6
0.7
0.8
0.9
1
0 1 2 3 4 5 6 7 8
ControlpH 12pH 10pH 8
Hexach
loro
eth
an
e C
on
cen
trati
on
(C
/Co
)
Time (Days)
0
0.1
0.2
0.3
0.4
0.5
0.6
0.7
0.8
0.9
1
0 1 2 3 4 5 6 7 8
Control
pH 12
pH 10
pH 8
Hexach
loro
eth
an
e C
on
cen
trati
on
(C
/Co
)
Time (Days)
Figure 14. Reductant generation quantified through hexachloroethane degradation in soil
slurries KB1(a) and KB2 (b).
a
b

30
0
0.1
0.2
0.3
0.4
0.5
0.6
0.7
0.8
0.9
1
0 1 2 3 4 5 6 7 8
Control
pH 12
pH 10
pH 8
Hexach
loro
eth
an
e C
on
cen
trati
on
(C
/Co
)
Time (Days)
0
0.1
0.2
0.3
0.4
0.5
0.6
0.7
0.8
0.9
1
0 1 2 3 4 5 6 7 8
Control
pH 12
pH 10
pH 8
Hexach
loro
eth
an
e C
on
cen
trati
on
(C
/Co
)
Time (Days)
Figure 15. Reductant generation quantified through hexachloroethane degradation in soil
slurries KB1-No SOM(a) and KB2-No SOM(b).
a
b