barriers to entry, deregulation and workplace training · barriers to entry, deregulation and...
TRANSCRIPT

Barriers to Entry, Deregulation Barriers to Entry, Deregulation and Workplace Trainingand Workplace Training
Andrea Bassanini (OECD, ERMES and IZA)Andrea Bassanini (OECD, ERMES and IZA)Giorgio Brunello (Padova, Cesifo and IZA)Giorgio Brunello (Padova, Cesifo and IZA)

MotivationMotivation•• Large literature on product market institutions Large literature on product market institutions ––
regulation, barriers to entry regulation, barriers to entry –– and growth.and growth.
•• Large empirical literature on competition and Large empirical literature on competition and performance (productivity, innovation, etcperformance (productivity, innovation, etc……))
•• Empirical work on regulation and deregulation: Empirical work on regulation and deregulation: deregulation can foster growth by affecting:deregulation can foster growth by affecting:–– employment (Kugler and Pica)employment (Kugler and Pica)–– productivity growth (Nicoletti and Scarpetta)productivity growth (Nicoletti and Scarpetta)–– investment in capital stock (Alesina et al)investment in capital stock (Alesina et al)–– innovation (Aghion et al, 2005)innovation (Aghion et al, 2005)–– firm entry (Aghion et al, 2008)firm entry (Aghion et al, 2008)

Does it affect training?Does it affect training?
•• Human capital accumulation important Human capital accumulation important engine of productivity growthengine of productivity growth
•• One channel in the relationship between One channel in the relationship between deregulation and productivity growth?deregulation and productivity growth?
Previous literature: TheoryPrevious literature: Theory
•• Common idea in labour economics: Common idea in labour economics: competitioncompetition ↑↑ ⇒⇒ trainingtraining ↓↓ because because rentsrents ↓↓and firms pay for most of workplace training and firms pay for most of workplace training (e.g. (e.g. Acemoglu and Pischke, 1999)Acemoglu and Pischke, 1999)
–– Only exception Autor (2001), but limited to Only exception Autor (2001), but limited to induction training (training as a selection device: induction training (training as a selection device: THS firms)THS firms)

-.2-.1
0.1
.2tra
inin
g
-3 -2 -1 0 1 2regulation
Training and deregulation (deviations from sectoral means) in energy, transport and communication. 15 EU countries. 1995-2002

Our contribution: Theory Our contribution: Theory
•• We develop a model of price competition with We develop a model of price competition with identical firms and find that lower barriers to identical firms and find that lower barriers to entry increase training entry increase training
•• Intuition: two effectsIntuition: two effects–– Competition reduces rents per unit of output and Competition reduces rents per unit of output and
thus training (thus training (rent effectrent effect))–– Competition increases the sensitivity of output to Competition increases the sensitivity of output to
relative prices (and training reduces relative prices) relative prices (and training reduces relative prices) ((businessbusiness--stealing effectstealing effect))

•• Autor shows that training and firm concentration Autor shows that training and firm concentration (Herfindhal index) are negatively correlated in (Herfindhal index) are negatively correlated in the US THS industrythe US THS industry
•• Goerlitz and Stiebale (2008) find no effect of Goerlitz and Stiebale (2008) find no effect of markmark--ups or firm concentration on training using ups or firm concentration on training using German data.German data.
•• Our previous exploratory work (BBBDL) on a Our previous exploratory work (BBBDL) on a multimulti--country aggregate panel finds negative country aggregate panel finds negative correlation between the OECD index of correlation between the OECD index of regulation and trainingregulation and training
Previous Literature: EmpiricsPrevious Literature: Empirics

Our contribution: EmpiricsOur contribution: Empirics
•• We match large industryWe match large industry--level datasets on level datasets on regulation and training regulation and training –– allowing us to allowing us to control for all aggregate effects control for all aggregate effects –– and we and we find that deregulation increases trainingfind that deregulation increases training
•• We also look at the relationship between We also look at the relationship between markups and training, and instrument the markups and training, and instrument the former with regulationformer with regulation

Key features of our model Imperfectly competitive product and labour markets (as in Blanchard and Giavazzi QJE 2003):
price-competition, bargaining on wages and employmentEndogenous number of firms but firm entry is limited by barriers to entry
Training is either firm – specific and paid by firms, or general and paid by firms or workers depending on hiring costs
Two stages: 1st training; 2nd bargaing + production
Specific trainingSpecific training
•• Two alternative settings:Two alternative settings:•• CommitmentCommitment: The employer commits to : The employer commits to
employ all trainees (e.g. long notice periods)employ all trainees (e.g. long notice periods)..–– LL = = TT
•• No CommitmentNo Commitment: The employer cannot : The employer cannot commit to employ all trainees.commit to employ all trainees.–– LL < < T T
•• L>T not feasible: training ONLY in the first L>T not feasible: training ONLY in the first periodperiod
Key Result
Two contrasting effects:
With a given number of firms: competition ↑ ⇒ rents per unit of output ↓ ⇒ training ↓ (Acemoglu and Pischke 1999)
When the number of firms is allowed to vary: elasticity or business stealing effect (Vives 2006 Raith 2001):
competition ↑ ⇒ elasticity of product demand ↑ ⇒ output gains from lowering prices (from training) ↑ ⇒ investment in training ↑
The latter always dominate
General trainingGeneral training
•• If hiring costs > training costs: as aboveIf hiring costs > training costs: as above•• Otherwise: no firm trains, training paid by Otherwise: no firm trains, training paid by
workers, wages set by the market (as in workers, wages set by the market (as in Becker)Becker)
•• Workers invest till MB=MCWorkers invest till MB=MC•• Firms demand training to max profitsFirms demand training to max profits•• The business stealing effect increases the The business stealing effect increases the
demand and wages of skilled labour and demand and wages of skilled labour and induces additional supplyinduces additional supply
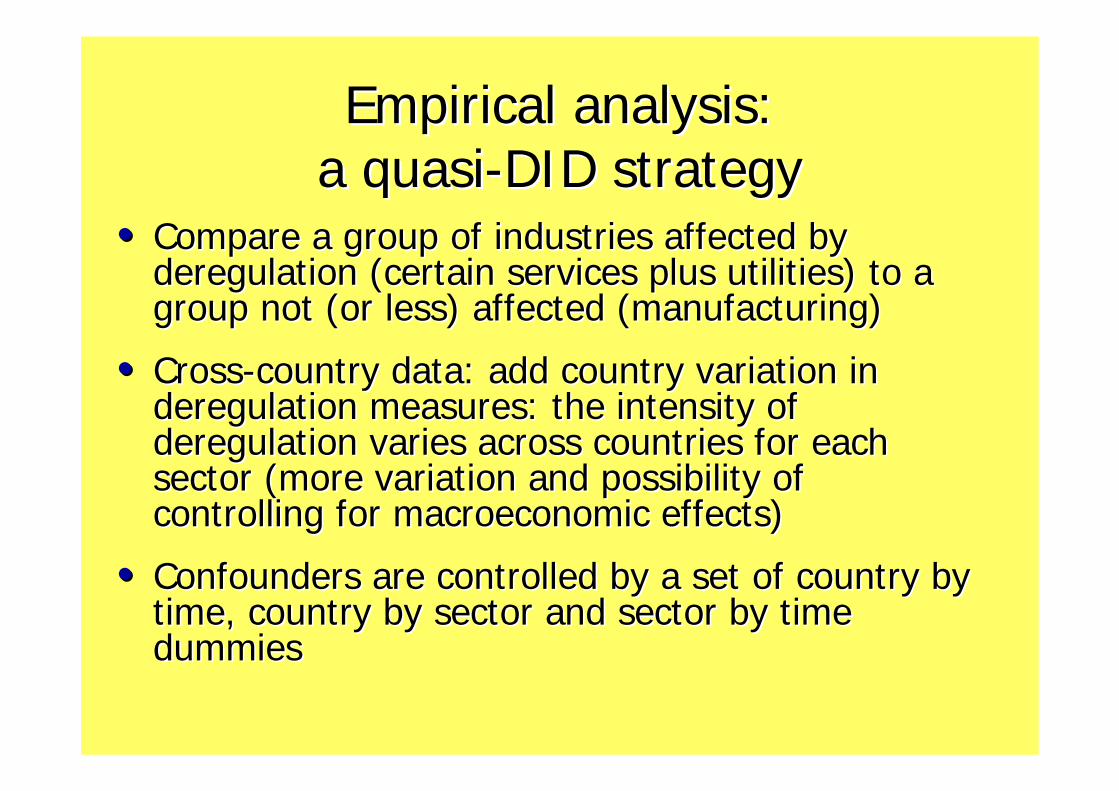
Empirical analysis:Empirical analysis:a quasia quasi--DID strategy DID strategy
•• Compare a group of industries affected by Compare a group of industries affected by deregulation (certain services plus utilities) to a deregulation (certain services plus utilities) to a group not (or less) affected (manufacturing)group not (or less) affected (manufacturing)
•• CrossCross--country data: add country variation in country data: add country variation in deregulation measures: the intensity of deregulation measures: the intensity of deregulation varies across countries for each deregulation varies across countries for each sector (more variation and possibility of sector (more variation and possibility of controlling for macroeconomic effects)controlling for macroeconomic effects)
•• Confounders are controlled by a set of country by Confounders are controlled by a set of country by time, country by sector and sector by time time, country by sector and sector by time dummiesdummies
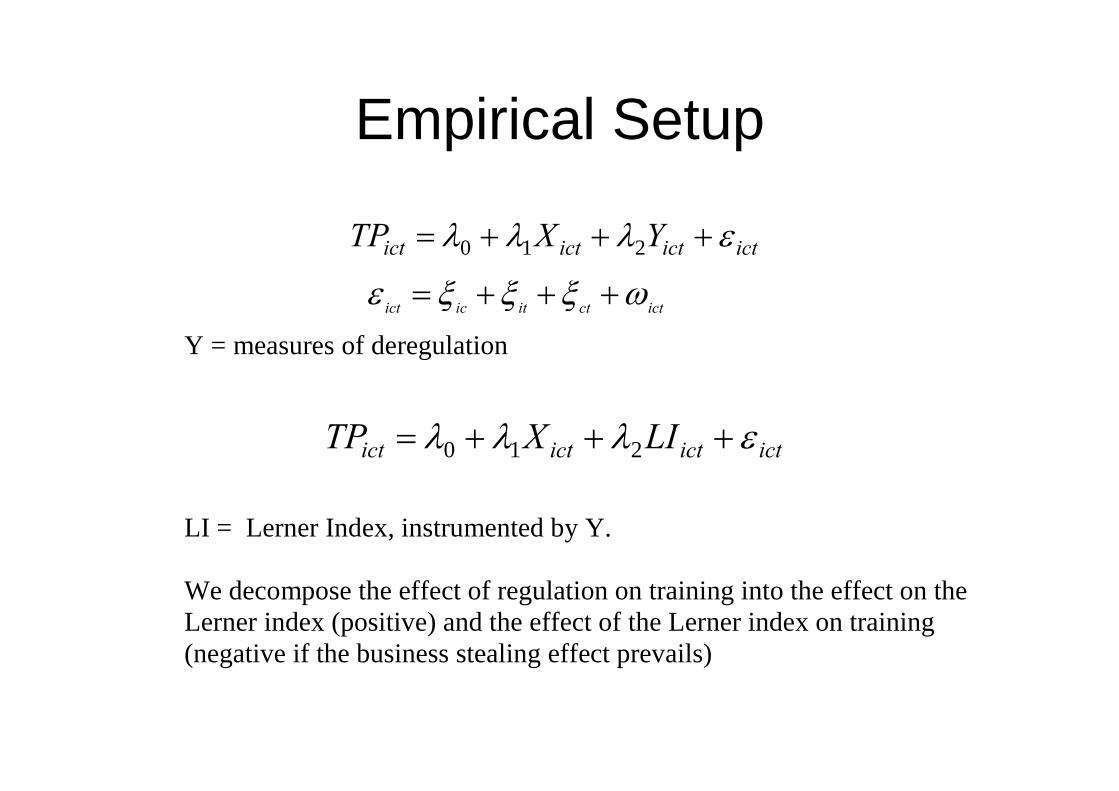
Empirical Setup
ictictictict YXTP ελλλ +++= 210
ictctiticict ωξξξε +++=
Y = measures of deregulation
ictictictict LIXTP ελλλ +++= 210
LI = Lerner Index, instrumented by Y. We decompose the effect of regulation on training into the effect on the Lerner index (positive) and the effect of the Lerner index on training (negative if the business stealing effect prevails)

DataData
•• OECD industryOECD industry--specific regulatory specific regulatory indicatorsindicators
•• Eurostat Labour Force SurveyEurostat Labour Force Survey
•• OECD STAN database on output, imports OECD STAN database on output, imports and labourand labour
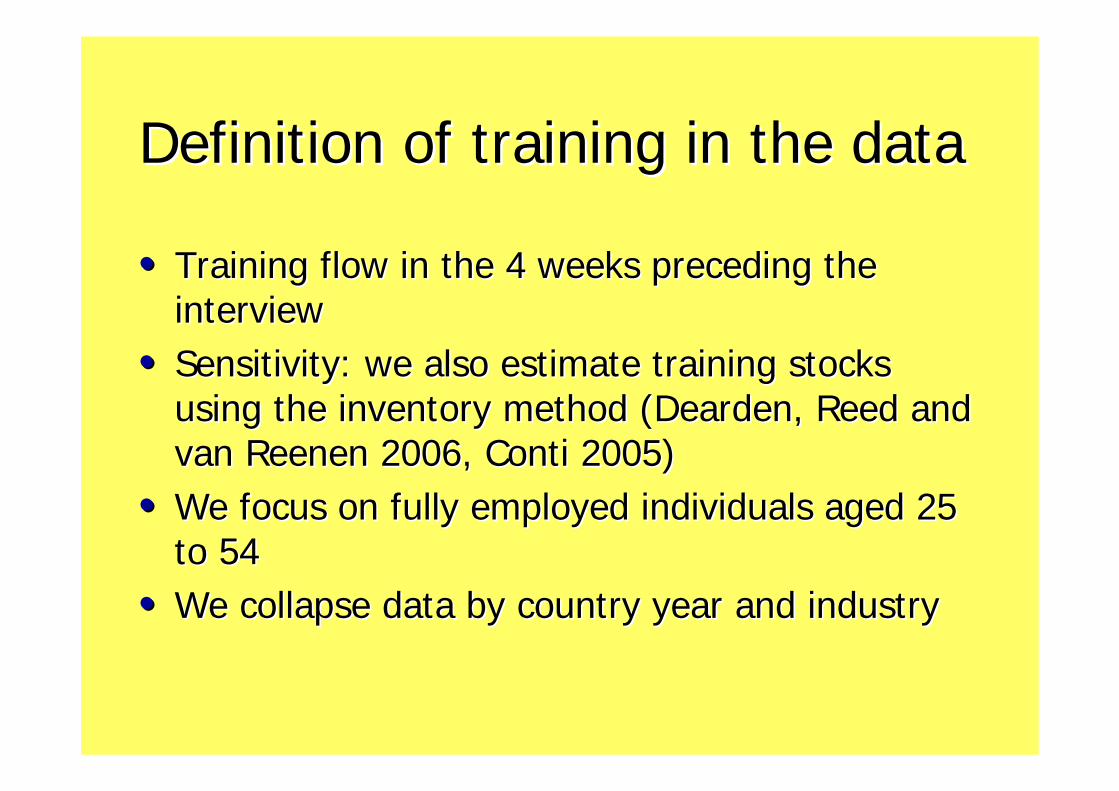
Definition of training in the dataDefinition of training in the data
•• Training flow in the 4 weeks preceding the Training flow in the 4 weeks preceding the interview interview
•• Sensitivity: we also estimate training stocks Sensitivity: we also estimate training stocks using the inventory method (Dearden, Reed and using the inventory method (Dearden, Reed and van Reenen 2006, Conti 2005)van Reenen 2006, Conti 2005)
•• We focus on fully employed individuals aged 25 We focus on fully employed individuals aged 25 to 54to 54
•• We collapse data by country year and industryWe collapse data by country year and industry
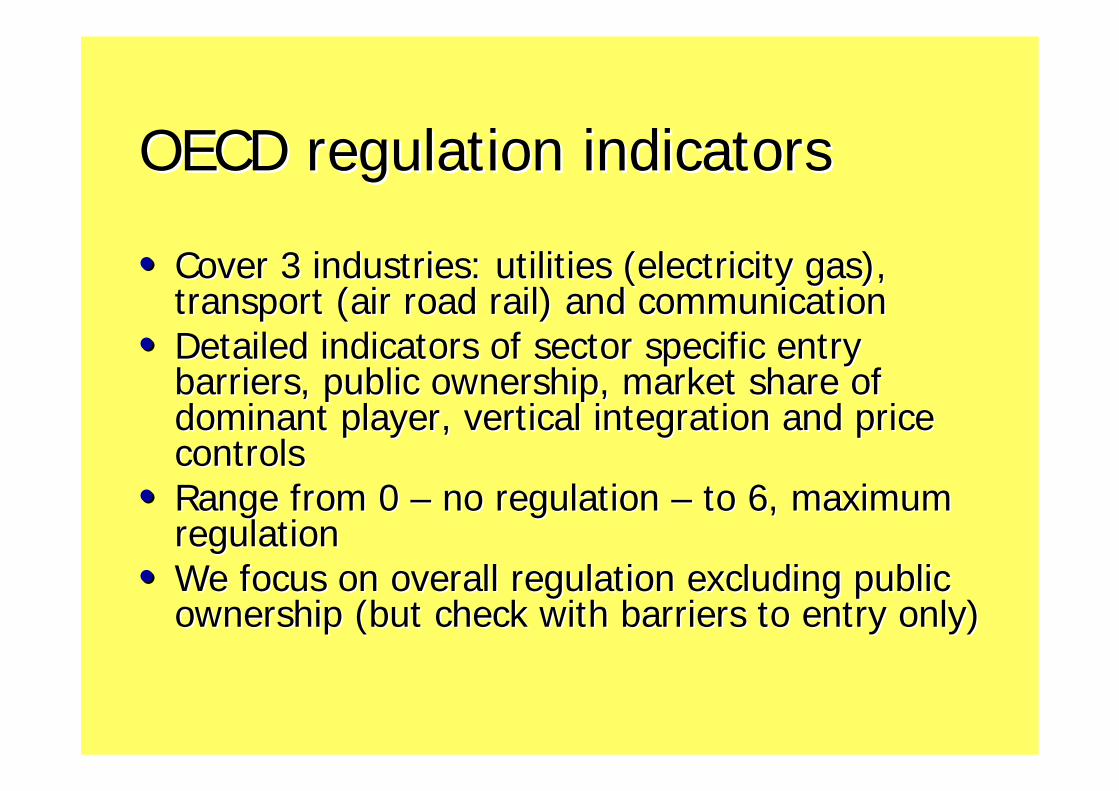
OECD regulation indicatorsOECD regulation indicators
•• Cover 3 industries: utilities (electricity gas), Cover 3 industries: utilities (electricity gas), transport (air road rail) and communicationtransport (air road rail) and communication
•• Detailed indicators of sector specific entry Detailed indicators of sector specific entry barriers, public ownership, market share of barriers, public ownership, market share of dominant player, vertical integration and price dominant player, vertical integration and price controlscontrols
•• Range from 0 Range from 0 –– no regulation no regulation –– to 6, maximum to 6, maximum regulationregulation
•• We focus on overall regulation excluding public We focus on overall regulation excluding public ownership (but check with barriers to entry only)ownership (but check with barriers to entry only)
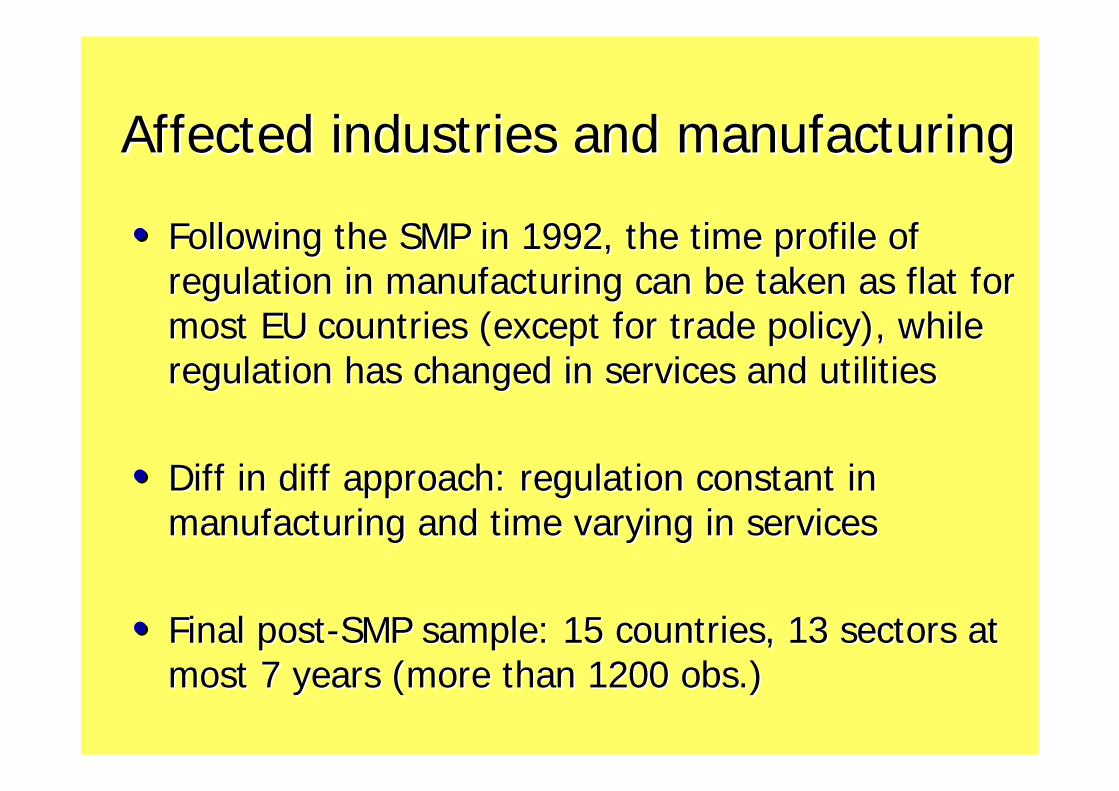
Affected industries and manufacturingAffected industries and manufacturing
•• Following the SMP in 1992, the time profile of Following the SMP in 1992, the time profile of regulation in manufacturing can be taken as flat for regulation in manufacturing can be taken as flat for most EU countries (except for trade policy), while most EU countries (except for trade policy), while regulation has changed in services and utilitiesregulation has changed in services and utilities
•• Diff in diff approach: regulation constant in Diff in diff approach: regulation constant in manufacturing and time varying in servicesmanufacturing and time varying in services
•• Final postFinal post--SMP sample: 15 countries, 13 sectors at SMP sample: 15 countries, 13 sectors at most 7 years (more than 1200 obs.)most 7 years (more than 1200 obs.)

Table 1. Estimates of training as function of the index of product market regulation REGNO, which excludes public ownership. Panel A: Linear specification estimated by OLS (1) (2) (3) (4) (5)
-0.014 -0.015 -0.014 -0.017 -0.015 Regulation, excluding public own. (REGNO) [3.24]*** [3.29]*** [3.00]*** [3.47]*** [3.29]*** -0.141 -0.129 -0.147 -0.141 Percentage with low education [3.11]*** [2.73]*** [3.06]*** [3.10]*** -0.065 -0.069 -0.073 -0.064 Percentage with intermediate education [1.51] [1.37] [1.64] [1.48] 0.070 0.068 0.076 0.075 Percentage females [1.82]* [1.71]* [1.82]* [1.90]*
Import-weighted real exchange rate -0.025 [1.02]
-0.021 [0.82]
-0.025 [1.03]
-0.025 [1.03]
Log worked hours gap -0.207 [1.94]*
-0.268 [2.42]**
-0.213 [1.81]*
-0.208 [1.94]*
Percentage large firms 0.005 [0.29]
Age -0.000 [0.12]
Employment growth 0.012 [0.41]
Logarithm of R&D intensity -0.004 [1.33]
Union density 0.000
[0.55]
EPL times US job turnover -0.007
[0.11] Estimated elasticity of training wrt regulation -0.472 -0.494 -0.490 -0.500 -0.492 Country by sector dummies yes yes yes yes Yes Country by year dummies yes yes yes yes Yes Sector by year dummies yes yes yes yes Yes Number of observations 1236 1224 1188 1061 1224

Table 4. Estimates of training as function of the Lerner index, instrumented with REGNO. Dependent variable: training participation rates. Panel A: Linear model, 2SLS (1) (2) (3) (4) (5)
-1.323 -1.419 -1.391 -1.187 -1.456 Lerner Index [1.90]* [2.00]** [1.82] * [2.27]** [1.92]*
-0.167 -0.169 -0.176 -0.171 Percentage with low education [2.49]** [2.48]*** [2.71]** [2.49]** -0.074 -0.071 -0.086 -0.083 Percentage with intermediate education [1.22] [1.18] [1.47] [1.37] 0.142 0.141 0.109 0.144 Percentage females [2.31]** [2.25]** [2.10]** [2.27]**
Import-weighted real exchange rate -0.001 [0.03]
-0.000 [0.01]
-0.014 [0.46]
0.001 [0.05]
Log worked hours gap -0.042 [0.23]
-0.110 [0.59]
-0.042 [0.26]
-0.031 [0.17]
Percentage large firms 0.040 [1.24]
Age 0.000 [0.18]
Employment growth 0.054 [0.84]
Logarithm of R&D intensity -0.017 [2.11]*
Union density -0.002
[0.96]
EPL times US job turnover 0.149
[1.05] Durbin-Wu-Hausman exogeneity test (χ2(1)) 23.75*** 24.70*** 27.86*** 25.89*** 27.64***
Coeff. of REGNO in the first-stage regression 0.013 [2.67]***
0.013 [2.71]***
0.013 [2.56]**
0.016 [3.20]***
0.013 [2.58]***
Elasticity of training to the Lerner Index -1.613 -1.749 -1.744 -1.381 -1.789 Derivative of training wrt REGNO -0.017 -0.018 -0.019 -0.019 -0.019 Elasticity of training wrt REGNO -0.445 -0.486 -0.488 -0.497 -0.488 Country by sector dummies yes yes yes yes yes Country by year dummies yes yes yes yes yes Sector by year dummies yes yes yes yes yes Number of observations 1120 1108 1084 985 1108

Empirical Setup: GLM
ictictictict YXGTP ελλλ +++= )( 210
ictctiticict ωξξξε +++=
Y = measures of deregulation
G = inverse logit function (exp(Xβ)/(1+exp(Xβ)
ictictictict LIXGTP ελλλ +++= )( 210
LI = Lerner Index, instrumented by Y. More suitable in the case of fractional data obtained by averaging microdata from sample of unknown size. Robust QMLE estimator can be devised independently of distributional assumptions on the error term (Papke and Wooldridge, 1996).

Panel B: GLM specification estimated by QMLE (1) (2) (3) (4) (5)
Regulation, excluding public own. (REGNO) -0.141 -0.161 -0.175 -0.151 -0.167 [3.84]*** [4.40]*** [4.22]*** [4.25]*** [4.51]***
Percentage with low education -2.005 -1.938 -2.045 -1.988 [4.38]*** [4.03]*** [4.38]*** [4.36]***
Percentage with intermediate education -0.679 -0.646 -0.737 -0.638 [1.93]* [1.76]* [2.12]* [1.80]*
Percentage females 0.737 0.672 0.643 0.713 [1.91]* [1.71]* [1.69]* [1.84]*
Import-weighted real exchange rate -0.275 [1.78]*
-0.263 [1.67]*
-0.382 [2.44]**
-0.276 [1.80]*
Log worked hours gap -2.269
[2.13]*** -3.186
[2.79]*** -1.939 [1.85]*
-2.229 [2.09]**
Percentage large firms 0.203 [0.66]
Age 0.012 [0.64]
Employment growth 0.364 [0.95]
Logarithm of R&D intensity -0.069 [1.83]*
Union density 0.001
[0.18]
EPL times US job turnover -1.828
[1.57] Estimated elasticity of training wrt regulation -0.279 -0.316 -0.345 -0.319 -0.329 Country by sector dummies yes yes yes yes Yes Country by year dummies yes yes yes yes Yes Sector by year dummies yes yes yes yes Yes Number of observations 1236 1224 1188 1061 1224

Panel B: GLM, Two-step IV estimates (1) (2) (3) (4) (5)
Lagged Lerner Index -11.08** -12.44** -13.62* -9.36** -13.59** [-69.09,-0.05] [-71.03,-0.87] [-130.0,0.04] [-44.74,-0.96] [-87.96,-1.41]
Residual first stage 11.41* [-0.48,66.48]
12.49** [0.59,69.65]
13.64* [-0.56,130.0]
9.14** [0.56,38.04]
13.68** [1.45,89.30]
Percentage with low education -2.20* -2.31* -2.26** -2.23* [-4.13,0.02] [-4.93,0.32] [-4.04,-0.13] [-4.43,0.45]
Percentage with intermediate education -0.76 -0.75 -0.85 -0.82 [-2.50,1.56] [-2.60,3.45] [-2.27,0.84] [-3.00,1.57]
Percentage females 1.27* 1.31* 0.86 1.29 [-0.43,4.02] [-0.66,6.34] [-0.48,2.90] [-0.50,4.85]
Import-weighted real exchange rate -0.19
[-1.18,1.07] -0.01
[-1.92,1.23] -0.18
[-0.99,0.78] 0.02
[-1.15,1.37]
Log worked hours gap -2.27
[-5.96,7.05] -1.31
[-6.50,15.19] -0.55
[-4.70,4.35] -0.40
[-6.05,9.22]
Percentage large firms 0.55
[-1.30,2.35]
Age 0.02
[-0.07,0.13]
Employment growth 0.71
[-3.53,3.80]
Logarithm of R&D intensity -0.18*
[0.50,0.01]
Union density -0.03*
[-0.24,0.04]
EPL times US job turnover -0.70
[-5.24,13.63]
Coeff. of REGNO in the first-stage regression 0.013** [0.008, 0.017]
0.013** [0.008, 0.017]
0.013** [0.008, 0.018]
0.016** [0.011, 0.021]
0.013** [0.008, 0.018]
Elasticity of training to the Lerner Index -0.651 -0.795 -0.729 -0.589 -0.795 Derived elasticity of training wrt REGNO -0.289 -0.359 -0.329 -0.317 -0.350 Country by sector dummies yes yes yes yes yes Country by year dummies yes yes yes yes yes Sector by year dummies yes yes yes yes yes Number of observations 1120 1108 1084 985 1108

ConclusionsConclusions
•• An increase in product market deregulation An increase in product market deregulation generates a sizeable increase in training generates a sizeable increase in training incidence (10 percent reduction in incidence (10 percent reduction in regulation increases training incidence by regulation increases training incidence by 2.8 to 5 percent in the exposed industries2.8 to 5 percent in the exposed industries
•• These findings suggest that an important These findings suggest that an important link in the relationship between link in the relationship between deregulation and productivity growth is the deregulation and productivity growth is the investment in human capital taking place in investment in human capital taking place in firmsfirms

Thank you!!Thank you!!––
.04
.06
.08
.1.1
2(m
ean)
edu
c4w
n
1992 1994 1996 1998 2000 2002YEAR
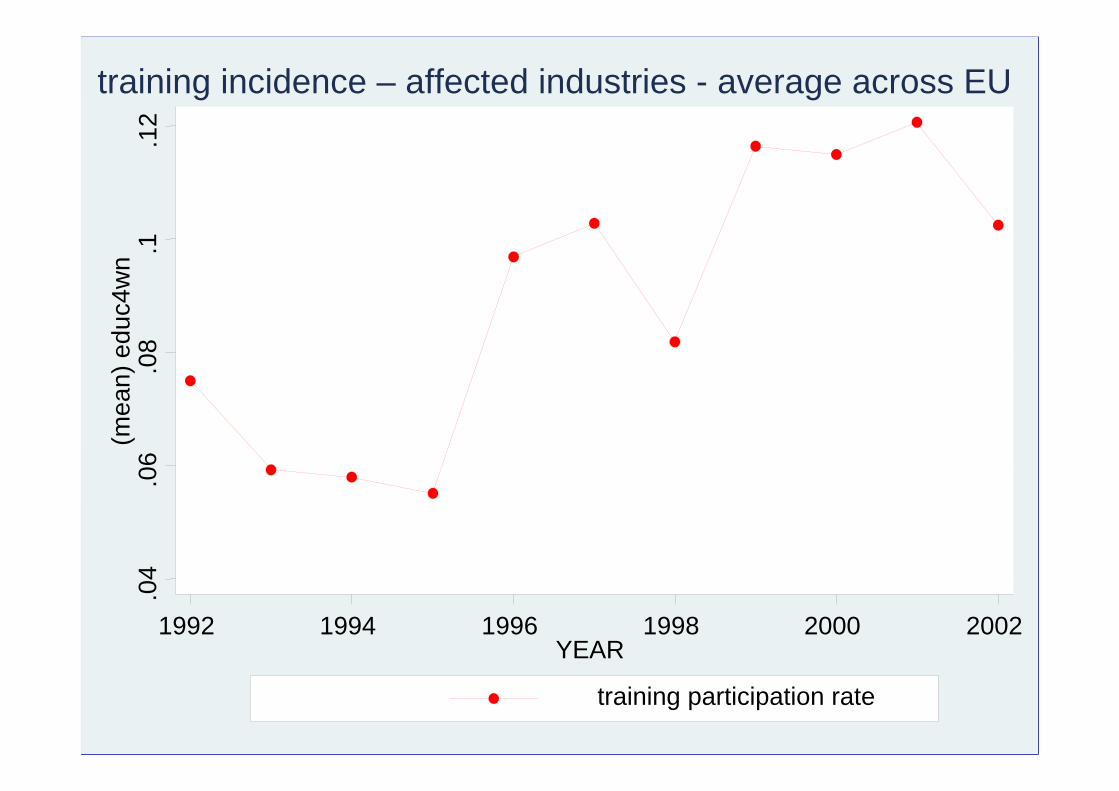
training participation rate
training incidence – affected industries - average across EU
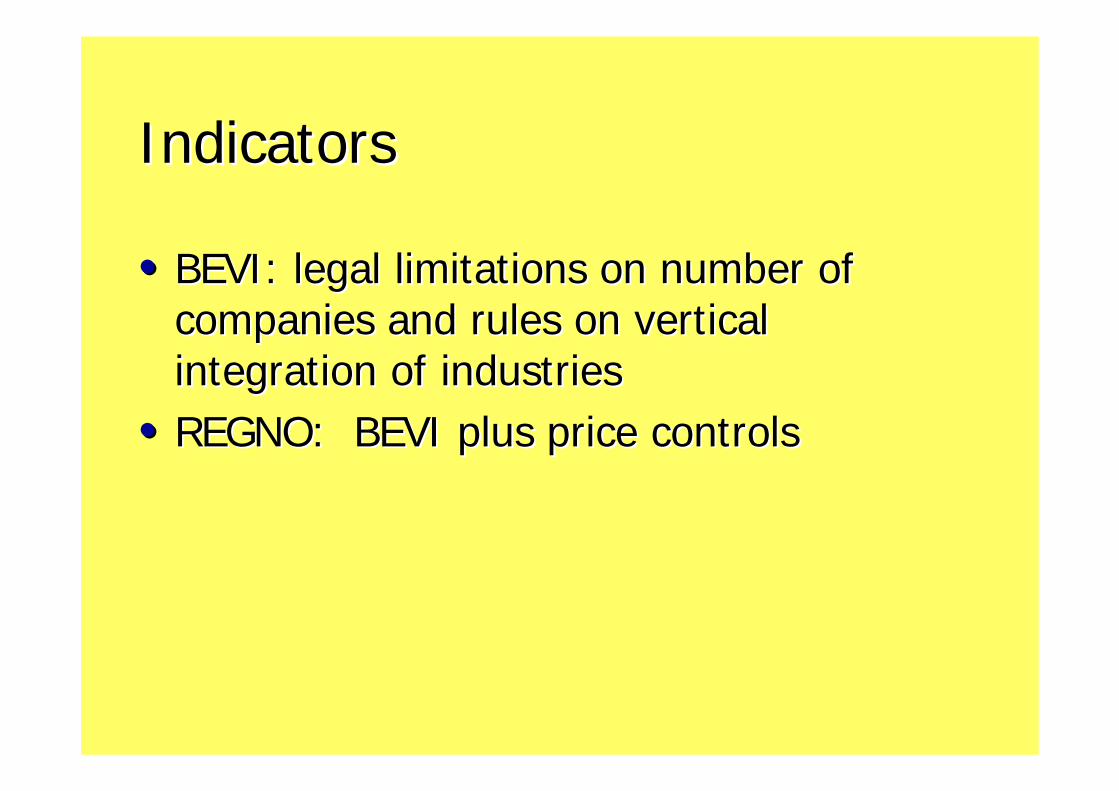
IndicatorsIndicators
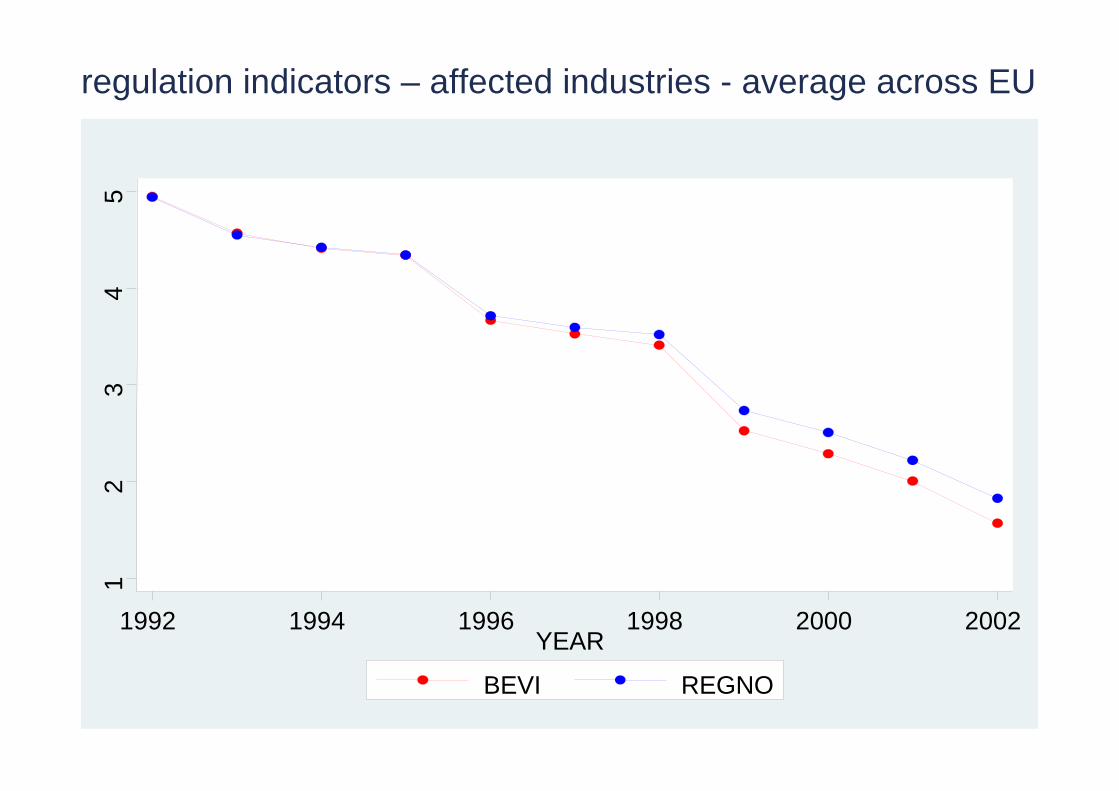
•• BEVI: legal limitations on number of BEVI: legal limitations on number of companies and rules on vertical companies and rules on vertical integration of industriesintegration of industries
•• REGNO: BEVI plus price controls REGNO: BEVI plus price controls
12
34
5
1992 1994 1996 1998 2000 2002YEAR
BEVI REGNO
regulation indicators – affected industries - average across EU
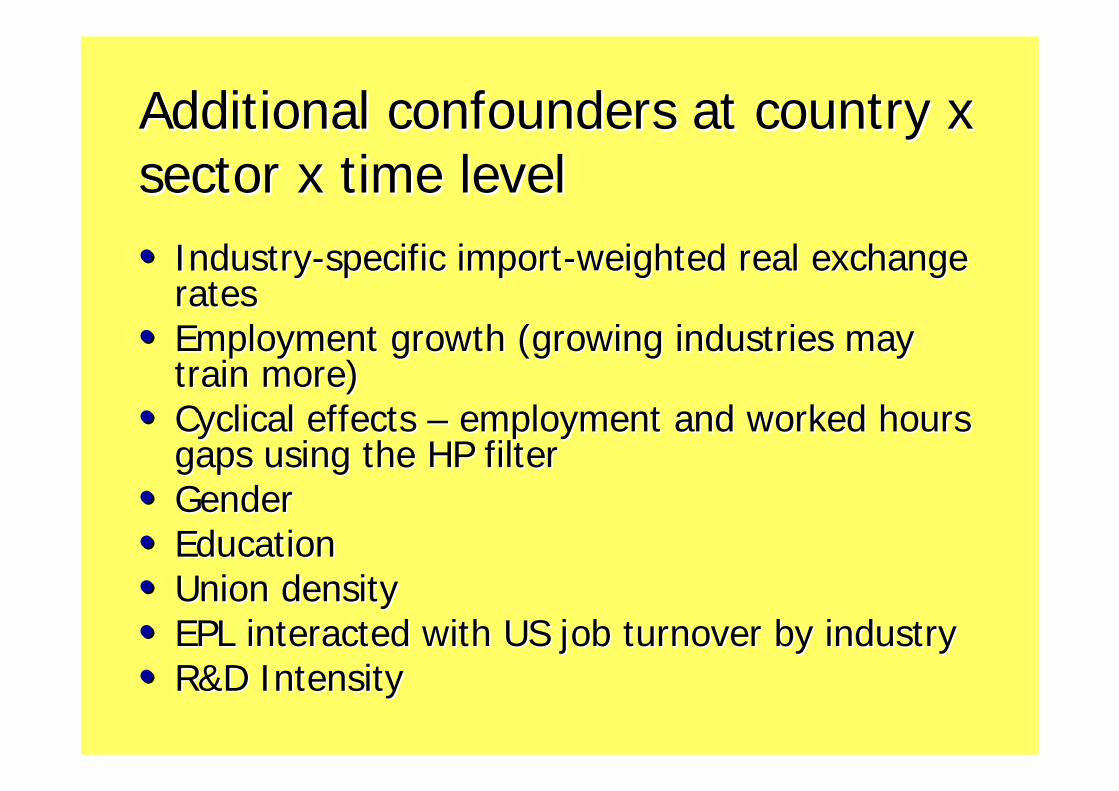
Additional confounders at country x Additional confounders at country x sector x time levelsector x time level•• IndustryIndustry--specific importspecific import--weighted real exchange weighted real exchange
ratesrates•• Employment growth (growing industries may Employment growth (growing industries may
train more)train more)•• Cyclical effects Cyclical effects –– employment and worked hours employment and worked hours
gaps using the HP filtergaps using the HP filter•• GenderGender•• EducationEducation•• Union densityUnion density•• EPL interacted with US job turnover by industryEPL interacted with US job turnover by industry•• R&D IntensityR&D Intensity
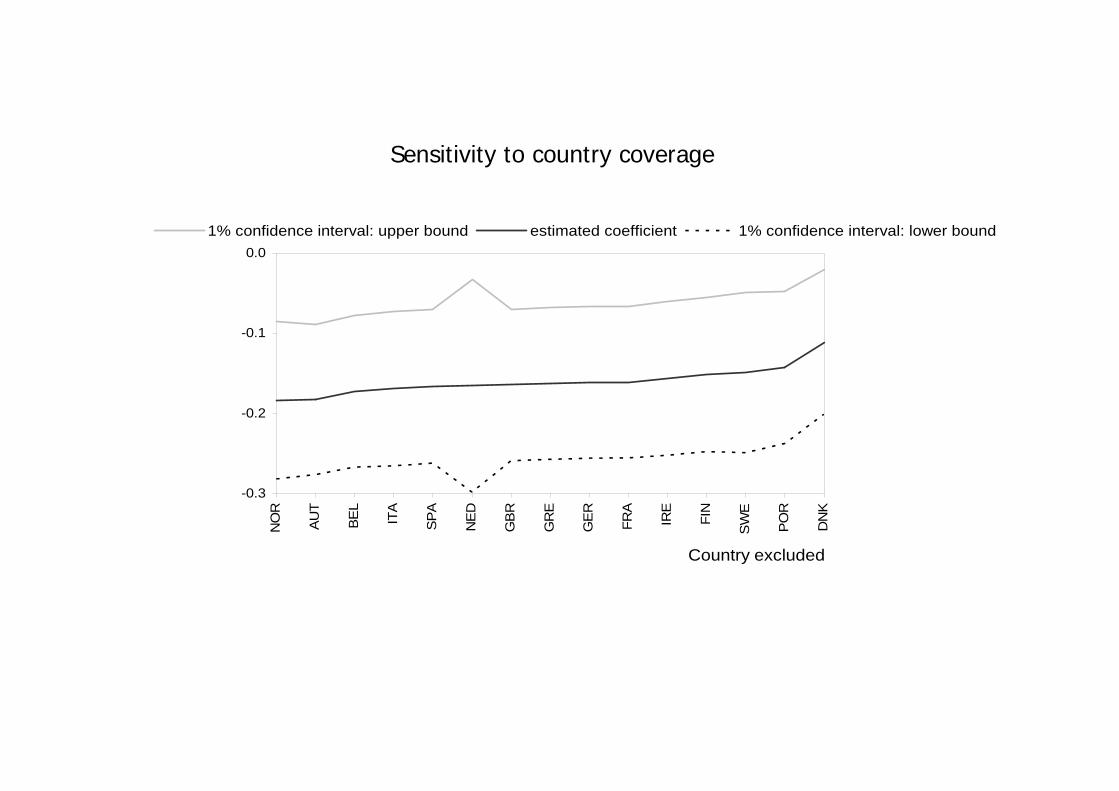
-0.3
-0.2
-0.1
0.0
NO
R
AU
T
BE
L
ITA
SP
A
NE
D
GB
R
GR
E
GE
R
FRA
IRE
FIN
SW
E
PO
R
DN
K
1% confidence interval: upper bound estimated coefficient 1% confidence interval: lower bound
Country excluded
Sensitivity to country coverage

Table 3. Estimates of training stock as a function of REGNO. Alternative measures Coefficient Elasticity
-0.062 -0.204 Training stock – base measure [2.62]*** -0.130 -0.426 Training stock – alternative measure based on observed growth rates [4.51]*** -0.037 -0.122 Training stock – alternative measure assuming 2% steady state growth [2.15]** -0.037 -0.123 Training stock – alternative measure assuming 2.5% steady state growth [2.16]**

Key assumptionsKey assumptions
•• Firms and workers are identical: share the same Firms and workers are identical: share the same technology, demand elasticity, outside options and technology, demand elasticity, outside options and training (and hiring) costs. training (and hiring) costs.
•• No exogenous turnoverNo exogenous turnover
•• Demand elasticity Demand elasticity ↑↑ if number of firms if number of firms ↑↑
•• No physical capital. There is only one type of labourNo physical capital. There is only one type of labour
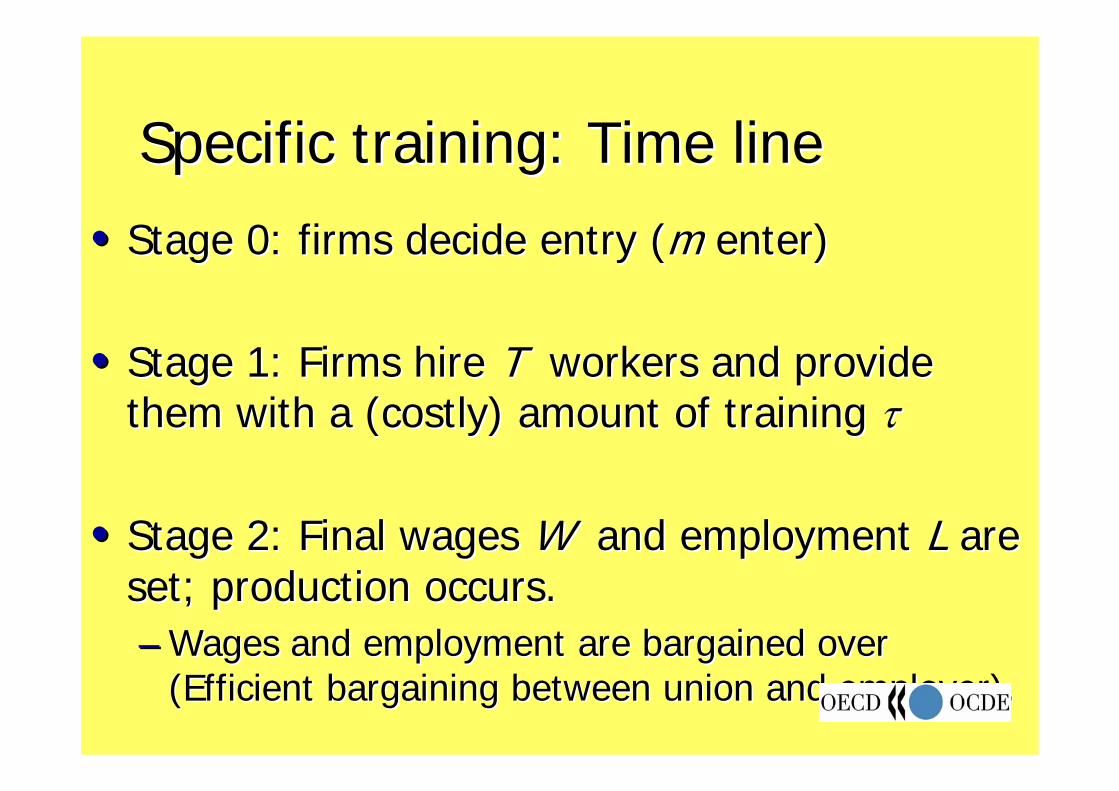
Specific training: Time lineSpecific training: Time line
•• Stage 0: firms decide entry (Stage 0: firms decide entry (mm enter)enter)
•• Stage 1: Firms hire Stage 1: Firms hire TT workers and provide workers and provide them with a (costly) amount of training them with a (costly) amount of training ττ
•• Stage 2: Final wages Stage 2: Final wages WW and employment and employment LL are are set; production occurs. set; production occurs. –– Wages and employment are bargained over Wages and employment are bargained over
(Efficient bargaining between union and employer).(Efficient bargaining between union and employer).

Specific trainingSpecific training
•• Two alternative settings:Two alternative settings:•• CommitmentCommitment: The employer commits to : The employer commits to
employ all trainees (e.g. long notice periods)employ all trainees (e.g. long notice periods)..–– LL = = TT
•• No CommitmentNo Commitment: The employer cannot : The employer cannot commit to employ all trainees.commit to employ all trainees.–– LL < < T T
•• L>T not feasible: training ONLY in the first L>T not feasible: training ONLY in the first periodperiod

Commitment case: setup (see Blanchard Giavazzi 2003)
θ−
⎟⎠⎞
⎜⎝⎛=
PP
mYY i
i
0' ),( >= gmgσθ
ie
i ALY =
iie LL )1( τ+=
Training costs per trainee: 2)(
2i
ic μττ =

Nash Bargaining
Nash maximand:
[ ] [ ]iiiiiii WLYPLVW −−+−=Ω ln)1()(ln δδ
Bargaining over wages only:
))1(()1( VAPVVLYPW ii
i
iii −++=−+= τδδδ
Net profits:
θ
τμτ
τδδ
−
⎟⎠⎞
⎜⎝⎛
⎪⎭
⎪⎬⎫
⎪⎩
⎪⎨⎧
+−
+−−−=Π
PP
mY
APAV
PP i
i
i
i
ii )1(2)1(
)1()1(2

Training Decisions
with L=T
( ) ii
iiii TTPVTA
Ym
2)1()1()1(
211
1
μτδτδ θθ
−−−+⎟⎠⎞
⎜⎝⎛−=Π −
−
First order conditions:
T :
( ) ⎟⎟⎠
⎞⎜⎜⎝
⎛
+−+
+−=
)1()1(2)1(1
2
i
i
i
iAPA
VPP
τδμτ
τθθ
τ :
iiii TAT
PP
μτδθ
=−⎟⎠⎞
⎜⎝⎛ − )1(11

Optimal Training Incidence
0)1(22
>−+±−
=μ
δμμμτ P
V
i
There is a unique positive solution All firms invest in the same amount of training per trainee Prices are the same for all firms (Pi / P = 1) ⇒
θθδ
μτ )1()1( −
−=A
;
θδπ −
=1
; )1( −= θπμ
τ A

Long Run Equilibrium with EntryEntry condition: ρπ =
ρθδπ =
−=
1 [MM]
First order condition for training in the long run
)1( −= θρμ
τ A [TT]
which imply the linear relationship
)1( ρδμ
τ −−=A

TT
MMτ
θ

Reducing entry barriersReducing entry barriers
•• Lower barriers rotate the TT curve Lower barriers rotate the TT curve downwards because they reduce net profits downwards because they reduce net profits per unit of outputper unit of output
•• Lower barriers increases the number of Lower barriers increases the number of firms firms MM shifts out and MM shifts out and training increases because output gains training increases because output gains from reducing unit costs go up from reducing unit costs go up

No commitment case:No commitment case:•• Starting from the commitment equilibriumStarting from the commitment equilibrium
–– Bargaining over L leads to L>T (not feasible)Bargaining over L leads to L>T (not feasible)–– Reason: the parties consider training costs as bygonesReason: the parties consider training costs as bygones
•• Accomodating strategy in the first stage: set Accomodating strategy in the first stage: set TT large enough large enough to accommodate L=T in second stage to accommodate L=T in second stage –– Any Any largelarge--TT strategy is always dominated by a strategy is always dominated by a smallsmall--TT strategy strategy
Intuition: training costs are not internalised in the bargainingIntuition: training costs are not internalised in the bargaining stage, stage, therefore training costs can be cut only by tying own hands and therefore training costs can be cut only by tying own hands and setting a non accommodating strategy with lower Tsetting a non accommodating strategy with lower T
•• Commitment equilibrium holds even in absence of Commitment equilibrium holds even in absence of commitmentcommitment
•• Key reason: firms cannot train in the second periodKey reason: firms cannot train in the second period

General trainingGeneral training
•• If hiring costs > training costs: as aboveIf hiring costs > training costs: as above•• Otherwise: no firm trains, training paid by Otherwise: no firm trains, training paid by
workers, wages set by the market (as in workers, wages set by the market (as in Becker)Becker)
•• Workers invest till MB=MCWorkers invest till MB=MC•• Firms demand training to max profitsFirms demand training to max profits
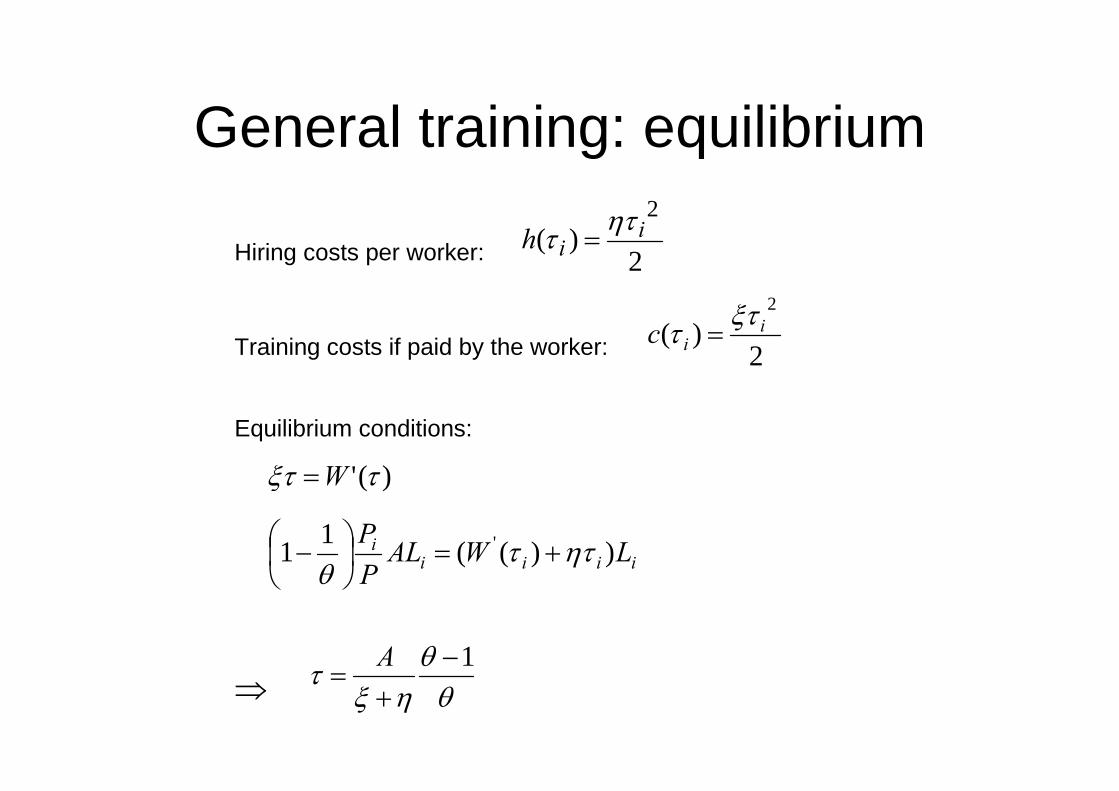
General training: equilibrium
Hiring costs per worker: 2)(
2i
ih ηττ =
Training costs if paid by the worker: 2)(
2i
ic ξττ =
Equilibrium conditions:
)(' τξτ W=
iiiii LWAL
PP ))((11 ' ηττ
θ+=⎟
⎠⎞
⎜⎝⎛ −
⇒ θθ
ηξτ 1−
+=
A