barraone performance attribution - brinson vs factor based
TRANSCRIPT

7/17/2019 BarraOne Performance Attribution - Brinson vs Factor Based
http://slidepdf.com/reader/full/barraone-performance-attribution-brinson-vs-factor-based 1/14
www.mscibarra.com
MSCI Barr a Research© 2010 MSCI Barra. All r ights reserved . 1 of 14
Please refer to the disclaimer at the end of this document. RV0110
Beyond Brinson: Establishing the LinkBetween Sector and Factor Models
Apr il 2010
Ben Davis
Jose Menchero

7/17/2019 BarraOne Performance Attribution - Brinson vs Factor Based
http://slidepdf.com/reader/full/barraone-performance-attribution-brinson-vs-factor-based 2/14
Beyond Brinson
| Apri l 2010
MSCI Barr a Research© 2010 MSCI Barra. All r ights reserved . 2 of 14
Please refer to the disclaimer at the end of this document. RV0310
Introduction
The objective of performance attribution is to explain the sources of portfolio return. To bemeaningful, the attribution model must reflect the investment process and attribute portfolio returnto intuitive sources. The Brinson model (1985) has become an industry standard preciselybecause it reflects a straightforward sector-based investment process and attributes portfolioreturn to intuitive sector allocation and stock selection effects. Positive contributions are earnedby overweighting outperforming sectors and stocks and underweighting underperformers.
Despite the clear benefits of the Brinson framework, attempts to extend it to more generalinvestment processes expose some limitations. One basic limitation is that it requires a strictclassification of stocks by sector. For countries or industries, such classification can bestraightforward and unambiguous. Styles, on the other hand, do not naturally lend themselves tostrict classification schemes. For instance, although it is possible to group stocks into stylequintiles, the cutoff points separating one quintile from the next are essentially arbitrary.
A more significant drawback arises for investment processes based on both styles and industries.
One approach for adapting the Brinson model to such investment processes is to group stocks jointly into style/industry buckets. The problem with this approach is that the number of groupscan quickly spiral out of control. For instance, grouping assets into 10 economic sectors and 5style buckets leads to 50 distinct groups. Adding a second style factor segmented into quintileswould result in 250 separate groups. If countries are added, the number of groupings can easilyexceed the number of stocks. Clearly, the Brinson framework is not suited to describe investmentprocesses that go beyond a simple sector approach.
In this paper, we show that factor-based performance attribution represents an intuitive andpowerful generalization of the familiar Brinson sector-based framework. In particular, we showthat the Brinson model is exactly replicated within a basic type of factor model, aptly termed theBrinson-replicating factor model. In this model, the factor and residual return contributions have aclear financial interpretation as benchmark-relative sector returns and sector-relative stock
returns. The Brinson-replicating model can be easily generalized to explain multiple effects, suchas industries and styles (or countries, in a global model). In this extension, returns aredecomposed into style effects and pure industry effects, net of styles. We also discuss how“stock selection” in the classic Brinson model can be attributed instead to contributions from ahandful of style factors. Finally, we discuss the importance of attributing risk and return to thesame set of decision variables. This provides a means of comparing return contributions on arisk-adjusted basis.
Brinson Sector-Based Attribu tion
A sector-based investment process consists of two basic types of decisions. The first is sectorallocation, where the portfolio manager seeks to overweight sectors that outperform the overallbenchmark. The second is stock selection, where the portfolio manager seeks to overweightstocks that outperform the sector.
Denoting each sector’s portfolio and benchmark weights by and respectively, with
corresponding sector returns and , the Brinson sector-based attribution of active return is
= �( − )( − )
+�( − )
. (1)

7/17/2019 BarraOne Performance Attribution - Brinson vs Factor Based
http://slidepdf.com/reader/full/barraone-performance-attribution-brinson-vs-factor-based 3/14
Beyond Brinson
| Apri l 2010
MSCI Barr a Research© 2010 MSCI Barra. All r ights reserved . 3 of 14
Please refer to the disclaimer at the end of this document. RV0310
The terms of the first sum are the allocation effects and those of the second sum are the selectioneffects. In the case where the portfolio holds cash or cash-equivalents, the return contribution ofthese instruments is best attributed by including Cash as a sector. In this case, the Cashallocation effect (cash drag) is given by
1
Cash Allocation = (ℎ − ℎ )(0− ). (2)
Overweighting Cash creates positive cash drag in a down market, but detracts from performancein an up market. Certain cash-equivalents, such as commercial paper, may have returns thatdiffer from the risk-free rate, and this is captured by the Cash selection effect,
Cash Selection = ℎ (ℎ − 0). (3)
Although the validity of the Brinson model can be easily verified algebraically, it is conceptuallybeneficial to obtain the attribution formula from security-level considerations. The excess returnof a single stock
can be decomposed into three terms,
= + ( −) + ( − ). (4)
The first component is the benchmark return, and represents the aggregate movement of allstocks. The second term is the relative return of the sector, and describes how the sectorperformed compared to the overall benchmark. The last term explains how the individual stockperformed relative to the sector. Later, we will see that each of the three terms in Equation (4)has an exact counterpart within the Brinson-replicating factor model.
Consider a portfolio with asset weights . Equation (4) rolls-up to the portfolio level as
=
+
�(
− )
+
��(
− ) .
∈ (5)
The final summation in Equation (5) simplifies to
�( − )
∈= ( − ). (6)
Combining Equations (5) and (6) leads to
= + �( − )
+ �( − ).
(7)
In the case of the benchmark, the attribution becomes
= +�( − )
+ 0 .
(8)
1 We consider returns in excess of the risk-free rate so that cash has zero return.

7/17/2019 BarraOne Performance Attribution - Brinson vs Factor Based
http://slidepdf.com/reader/full/barraone-performance-attribution-brinson-vs-factor-based 4/14
Beyond Brinson
| Apri l 2010
MSCI Barr a Research© 2010 MSCI Barra. All r ights reserved . 4 of 14
Please refer to the disclaimer at the end of this document. RV0310
Note that the last term vanishes since the weighted average of stock relative return is zero withineach sector, i.e.,
�( − )
∈
= 0. (9)
Taking the difference of the portfolio and benchmark return attributions in Equations (7) and (8)immediately yields the Brinson sector-based performance attribution in Equation (1). In otherwords, the sector allocation effect is precisely the difference between the portfolio and benchmarksector-relative components, and the corresponding selection effect is precisely the differencebetween the portfolio and benchmark stock-relative components.
We give a concrete example using the MSCI USA Investable Market Index (USA IMI) as ourbenchmark, which aims to capture the full breadth of investment opportunities available in the USmarket. We take our portfolio to be 95 percent invested in the MSCI USA Investable MarketValue Index (USA Value), and a 5 percent cash position in US dollars. We select as our analysisperiod August 2009, and choose the US dollar as the base currency.
A Brinson sector-based attribution is presented in Table 1, classified according to the GlobalIndustry Classification Standard (GICS
® ) sectors. The active return was 132 bps, of which 46
bps was due to allocation effect, with the remaining 86 bps due to selection effect. The mostsignificant contribution to allocation effect was 69 bps from Financials. The portfolio was 8.55percent overweight in the Financials sector, which outperformed the benchmark by 8.13 percentin August 2009. Cash drag cost the portfolio 18 bps of active return as the benchmark was up3.64 percent for the month. Financials also drove selection effect with a 28 bps contribution asthe portfolio outperformed the benchmark by 1.21 percent.
Table 1
Brinson sector-based performance attribution
Portfolio Bench Active Portfolio Bench Relative Active Allocation Selection Total
Sector Weight Weight Weight Return Return Return Return Effect Effect Effect
Cash 5.00% 0.00% 5.00% 0.00% 0.00% -3.64% 0.00% -0.18% 0.00% -0.18%
Energy 15.50% 11.34% 4.15% 0.50% 0.84% -2.80% -0.34% -0.12% -0.05% -0.17%
Materials 3.68% 3.81% -0.13% 4.58% 2.77% -0.88% 1.81% 0.00% 0.07% 0.07%
Industrials 11.79% 10.47% 1.31% 5.54% 4.03% 0.39% 1.51% 0.01% 0.18% 0.18%
Consumer Discretionary 7.20% 9.95% -2.75% 6.36% 4.22% 0.58% 2.13% -0.02% 0.15% 0.14%
Consumer Staples 6.75% 10.35% -3.60% 0.63% 0.89% -2.75% -0.26% 0.10% -0.02% 0.08%
Health Care 10.30% 13.47% -3.17% 3.49% 2.35% -1.30% 1.15% 0.04% 0.12% 0.16%
Financials 23.37% 14.82% 8.55% 12.98% 11.77% 8.13% 1.21% 0.69% 0.28% 0.98%
Information Technology 4.27% 18.75% -14.48% 4.89% 2.64% -1.01% 2.25% 0.15% 0.10% 0.24%
Telecommunications 5.04% 3.04% 2.00% -1.68% -2.42% -6.06% 0.74% -0.12% 0.04% -0.08%
Utilities 7.11% 3.99% 3.12% 0.65% 0.66% -2.99% -0.01% -0.09% 0.00% -0.09%
Total 100.00% 100.00% 0.00% 4.96% 3.64% 1.32% 0.46% 0.86% 1.32%

7/17/2019 BarraOne Performance Attribution - Brinson vs Factor Based
http://slidepdf.com/reader/full/barraone-performance-attribution-brinson-vs-factor-based 5/14
Beyond Brinson
| Apri l 2010
MSCI Barr a Research© 2010 MSCI Barra. All r ights reserved . 5 of 14
Please refer to the disclaimer at the end of this document. RV0310
Factor-Based Attribution
Factor models decompose asset returns into a systematic component that is explained by factors,and a residual component that is not,
= �
+ . (10)
Here, is the exposure of stock to factor , is the factor return, and is the residualreturn of the stock. Stock exposures are known at the start of the period, and factor returns areestimated by cross-sectional regression at the end of the period. Factor returns can be written inthe following general form
= �Ω ,
(11)
where Ω is the weight of stock in pure factor portfolio . Factor-replicating portfolios have unitexposure to the factor in question and zero exposure to other factors. For example, industryfactor portfolios are style neutral, and style factor portfolios have net zero weight in everyindustry. A thorough discussion of this interpretation is provided by Menchero (2010).
Active return can be attributed by rolling up contributions from the asset level,
= �
+ �
, (12)
where is the active weight of asset n, and is the active exposure to factor k,
= � .
(13)
Positive contributions to active return are earned through positive exposure to factors withpositive returns and by overweighting assets with positive residual returns.
The Brinson-Replicating Factor Model
In this section we describe a special type of factor model that exactly replicates the Brinsonmodel. This model has five defining characteristics: (a) it includes an intercept term; (b) itcontains a set of dummy variables with (0,1) exposure to indicate group membership; (c) theestimation universe is the set of all stocks within the benchmark; (d) benchmark weights are used
for regression weights, and (e) group factor returns are constrained to be benchmark-weightedmean zero.
As a concrete illustration, let the intercept term represent the country factor (denoted by ) andthe groups correspond to industries (denoted by ). Stock returns can therefore be expressed as:
= + + . (14)

7/17/2019 BarraOne Performance Attribution - Brinson vs Factor Based
http://slidepdf.com/reader/full/barraone-performance-attribution-brinson-vs-factor-based 6/14
Beyond Brinson
| Apri l 2010
MSCI Barr a Research© 2010 MSCI Barra. All r ights reserved . 6 of 14
Please refer to the disclaimer at the end of this document. RV0310
Note that the factor structure in the Brinson-replicating model exhibits an exact collinearity. Thatis, the country column of the factor exposure matrix is equal to the sum of the industry columns.To obtain a unique regression solution, we impose the constraint that the benchmark cap-weighted industry factor returns sum to zero:
�
= 0. (15)
As discussed by Menchero (2010), under this regression scheme, the country factor return isexactly equal to the benchmark return,
= , (16)
which is the first term of Equation (4). Furthermore, the industry factor return is given by
= − , (17)
where is the benchmark return of industry . Equation (17) is precisely the relative return ofthe sector in Equation (4). The industry factor portfolio is therefore 100 percent long thebenchmark industry and 100 percent short the overall benchmark. The residual return ofEquation (14) is given by
= − , (18)
which is the third and final term of Equation (4). Thus, for the Brinson-replicating factor model,the factor-based attribution of stock return in Equation (10) is precisely equal to the sector-basedattribution in Equation (4). Moreover, the corresponding roll-ups to the portfolio level are alsoequal, thus demonstrating that the Brinson-replicating factor-based attribution is identical to theconventional Brinson sector-based attribution.
In Table 2, we present a performance attribution analysis using the Brinson-replicating factormodel. The portfolio, benchmark, and analysis period are the same as those used in Table 1.Note that the factor return and residual return contributions in Table 2 exactly match the Brinsonallocation and selection effects from Table 1. Moreover, the exposures and returns are alsoidentical. For instance, the portfolio residual return in each sector is identical to the active sectorreturn in the Brinson model. Similarly, the factor return for each sector exactly corresponds to therelative sector return in the Brinson model. The only exception is that the Cash sector differsfrom USA country factor by a trivial sign. This is offset by the active exposure, which also differsby a sign.

7/17/2019 BarraOne Performance Attribution - Brinson vs Factor Based
http://slidepdf.com/reader/full/barraone-performance-attribution-brinson-vs-factor-based 7/14
Beyond Brinson
| Apri l 2010
MSCI Barr a Research© 2010 MSCI Barra. All r ights reserved . 7 of 14
Please refer to the disclaimer at the end of this document. RV0310
Table 2
Factor-based performance attribution using the Brinson-replicating factor model
Factor Portfolio Bench Residual Total
Port Bench Active Factor Return Residual Residual Return Return
Factor Exp Exp Exp Return Contrib Return Return Contrib Contrib
USA Country 95.00% 100.00% -5.00% 3.64% -0.18% — — 0.00% -0.18%
Energy 15.50% 11.34% 4.15% -2.80% -0.12% -0.34% 0.00% -0.05% -0.17%
Materials 3.68% 3.81% -0.13% -0.88% 0.00% 1.81% 0.00% 0.07% 0.07%
Industrials 11.79% 10.47% 1.31% 0.39% 0.01% 1.51% 0.00% 0.18% 0.18%
Consumer Discretionary 7.20% 9.95% -2.75% 0.58% -0.02% 2.13% 0.00% 0.15% 0.14%
Consumer Staples 6.75% 10.35% -3.60% -2.75% 0.10% -0.26% 0.00% -0.02% 0.08%
Health Care 10.30% 13.47% -3.17% -1.30% 0.04% 1.15% 0.00% 0.12% 0.16%
Financials 23.37% 14.82% 8.55% 8.13% 0.69% 1.21% 0.00% 0.28% 0.98%
Information Technology 4.27% 18.75% -14.48% -1.01% 0.15% 2.25% 0.00% 0.10% 0.24%
Telecommunications 5.04% 3.04% 2.00% -6.06% -0.12% 0.74% 0.00% 0.04% -0.08%
Utilities 7.11% 3.99% 3.12% -2.99% -0.09% -0.01% 0.00% 0.00% -0.09%
Total 0.46% 0.86% 1.32%
Style Factors
Investment style represents another major source of portfolio return. For equities, the majorstyles include Value, Momentum, Size, and Volatility. Style factor exposures are constructedfrom intuitive stock attributes called descriptors. For instance, price-to-book ratio, earnings yield,and dividend yield are all attributes that can be used to identify value stocks. For the Volatilityfactor, the dominant descriptor is historical beta, whereas for Size it is log of market cap.Momentum descriptors include relative strength of the stock over the trailing 6-12 months.
We standardize style factor exposures to be benchmark cap-weighted mean 0 and standard
deviation 1. As a consequence, the benchmark has zero exposure to all styles, and otherportfolios have positive or negative exposures to the extent that they tilt on that particular factor.For instance, a portfolio tilted to high beta stocks will have positive exposure to the Volatilityfactor.
A factor-based performance attribution analysis that augments the Brinson-replicating factormodel with Volatility, Momentum, Size, and Value is presented in Table 3. The style exposuresare taken from the Barra US Equity Model (USE3), with the factors re-standardized to be cap-weighted mean 0 over the MSCI USA Investable Market Index. The regression weights andconstraints are identical to those in the Brinson-replicating factor model.

7/17/2019 BarraOne Performance Attribution - Brinson vs Factor Based
http://slidepdf.com/reader/full/barraone-performance-attribution-brinson-vs-factor-based 8/14
Beyond Brinson
| Apri l 2010
MSCI Barr a Research© 2010 MSCI Barra. All r ights reserved . 8 of 14
Please refer to the disclaimer at the end of this document. RV0310
Table 3
Industries and styles factor-based performance attribution
Factor Portfolio Bench Residual Total
Port Bench Active Factor Return Residual Residual Return Return
Factor Exp Exp Exp Return Contrib Return Return Contrib Contrib
USA Country 95.00% 100.00% -5.00% 3.64% -0.18% — — 0.00% -0.18%
Energy 15.50% 11.34% 4.15% -3.63% -0.15% -0.09% 0.00% -0.01% -0.16%
Materials 3.68% 3.81% -0.13% -1.23% 0.00% 0.08% 0.00% 0.00% 0.00%
Industrials 11.79% 10.47% 1.31% -0.58% -0.01% 0.33% 0.00% 0.04% 0.03%
Consumer Discretionary 7.20% 9.95% -2.75% 0.92% -0.03% -0.52% 0.00% -0.04% -0.06%
Consumer Staples 6.75% 10.35% -3.60% -0.56% 0.02% -0.58% 0.00% -0.04% -0.02%
Health Care 10.30% 13.47% -3.17% 0.29% -0.01% 0.16% 0.00% 0.02% 0.01%
Financials 23.37% 14.82% 8.55% 4.29% 0.37% 0.45% 0.00% 0.11% 0.47%
Information Technology 4.27% 18.75% -14.48% 0.48% -0.07% -0.65% 0.00% -0.03% -0.10%
Telecommunications 5.04% 3.04% 2.00% -5.87% -0.12% 0.68% 0.00% 0.03% -0.08%
Utilities 7.11% 3.99% 3.12% -2.51% -0.08% 0.06% 0.00% 0.00% -0.07%
Volatility 0.10 0.00 0.10 1.92% 0.20% — — 0.00% 0.20%
Momentum -0.21 0.00 -0.21 -3.02% 0.63% — — 0.00% 0.63%
Value 0.30 0.00 0.30 2.15% 0.65% — — 0.00% 0.65%
Size 0.01 0.00 0.01 0.60% 0.01% — — 0.00% 0.01%
Total 1.23% 0.09% 1.32%
With the factor model extended to include styles, we see that factors now explain the vastmajority (123 bps) of active return, leaving a residual contribution of only 9 bps. What appearedas “stock selection” in the Brinson model is now attributed to a few style factors. Value returned2.15 percent for the month and so the positive tilt (0.30) on Value contributed 65 bps to activereturn. Momentum was down 3.02 percent for the month, and so the negative tilt (-0.21)
contributed an additional 63 bps of active return. The pure Financials factor returned 4.29percent, and the overweight of this sector contributed 37 bps to the active return.
Notice that the return of pure Financials (4.29 percent) is significantly less than the relative returnof Financials (8.13 percent). This is because the pure Financials factor measures theperformance of the Financials sector net of the Country factor and style effects. In other words,much of the relative performance of the Financials sector is explained by styles.
In Table 4, we attribute relative sector return to the pure sector and styles. Nearly half of therelative sector return of Financials is explained by style factors. The Financials sector had largetilts on Volatility, Momentum, and Value which significantly boosted the return of the sector.Taking the sum-product of these style exposures with the style factor returns yields the stylesreturn contribution (3.83 percent) of the Financials sector. Adding the styles return contribution
with the return of pure Financials (4.29 percent) yields the relative return of the Financials sector(8.13 percent).

7/17/2019 BarraOne Performance Attribution - Brinson vs Factor Based
http://slidepdf.com/reader/full/barraone-performance-attribution-brinson-vs-factor-based 9/14
Beyond Brinson
| Apri l 2010
MSCI Barr a Research© 2010 MSCI Barra. All r ights reserved . 9 of 14
Please refer to the disclaimer at the end of this document. RV0310
Table 4
MSCI USA IMI GICS sector style tilts and relative return attributions
Styles Pure Relative
Benchmark Volatility Momentum Value Size Return Industries Sector
Sector Exposure Exposure Exposure Exposure Contrib Return Return
Energy -0.11 -0.15 0.12 0.54 0.83% -3.63% -2.80%
Materials 0.40 -0.10 -0.15 -0.68 0.35% -1.23% -0.88%
Industrials 0.17 -0.32 -0.04 -0.41 0.97% -0.58% 0.39%
Consumer Discretionary 0.38 0.22 0.00 -0.65 -0.34% 0.92% 0.58%
Consumer Staples -0.75 0.12 -0.32 0.50 -2.19% -0.56% -2.75%
Health Care -0.40 0.11 -0.24 0.05 -1.59% 0.29% -1.30%
Financials 0.71 -0.37 0.71 -0.24 3.83% 4.29% 8.13%
Information Technology 0.01 0.33 -0.32 0.30 -1.49% 0.48% -1.01%
Telecommunications -0.44 0.00 0.10 0.70 -0.19% -5.87% -6.06%
Utilities -0.54 -0.06 0.37 -0.69 -0.48% -2.51% -2.99%
Factor Return 1.92% -3.02% 2.15% 0.60% — — —
Consumer Staples also saw a large contribution coming from style factors. This sector, whichcontains mostly low-beta stocks, had a large negative exposure (-0.75) to Volatility. The 192 bpsreturn to Volatility therefore detracted 144 bps from the sector performance. The Value andMomentum factors also detracted considerably from the performance of Consumer Staples.
Risk Attribution
In this paper, we showed two ways of attributing return, corresponding to two distinct investmentprocesses. The first considered only sectors and could be fully explained by the classic Brinsonmodel. The second investment process included sectors and style factors, and could only beexplained by means of the extended factor model.
Whatever the investment process, it is always possible to attribute return and risk to the same setof sources. Furthermore, alignment of risk and performance attribution along the same decisionvariables is essential to properly evaluate the tradeoff between risk and return.
Davis and Menchero (2010) describe the x-sigma-rho framework for aligning risk andperformance attribution. In this approach, the most general performance attribution is written as
= �
, (19)
where is the portfolio exposure to source , and is the return of the source. The sourceexposures are known at the start of the analysis period, and the source returns are realized at theend. The risk attribution corresponding to the general return attribution of Equation (19) is givenby the x-sigma-rho formula,
() = �()( ,)
, (20)
7/17/2019 BarraOne Performance Attribution - Brinson vs Factor Based
http://slidepdf.com/reader/full/barraone-performance-attribution-brinson-vs-factor-based 10/14
Beyond Brinson
| Apri l 2010
MSCI Barr a Research© 2010 MSCI Barra. All r ights reserved . 10 of 14
Please refer to the disclaimer at the end of this document. RV0310
where ( ) is the volatility of the source, and ( ,) is the correlation of the source with theportfolio. In the factor-based attribution of Equation (12), the return sources are the factor andresidual returns, and the source exposures are the active factor exposures and active stockweights. Applying the x-sigma-rho formula to the factor-based performance attribution inEquation (12) immediately yields the corresponding risk attribution,
( ) = � ( )( , ) +
� ()( , )
. (21)
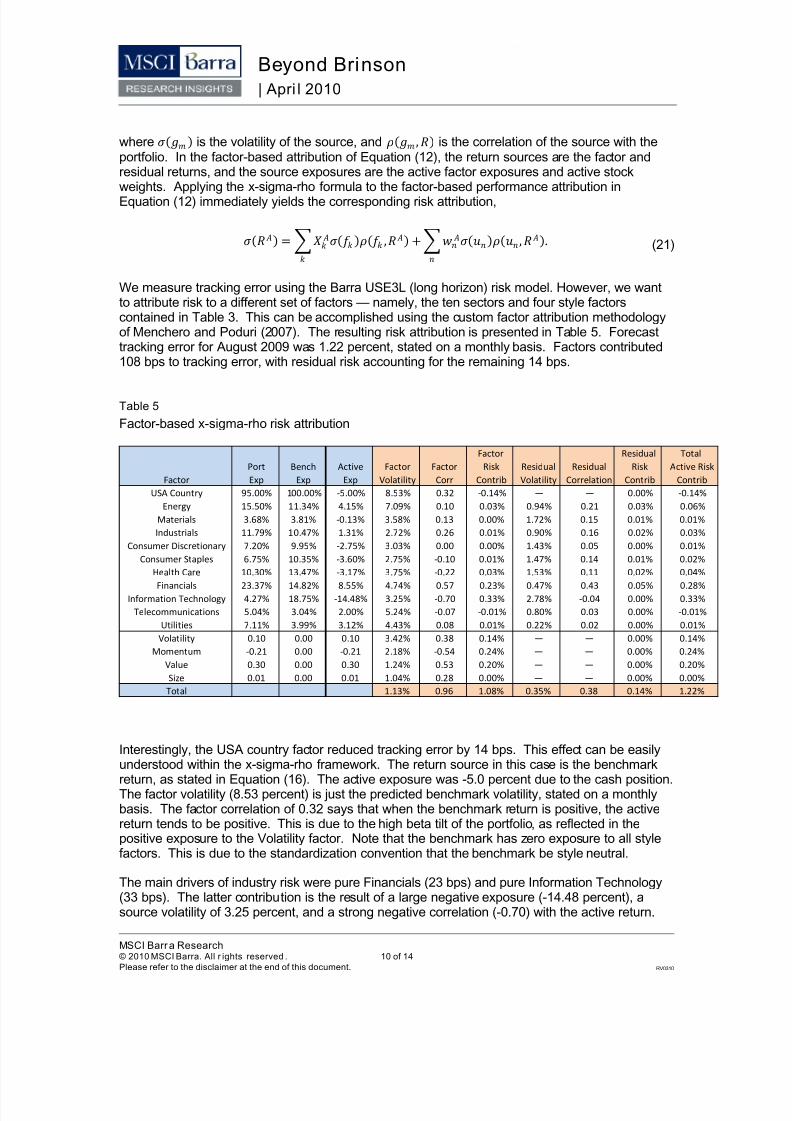
We measure tracking error using the Barra USE3L (long horizon) risk model. However, we wantto attribute risk to a different set of factors — namely, the ten sectors and four style factorscontained in Table 3. This can be accomplished using the custom factor attribution methodologyof Menchero and Poduri (2007). The resulting risk attribution is presented in Table 5. Forecasttracking error for August 2009 was 1.22 percent, stated on a monthly basis. Factors contributed108 bps to tracking error, with residual risk accounting for the remaining 14 bps.
Table 5
Factor-based x-sigma-rho risk attribution
Factor Residual Total
Port Bench Active Factor Factor Risk Residual Residual Risk Active Risk
Factor Exp Exp Exp Volatility Corr Contrib Volatility Correlation Contrib Contrib
USA Country 95.00% 100.00% -5.00% 8.53% 0.32 -0.14% — — 0.00% -0.14%
Energy 15.50% 11.34% 4.15% 7.09% 0.10 0.03% 0.94% 0.21 0.03% 0.06%
Materials 3.68% 3.81% -0.13% 3.58% 0.13 0.00% 1.72% 0.15 0.01% 0.01%
Industrials 11.79% 10.47% 1.31% 2.72% 0.26 0.01% 0.90% 0.16 0.02% 0.03%
Consumer Discretionary 7.20% 9.95% -2.75% 3.03% 0.00 0.00% 1.43% 0.05 0.00% 0.01%
Consumer Staples 6.75% 10.35% -3.60% 2.75% -0.10 0.01% 1.47% 0.14 0.01% 0.02%
Health Care 10.30% 13.47% -3.17% 3.75% -0.22 0.03% 1.53% 0.11 0.02% 0.04%
Financials 23.37% 14.82% 8.55% 4.74% 0.57 0.23% 0.47% 0.43 0.05% 0.28%Information Technology 4.27% 18.75% -14.48% 3.25% -0.70 0.33% 2.78% -0.04 0.00% 0.33%
Telecommunications 5.04% 3.04% 2.00% 5.24% -0.07 -0.01% 0.80% 0.03 0.00% -0.01%
Utilities 7.11% 3.99% 3.12% 4.43% 0.08 0.01% 0.22% 0.02 0.00% 0.01%
Volatility 0.10 0.00 0.10 3.42% 0.38 0.14% — — 0.00% 0.14%
Momentum -0.21 0.00 -0.21 2.18% -0.54 0.24% — — 0.00% 0.24%
Value 0.30 0.00 0.30 1.24% 0.53 0.20% — — 0.00% 0.20%
Size 0.01 0.00 0.01 1.04% 0.28 0.00% — — 0.00% 0.00%
Total 1.13% 0.96 1.08% 0.35% 0.38 0.14% 1.22%
Interestingly, the USA country factor reduced tracking error by 14 bps. This effect can be easilyunderstood within the x-sigma-rho framework. The return source in this case is the benchmark
return, as stated in Equation (16). The active exposure was -5.0 percent due to the cash position.The factor volatility (8.53 percent) is just the predicted benchmark volatility, stated on a monthlybasis. The factor correlation of 0.32 says that when the benchmark return is positive, the activereturn tends to be positive. This is due to the high beta tilt of the portfolio, as reflected in thepositive exposure to the Volatility factor. Note that the benchmark has zero exposure to all stylefactors. This is due to the standardization convention that the benchmark be style neutral.
The main drivers of industry risk were pure Financials (23 bps) and pure Information Technology(33 bps). The latter contribution is the result of a large negative exposure (-14.48 percent), asource volatility of 3.25 percent, and a strong negative correlation (-0.70) with the active return.

7/17/2019 BarraOne Performance Attribution - Brinson vs Factor Based
http://slidepdf.com/reader/full/barraone-performance-attribution-brinson-vs-factor-based 11/14
Beyond Brinson
| Apri l 2010
MSCI Barr a Research© 2010 MSCI Barra. All r ights reserved . 11 of 14
Please refer to the disclaimer at the end of this document. RV0310
This negative correlation is intuitive, because when Information Technology performs well, theactive return tends to be negative.
Styles contributed 58 bps to tracking error, with Volatility (14 bps), Momentum (24 bps), andValue (20 bps), accounting for all of the contribution. This is about the same as the tracking errorcontribution (56 bps) coming from Financials and Information Technology. However, from Table3, we see that these three style factors accounted for 148 bps of active return, whereas the twosectors combined for only 30 bps. Therefore, on a risk-adjusted basis the style factors performedmuch better than the sectors.
Conclusion
Classic Brinson sector-based attribution is widely used in the asset management industrybecause it explains active return in terms of intuitive allocation and selection decisions. Whilethere is significant value in its simplicity, a shortcoming is that it cannot easily explain the effects
of multiple variables. We introduced a special type of factor model with five definingcharacteristics that exactly replicates the classic Brinson model. The strength of this model,however, is that it can be easily extended to explain more general types of investment processes.Finally, by means of the x-sigma-rho formula, we attribute risk along the same factors asperformance. This allows return contributions to be analyzed on a risk-adjusted basis.

7/17/2019 BarraOne Performance Attribution - Brinson vs Factor Based
http://slidepdf.com/reader/full/barraone-performance-attribution-brinson-vs-factor-based 12/14
Beyond Brinson
| Apri l 2010
MSCI Barr a Research© 2010 MSCI Barra. All r ights reserved . 12 of 14
Please refer to the disclaimer at the end of this document. RV0310
References
Brinson, G., and N. Fachler. 1985. “Measuring Non-U.S. Equity Portfolio Performance,” Journal ofPortfolio Management, vol. 11, no. 3 (Spring): pp. 73-76.
Davis, B., and J. Menchero. 2010. “Risk Contribution is Exposure times Volatility timesCorrelation: Decomposing risk using the x-sigma-rho formula,” Journal of Portfolio Management,to appear .
Menchero J., V. Poduri. 2008. “Custom Factor Attribution,” Financial Analysts Journal, vol. 64, no.2: (March/April): pp. 81-92.
Menchero J. 2010. “The Characteristics of Factor Portfolios,” working paper .

7/17/2019 BarraOne Performance Attribution - Brinson vs Factor Based
http://slidepdf.com/reader/full/barraone-performance-attribution-brinson-vs-factor-based 13/14
Beyond Brinson
| Apri l 2010
MSCI Barr a Research© 2010 MSCI Barra. All r ights reserved . 13 of 14
Please refer to the disclaimer at the end of this document. RV0310
Contact Information
Americas
Americas
Atlanta
Boston
Chicago
Montreal
Monterrey
New York
San Francisco
Sao Paulo
Stamford
Toronto
1.888.588.4567 (toll free)
+ 1.404.551.3212
+ 1.617.532.0920
+ 1.312.675.0545
+ 1.514.847.7506
+ 52.81.1253.4020
+ 1.212.804.3901
+ 1.415.836.8800
+ 55.11.3706.1360
+1.203.325.5630
+ 1.416.628.1007
Europe, Middle East & Africa
Amsterdam
Cape Town
Frankfurt
Geneva
London
Madrid
Milan
Paris
Zurich
+ 31.20.462.1382
+ 27.21.673.0100
+ 49.69.133.859.00
+ 41.22.817.9777
+ 44.20.7618.2222
+ 34.91.700.7275
+ 39.02.5849.0415
0800.91.59.17 (toll free)
+ 41.44.220.9300
Asia Paci fic
China North
China South
Hong Kong
Seoul
Singapore
Sydney
Tokyo
10800.852.1032 (toll free)
10800.152.1032 (toll free)
+ 852.2844.9333
+ 827.0768.88984
800.852.3749 (toll free)
+ 61.2.9033.9333
+ 81.3.5226.8222
www.mscibarra.com

7/17/2019 BarraOne Performance Attribution - Brinson vs Factor Based
http://slidepdf.com/reader/full/barraone-performance-attribution-brinson-vs-factor-based 14/14
Beyond Brinson
| Apri l 2010
MSCI Barr a Research© 2010 MSCI Barra. All r ights reserved . 14 of 14
Please refer to the disclaimer at the end of this document. RV0310
Notice and Disclaimer
This document and all of the information contained in it, including without limitation all text, data, graphs, charts
(collectively, the “Information”) is the property of MSCl Inc. (“MSCI”), Barra, Inc. (“Barra”), or their affiliates (includingwithout limitation Financial Engineering Associates, Inc.) (alone or with one or more of them, “MSCI Barra”), or theirdirect or indirect suppliers or any third party involved in the making or compiling of the Information (collectively, the“MSCI Barra Parties”), as applicable, and is provided for informational purposes only. The Information may not bereproduced or redisseminated in whole or in part without prior written permission from MSCI or Barra, as applicable.
The Information may not be used to verify or correct other data, to create indices, risk models or analytics, or inconnection with issuing, offering, sponsoring, managing or marketing any securities, portfolios, financial products orother investment vehicles based on, linked to, tracking or o therwise derived from any MSCI or Barra product or data.
Historical data and analysis should not be taken as an indication or guarantee of any future performance, analysis,forecast or prediction.
None of the Information constitutes an offer to sell (or a solicitation of an offer to buy), or a promotion orrecommendation of, any security, financial product or other investment vehicle or any t rading strategy, and none ofthe MSCI Barra Parties endorses, approves or otherwise expresses any opinion regarding any issuer, securities,financial products or instruments or trading strategies. None of the Information, MSCI Barra indices, models or otherproducts or services is intended to constitute investment advice or a recommendation to make (or refrain frommaking) any kind of investment decision and may not be relied on as such.
The user of the Information assumes the entire risk of any use it may make or permit to be made of the Information.
NONE OF THE MSCI BARRA PARTIES MAKES ANY EXPRESS OR IMPLIED WARRANTIES ORREPRESENTATIONS WITH RESPECT TO THE INFORMATION (OR THE RESULTS TO BE OBTAINED BY THEUSE THEREOF), AND TO THE MAXIMUM EXTENT PERMITTED BY LAW, MSCI AND BARRA, EACH ON THEIRBEHALF AND ON THE BEHALF OF EACH MSCI BARRA PARTY, HEREBY EXPRESSLY DISCLAIMS ALLIMPLIED WARRANTIES (INCLUDING, WITHOUT LIMITATION, ANY IMPLIED WARRANTIES OF ORIGINALITY,
ACCURACY, TIMELINESS, NON-INFRINGEMENT, COMPLETENESS, MERCHANTABILITY AND FITNESS FOR A PARTICULAR PURPOSE) WITH RESPECT TO ANY OF THE INFORMATION.
Without limiting any of the foregoing and to the maximum extent permitted by law, in no event shall any of the MSCIBarra Parties have any liability regarding any of the Information for any direct, indirect, special, punitive,consequential (including lost profits) or any other damages even if notified of the possibility of such damages. The
foregoing shall not exclude or limit any liability that may not by applicable law be excluded or limited, includingwithout limitation (as applicable), any liability for death or personal injury to the extent that such injury results from thenegligence or wilful default of itself, its servants, agents or sub-contractors.
Any use of or access to products, services or information of MSCI or Barra or their subsidiaries requires a licensefrom MSCI or Barra, or their subsidiaries, as applicable. MSCI, Barra, MSCI Barra, EAFE, Aegis, Cosmos,BarraOne, and all other MSCI and Barra product names are the trademarks, registered trademarks, or service marksof MSCI, Barra or their affiliates, in the United States and other jurisdictions. The Global Industry ClassificationStandard (GICS) was developed by and is the exclusive property of MSCI and Standard & Poor’s. “Global IndustryClassification Standard (GICS)” is a service mark of MSCI and Standard & Poor’s.
© 2010 MSCI Barra. All rig hts r eserved.
Abo ut MSCI Bar ra
MSCI Barra is a leading provider of investment decision support tools to investment institutions worldwide. MSCI Barraproducts include indices and portfolio risk and performance analytics for use in managing equity, fixed income andmulti-asset class portfolios.
The company’s flagship products are the MSCI International Equity Indices, which include over 120,000 indices calculateddaily across more than 70 countries, and the Barra risk models and portfo lio analytics, which cover 59 equity and 48 fixedincome markets. MSCI Barra is headquartered in New York, with research and commercial offices around the world.