barr today, barr tomorrow -...
TRANSCRIPT

Barr Pharmaceuticals, Inc.
Annual Report 2005
Barr Today, Barr Tomorrow
Questions For and Answers By Bruce L. Downey, CEO

Years Ended June 30,
(Numbers in thousands, except per share data and employee data) 2005 2004
Results of Operations
Total Revenues $1,047,399 $1,309,088
Earnings
Earnings from Operations $ 316,027 $ 192,848
Net Earnings 214,988 123,103
Diluted Earnings per Share 2.03 1.15
Financial Position
Cash Flows from Operations $ 363,035 $ 258,099
Working Capital 780,386 670,601
Total Assets 1,482,846 1,333,269
Shareholders’ Equity 1,233,970 1,042,046
Statistics
Research and Development Expenditures $ 128,384 $ 168,995
Capital Expenditures $ 55,157 $ 46,907
Number of Employees 1,847 1,480
Weighted Average Number of Diluted Common
Shares Outstanding 106,052 106,661
Selected Financial Highlights
Restated to include historicalfinancial data of Duramed
Net Earnings$ in millions
01 02 03 0504
62.6
210.
3
167.
6
123.
1
215.
0
Adjusted to reflect stock splits;restated to include historicalfinancial data of Duramed
Earnings per Share$ per share
01 02 03 0504
0.63
2.06
1.62
1.15
2.03
Restated to include historicalfinancial data of Duramed
Shareholders’ Equity$ in millions
01 02 03 0504
416.
8
666.
5
868.
0 1,04
2.0 1,
234.
0
Restated to include historicalfinancial data of Duramed
Total Revenues$ in millions
01 02 03 0504
593.
2
1,18
9.0
902.
9
1,30
9.1
1,04
7.4

Barr Pharmaceuticals, Inc.Board of Directors
Carole S. Ben-Maimon, M.D.President and Chief Operating OfficerDuramed Research Inc.
Paul M. Bisaro, Esq.President and Chief Operating OfficerBarr Laboratories, Inc.
Harold N. ChefitzChairman of Notch Hill AdvisorsPresident of Chefitz Healthcare Advisors
Bruce L. Downey, Esq.Chairman and Chief Executive OfficerBarr Pharmaceuticals, Inc.
Richard R. FrankovicPharmaceutical Industry Consultant
James S. Gilmore, III, Esq.Partner, Kelley, Drye & Warren;Former Governor, Commonwealth of Virginia
Jacob M. KayPresident & Chief Operating Officer ofApotex, Inc.
Peter R. SeaverHealthcare Industry Consultant
George P. Stephan, Esq.Business ConsultantFormer Director of Kollmorgen Corporation
Management Team
Bruce L. Downey, Esq.Chairman and Chief Executive OfficerBarr Pharmaceuticals, Inc.
Paul M. Bisaro, Esq.Senior Vice President
Carole S. Ben-Maimon, M.D.Senior Vice President
Frederick J. Killion, Esq.Vice President, General Counsel and Secretary
William T. McKeeVice President, Chief Financial Officer andTreasurer
Barr Laboratories, Inc.A subsidiary of Barr Pharmaceuticals, Inc.
Management Team
Paul M. Bisaro, Esq.President and Chief Operating Officer
Salah U. Ahmed, Ph.D.Senior Vice President, Research and Development
Michael J. BogdaSenior Vice PresidentManufacturing and Engineering
Timothy P. CatlettSenior Vice President, Sales and Marketing
Catherine F. HigginsSenior Vice President, Human Resources
Frederick J. Killion, Esq.Senior Vice President, General Counseland Secretary
William T. McKeeSenior Vice PresidentChief Financial Officer and Treasurer
Christine Mundkur, Esq.Senior Vice PresidentQuality and Regulatory Counsel
Emad M. Alkhawam, Ph.D.Vice PresidentAnalytical Research and Development
Jay Bapna, P.E.Vice President, New York Manufacturingand Engineering
Carol A. CoxVice President, Investor Relations andCorporate Communications
Charles E. DiLiberti, M.S.Vice President of Scientific Affairs
Suzanne DonaghyVice President and Chief Information Officer
David J. FurnissVice President, Internal Audit
Phil GioiaVice President, Proprietary Sales
Jake HansenVice President, Government Affairs
J. Gregory JesterVice President and Corporate Controller
Daryl LeSueurVice President, Operations, Ohio Facility
Christopher Mengler, R.Ph.Vice President, Corporate Devlopment
Michael MoorsheadVice President and General Manager,Virginia Facility
Amy NiemannVice President, Proprietary Marketing
Timothy B. SawyerVice President, Sales for Generic Products
Robert WillifordVice President and General Manager,Ohio Facility
Duramed Research Inc.A subsidiary of Barr Pharmaceuticals, Inc.
Management Team
Carole S. Ben-Maimon, M.D.President and Chief Operating Officer
Lance J. Bronnenkant, Ph.D.Vice President of Research and Development,Operations
Howard I. HaitVice President, Data Management andBiostatistics
Wayne S. Mulcahy, Ph.D.Vice President, Clinical Operations
Shareholder InformationInvestor Relations DepartmentContact: Carol A. CoxVice President, Investor Relations andCorporate CommunicationsEmail: [email protected]: 1-800-BARRLABWebsite: www.barrlabs.com
Common StockCommon Stock is traded on the New YorkStock Exchange Symbol: BRL
Registrar and Transfer AgentMellon Investor ServicesP.O. Box 3315South Hackensack, NJ 07606-1915
Annual MeetingThe annual meeting of shareholders will beheld at 10 am on November 3, 2005 at theWoodcliff Lake Hilton, Tice Blvd., WoodcliffLake, NJ.
TrademarksBARR, barr (stylized), the stylized “b”,Duramed, DURAmed (stylized), “four dots”(stylized), “Shaping Women’s Health” (stylized)and the female symbol (stylized) are registeredtrademarks of Barr Pharmaceuticals, Inc. orrelated subsidiaries. APRI, AVIANE,AYGESTIN, BARR, CAMILA, CENESTIN,CRYSELLE, DIAMOX, DOXY-CAP, DOXY-TABS, DURADRIN, DURAMED, ENPRESSE,ERRIN, E.S.P., FEWER PERIODS. MOREPOSSIBILITIES., IT’S NOT TOO LATE TOPREVENT PREGNANCY, JUNEL, KARIVA,LESSINA, NORDETTE, NORTREL, PLAN B,PORTIA, PREFEST, PREVEN, PREVENT,REVIA, REVIA NALTREXONE HCL,SEASONALE, SHAPING WOMEN’S HEALTH,SPRINTEC, TRI-SPRINTEC, VIASPAN,WHEEL OF MENSTRUATION, ZEBETAand ZIAC are registered trademarks, andA.L.E.R.T., ARANELLE, CARE, CLARAVIS,CYPAT, ENJUVIA, FASLIQ, JUNEL FE,KELNOR, MAKING MEDICINES WORKFOR EVERYONE, NEVIS, OUTLOOKS &OPINIONS, SEASONEST, SEASONETTE,TREXALL and VELIVET are trademarks, ofBarr Pharmaceuticals, Inc. or related subsidiaries.LOESTRIN is a registered trademark andLOESTRIN FE is a trademark of WarnerChilcott, licensed for use by DuramedPharmaceuticals, Inc.
All other trademarks referenced herein are theproperty of their respective owners.
10-K Report AvailableThe Company’s 2005 Annual Report on Form10-K, filed with the Securities and ExchangeCommission is available via the Company’sweb site or by writing to the Investor RelationsDepartment at the Company’s headquarters.
® 2005 Barr Pharmaceuticals, Inc. All rights reserved.
Directory
Design: Arnold Saks Associates, NYC Photography: Bill Gallery Product Photography: Jim Barber Printing: PonyXPress Printing Services

1
Questions and Answers...
2005 Business Summary and Financial Performance
Q Please provide your assessment of the Company’s overall financial progress infiscal 2005.
Fiscal 2005 represented another strong year for Barr. Our investment in building avibrant proprietary products pipeline, the expansion of our generic oral contraceptiveproduct line, the addition of several important new generic products, and key businessdevelopment initiatives were among the highlights of the fiscal year.
On a GAAP basis, we reported fully diluted earnings per share of $2.03 for fiscal 2005,compared to $1.15 for fiscal 2004, on net earnings for fiscal 2005 of $215.0 million,compared to $123.1 million in fiscal 2004. Revenues for the year totaled $1.05 billion,compared to $1.31 billion in fiscal 2004. Excluding the approximate $0.37 per sharecharge related to a liability recorded in relation to a letter of intent signed in June 2005regarding a potential litigation settlement and product acquisition related to Organon’sMircette® oral contraceptive, detailed elsewhere in this report, adjusted net earnings forthe fiscal year ended June 30, 2005 were $254.3 million, or $2.40 per fully diluted share.
Strong proprietary product sales, up 91% year-over-year, were $279 million. Thisgrowth was driven by sales of our SEASONALE® extended-cycle oral contraceptiveproduct. We also reported margins of 70%, up from 51% a year ago. We ended thefiscal year with more than $363 million in operating cash flow.
While delivering sound results, we also continued to invest in new product develop-ment – generic and proprietary – and took the first steps into the new and untappedarena of biopharmaceutical products.
Bruce L. DowneyChairman and ChiefExecutive Officer
Barr Pharmaceuticals, Inc. (NYSE-BRL) is a holding companywhose principal subsidiaries, Barr Laboratories, Inc. and DuramedPharmaceuticals, Inc., develop, manufacture and market genericand proprietary pharmaceuticals. Generic products are sold underthe Barr label, while proprietary products are sold under theDuramed label. In a wide-ranging interview, Bruce L. Downey,Chairman and Chief Executive Officer, discussed the Company’sprogress during fiscal 2005, and its opportunities and challengesfor fiscal 2006 and beyond.

Q What do you consider Barr’s major accomplishments for the fiscal year?
In addition to our solid financial performance, we had a number of important achieve-ments across the company. In our generic business, we added two new oral contracep-tives to our product franchise: AranelleTM, the generic version of Watson Laboratories,Inc.’s Tri-Norinyl®-28 oral contraceptive; and KelnorTM, the generic version of Pfizer’sDemulen® 1/35-28 oral contraceptive. This brings to 22 the number of generic oral
contraceptive products we manufacture and market.We also added several generic products to our portfolio, most notably a generic
version of Bristol-Myers Squibb’s Videx® EC, which is used in combination withother antiretroviral agents for the treatment of HIV-1 infection in adults. TheU.S. Food & Drug Administration (FDA) granted expedited review of thisAbbreviated New Drug Application (ANDA) under the President’s EmergencyPlan for AIDS Relief and approved it approximately seven months after filing.
We also received approval for the generic version of Shire Pharmaceutical Group’sAgrylin® blood platelet treatment, and the generic version of Bristol-Myers Squibb’sGlucophage® XR diabetes treatment.
On the first day of fiscal 2006 we received FDA approval for the generic version ofFerring B.V.’s DDAVP® antidiuretic product. In February 2005, a District Court ruledthat the patent alleged to cover DDAVP is unenforceable and not infringed by ourproduct. The Court’s decision ended the 30-month stay and cleared the way for FDAapproval. It is important to note that the District Court’s decision has been appealed,and arguments could be heard later this fall. If we were to lose upon appeal, thecompany might be liable for damages. Because we were the first to file our patentchallenge, we received 180 days of marketing exclusivity and we launched our productimmediately. However, the July approval will transfer the financial benefits of thisproduct into the current fiscal year.
We also announced several agreements, key among them were the agreementsinvolving Kos Pharmaceuticals’ Niaspan® and Advicor ® cholesterol-lowering productsand an agreement with Cephalon, Inc. related to the ACTIQ® cancer pain managementtreatment.
The story in our proprietary products business was the continued growth of ourSEASONALE® extended-cycle oral contraceptive. We also filed our New DrugApplication for SEASONALE® Lo extended-cycle oral contraceptive and continue towork with the FDA to secure approval of SEASONIQUETM, our next generationextended-cycle oral contraceptive, which received an Approvable letter in August 2005.
In the area of biopharmaceuticals, we initiated and completed the Phase I clinicaltrials for the Adenovirus Vaccines Types 4 and 7 during fiscal 2005. We also enteredinto an agreement with PLIVA to develop the generic biopharmaceutical GranulocyteColony Stimulating Factor (G-CSF), the generic version of Amgen’s NEUPOGEN®
which is used in the treatment of neutropenia, which is low white blood cell count incancer patients.
I am proud of the progress we made across the businesses, and believe that theseactivities position us strongly for the future.
2
ExpandingGeneric PortfolioWe expanded our genericproduct portfolio, addingtreatments for AIDS,diabetes, blood platelets,and two additional oralcontraceptives - Kelnorand Aranelle.

3
“Like many women, I lead a hectic and fast-pacedlife. I commute daily to work in New York Citywhere I work for a major education company.I travel often, exercise routinely and have an activesocial life.
On the advice of myphysician, I began takingSEASONALE. I was excited to try thisnew option. SEASONALE has made my lifeeasier and I encourage other women to discusswith their healthcare practitioner whetherSEASONALE is right for them.”
Jill Pearson, SEASONALE Patient,Director of Professional Development
Choosing SEASONALE®

4
Generic Segment
Q What is the current status of your generic business?
During fiscal 2005, generic product sales contributed approximately $751 million. We cur-rently market 75 unique generic products, representing approximately 150 dosage forms.We are the only provider of nine of these products, and we are the leading supplier, interms of total prescriptions, for more than 50% of our generic products. Female healthcareis our single largest category, totaling 29 products, of which 22 are oral contraceptives.
Q Given the breadth of the Company’s generic oral contraceptive portfolio, is thiscategory maturing?
We are the leader in the oral contraceptive marketplace in the United States. Since welaunched our first oral contraceptive in 2001, we have developed and launched 21 addi-tional oral contraceptives. While we have been aggressively expanding our product line,additional competitors have entered the marketplace and as a result, we have experiencedlower pricing and lower volume. In addition, for many of these products, the genericsubstitution rates in this category have slowed due to many of our large customers maxi-mizing the opportunities for these products. However, we have gained market share oncertain products due to the addition of new customers. As a result, sales of our oral con-traceptives were down slightly in fiscal 2005 compared to the previous year. We anticipatethat sales from our portfolio of generic oral contraceptives will decline in fiscal 2006, asthese trends continue. However, we believe that our large portfolio of generic oral contra-ceptive products will remain a significant component of our total revenues.
Q How much of a role can we expect from the Company’s advance into differentdelivery technologies, and what progress has been made?
At the end of the year, we had approximately 10 products in various stages of devel-opment that utilize dosage forms other than our traditional solid oral tablet or capsuledelivery system, including transvaginal rings, patches, nasal sprays, ophthalmics andcreams. We have development and manufacturing partners for many of these products.Many of these projects will result in patent challenges while others will have variousother issues associated with their development and commercialization. We look for-ward to expanding into these dosage forms.
Q What other generic growth drivers, excluding patent challenges, are on thehorizon for fiscal 2006 and beyond?
At fiscal year-end, we had approximately 35 ANDAs, including tentatively approvedapplications, pending at the FDA. We have more than 40 generic projects in activedevelopment, more than 30 of which are in capsule and tablet dosage forms. We arecommitted to maintaining a full pipeline of generic products and we anticipate anongoing stream of approvals of new generic products in coming years.
DistributionOur Virginia distributioncenter shipped morethan 3.5 billion doses infiscal 2005, including ournew Kelnor and Aranelleoral contraceptives.

Q Barr has always pursued generic products with barriers to entry. How hasthis strategy evolved? How does it relate to new product development in the
generic business?
Developing generic products with barriers to entry remains a cornerstone of our R&Dactivities. These products tend to have a longer lifecycle and generate more value thangeneric products where multiple competitors enter the market simultaneously.
Naturally, our patent challenge activities represent an area where the barrier isintellectual property. Our initiatives in new drug delivery platforms and our businessdevelopment activities also have the potential to bring us additional products wherecompetition will be limited.
Q The Company has publicly stated that asignificant number of its pending ANDAs
represent patent challenge products. Doesthis represent a strength, or weakness, in Barr’sgeneric product selection criteria?
To date, we have publicly announced nine prod-ucts where we are actively challenging thepatents covering these products – includingAllegra® antihistamine products, Adderall® XRproducts for attention deficit and hyperactivitydisorder, and Provigil® treatment for narcolepsy.These nine products have current annual sales of
approximately $5 billion. During the year, we received tentative approvals for fiveapplications, which brings to nine the number of tentative approvals received forANDAs related to patent challenges.
We believe that our expertise in identifying and developing patent challenge candidates,our strength in successfully litigating or settling patent challenges, and our pipeline ofproducts that have intellectual property or patent issues, represent a distinct strength forthe company. As we move into the future, we expect that patent challenge products willrepresent an increasing percentage of our portfolio. Despite recent issues related to author-ized generics, our patent challenge strategy offers a significant growth opportunity for ourcompany, our shareholders, as well as the consumers who benefit when we are successfuland bring a generic product to market earlier than may otherwise have happened.
Q How do authorized generics impact the Hatch/Waxman 180-day incentive,and the strategy to invest in patent challenges?
Authorized generics undermine the 180-day exclusivity incentive that is integral to theHatch/Waxman patent challenge process. Because the “authorized” generic is not soldunder an ANDA, but under the brand pharmaceutical manufacturer’s original NDA,the courts have determined it may compete with the generic product during the 180-day exclusivity period.
Some analysts have estimated that authorized generics can reduce the value of apatent challenge to the generic challenger by as much as 40%. We will continue towork with Congress, the Department of Health and Human Services, and the genericindustry association to seek ways to limit the use of authorized generics.
5
QualityAssuranceMore than 375 peopleare committed toensuring that our phar-maceuticals meet thehighest levels of quality,safety and efficacy.

6
“Since its introduction in 1960, The Pill has evolvedin concert with women’s changing roles – fromdosing to delivery mechanisms and now – regimen.With the FDA approval of SEASONALE in 2003,women have the option to extend the timebetween periods.
While monthly menstruation is normal, physi-cians agree that a monthly period is not necessarywhile on oral contraceptives. When you’re on ThePill, you’re not really getting a menstrual period,
you are getting a Pill period caused by a lack ofhormone during the placebo week.
The evolution to extended-cycle regimens likeSEASONALE is an important progression of ThePill. Women’s evolving responsibilities, both personaland professional, create the need for advancementsin many aspects of their lives, including birth control.Tomorrow, only the future will tell.”
Dr. Nancy Roberson Jasper,Obstetrician and Gynecologist
Extended-Cycle OCs

Q Pricing in the generic industry appears to be a significant current issue. How isthe Company responding to this?
We focus our resources on those potential products that have barriers to entry thatlimit potential competition. In fact, we are the only provider of nine generic products inour portfolio, and are the leader in terms of market share on more than 50% of ourproducts. While barriers continue to include raw material sourcing and unique formu-lations, increasingly these barriers involve resolving highly complex issues related tointellectual property. Barr’s focus on products with barriers to entry is a key competi-tive advantage.
Proprietary Products
Q Some have termed 2005 Barr’s breakout year in terms of proprietary products.Do you agree with this assessment?
We are excited about the progress we have made in growing our proprietarybusiness. Less than six years after initiating activities in this area, we have a growingproprietary products business with significant future potential.
We currently have 13 proprietary products on the market, five of which we activelydetail to physicians. We have four proprietary product applications pending at theFDA and seven in clinical development, one of which is in Phase III studies. We arecommitted to consolidating our leadership position in women’s healthcare, as well aspursuing additional therapeutic categories. Our pipeline includes products in femalehealthcare, including oral contraceptives, hormone therapy and our transvaginal ringtechnology products; oncology; urology; and anti-infective/anti-viral products.
Our SEASONALE extended-cycle oral contraceptive, which created an entirely newcategory when launched in October 2003, continues to gain marketacceptance. Since launch, nearly 1 million prescriptions have been filled.
We will expand this product franchise following the approval of ourSEASONIQUE product and are working with the FDA regarding issues
raised in the Approvable letter. We have also filed a NDAfor the SEASONALE Lo (levonorgestrel/ethinyl estradioltablets 0.1 mg/0.02 mg and ethinyl estradiol tablets)extended-cycle oral contraceptive.
In the area of hormone therapy, we are building a fullline of tablet strengths for our EnjuviaTM (Synthetic
Conjugated Estrogens, B) product. Enjuvia is a plant-derived,synthetic conjugated estrogen product that contains a blend of the ten
estrogenic substances found in the brand Premarin®. This year, the FDA approved ourapplication for the 0.3 mg and 0.45 mg tablets and had previously approved our0.625 mg and 1.25 mg tablets. We are awaiting the approval of the 0.9 mg tabletstrength. Although we were disappointed with the FDA’s Not Approvable letter, whichwe received in April 2005, for our application for our BijuvaTM (Synthetic ConjugatedEstrogens, A) vaginal cream, we continue to work closely with the Agency and we areconfident the outstanding issues can be resolved. Bijuva, if approved, is intended as alocal treatment for vaginal atrophy.
7
Commitmentto FemaleHealthcareWe are committed toleadership in femalehealthcare, includingproprietary oral contra-ceptives and hormonetherapy products.

Q With the introduction of Enjuvia, Barr will be marketing both syntheticconjugated estrogen products – Cenestin® and Enjuvia. What do you see for
the potential for this product franchise, now that we are several years out fromthe Women’s Health Initiative (WHI) study?
While there has been a reduction in the number of women using estrogen replacementtherapy following the publicity surrounding the WHI study, hormone therapy remainsa nearly $2 billion a year market.
We believe that hormone therapy is appropriate for addressing issues associatedwith menopause, and believe that women, in consultation with their physicians, arelooking to these products for shorter terms of usage, and looking for a full range ofdosages in order to select the lowest appropriate dose. Once Enjuvia is launched,women will have two synthetic conjugated estrogen options, Enjuvia and Cenestin,from our company.
Q The Company has spent considerable time and resources in seekingapproval to bring Plan B® Over-The-Counter (OTC). Why?
Plan B meets a significant unmet medical need by providing women with asafe and effective contraceptive option when used within 72 hours of a contra-ceptive failure or incident of unprotected intercourse. As part of our overallcommitment to women’s healthcare, we are committed to enhancing the
availability of emergency contraception for those who would choose to use it.If Plan B were available in a more timely fashion, we believe that more than 70%
of the unintended pregnancies that occur each year could be eliminated. Havingto get a doctor’s prescription can delay timely access, and that is why we continue to
pursue our application with the FDA to make this product available over-the-counter.Although the FDA again deferred a decision on our OTC application in August
of this year, we will continue to work with the Agency to answer their outstandingquestions. While we believe that this recent delay is not justified, we will use theopportunity presented by the FDA’s public comment proceedings to continue to pressfor approval of Plan B as an OTC product. In the meantime, we will continue tomarket Plan B as a prescription drug, and to work to increase consumer and health-care provider awareness. We will also continue to work with states interested in joiningthe seven that already make Plan B available through pharmacy access programs.
Q Looking at the Company’s proprietary pipeline, can you provide an update ofother pipeline products?
While the timing of our pipeline of proprietary products is confidential, we have pro-vided information on the status of our extended-cycle oral contraceptives; our CyPatTM
treatment for the symptoms associated with treatment of prostate cancer; our urinaryincontinence product utilizing our transvaginal ring technology which offers thepotential to deliver higher doses of oxybutynin to the bladder neck with much lowersystemic exposure; and our Adenovirus Vaccine project. A number of other productsare in various stages of development, and will be announced as the applications reachdevelopment milestones.
8
Need forTimely Accessto EmergencyContraceptionTo be most effective inpreventing pregnancyfollowing unprotectedintercourse or contra-ceptive failure, Plan Bneeds to be taken assoon as possible within72 hours.

9
Q Is the Company’s sales force adequately staffed to appropriately detail Barr’sproduct pipeline?
Our 250-person Duramed Pharmaceuticals’ Women’s Healthcare Sales Force currentlypromotes our SEASONALE extended-cycle oral contraceptive product, our Cenestinhormone therapy products and Plan B emergency contraceptive product to femalehealthcare practitioners.
This sales force will market additional female healthcare products, such asSEASONIQUE and SEASONALE Lo if approved. We also expect that as new femalehealthcare products are developed, or acquired, we will add them, where appropriate,to the portfolio of products presented by this team.
Our 43-person Duramed Specialty Sales Force promotes our TrexallTM productdirectly to rheumatologists and dermatologists. As a result of our co-promotionagreement with Kos Pharmaceuticals, Inc., this team also promotes the Niaspan andAdvicor cholesterol treatments to obstetricians, gynecologists and other practitionerswith a focus on women’s healthcare. Additionally, they will communicate the benefitsof extended-cycle contraceptives to this physician audience. We expect to use thissales force to promote additional products as we develop or acquire them.
Q Supporting proprietary products requires a considerable investment inmarketing. Can you discuss the Company’s physician, professional and
Direct-to-Consumer (DTC) marketing initiatives?
Our Women’s Healthcare Sales Force details SEASONALE and other female healthcareproducts directly to more than 40,000 healthcare providers who we have determinedare among the most productive prescribers of oral contraceptive products in theUnited States. SEASONALE is the first extended-cycle oral contraceptive, and withits launch, we created an entirely new product category. As a result, education is asignificant component of our detailing activities.
Marketing support includes professional education materials, published data fromour clinical studies demonstrating the safety and efficacy of the extended-cycle concept,and product sampling kits that contain extensive information for patients. Wereinforce our detailing activities with a trade advertising program in leading medicaljournals and a DTC advertising campaign.
Q How do you view the newopportunity to detail Niaspan and
Advicor?
We are very excited about the opportu-nities that resulted from our agreementswith Kos Pharmaceuticals. Kos will payroyalties calculated as a percentage of thesales of the products, subject to certainmaximum sales levels. Our sales team willfocus on a new population of obstetri-cians, gynecologists and other practitionerswho have a focus on women’s healthcare.
Focused ProductDetailingOur 250-person Women’sHealthcare Sales Forcetakes the message of ourunique products directlyto more than 40,000physicians.

10
As the role of these physicians expands, particularly OB/GYNs who increasinglyserve as a primary physician for many women, they will become more central toaddressing the total health needs for many women. Many of these physicians have notpreviously been detailed about these cholesterol-lowering products.
Biopharmaceuticals
Q Barr has emphasized its entrance into biopharmaceuticals through theAdenovirus Project and the agreement with PLIVA on G-CSF. What is the
status of these projects?
We are very excited about both of these projects. The Adenovirus project, which isbeing completed under contract with the U.S. Department of Defense (DOD), providesus with experience in developing, seeking approval of and manufacturing a biophar-maceutical product. Once approved, we will supply this vaccine to the U.S. armedforces.
The agreement with PLIVA represents a major step in the development of ourgeneric biopharmaceuticals capabilities. In partnership with PLIVA, we intend todevelop and seek approval to market a generic version of Amgen’s NEUPOGEN®
(filgrastim) product in the United States and Canada. NEUPOGEN is primarilyindicated for the regulation of white blood cell production in the treatment of cancerpatients with chemotherapy-induced neutropenia.
Q Biopharmaceuticals have been described as the new frontier for genericcompanies. Why?
There is an urgent need for Congress and the FDA to define an abbreviated pathwayfor the approval of generic versions of biopharmaceuticals. Sales for biopharmaceuti-cals last year were approximately $30 billion and analysts expect this to grow to $60billion by the end of the decade. Biopharmaceuticals are an ever-increasing componentof overall prescription drug spending, and a significant contributor to escalating costs.
As the number of biologics products in America’s medicine cabinets increases, with-out a pathway for generic competition, the price of these products will remain artifi-cially high. Creating a process for the approval of generic versions of biopharmaceuticalswill unleash a flood of significant additional savings for consumers.
It is difficult to predict when a regulatory process will be defined. However, we areaggressively taking the steps necessary to position ourselves as a pioneer and ultimateleader in this potential market.

Adenovirus Vaccines Types 4 and 7 are beingdeveloped under a $42.3 million, six-year contractwith the United States Department of Defense(DOD) to meet a significant unmet medical needfor our Armed Forces. The Adenovirus Vaccines areintended to be dispensed to Armed Forces recruitsto prevent epidemics of an acute respiratorydisease that has been a leading cause of hospitaliza-tions of military trainees. Adenovirus Types 4 and 7can cause contagious illnesses that spread quicklyin settings of close quarters, especially those found
in military bar-racks. Recoverycan take as long as two weeks, which costs theDOD millions of dollars in treatment and lostrecruit training days.
In July 2003, Barr completed construction ofits Adenovirus Vaccine manufacturing and packagingfacility, a 20,000 square-foot building locatedon Barr’s Forest, Virginia campus, that is designedspecifically to produce these vaccines.
Helping Our Armed Forces
11

12
Investing in R & D$ millions invested
01 02 03 0504
57.6
75.7 91
.2
169.
0
128.
4
Restated to include historicalfinancial data of Duramed
Other Corporate Activities
R&D
Q The Company continues to invest heavily in new product development. How isthe money spent?
We continue to increase our investment in both generic and proprietary product develop-ment activities. Our increased investment in generic R&D is driven by the overall numberof generic products in development, as well as higher costs for bioequivalence studiesrelated to the development of products based on new delivery technologies outside ourtraditional focus on tablet/capsule products. Our increased investment in proprietaryproduct development is largely associated with the clinical trials required to provide thedata necessary to support approval of these products. In addition, we continue toexpand the human resources necessary to support both product development functions.We will continue to invest at the levels necessary to achieve our commitment to researchand development during fiscal 2006.
Q Are the levels of R&D spending adequate to support the product developmentnecessary to drive earnings?
We have always stated that we would invest what is necessary to support the growthof our business, even if it was at the expense of short-term earnings results. And wecontinue to increase our annual investment in R&D as necessary to fund these activities.I believe that we have invested what is necessary to ensure a stream of new productintroductions across the business and we will continue to invest what is necessary tomaintain our internal timelines on the development and introduction of new products.
Q The Company has had to build a proprietary development function. Are youhappy with the results to date?
We are very happy with the performance of our proprietary R&D team and ourmarketing teams, and with physician and consumer response to our products. Today,our proprietary products team totals more than 90 people with extensive brand prod-uct experience in the areas of clinical trials, toxicology, regulatory, pharmacokinetics,statistics, medical writing and product commercialization.
Business Development
Q Barr has entered into several business development agreements during fiscal2005. Can you provide some context for the ventures announced this year?
Our business development activities are focused on identifying and executinginitiatives that will strengthen our product portfolio, and include strategic productacquisitions, new technology arrangements including new technology platforms,and corporate mergers and acquisitions.

13
During fiscal 2005, we executed four key business development initiatives, includ-ing the agreements with Kos Pharmaceuticals, PLIVA and Cephalon that I havealready discussed. We also completed an agreement with King Pharmaceuticals, Inc.for exclusive rights in the U.S. for Nordette® oral contraceptive and Prefest® hormonetherapy.
In addition to these developments, we completed the integration of our 250-personDuramed Pharmaceuticals’ Women’s Healthcare Sales Force, and exercised ouroption to make a one-time royalty payment of $19 million to Eastern VirginiaMedical School (EVMS) related to the SEASONALE extended-cycle oral contracep-tive. We also established a $175 million, five-year, senior unsecured revolving creditfacility that will be used for working capital, capital expenditures, acquisitions andother general corporate purposes.
All of these activities meet our objectives of providing additional opportunities forlong-term growth and expansion of our business.
Q Barr’s corporate development activities have added several proprietaryproducts to the Company’s portfolio in recent years. Are these strategic
targets, or targets of opportunity?
Both, actually. Some proprietary products have been added to our portfolio as a resultof agreements that resulted in the settlement of ongoing legal matters. But we areclearly focused on leadership in proprietary female healthcare products, as well ascreating the opportunity to expand into additional therapeutic categories, and businessdevelopment activities are focused on this goal.
Capital Investment
Q Barr continues to invest in capitalexpansion and growth. What is your
strategy in making these investments?
Barr is committed to continuouslyinvesting in facilities to ensure ourleadership as a specialty pharmaceuticalcompany. During fiscal 2005, we contin-ued implementation of our company-wide enterprise resource planning (ERP)system, which will cost approximately$70 million. This system is designed to
allow us to more efficiently manage corporate activities and manage diverse productlines; integrate mergers and acquisitions; and support potential future internationaloperations. The flexibility of this system, and our ability to add new functionality asour business evolves, makes it a critical component of managing growth. Currently,our ERP system is scheduled to be implemented utilizing a phased approach beginningin October 2005. To ensure this project is implemented in a timely fashion and onbudget, we have dedicated approximately 40 full-time employees to the project, alongwith third-party consultants.
ManufacturingExpertiseWe specialize in manu-facturing products thatrequire unique facilities,processes or expertise;and are committed tomaking significant invest-ments in plant andequipment to give us acompetitive edge.

14
We also invested in plant and equipment to increase our production, laboratory,warehouse and distribution capacity. At the end of the fiscal year, we announced plansto invest an additional $15 million at our Forest, Virginia facility. We will continue toinvest in those capabilities necessary to ensure we can meet the expected demand ofour pipeline products and to handle increases in current product sales.
Management
Q Barr has always prided itself on the depth of its management expertise and itsfocus on results. How do you retain this focus as the Company grows larger,
in terms of revenues, products and people?
There is no magic to retaining focus, regardless of the size of an organization. Thechallenge is in communication. Our management team works to ensure that everymember of the Barr team understands their role in achieving our objectives, in meetingdeadlines in a timely fashion, and in ensuring that we maximize the use of availableresources. In addition, we recruit and retain the best, most highly skilled people in thepharmaceutical industry. It is the skills and commitment of our management, and ourpeople, that ensures we remain focused on meeting our objectives.
Q Corporate governance compliance remains in the news. What is the status ofBarr’s activities on these issues?
We are committed to achieving compliance with all applicable securities laws andregulations, accounting standards, controls and audit practices. We have implementedall corporate governance requirements and we will continue to focus on corporategovernance on an ongoing basis. We have posted our committee composition, charters,code of conduct, our corporate governance principles, and information related toreporting of concerns about questionable accounting practices on our website.
We have established a process whereby any person may submit a good faith com-plaint, report or concern regarding accounting or auditing matters relating to Barr.Our Audit Committee has established procedures for the receipt, retention and treat-ment of complaints and potential violations of applicable laws, rules and regulationsof the company’s accounting policies and procedures. Any person may report theirconcerns on a confidential and anonymous basis by calling an independent, toll-freehotline at 1-877-357-2572. We have retained a third-party provider to accept, verifyand log all calls received on the Ethics Line and established a process for this third-party provider to notify our General Counsel, who will log the call and advise theChairman of the Audit Committee of the call.
These compliance activities occupy substantial management and board attention,and we are committed to full compliance.
ResearchLast year we invested$128.4 million in genericand proprietary productdevelopment, to ensurea steady stream of newproduct approvals.

Alternative for the Treatment of AIDS
15
In December 2004, the FDA approved Barr’s appli-cation to market a generic version of Bristol-MyersSquibb’s Videx® EC (Didanosine) Delayed-releaseCapsules, following expedited review underthe President’s Emergency Plan for AIDS Relief(PEPFAR). The product was part of a patentchallenge. Barr was the first to file its application,and received 180 days of exclusivity.
Videx® EC, usedin combination withother antiretroviralagents, is indicated for thetreatment of HIV-1 infectionin adults. Expedited approval of this importantmedicine in the fight against AIDS enabled Barr tobring a more cost-effective version to patients.HIV-1 is the major cause of AIDS in the world, andit is estimated that more than 40 million people areinfected worldwide.
16
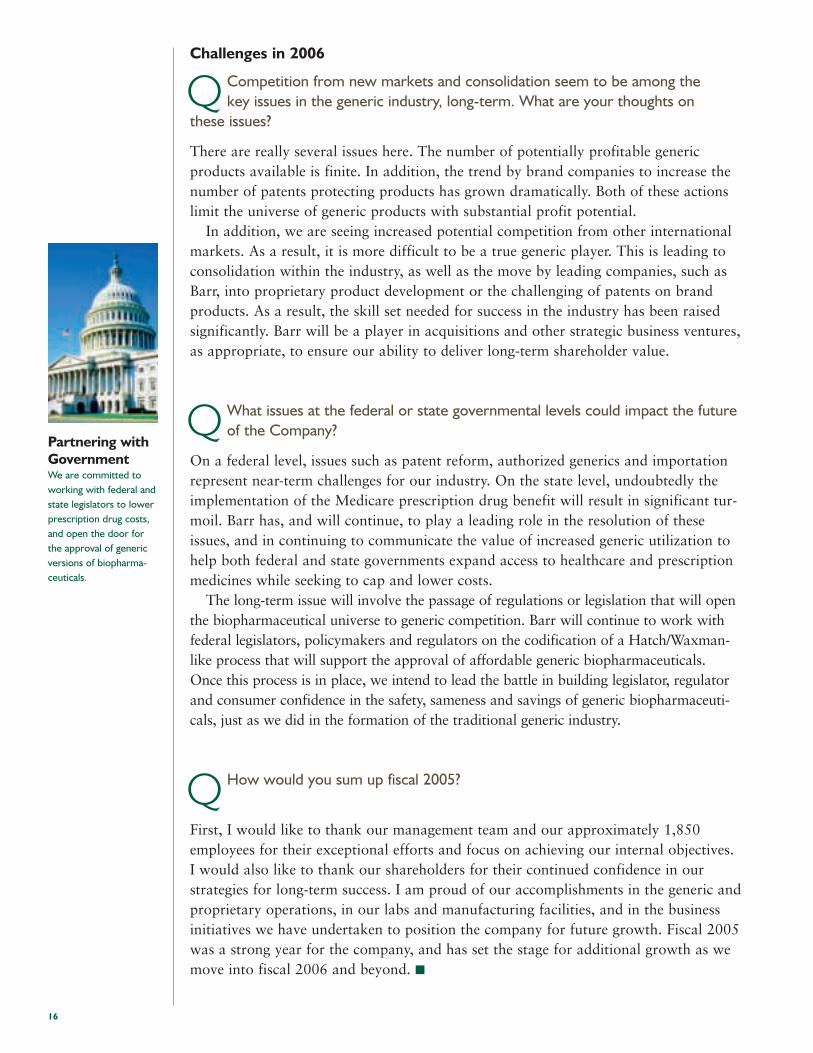
Challenges in 2006
Q Competition from new markets and consolidation seem to be among thekey issues in the generic industry, long-term. What are your thoughts on
these issues?
There are really several issues here. The number of potentially profitable genericproducts available is finite. In addition, the trend by brand companies to increase thenumber of patents protecting products has grown dramatically. Both of these actionslimit the universe of generic products with substantial profit potential.
In addition, we are seeing increased potential competition from other internationalmarkets. As a result, it is more difficult to be a true generic player. This is leading toconsolidation within the industry, as well as the move by leading companies, such asBarr, into proprietary product development or the challenging of patents on brandproducts. As a result, the skill set needed for success in the industry has been raisedsignificantly. Barr will be a player in acquisitions and other strategic business ventures,as appropriate, to ensure our ability to deliver long-term shareholder value.
Q What issues at the federal or state governmental levels could impact the futureof the Company?
On a federal level, issues such as patent reform, authorized generics and importationrepresent near-term challenges for our industry. On the state level, undoubtedly theimplementation of the Medicare prescription drug benefit will result in significant tur-moil. Barr has, and will continue, to play a leading role in the resolution of theseissues, and in continuing to communicate the value of increased generic utilization tohelp both federal and state governments expand access to healthcare and prescriptionmedicines while seeking to cap and lower costs.
The long-term issue will involve the passage of regulations or legislation that will openthe biopharmaceutical universe to generic competition. Barr will continue to work withfederal legislators, policymakers and regulators on the codification of a Hatch/Waxman-like process that will support the approval of affordable generic biopharmaceuticals.Once this process is in place, we intend to lead the battle in building legislator, regulatorand consumer confidence in the safety, sameness and savings of generic biopharmaceuti-cals, just as we did in the formation of the traditional generic industry.
Q How would you sum up fiscal 2005?
First, I would like to thank our management team and our approximately 1,850employees for their exceptional efforts and focus on achieving our internal objectives.I would also like to thank our shareholders for their continued confidence in ourstrategies for long-term success. I am proud of our accomplishments in the generic andproprietary operations, in our labs and manufacturing facilities, and in the businessinitiatives we have undertaken to position the company for future growth. Fiscal 2005was a strong year for the company, and has set the stage for additional growth as wemove into fiscal 2006 and beyond. ■
Partnering withGovernmentWe are committed toworking with federal andstate legislators to lowerprescription drug costs,and open the door forthe approval of genericversions of biopharma-ceuticals.

17
18 Management’s Discussion and Analysis of Financial Conditionand Results of Operations
33 Consolidated Balance Sheets
34 Consolidated Statements of Operations
35 Consolidated Statements of Shareholders’ Equity
36 Consolidated Statements of Cash Flows
37 Notes to the Consolidated Financial Statements
54 Report of Independent Registered Public Accounting Firm
55 Management’s Report on Internal Control Over Financial Reporting
55 Selected Financial Data
56 Reconciliation of GAAP EPS to Adjusted EPS for the Fiscal YearsEnded June 30, 2005 and 2004
57 Board of Directors
57 Management Team
57 General Shareholders’ Information
Financial Review

18
Executive Overview
We are a specialty pharmaceutical company that develops,markets and sells both generic and proprietary (or branded)pharmaceutical products. We have a deep, diverse andprofitable generic product portfolio, and have diversified ouroperations by developing and acquiring several proprietaryproducts. Sales of generic products accounted for 73% of ourproduct sales in fiscal 2005, while sales of our proprietaryproducts grew from $57.7 million in fiscal 2003, accountingfor just 6% of our product sales that year, to $278.8 millionin fiscal 2005, accounting for 27% of product sales.
Generic ProductsFor many years, we have successfully utilized a strategy ofdeveloping the generic versions of branded products thatpossess some combination of unique factors that we believehave the effect of limiting competition for generics. Suchfactors include difficult formulation, complex and costlymanufacturing requirements or limited raw material avail-ability. To date, our strategy has focused on developing solidoral dosage forms of products. By targeting products withsome combination of these unique factors, we believe thatour generic products will, in general, be less affected by theintense and rapid pricing pressure often associated with morecommodity-type generic products. As a result of this focusedstrategy, we have been able to successfully identify, developand market generic products that generally have few com-petitors or that are able to enjoy longer periods of limitedcompetition and thus generate profit margins higher thanthose often associated with commodity-type generic products.The development and launch of our generic oral contracep-tive products is an example of our generic developmentstrategy. While we believe there are more tablet and capsuleproducts that may fit our “barrier-to-entry” criteria, werecognize that finding highly profitable generic tablet andcapsule products that will grow our generics business isdifficult. As a result, we have recently expanded our develop-ment resources to include non-tablet and capsule products(such as patches, sterile ophthalmics and nasal sprays).
Challenging the patents covering certain brand productscontinues to be an important component of our genericstrategy. For many products, the patent provides the uniquebarrier that we seek to identify in our product selectionprocess. We try to be the first company to initiate a patentchallenge because in certain cases, we may be able to obtain180 days of exclusivity for selling the generic version of theproduct. For example, this occurred with fluoxetine, ourgeneric version of Eli Lilly’s Prozac®. If we do receive exclu-
sivity for a product, we typically experience significant rev-enues and profitability associated with that product for thesix-month exclusivity period, but at the end of that periodexperience significant decreases in our revenues and marketshare associated with the product as other generic competi-tors enter the market. This happened with our fluoxetineproduct after expiration of our generic exclusivity period.Our record of successfully resolving patent challenges hascontributed to our growth, but has created periods of rev-enue and earnings volatility and will likely do so in thefuture. While earnings and cash flow volatility may resultfrom the launch of products subject to patent challenges, weremain committed to this part of our business.
Macroeconomic factors also continue to favor the use ofgeneric pharmaceutical products. The aging population, ris-ing health care costs and the vigilance of health careproviders, insurance companies and others to lower suchcosts have helped drive an increase in the substitution oflower-cost generic products for higher-cost brand products.As evidence of this, the percentage of overall prescriptionsfilled with generic products grew from 43% in 2000 to 53%by 2004, and is predicted to continue to rise in the future.
Proprietary ProductsTo help diversify our existing revenue base and to providefor additional long-term opportunities, we initiated a pro-gram more than five years ago to develop and market propri-etary pharmaceutical products. We formalized this programin 2001 by establishing Duramed Research. Today we have asubstantial number of employees dedicated to the develop-ment and marketing of our proprietary products includingapproximately 300 sales representatives that promote directlyto physicians four of our products and two products relatedto the Co-Promotion Agreement with Kos Pharmaceuticals.In addition, we sell but do not actively market seven otherproprietary products.
Growth in proprietary product sales over the last threefiscal years has been accomplished through productacquisitions and through higher sales of our first internally-developed proprietary product, SEASONALE®.
CompetitionOne of our greatest challenges is continuing to stay ahead ofthe competition, both for generic and proprietary products.Our successful generic product strategy has attracted newcompetitors seeking to launch competing generic productsas well as to be “first to file” for potentially lucrative patentchallenges. For example, other generic pharmaceuticalcompanies have recently started developing and marketingcompeting generic oral contraceptives in order to capturesome of our market share. In addition, there has been anincrease in the number of competitors in the generic industry
Management’s Discussion and Analysis of Financial Conditionand Results of Operations (dollars in millions)

19
that are based outside U.S., with several of such competitorsbased in India. Many of these companies claim to have equiva-lent technological capabilities to U.S.-based generic companiesbut at significant cost advantages over their U.S. counterparts.
Also, as a detriment to the value of the patent challengestrategy of Barr and other leading generic manufacturers,brand pharmaceutical companies continue to partner with cer-tain generic drug companies to license a so-called “authorizedgeneric” to the generic drug company. The use of authorizedgenerics by certain brand and generic companies underminesthe value of the 180 day exclusivity period enjoyed by the firstcompany to file an ANDA containing a Paragraph IV certifica-tion by providing another company with the ability to havethe generic product on the market at the same time.
Finally, as our proprietary pharmaceutical products grow,we anticipate that competing generic pharmaceutical compa-nies will challenge the patents protecting our branded prod-ucts. For example, one of our competitors, Watson, has fileda Paragraph IV certification challenging the patent onSEASONALE.
To address these and other challenges, we continue to (1)invest aggressively in research and development, (2) developand launch new generic and proprietary products and (3)maintain an active acquisition and licensing effort to comple-ment our internal development activities.
Comparison of the fiscal years ended June 30, 2005and June 30, 2004
The following table sets forth revenue data for the fiscal yearsended June 30, 2005 and 2004:
Change
($’s in millions) 2005 2004 $ %
Generic products:
Distributed alternative
brands:(1) $ – $ 385.3 $(385.3) -100%
Oral contraceptives 396.6 403.9 (7.3) -2%
Other generic(2) 354.8 361.4 (6.6) -2%
Total generic products 751.4 1,150.6 (399.2) -35%
Proprietary products 278.8 146.1 132.7 91%
Total product sales 1,030.2 1,296.7 (266.5) -21%
Alliance, development
and other revenue 17.2 12.4 4.8 39%
Total revenues $1,047.4 $1,309.1 $(261.7) -20%
(1)Reflects sales of Ciprofloxacin sold during Bayer’s pediatric exclusivityperiod which ended on June 9, 2004.
(2)Includes sales of Ciprofloxacin after June 9, 2004.
Revenues – Product Sales
Product sales for the year ended June 30, 2005 decreasedas compared to the prior year primarily due to the expecteddecline in sales of our distributed version of Ciprofloxacin,as discussed in detail below. Partially offsetting the decreasein Ciprofloxacin sales was a significant increase in sales ofour proprietary products.
Generic ProductsDistributed Alternative Brands (Ciprofloxacin)On June 9, 2003 we began distributing Ciprofloxacinhydrochloride tablets and oral suspension pursuant to alicense from Bayer Corporation obtained under a 1997settlement of a patent challenge we initiated regardingBayer’s Cipro® antibiotic. In September 2003, we entered intoan amended supply agreement with Bayer that enabled usto distribute Ciprofloxacin during and after Bayer’s periodof pediatric exclusivity, which ended on June 9, 2004. As aresult of the exclusivity we enjoyed, Ciprofloxacin was ourlargest selling product in fiscal 2004. We have shared andcontinued to share one-half of our profits, as defined, fromthe sale of Ciprofloxacin with Aventis, the contractual succes-sor to our partner in the Cipro patent challenge case. Uponexpiration of Bayer’s period of pediatric exclusivity on June9, 2004, as expected, several other competing Ciprofloxacinproducts were launched. As a result of the flood of compet-ing products, our market share and product pricing declineddramatically for Ciprofloxacin almost immediately. Sincethe expiration of the exclusivity period, we have includedsales of Ciprofloxacin in the “Other generic” line item in thetable above. Such sales were not significant for fiscal 2005.
Oral ContraceptivesSales of our generic oral contraceptive products decreased2% in fiscal 2005 compared to fiscal 2004. Price declines andlower volumes resulting from additional competitors reducedsales on certain of our products, mainly Apri and Aviane,and a slowdown in the growth rate of generic substitutionmore than offset (1) full year contributions from productslaunched during fiscal 2004, (2) two new products launchedin fiscal 2005 and (3) market share gains on other existingproducts.
Oral contraceptives are the most common method ofreversible birth control, used by up to 82% of women in theUnited States at some time during their reproductive years.Oral contraceptives have a long history with widespread useattributed to many factors including efficacy in preventingpregnancy, safety and simplicity in initiation and discontinua-tion, medical benefits and relatively low incidence of sideeffects. From fiscal 2002 to fiscal 2004, sales of our genericoral contraceptive products more than quadrupled. This

20
growth was fueled by new product launches, the addition ofnew customers and by increasing rates of generic substitu-tion. We currently manufacture and market 22 generic oralcontraceptive products under trade names, two of which welaunched during the fiscal year ended June 30, 2005. Thisportfolio now represents nearly all oral contraceptives thatare eligible for generics. Additionally, the growth in genericsubstitution rates for this heavily genericized portfolio ofproducts slowed, even as we continued to gain market shareon certain products within the portfolio. We anticipate thatthese trends will continue in fiscal 2006 as competitorslaunch new products and as the portfolio continues to expe-rience a slowing of overall growth in generic substitution.However, despite our expectation that sales of our genericoral contraceptive portfolio will decline in fiscal 2006 versusfiscal 2005, we believe that we are well positioned to main-tain market share for many of our products and that ourportfolio of oral contraceptives will continue to be a signifi-cant component of our revenues in fiscal 2006.
Generic Products – OtherSales of other generic products decreased 2% in fiscal2005 as compared to the prior year period, as sales fromnew products launched since the end of last year, includingDidanosine and Metformin XR 750mg, were more thanoffset by declines in other existing product sales. The declinein other existing product sales was primarily due to a signifi-cant decrease in sales of our Dextroamphetamine groupof products due to both declining volumes and lower pricescaused by the launch of competing versions in late 2004. InApril 2005, our generic exclusivity period on Metformin XR750mg ended and several other generic companies launchedcompeting versions of the product. As a result, we experi-enced a significant decline in sales of Metformin XR 750mgand would expect that decline to continue during fiscal 2006.However, we expect that higher sales of Didanosine andsales from our generic version of DDAVP, which we launchedin July 2005, will more than offset these declines leading tohigher sales of our other generic products in fiscal 2006.
Proprietary ProductsSales of our proprietary products almost doubled in fiscal2005 as compared to the prior year. This increase relatesprimarily to: (1) higher sales of SEASONALE, which totaled$87.2 million for the fiscal year, reflecting higher unit sales insupport of prescription growth and higher pricing comparedto last year; (2) full year sales of Loestrin/Loestrin Fe andPlan B which we acquired in February 2004 and March2004, respectively; and (3) sales of Nordette and Prefest,which we acquired in November 2004 and December 2004,respectively.
SEASONALE prescriptions, according to IMS data,topped 800,000 for our fiscal year ended June 30, 2005, a370% increase over prescriptions in the prior fiscal year. Thisincrease is a direct result of our significant marketing initia-tives, including direct-to-consumer advertising and the detail-ing efforts by our Women’s Healthcare Sales force. Whilewe look for growth in fiscal 2006 for SEASONALE prescrip-tions and sales, we expect much lower growth rates thanthose achieved in fiscal 2005.
We have been active in acquiring proprietary productsover the last two fiscal years and the contribution fromthose products has increased our proprietary revenues sub-stantially over that period. Certain of the products whichwe have acquired no longer enjoy patent protection and areexperiencing declining prescription volumes. As a result,while these products are expected to still generate healthymargins and predictable cash flows, we do not expect themto generate the year-over-year sales growth we experienced infiscal 2005. In fact, some may show year-over-year decreasesin sales. As a result, growth in our proprietary productsales in fiscal 2006 will be mainly dependent on growth inSEASONALE, Cenestin and Plan B, and the launch of ourEnjuvia product during the second half of fiscal 2006.
Cost of Sales
Our cost of sales includes the cost of products we purchasefrom third parties, our manufacturing and packaging costsfor products we manufacture, profit sharing or royalty pay-ments made to third parties, including raw material suppliersand any changes to our inventory reserve. Amortization costsarising from the acquisition of product rights and our distri-bution costs are included in selling, general and administra-tive costs.
Product mix plays a significant role in our quarterly andannual overall gross margin percentage. In the past, our over-all gross margins have been negatively impacted by sales oflower-margin distributed versions of products such asCiprofloxacin and Tamoxifen, which were manufactured forus by brand companies and distributed by us under the termsof the respective patent challenge settlement arrangements.
The following table sets forth cost of sales data in dollarsas well as the resulting gross margins, for the two yearsended June 30, 2005 and 2004:
Change
($’s in millions) 2005 2004 $ %
Generic products $264.8 $604.6 $(339.8) -56%
Gross margin 65% 47%
Proprietary products $ 39.3 $ 28.1 $ 11.2 40%
Gross margin 86% 81%
Total cost of sales $304.1 $632.7 $(328.6) -52%
Gross margin 70% 51%
21
The decrease in total cost of sales, on a dollar basis, forthe year ended June 30, 2005, as compared to the prior year,was primarily due to the year-over-year decrease in sales ofCiprofloxacin, which in the prior year we had purchasedfrom Bayer.
Margins on our generic products increased significantlyin fiscal 2005 due mainly to the decrease in year-over-yeardistributed Ciprofloxacin sales. As a distributed product forwhich we shared the profits with our partner in the Cipropatent challenge, Ciprofloxacin had a higher cost of sales anda lower margin than our other products.
Margins on our proprietary products increased in fiscal2005 compared to fiscal 2004 due to increased sales ofhigher margin products, primarily SEASONALE and Loestrin/Loestrin Fe.
Selling, General and Administrative Expense
The following table sets forth selling, general and administrativeexpense data for the two years ended June 30, 2005 and 2004:
Change
($’s in millions) 2005 2004 $ %
Selling, general and
administrative $298.9 $314.5 $(15.6) -5%
Charges included in general
and administrative $ 63.2 $ 96.6 $(33.4) -35%
Lower selling, general and administrative expenses in fis-cal 2005 compared to last year were primarily due to lower2005 charges compared to 2004 charges partially offset by(1) $8.1 million in higher marketing costs in fiscal 2005associated with our proprietary product portfolio and (2)$7.1 million in higher product intangible amortizationexpense in fiscal 2005 due to full year amortization onproducts purchased in the prior year and amortization ofproducts purchased in the current year.
Charges taken in the twelve months ended June 30, 2004and 2005 are as follows:
Fiscal 2004:(1) A $16 million valuation allowance we established in
September 2003 for our loans to Natural Biologics, LLC,the raw material supplier for our generic equine-basedconjugated estrogens product, as the result of an unfavor-able court decision rendered in September 2003;
(2) The February 2004 write-off of $4.2 million associatedwith the acquisition of certain emergency contraceptionassets from Gynetics, Inc;
(3) An arbitration panel’s decision in June 2004 to awardSolvay Pharmaceuticals, Inc. $68 million in damages on aclaim that we improperly terminated an agreement withSolvay; and
(4) An $8.5 million charge in June 2004 related to costs asso-ciated with our settlement of the Estrostep and Femhrtpatent challenge litigation against Galen.
Fiscal 2005:On June 15, 2005 we entered into a non-binding Letterof Intent (“LOI”) with Organon (Ireland) Ltd., OrganonUSA and Savient Pharmaceuticals, Inc. to acquire the NDAfor Mircette, obtain an exclusive royalty free license to sellMircette and Kariva in the United States and dismiss allpending litigation between the parties in exchange for a pay-ment by us of up to $155 million. The parties will not becontractually bound unless and until they negotiate and exe-cute definitive agreements. If consummated, the transactionwould permit us to promote Mircette through our Duramedsales force, which could increase sales of both Mircette andKariva. If the transaction is not consummated, we expect tocontinue to vigorously defend our position in the Mircettelitigation.
In July 2005, the parties made the required filings with theFederal Trade Commission (“FTC”) regarding the proposedtransaction. On August 1, 2005, the FTC issued a “secondrequest,” asking the parties to provide detailed informationconcerning the proposed transaction.
The proposed transaction is contingent upon both satis-factory completion of the FTC’s Hart Scott Rodino reviewand the negotiation of mutually satisfactory definitive agree-ments. However, because the proposed transaction includes,as one of its components, a payment in settlement of litiga-tion, it is presumed under GAAP to give rise to a “probableloss,” as defined in Statement of Financial AccountingStandards No. 5, “Accounting for Contingencies”. In consul-tation with outside advisors and based on preliminary valua-tions of the assets we would acquire if the transaction closeson the terms presently contemplated, we have recorded acharge of $63.2 million as of June 30, 2005 to reflect theproposed litigation settlement. We may reverse the charge, inwhole or in part, in the future if the transaction does notclose and we prevail in the litigation or are ultimately heldliable for a lesser amount of damages. If the transaction doesnot close and an unfavorable verdict were to be renderedagainst us at trial, the ultimate amount of damages payableby us could be significantly more or less than the $63.2 mil-lion charge we have recorded in connection with the pro-posed litigation settlement.

22
Research and Development
The following table sets forth research and developmentexpenses for the two years ended June 30, 2005 and 2004:
Change
($’s in millions) 2005 2004 $ %
Research and development $128.4 $169.0 $(40.6) -24%
Charges included in research
and development $ – $ 68.2 $(68.2) -100%
For the year ended June 30, 2004 our total researchand development costs reflected charges relating to strategicacquisitions or similar activities including: (1) a write-offof $22 million in March 2004 resulting from our agreement toacquire Schering’s rights and obligations under a ProductDevelopment and License Agreement that had been capitalizedat the time of our acquisition of Enhance Pharmaceuticals, Inc.in June 2002; (2) a write-off of $10 million for in-processresearch and development acquired in connection with ouracquisition of Women’s Capital Corporation in February 2004;and (3) a write-off of $36 million of in-process research anddevelopment costs in connection with our purchase of substan-tially all of the assets of Endeavor Pharmaceuticals, Inc. inNovember 2003.
The remaining $28 million increase in research and devel-opment for the year ended June 30, 2005 as compared tothe prior year was primarily due to: (1) $9.1 million in higherthird party development costs, including a $5.0 millionpayment to PLIVA related to the development, supply andmarketing agreement that we entered into in March 2005 forthe generic biopharmaceutical Granulocyte Colony StimulatingFactor (“G-CSF”); (2) $9.4 million in higher bioequivalencestudy costs, reflecting both an increase in the number andthe cost of the studies; (3) $5.0 million in higher internalproduction costs in support of internal development projects;and (4) $4.5 million in higher headcount costs in supportof the increased number of products in development.
Income Taxes
The following table sets forth income tax expense and theresulting effective tax rate stated as a percentage of pre-taxincome for the two years ended June 30, 2005 and 2004:
Change
($’s in millions) 2005 2004 $ %
Income tax expense $114.9 $71.3 $43.6 61%
Effective tax rate 34.8% 36.7%
The effective tax rate for fiscal 2005 was favorablyimpacted by the completion of several tax audits, the changeof the mix in income between various taxing jurisdictions
and the enactment of favorable tax legislation in certainjurisdictions.
As indicated above, we have recently completed an auditby the IRS for our federal income tax returns for fiscal years2002 and 2003. The resolution favorably impacted oureffective tax rate for the fiscal year but did not have a materi-al effect on our financial position or liquidity. Periods priorto 2002 have either been audited or are no longer subjectto audit. We are currently being audited by the IRS for ourfiscal year ended June 30, 2004.
Comparison of the fiscal years ended June 30, 2004and June 30, 2003
The following table sets forth revenue data for the fiscalyears ended June 30, 2004 and 2003:
Change
($’s in millions) 2004 2003 $ %
Generic products:
Distributed alternative
brands:(1)
Ciprofloxacin $ 385.3 $111.4 $ 273.9 246%
Tamoxifen(2) – 112.5 (112.5) -100%
Oral contraceptives 403.9 274.4 129.5 47%
Other generic(3) 361.4 338.9 22.5 7%
Total generic products 1,150.6 837.2 313.4 37%
Proprietary products 146.1 57.7 88.4 153%
Total product sales 1,296.7 894.9 401.8 45%
Alliance, development
and other revenue 12.4 8.0 4.4 55%
Total revenues $1,309.1 $902.9 $ 406.2 45%
(1)Distributed alternative brands are distributed by us under terms ofagreements entered into as part of patent challenge settlements.Therefore, for reporting purposes, they are classified as Genericproducts.
(2)Reflects sales of Tamoxifen acquired from innovator.
(3)Includes sales of Tamoxifen manufactured by Barr.
Revenues – Product Sales
Product sales for the year ended June 30, 2004 increased ascompared to the prior year primarily due to the sales of ourdistributed version of Ciprofloxacin and to increased sales ofour generic and proprietary products, which more than offsetthe large decline in sales of our distributed version ofTamoxifen.
Generic ProductsCiprofloxacinOn June 9, 2003, we began distributing Ciprofloxacinhydrochloride tablets and oral suspension pursuant to alicense from Bayer obtained under a 1997 settlement of a

23
patent challenge we initiated against Bayer’s Cipro® antibiotic.In September 2003, we signed an Amended Supply Agreementwith Bayer that enabled us to distribute Ciprofloxacin duringand after Bayer’s period of pediatric exclusivity, which endedon June 9, 2004. As a result, Ciprofloxacin was our largestselling product in fiscal 2004. We have shared one-half of ourprofits, as defined, from the sale of Ciprofloxacin with Aventis,the contractual successor to our partner in the Cipro patentchallenge case. Bayer’s period of pediatric exclusivity expiredon June 9, 2004 and, as we expected, several other competingCiprofloxacin products were launched.
TamoxifenFor most of the first six months of fiscal 2003 we sold adistributed version of Tamoxifen that we purchased fromAstraZeneca under the terms of a 1993 Supply andDistribution Agreement entered into as part of a patent chal-lenge settlement. This Agreement ended in December 2002.We began selling our manufactured Tamoxifen product whenAstraZeneca’s pediatric exclusivity for Nolvadex ended onFebruary 20, 2003. Therefore, we recorded no sales from adistributed version of Tamoxifen in fiscal 2004.
Oral ContraceptivesSales of our generic oral contraceptive products increasedthroughout fiscal 2004 and by June 2004, we became thelargest supplier of oral contraceptives in the U.S. as deter-mined by prescription market share data provided byIMS America.
The revenue growth in fiscal 2004 was fueled by (1)increasing volumes resulting from growth in market shareby products launched in prior periods and (2) first year salesof new generic oral contraceptives launched during fiscal2004. The largest new product addition was Tri-Sprintec, ourgeneric equivalent to Ortho’s Tri-Cyclen oral contraceptive.We launched Tri-Sprintec in December 2003 in accordancewith the terms of a patent challenge settlement we enteredinto with Ortho.
Generic Products – OtherSales of other generic products increased approximately 7% infiscal 2004 as compared to the prior year period, primarily dueto sales of our Mirtazapine Orally Disintegrating Tablet, whichwe launched in December 2003, and sales of Claravis®, whichwe launched in May 2003. These increases were partially offsetby a significant decline in sales of our Dextro salt combo prod-uct due to lower pricing and lower volumes resulting from theentry of two additional generic competitors.
Proprietary ProductsSales of our proprietary products more than doubled in fiscal2004 as compared to the prior year. This increase relatesprimarily to: (1) sales from the four products we purchasedfrom Wyeth in June 2003; (2) the launch of SEASONALE;(3) increased sales of Cenestin; and (4) sales of Loestrin/Loestrin Fe, which we purchased from Galen (Chemicals)Limited (“Galen”) in March 2004.
In September 2003 we received approval for SEASONALE.We began promoting SEASONALE directly to physicians inNovember 2003 and initiated our direct-to-consumer televi-sion and print advertising program during our fourth quarter.Demand for the product as measured by prescription dataobtained from IMS America rose from 1,736 per week forthe week ended December 26, 2003 to 12,731 for the weekended July 30, 2004.
Sales of Cenestin increased at a higher than expected rateof 36% in fiscal 2004 compared to fiscal 2003 primarilydue to year-over-year price increases of approximately 24%,the launch of one additional strength and customer buyingpatterns, which more than offset a 9% decline in Cenestinprescriptions. Prescription declines began after the results ofthe Women’s Health Initiative (“WHI”) study was publishedin July 2002 and continued through fiscal 2004. Since July2002, Cenestin prescriptions declined at a slower rate thanthose written for competing conjugated estrogen products,thus allowing us to increase our market share to 6.8% as ofJune 30, 2004 compared to 5.6% as of June 30, 2003.
Cost of Sales
The following table sets forth cost of sales data in dollars aswell as the resulting gross margins, for the two years endedJune 30, 2004 and 2003:
Change
($’s in millions) 2004 2003 $ %
Generic products $604.6 $415.0 $189.6 46%
Gross margin 47% 50%
Proprietary products $ 28.1 $ 9.1 $ 19.0 209%
Gross margin 81% 84%
Total cost of sales $632.7 $424.1 $208.6 49%
Gross margin 51% 53%
The increase in total cost of sales, on a dollar basis, forthe year ended June 30, 2004, as compared to the prior yearwas primarily due to increased product sales, principallyrelating to Ciprofloxacin.
Margins on our generic products declined slightly in fiscal2004 due mainly to the higher percentage of Ciprofloxacinsales in fiscal 2004 compared to fiscal 2003. As a distributedproduct that had a profit split paid to our partner,
Ciprofloxacin had a higher cost of sales and a lower marginthan our other products.
Margins on our proprietary products declined in fiscal2004 compared to fiscal 2003 as increased sales of somewhatlower margin products, including the products acquired fromWyeth in late fiscal 2003, more than offset higher sales ofCenestin and SEASONALE.
Selling, General and Administrative Expense
The following table sets forth selling, general and administrativeexpense data for the two years ended June 30, 2004 and 2003:
Change
($’s in millions) 2004 2003 $ %
Selling, general and
administrative $314.5 $161.0 $153.5 95%
Charges included in general
and administrative $ 96.6 $ 20.0 $ 76.6 383%
Selling, general and administrative expenses for the yearended June 30, 2004 included charges related to strategicacquisitions or other similar activities including: (1) a $16million valuation allowance we established in September2003 for our loans to Natural Biologics, LLC, the raw mate-rial supplier for our generic equine-based conjugated estro-gens product, as the result of an unfavorable court decisionrendered in September 2003; (2) the February 2004 write-offof $4.2 million associated with the acquisition of certainemergency contraception assets from Gynetics, Inc; (3) anarbitration panel’s decision in June 2004 to award SolvayPharmaceuticals, Inc. $68 million in damages on a claim thatwe improperly terminated an agreement with Solvay; and (4)an $8.5 million charge in June 2004 related to costs associat-ed with our settlement of the Estrostep and Femhrt patentchallenge litigation against Galen. Included in the year endedJune 30, 2003 was a $20 million contingent attorney fee paidin connection with a litigation settlement with Wyeth.
The remaining increase in selling, general and administra-tive expenses for the year ended June 30, 2004 as comparedto the prior year period was primarily due to: (1) increasedmarketing costs for SEASONALE of $28 million; (2) highercosts of $12 million associated with the nearly doubling ofour women’s healthcare sales force; (3) $14 million in higherlegal costs, primarily related to patent matters, the Solvayarbitration and product liability matters; and (4) $8 millionof increased information technology costs, including consult-ing costs related to the initial phases of designing and imple-menting our new enterprise resource planning system.
Research and Development
The following table sets forth research and developmentexpenses for the two years ended June 30, 2004 and 2003:
Change
($’s in millions) 2004 2003 $ %
Research and development $169.0 $91.2 $77.8 85%
Charges included in
research and development $ 68.2 $ 3.9 $64.3 1649%
For the year ended June 30, 2004 our total research anddevelopment costs reflected charges relating to strategicacquisitions or similar activities including: (1) a write-off of$22 million in March 2004 resulting from our agreement toacquire Schering’s rights and obligations under a ProductDevelopment and License Agreement that had been capital-ized at the time of our acquisition of Enhance Pharmaceu-ticals, Inc. in June 2002; (2) a write-off of $10 million forin-process research and development acquired in connectionwith our acquisition of Women’s Capital Corporation inFebruary 2004; and (3) the write-off of $36 million of in-process research and development costs in connection withour purchase of substantially all of the assets of EndeavorPharmaceuticals, Inc. in November 2003. Included in theyear ended June 30, 2003 was a $3.9 million write-off of in-process research and development associated with our June2003 purchase from Wyeth of four products and the productrights to an oral contraceptive in development.
The remaining increase in research and development forthe year ended June 30, 2004 as compared to the prior yearwas primarily due to: (1) $8 million in higher third partydevelopment costs; (2) $4 million in higher headcount costs;and (3) $3 million higher raw material costs in support ofinternal development projects.
Income Taxes
The following table sets forth income tax expense and theresulting effective tax rate stated as a percentage of pre-taxincome for the years ended June 30, 2004 and 2003:
Change
($’s in millions) 2004 2003 $ %
Income tax expense $71.3 $95.1 $(23.8) -25%
Effective tax rate 36.7% 36.2%
The effective tax rate for fiscal 2004 was unfavorablyimpacted by the write-off of in-process research and develop-ment costs associated with our February 2004 acquisition ofWomen’s Capital Corporation, which was not deductible forfederal and state income tax purposes. Offsetting the unfa-vorable impact of the in-process research and development
24
25
costs was a favorable impact of a tax benefit of $3.7 millionrelated to the completion of several tax audits and theInternal Revenue Service’s approval of a change in ourmethod of computing certain tax credits.
Liquidity and Capital Resources
OverviewThe following table highlights selected measures of our liq-uidity and capital resources as of June 30, 2005 and 2004:
Change
($’s in millions) 2005 2004 $ %
Cash & cash equivalents,
short-term marketable
securities $643.3 $452.2 $191.1 42%
Working capital 780.4 670.6 109.8 16%
Cash flow from operations 363.0 258.1 104.9 41%
Ratio of current assets to
current liabilities 4.7:1 4.2:1
Operating ActivitiesOur operating cash flows increased from $258 million infiscal 2004 to $363 million in fiscal 2005. Our higher oper-ating cash in fiscal 2005 was generated principally by ourhigher net earnings adjusted for non-cash charges, includingdepreciation and amortization, which more than offsetincreases in certain of our working capital componentsdescribed below.
Our primary source of cash from operations is the collec-tion of accounts and other receivables related to productsales. Our primary uses of cash include financing inventory,research and development programs, marketing and selling,capital projects, our share repurchase program and investingin business development activities.
Our cash flows from operations have been more than suf-ficient to fund our operations, capital expenditures and busi-ness development activities. As a result, our cash, cashequivalents and short-term marketable securities balanceshave increased.
Investment in Marketable SecuritiesDuring fiscal 2005, we increased our investments in mar-ketable securities to provide a greater return on our cash bal-ances. Our investments in marketable securities are governedby our investment policy which seeks to optimize our returnswhile preserving our capital, maintaining adequate liquidityand investing in tax advantaged securities, as appropriate.
Working CapitalWorking capital as of June 30, 2005 and 2004 consisted ofthe following:
Change
($’s in millions) 2005 2004 $ %
Cash, cash equivalents $643.3 $452.2 $191.1 42%
and marketable securities
Accounts receivable 152.6 153.9 (1.3) -1%
Inventories 137.6 150.3 (12.7) -8%
Prepaid & other current assets 59.9 121.8 (61.9) -51%
Total current assets 993.4 878.2 115.2 13%
Accounts payable &
accrued liabilities 194.2 179.1 15.1 8%
Income taxes payable 13.4 20.1 (6.7) -33%
Current portion of long-term
debt & capital leases 5.4 8.4 (3.0) -36%
Total current liabilities 213.0 207.6 5.4 3%
Working capital $780.4 $670.6 $109.8 16%
Working capital increased in 2005 compared to 2004primarily due to an increase in cash and marketable securitiesresulting from our current period operations. Changes incertain other components of working capital include: (1) adecrease in prepaid and other current assets primarily due toa $47.5 million payment we received from Bayer in fiscal2004 related to a price adjustment for Ciprofloxacin invento-ry we purchased during the second half of fiscal 2004 and(2) an increase in accounts payable and accrued liabilitieslargely as a result of the $63.2 million charge taken in con-nection with the proposed litigation settlement regardingMircette, partially offset by $48.0 million in payments madeto Solvay Pharmaceuticals under an arbitration decisionrendered against us in fiscal 2004.
In fiscal 2004 holders of warrants to purchase an aggre-gate of 3,375,000 shares of our common stock exercised thewarrants in full through a cashless exercise. We estimated atotal cash tax benefit of approximately $44 million from thisexercise. We have realized a cash tax benefit of approximate-ly $28 million through June 30, 2005. A deferred tax assetof $16 million is expected to reduce income taxes payableover the next 11 years.
Investing ActivitiesOur net cash used in investing activities was $177.0 millionin 2005 compared to $267.3 million in 2004. This decreasewas primarily due to a decrease in cash paid for acquisitionsand a reduction in the net cash used to purchase marketablesecurities.

26
Financing ActivitiesNet cash used in financing activities increased to $98.7 millionin fiscal 2005 from net cash provided by financing activities of$10.5 million in fiscal 2004 primarily due to funding sharerepurchases under the share repurchase program in fiscal 2005and higher debt repayments in fiscal 2005 as discussed below.
Share Repurchase ProgramIn August 2004, our Board of Directors authorized the repur-chase of up to $300 million of our common stock in openmarket or in privately negotiated transactions, pursuant toterms we deem appropriate and at such times as we designatethrough the end of December 2005. We hold repurchasedshares as treasury shares and may use them for general cor-porate purposes, including but not limited to acquisitionsand for issuance upon exercise of outstanding stock options.During fiscal 2005, we repurchased approximately 2.6 mil-lion shares of our common stock for approximately$100 million.
Debt Repayments and Credit AvailabilityDebt balances decreased by approximately $20 million fromJune 30, 2004 to June 30, 2005 reflecting principal repay-ments. On August 30, 2004, we entered into a new $175million, five-year credit facility. To date, no draws have beenmade under the credit facility. If and when drawn, borrow-ings will bear interest at a floating rate based on a base rateor a Eurodollar rate. We may use the proceeds of the creditfacility for working capital, capital expenditures, and generalcorporate purposes (including share repurchases and permit-ted acquisitions). Upon entering into the new credit facility,we terminated the $40 million credit facility we had in placeat the time.
In February 2005, we made a $12 million payment incomplete satisfaction of mortgage notes held by a bank. Thenotes were secured by our Cincinnati, Ohio manufacturingfacility.
Scheduled principal repayments on existing debt will be$4 million during fiscal 2006.
Proceeds from Equity TransactionsOver the three years ending June 30, 2005, we received pro-ceeds of approximately $71 million from the exercise of war-rants and employee stock options and share purchases underour employee stock purchase plan. Whether we will continueto derive proceeds at a similar level in the future is difficultto predict because the proceeds are highly dependent uponour stock price, which can be volatile, and the type of equitybased compensation we may grant in future years.
Capital ExpendituresDuring the three fiscal years ended June 30, 2005, we haveinvested approximately $183 million in upgrades andexpansions to our property, plant and equipment as well astechnology investments, including the purchase and imple-mentation of a new enterprise resource planning (“ERP”)system. The investment in property, plant and equipment hassignificantly expanded our production, laboratory, warehouseand distribution capacity in our facilities and was designed tohelp ensure that we have the facilities necessary to manufac-ture, test, package and distribute our current and futureproducts. Our investment in the ERP system will ensure thatwe have a platform to grow our business, including betterintegration of acquired businesses, expansion into new drugdelivery systems and the ability to expand internationally.
During the twelve months ended June 30, 2005, weinvested $55 million in capital projects and expect that ourcapital investments will be between $40 million and $60 mil-lion over the next twelve months. Our estimate reflects con-tinued spending on our facility expansion programs andinvestments in information technology projects including thefinal stages of the implementation of our new ERP system.
We believe we can continue funding our capital require-ments using cash provided by operations. However, we mayissue long-term debt to finance a portion of our projects. Webelieve we have the capital structure and cash flow to com-plete any such financing.
Strategic TransactionsOur investment in strategic product and company acquisi-tions was $46 million in fiscal 2005 and approximately$163 million for the three years ended June 30, 2005. Infiscal 2005, these transactions included the buy-out of theroyalty on SEASONALE from Eastern Virginia MedicalSchool, and the acquisition of certain product rights fromKing Pharmaceuticals, Inc. We continuously evaluate strate-gic transactions to further improve our business and long-range prospects and expect to make additional investmentsor acquisitions over the next twelve months. We are unableto predict the timing of potential transactions, though thecash required to complete them could equal or exceed theaverage amounts invested over the past three years. Thesetransactions typically range from product development andlicense agreements to asset or corporate acquisitions.

27
Sufficiency of Cash ResourcesWe believe our current cash and cash equivalents, marketablesecurities, investment balances, cash flows from operationsand un-drawn amounts under our revolving credit facility areadequate to fund our operations and planned capital expen-ditures and to capitalize on strategic opportunities as theyarise. We have and will continue to evaluate our capitalstructure as part of our goal to promote long-term sharehold-er value. To the extent that additional capital resources arerequired, we believe that such capital may be raised by addi-tional bank borrowings or debt offerings or other means.
Contractual ObligationsPayments due by period for our contractual obligations atJune 30, 2005 are as follows:
Payments due by period
Less than 1 to 3 4 to 5($’s in millions) Total 1 Year Years Years Thereafter
Long-term debt $ 18.5 $ 4.0 $14.5 $ – $ –
Capital leases 2.9 1.7 1.2 – –
Operating leases 33.8 4.4 10.6 3.2 15.6
Purchase obligations(1) 85.2 84.4 0.8 – –
Venture Funds
commitment 15.6 15.6 – – –
Annual interest on fixed
rate debt 1.8 0.7 1.1 – –
Other long-term
liabilities 21.0 21.0 – – –
Total $178.8 $131.8 $28.2 $3.2 $15.6
(1)Purchase obligations consist mainly of commitments for raw materialsused in our manufacturing and research and development operations.
In addition to the above, we have committed to makepotential future “milestone” payments to third parties aspart of licensing and development programs. Payments underthese agreements generally become due and payable onlyupon the achievement of certain developmental, regulatoryand/or commercial milestones. Because it is uncertain if andwhen these milestones will be achieved, such contingencieshave not been recorded on our consolidated balance sheet.
Critical Accounting Policies
The methods, estimates and judgments we use in applyingthe accounting policies most critical to our financial state-ments have a significant impact on our reported results. TheSecurities and Exchange Commission has defined the mostcritical accounting policies as the ones that are most impor-tant to the portrayal of our financial condition and results,and/or require us to make our most difficult and subjectivejudgments. Based on this definition, our most critical policiesare the following: (1) revenue recognition and related provi-
sions for estimated reductions to gross revenues; (2) invento-ries and related inventory reserves; (3) income taxes; (4)contingencies; and (5) accounting for acquisitions. Althoughwe believe that our estimates and assumptions are reasonable,they are based upon information available at the time the esti-mates and assumptions were made. We review the factors thatinfluence our estimates and, if necessary, adjust them. Actualresults may differ significantly from our estimates.
Revenue Recognition and Provisions for EstimatedReductions to Gross RevenuesWe recognize revenue from product sales when title and riskof loss have transferred to our customers and when col-lectibility is reasonably assured. This is generally at the timeproducts are received by the customer. From time to time theCompany provides incentives, such as trade show allowancesor stocking allowances, that provide incremental allowancesto customers who in turn use such incremental allowancesto accelerate distribution to the end customer. We believe thatsuch incentives are normal and customary in the industry.Additionally, we understand that certain of our wholesalecustomers anticipate the timing of price increases and havemade and may continue to make business decisions to buyadditional product in anticipation of future price increases.This practice has been customary in the industry and wouldbe part of a customer’s “ordinary course of business invento-ry level.”
We evaluate inventory levels at our wholesale customers,which account for approximately 50% of our sales, throughan internal analysis that considers, among other things,wholesaler purchases, wholesaler contract sales, available endconsumer prescription information and inventory data fromour largest wholesale customer. We believe that our evalua-tion of wholesaler inventory levels as described in the preced-ing sentence, allows us to make reasonable estimates for ourapplicable reserves. Further, our products are typically soldwith sufficient dating to permit sufficient time for our whole-saler customers to sell our products in their inventorythrough to the end consumer.
Upon recognizing revenue from a sale, we simultaneouslyrecord estimates for the following items that reduce grossrevenues:
◆ returns and allowances (including shelf-stock adjustments);
◆ chargebacks;
◆ rebates;
◆ Medicaid rebates; and
◆ prompt payment discounts and other allowances.

28
For each of the items listed above other than Medicaidrebates, the estimated amounts serve to reduce our accountsreceivable balance. We include our estimate for Medicaid
to a customer following a price decrease is at our discretionrather than contractually required. The primary factors weconsider when deciding whether to record a reserve for ashelf-stock adjustment include:
◆ the estimated launch date of a competing product, whichwe determine based on market intelligence;
◆ the estimated decline in the market price of our product,which we determine based on historical experience andinput from customers; and,
◆ the estimated levels of inventory held by our customers atthe time of the anticipated decrease in market price, whichwe determine based upon historical experience and cus-tomer input.
ChargebacksWe market and sell products directly to wholesalers, distribu-tors, warehousing pharmacy chains, mail order pharmaciesand other direct purchasing groups. We also market productsindirectly to independent pharmacies, non-warehousingchains, managed care organizations, and group purchasingorganizations, collectively referred to as “indirect cus-
Current provision Current provision Actual returnsrelated to sales related to sales or credits
Beginning made in the made in in the Ending($’s in millions) balance current period prior periods current period balance
Fiscal year ended June 30, 2005Accounts receivable reserves:
Returns and allowances $ 57.5 $ 64.8 $1.0 $ (70.6) $ 52.7Chargebacks 38.8 267.6 6.0 (267.5) 44.9Rebates 39.4 200.6 – (194.7) 45.3Cash Discounts 6.2 32.0 – (31.1) 7.1
Total $141.9 $565.0 $7.0 $(563.9) $150.0
Accrued liabilities:Medicaid rebates $ 11.4 $ 17.2 $3.0 $ (21.5) $ 10.1
Fiscal year ended June 30, 2004Accounts receivable reserves:
Returns and allowances $ 52.9 $ 70.1 $ – $ (65.5) $ 57.5Chargebacks 30.0 189.8 – (181.0) 38.8Rebates 45.6 172.5 – (178.7) 39.4Cash Discounts 7.6 35.2 – (36.6) 6.2
Total $136.1 $467.6 $ – $(461.8) $141.9
Accrued liabilities:Medicaid rebates $ 9.5 $ 26.0 $ – $ (24.1) $ 11.4
rebates in accrued liabilities. A table showing the activity ofeach reserve is set forth below:
Returns and allowancesOur provision for returns and allowances consists of ourestimates of future product returns, pricing adjustments,delivery errors, and our estimate of price adjustments arisingfrom shelf stock adjustments (which are discussed in greaterdetail below). Consistent with industry practice, we maintaina return policy that allows our customers to return productwithin a specified period of time both prior and subsequentto the product’s expiration date. The primary factors weconsider in estimating our potential product returns include:
◆ the shelf life or expiration date of each product;
◆ historical levels of expired product returns; and
◆ the estimated date of return.
Shelf-stock adjustments are credits issued to our customersto reflect decreases in the selling prices of our products.These credits are customary in the industry and are intendedto reduce a customer’s inventory cost to better reflect currentmarket prices. The determination to grant a shelf-stock credit

29
tomers.” We enter into agreements with some indirect cus-tomers to establish contract pricing for certain products.These indirect customers then independently select a whole-saler from which to purchase the products at these contract-ed prices. Alternatively, we may pre-authorize wholesalers tooffer specified contract pricing to other indirect customers.Under either arrangement, we provide credit to the whole-saler for any difference between the contracted price with theindirect customer and the wholesaler’s invoice price. Suchcredit is called a chargeback. The primary factors we consid-er in developing and evaluating our provision for charge-backs include:
◆ the average historical chargeback credits; and
◆ an estimate of the inventory held by our wholesalers,based on internal analysis of a wholesaler’s historical pur-chases and contract sales.
RebatesOur rebate programs can generally be categorized into thefollowing four types:
◆ direct rebates;
◆ indirect rebates;
◆ managed care rebates; and
◆ Medicaid rebates.
The direct and indirect rebates relate primarily to thegeneric segment of our business whereas our managed carerebates are solely associated with the proprietary segment ofour business. Medicaid rebates apply to both of our seg-ments. Direct rebates are generally rebates paid to direct pur-chasing customers based on a percentage applied to a directcustomer’s purchases from us. Indirect rebates are rebatespaid to “indirect customers” which have purchased Barrproducts from a wholesaler under a contract with us.Managed care and Medicaid rebates are amounts owed basedupon contractual agreements or legal requirements with pri-vate sector and public sector (Medicaid) benefit providers,after the final dispensing of the product by a pharmacy to abenefit plan participant.
We maintain reserves for our direct rebate programs basedon purchases by our direct purchasing customers. Indirectrebate reserves are based on actual contract purchases in aperiod and an estimate of wholesaler inventory subject to anindirect rebate. Managed care and Medicaid reserves arebased on expected payments, which are driven by patientusage, contract performance, as well as field inventory thatwill be subject to a managed care or Medicaid rebate.
Prompt Pay DiscountsWe offer many of our customers 2% prompt pay discounts.We evaluate the amounts accrued for prompt pay discountsby analyzing the unpaid invoices in our accounts receivableaging subject to a prompt pay discount.
Alliance RevenueWe have agreements to co-promote products developed byother companies. Revenue from the sale of the co-promotedproduct is recorded as alliance revenue and is included innet revenue. Revenue is recognized when the co-promotioncompany ships the product and title and risk of loss pass to athird party. Revenue is primarily based upon a percentage ofthe co-promotion company’s net sales or gross margin. Ourselling and marketing expenses related to alliance revenue areincluded in selling, general and administrative expenses.
Inventory ReservesInventories are stated at the lower of cost or market andconsist of finished goods purchased from third party manu-facturers and held for distribution, as well as raw materials,work-in-process and finished goods manufactured by us.We determine cost on a first-in, first-out basis.
We capitalize the costs associated with certain productsprior to receiving final marketing approval from the FDA forsuch products (“pre-launch inventories”). For our genericproducts, each ANDA submission is made with the expecta-tion that: (i) the FDA will approve the marketing of theapplicable product, (ii) we will validate our process for man-ufacturing the applicable product within the specificationsthat have been or will be approved by the FDA, and (iii) thecost of the inventory will be recovered from the commercial-ization of our ANDA product. Typically, we capitalizeinventory related to our proprietary products based on thesame expectations as above, but we do not begin to capitalizecosts until the NDA is filed or in the case of components toa NDA product, the product development process has pro-gressed to a point where we have determined that the prod-uct has a high probability of regulatory approval. Theaccumulation of pre-launch inventory involves risks such as(i) the FDA may not approve such product(s) for marketingon a timely basis, if ever, (ii) approvals may require addition-al or different testing and/or specifications than what wasperformed in the manufacture of such pre-launch inventory,and (iii) in those instances where the pre-launch inventory isfor a product that is subject to litigation, the litigation maynot be resolved or settled to our satisfaction. If any of theserisks were to materialize and the launch of such product weresignificantly delayed, we may have to write-off all or a por-tion of such pre-launch inventory and such amounts could bematerial. As of June 30, 2005 and 2004, the amount of pre-launch inventory was not material to our net earnings.

30
We establish reserves for our inventory, including pre-launch inventory, to reflect situations in which the cost of theinventory is not expected to be recovered. We review ourinventory for products that are close to or have reached theirexpiration date and therefore are not expected to be sold, forproducts where market conditions have changed or areexpected to change, and for products that are not expected tobe saleable based on our quality assurance and control stan-dards. In addition, for our pre-launch inventory, we take intoconsideration the substance of communications with the FDAduring the approval process and the views of patent and liti-gation counsel. The reserves we establish in these situations isequal to all or a portion of the cost of the inventory based onthe specific facts and circumstances. In evaluating whetherinventory is properly stated at the lower of cost or market,we consider such factors as the amount of product inventoryon hand, estimated time required to sell such inventory,remaining shelf life and current and expected market condi-tions, including levels of competition. We record provisionsfor inventory reserves as part of cost of sales.
Inventories are presented net of reserves of $13 million atJune 30, 2005 and $24 million at June 30, 2004.
Income TaxesOur effective tax rate is based on pre-tax income, statutorytax rates and available tax incentives (i.e., credits) and plan-ning opportunities in the various jurisdictions in which weoperate. We establish reserves when, despite our belief thatthe tax return positions are fully supportable, certain posi-tions may be challenged and may not be upheld on audit. Weadjust our reserves upon the occurrence of a discrete event,such as the completion of an income tax audit. The effectivetax rate includes the impact of reserve provisions and chargesto reserves that are considered appropriate. This rate isapplied to our quarterly operating results.
Tax regulations require certain items to be included in theincome tax return at different times than the items are reflect-ed in the financial statements. As a result, the effective taxrate reflected in the financial statements is different than thatreported in the income tax return. Some of the differences arepermanent, such as tax-exempt interest income, and some aretiming differences such as depreciation expense. Deferred taxassets generally represent items that can be used as a taxdeduction or credit in future years for which we have alreadyrecorded the tax benefit in the financial statements. We estab-lish valuation allowances for our deferred tax assets whenthe amount of expected future taxable income is not likely to
support the use of the deduction or credit. Deferred tax lia-bilities generally represent tax expense recognized in thefinancial statements for which payment has been deferred orexpenses for which we have already taken a deduction on thetax return, but have not yet recognized as expense in thefinancial statements.
ContingenciesWe are involved in various patent, product liability, commer-cial litigation and claims, government investigations and otherlegal proceedings that arise from time to time in the ordinarycourse of our business. We assess, in consultation with counsel,the need to accrue a liability for such contingencies and recorda reserve when we determine that a loss related to a matter isboth probable and reasonably estimable. Because litigation andother contingencies are inherently unpredictable, our assess-ment can involve judgments about future events. We recordanticipated recoveries under existing insurance contracts whencollection is reasonably assured.
We utilize a combination of self-insurance and traditionalthird-party insurance policies to cover potential productliability claims on products sold on or after September 30,2002, and we have obtained extended reporting periodsunder previous policies for claims arising on products soldprior to September 30, 2002.
AcquisitionsWe account for acquired businesses using the purchase methodof accounting which requires that the assets acquired and lia-bilities assumed be recorded at the date of acquisition at theirrespective fair values. Our consolidated financial statementsand results of operations reflect an acquired business after thecompletion of the acquisition and are not restated. The cost toacquire a business, including transaction costs, is allocated tothe underlying net assets of the acquired business in proportionto their respective fair values. Any excess of the purchase priceover the estimated fair values of the net assets acquired isrecorded as goodwill. Amounts allocated to acquired in-process research and development are expensed at the date ofacquisition. When we acquire net assets that do not constitutea business, no goodwill is recognized.
The judgments made in determining the estimated fairvalue assigned to each class of assets acquired and liabilitiesassumed, as well as asset lives, can materially impact ourresults of operations. Accordingly, for significant items, wetypically obtain assistance from third party valuation special-ists. Useful lives are determined based on the expected futureperiod of benefit of the asset, which considers various charac-teristics of the asset, including projected cash flows. Wereview goodwill for impairment annually or more frequentlyif impairment indicators arise.

31
As a result of our acquisitions, we have recorded goodwillof $18 million on our balance sheets as of June 30, 2005 and2004. In addition, as a result of our acquisition of productrights and related intangibles and certain product licenses, wehave recorded $98 million and $65 million as other intangi-ble assets, net of accumulated amortization, on our balancesheets as of June 30, 2005 and 2004, respectively.
Recent Accounting Pronouncements
In December 2004, the Financial Accounting StandardsBoard (the “FASB”) issued Statement of FinancialAccounting Standard (“SFAS”) No. 123(R), “Share-BasedPayment,” which revises SFAS No. 123, “Accountingfor Stock-Based Compensation” (“SFAS No. 123”), andsupersedes Accounting Principles Board Opinion No. 25,“Accounting for Stock Issued to Employees” (“APB No. 25”)and amends SFAS No. 95 “Statement of Cash Flows.” SFASNo. 123(R) requires companies to recognize in their incomestatement the grant-date fair value of stock options and otherequity-based compensation issued to employees and direc-tors. Pro forma disclosure is no longer an alternative. Weadopted SFAS No. 123(R) on July 1, 2005. This Standardrequires that compensation expense for most equity-basedawards be recognized over the requisite service period, usual-ly the vesting period, while compensation expense for liabili-ty-based awards (those usually settled in cash rather thanstock) be re-measured to fair-value at each balance sheet dateuntil the award is settled. As permitted by SFAS No. 123, wecurrently account for share-based payments to employees anddirectors using the intrinsic value method and, as such, rec-ognize no compensation cost for equity-based awards.Accordingly, the adoption of SFAS No. 123(R)’s fair valuemethod will have an impact on our results of operations,although it will have no net impact on our overall financialposition or cash flows.
We use the Black-Scholes formula to estimate the value ofstock-based compensation granted to employees and direc-tors and expect to continue to use this acceptable option val-uation model in the future. Because SFAS No. 123(R) mustbe applied not only to new awards, but to previously grantedawards that are not fully vested on the effective date, com-
pensation cost for some previously granted options will berecognized under SFAS No. 123(R). However, had weadopted SFAS No. 123(R) in prior periods, the impact of thatStatement would have approximated the impact describedin the disclosure of pro forma net earnings and earningsper share.
SFAS No. 123(R) also requires the benefits of tax deduc-tions in excess of recognized compensation cost to be report-ed as a financing cash flow, rather than as an operating cashflow as currently required.
We will follow the modified prospective method, whichrequires us (1) to record compensation expense for the non-vested portion of previously issued awards that remain out-standing at the initial date of adoption and (2) to recordcompensation expense for any awards issued or modifiedafter July 1, 2005. Based on the adoption of the modifiedprospective method, we expect to record pre-tax stock basedcompensation expense of approximately $27 million in fiscal2006. This amount represents awards granted in prior yearswhich are vesting in fiscal 2006 and 2006 fiscal year awardsexpected to be granted.
In November 2004, the FASB issued Statement No. 151,“Inventory Costs, an amendment of ARB No. 43, Chapter4” (“SFAS No. 151”), to clarify the accounting for abnormalamounts of idle facility expense, freight, handling costs,and wasted materials (spoilage). ARB No. 43 allowed someof these “abnormal costs” to be carried as inventory whereasSFAS No. 151 requires that these costs be recognized inincome as incurred. This Statement is effective for theCompany’s fiscal year beginning July 1, 2005. We haveevaluated the effect of adopting SFAS No. 151 and havedetermined that this statement will not have a significanteffect on our current consolidated financial statements.
In December 2004, the FASB issued FSP FAS 109-1,“Application of FASB Statement No. 109, ‘Accounting forIncome Taxes,’ to the Tax Deduction on Qualified ProductionActivities Provided by the American Jobs Creation Act of2004” (the “Act”), to provide accounting guidance on theappropriate treatment of tax benefits generated by the enact-ment of the Act. The FSP requires that the manufacturer’sdeduction be treated as a special deduction in accordance withSFAS No. 109 and not as a tax rate reduction. We assessed theimpact of adopting FSP FAS 109-1 on our consolidated finan-cial statements and expect to realize a slight reduction in oureffective tax rate during fiscal 2006. The Act will be effectivefor our fiscal year beginning July 1, 2005.

32
Environmental Matters
We may have obligations for environmental safety and clean-up under various state, local and federal laws, including theComprehensive Environmental Response, Compensation andLiability Act, commonly known as Superfund. Based oninformation currently available, environmental expenditureshave not had, and are not anticipated to have, any materialeffect on our consolidated financial statements.
Effects of Inflation; Seasonality
Inflation has had only a minimal impact on our operations inrecent years. Similarly, our business is generally not affectedby seasonality.
Forward-Looking Statements
The preceding sections contain a number of forward-lookingstatements. To the extent that any statements made in thisreport contain information that is not historical, these state-ments are essentially forward-looking. Forward-lookingstatements can be identified by their use of words such as“expects,” “plans,” “will,” “may,” “anticipates,” “believes,”“should,” “intends,” “estimates” and other words of similarmeaning. These statements are subject to risks and uncertain-ties that cannot be predicted or quantified and, consequently,actual results may differ materially from those expressed orimplied by such forward-looking statements. Such risks anduncertainties include, in no particular order:
◆ the difficulty in predicting the timing and outcome of legalproceedings, including patent-related matters such aspatent challenge settlements and patent infringement cases;
◆ the difficulty of predicting the timing of FDA approvals;
◆ court and FDA decisions on exclusivity periods;
◆ the ability of competitors to extend exclusivity periods fortheir products;
◆ our ability to complete product development activities inthe timeframes and for the costs we expect;
◆ market and customer acceptance and demand for ourpharmaceutical products;
◆ our dependence on revenues from significant customers;
◆ reimbursement policies of third party payors;
◆ our dependence on revenues from significant products;
◆ the use of estimates in the preparation of our financialstatements;
◆ the impact of competitive products and pricing on prod-ucts, including the launch of authorized generics;
◆ the ability to launch new products in the timeframes weexpect;
◆ the availability of raw materials;
◆ the availability of any product we purchase and sell as adistributor;
◆ the regulatory environment;
◆ our exposure to product liability and other lawsuits andcontingencies;
◆ the cost of insurance and the availability of product liabili-ty insurance coverage;
◆ our timely and successful completion of strategic initia-tives, including integrating companies and products weacquire and implementing our new enterprise resourceplanning system;
◆ fluctuations in operating results, including the effects onsuch results from spending for research and development,sales and marketing activities and patent challenge activi-ties; and
◆ other risks detailed from time-to-time in our filings withthe Securities and Exchange Commission.
We wish to caution each reader of this report to considercarefully these factors as well as specific factors that may bediscussed with each forward-looking statement in this reportor disclosed in our filings with the SEC, as such factors, insome cases, could affect our ability to implement our busi-ness strategies and may cause actual results to differ material-ly from those contemplated by the statements expressedherein. Readers are urged to carefully review and considerthese factors. We undertake no duty to update the forward-looking statements even though our situation may changein the future.

33
June 30, June 30,
(in thousands, except share and per share data) 2005 2004
AssetsCurrent assets:
Cash and cash equivalents $ 115,793 $ 28,508Marketable securities 527,462 423,746Accounts receivable, net 152,599 153,890Other receivables 21,411 60,848Inventories, net 137,638 150,252Deferred income taxes 30,224 46,077Prepaid expenses and other current assets 8,229 14,925
Total current assets 993,356 878,246Property, plant and equipment, net 249,485 236,831Deferred income taxes 60,504 35,016Marketable securities 53,793 89,143Other intangible assets 98,343 64,897Goodwill 17,998 18,211Other assets 9,367 10,925
Total assets $1,482,846 $1,333,269
Liabilities and Shareholders’ EquityCurrent liabilities:
Accounts payable $ 49,743 $ 61,089Accrued liabilities 144,428 117,970Current portion of long-term debt and capital lease obligations 5,446 8,447Income taxes payable 13,353 20,139
Total current liabilities 212,970 207,645
Long-term debt and capital lease obligations 15,493 32,355Other liabilities 20,413 51,223Commitments & Contingencies (Note 17)Shareholders’ equity:
Preferred stock $1 par value per share; authorized 2,000,000; none issued – –Common stock $.01 par value per share; authorized 200,000,000;
issued 106,340,470 and 104,916,103 in 2005 and 2004, respectively 1,063 1,049Additional paid-in capital 454,489 377,024Retained earnings 879,669 664,681Accumulated other comprehensive loss (561) –
1,334,660 1,042,754
Treasury stock at cost: 2,972,997 and 420,597 shares in 2005 and 2004, respectively (100,690) (708)
Total shareholders’ equity 1,233,970 1,042,046
Total liabilities and shareholders’ equity $1,482,846 $1,333,269
See accompanying notes to the consolidated financial statements.
Consolidated Balance Sheets

34
Consolidated Statements of Operations
For the Years Ended June 30,
(in thousands, except per share data) 2005 2004 2003
Revenues:Product sales $1,030,174 $1,296,709 $ 894,888Alliance, development and other revenue 17,225 12,379 7,976
Total revenues 1,047,399 1,309,088 902,864
Costs and expenses:Cost of sales 304,080 632,745 424,099Selling, general and administrative 298,908 314,500 160,978Research and development 128,384 168,995 91,207
Earnings from operations 316,027 192,848 226,580Proceeds from patent challenge settlement – – 31,396Interest income 11,449 5,768 6,341Interest expense 1,463 2,643 1,474Other income (expense) 3,863 (1,533) (128)
Earnings before income taxes 329,876 194,440 262,715Income tax expense 114,888 71,337 95,149
Net earnings $ 214,988 $ 123,103 $ 167,566
Earnings per common share – basic $ 2.08 $ 1.21 $ 1.69
Earnings per common share – diluted $ 2.03 $ 1.15 $ 1.62
Weighted average shares 103,180 101,823 99,125
Weighted average shares – diluted 106,052 106,661 103,592
See accompanying notes to the consolidated financial statements.

35
For the Years Ended June 30, 2005, 2004 and 2003Additional Accumulated
Additional paid-in other TotalCommon stock paid-in capital – Retained comprehensive Treasury stock shareholders’
(in thousands, except shares) Shares Amount capital warrants earnings income/(loss) Shares Amount equity
Balance, July 1, 2002 43,792,170 $ 438 $275,219 $ 16,418 $375,066 $ 99 186,932 $ (708) $666,532
Comprehensive income:Net earnings 167,566 167,566Unrealized loss on
marketable securities,net of tax of $170 (278) (278)
Total comprehensive income 167,288Tax benefit of stock
incentive plans 10,912 10,912Issuance of common stock
for exercised stock optionsand employees’ stockpurchase plans 1,020,032 10 23,453 23,463
Issuance of common stock forexercised warrants 83,940 1 (1) –
Stock split (3-for-2) 22,170,054 222 (422) 93,466 (200)
Balance, June 30, 2003 67,066,196 671 309,583 16,418 542,210 (179) 280,398 (708) 867,995
Comprehensive income:Net earnings 123,103 123,103Reclassification adjustment 179 179
Total comprehensive income 123,282Tax benefit of stock incentive
plans and warrants 25,262 25,262Issuance of common stock
for exercised stock optionsand employees’ stockpurchase plans 1,456,808 14 25,784 25,798
Issuance of common stock forexercised warrants 2,340,610 23 16,395 (16,418) 0
Stock split (3-for-2) 34,052,489 341 (632) 140,199 (291)
Balance, June 30, 2004 104,916,103 1,049 377,024 – 664,681 – 420,597 (708) 1,042,046
Comprehensive income:Net earnings 214,988 214,988Unrealized loss on
marketable securities,net of tax of $320 (561) (561)
Total comprehensive income 214,427Tax benefit of stock incentive
plans and warrants 56,212 56,212Issuance of common stock
for exercised stock optionsand employees’ stockpurchase plans 1,136,141 11 18,506 18,517
Issuance of common stock forexercised warrants 288,226 3 2,747 2,750
Purchases of common stock 2,552,400 (99,982) (99,982)
Balance, June 30, 2005 106,340,470 $1,063 $454,489 $ – $879,669 $(561) 2,972,997 $(100,690) $1,233,970
See accompanying notes to the consolidated financial statements.
Consolidated Statements of Shareholders’ Equity

Years Ended June 30,
(in thousands) 2005 2004 2003
Cash Flows from Operating Activities:Net earnings $214,988 $123,103 $167,566Adjustments to reconcile net earnings to net
cash provided by operating activities:Depreciation and amortization 40,820 32,059 22,713Deferred income tax expense (benefit) 7,100 (44,330) 6,684Write-off of intangible asset – 22,333 1,330Provision for losses on loans to Natural Biologics 1,050 16,079 –Other 2,480 17,699 362
Tax benefit of stock incentive plans and warrants 39,846 25,262 10,912Write-off of in-process research and development associated with acquisitions – 45,900 3,946Changes in assets and liabilities:
(Increase) decrease in:Accounts receivable and other receivables, net 40,728 38,081 (126,390)Inventories, net 12,614 13,771 (12,793)Prepaid expenses 6,396 (8,052) 923Other assets 6,668 (201) (10,391)
Increase (decrease) in:Accounts payable, accrued liabilities and other liabilities (2,881) (32,428) 93,951Income taxes payable (6,774) 8,823 1,515
Net cash provided by operating activities 363,035 258,099 160,328
Cash Flows from Investing Activities:Purchases of property, plant and equipment (55,157) (46,907) (80,617)Acquisitions, net of cash acquired (46,500) (90,563) (25,992)Purchases of marketable securities (1,220,869) (1,126,043) (492,675)Sales of marketable securities 1,152,485 1,001,130 349,190Other (6,990) (4,935) (6,169)
Net cash used in investing activities (177,031) (267,318) (256,263)
Cash Flows from Financing Activities:Principal payments on long-term debt and capital leases (20,004) (8,522) (5,528)Principal payment on note assumed in acquisition – (6,500) –Purchase of treasury stock (99,982) – –Proceeds from exercise of stock options, employee stock purchases and warrants 21,267 25,798 23,463Other – (291) (200)
Net cash (used in) provided by financing activities (98,719) 10,485 17,735
Increase (decrease) in cash and cash equivalents 87,285 1,266 (78,200)Cash and cash equivalents at beginning of period 28,508 27,242 105,442
Cash and cash equivalents at end of period $115,793 $ 28,508 $ 27,242
Supplemental Cash Flow Data:
Cash paid during the period:Interest, net of portion capitalized $ 1,458 $ 2,658 $ 1,455
Income taxes $ 74,711 $ 80,733 $ 76,039
See accompanying notes to the consolidated financial statements.
Consolidated Statements of Cash Flows
36

Note 1 – Summary of SignificantAccounting Policies
(a) Principles of Consolidation and Other MattersBarr Pharmaceuticals, Inc. is a Delaware holding companywhose principal subsidiaries, Barr Laboratories, Inc. andDuramed Pharmaceuticals, Inc., are engaged in the develop-ment, manufacture and marketing of generic and proprietarypharmaceuticals.
Certain amounts in the 2003 and 2004 financial state-ments have been reclassified to conform with the 2005 pres-entation.
On February 13, 2004 the Company’s Board of Directorsdeclared a 3-for-2 stock split in the form of a 50% stockdividend. Approximately 34.5 million shares of commonstock were distributed on March 16, 2004 to shareholdersof record at the close of business on February 23, 2004. Allapplicable prior period share and per share amounts havebeen adjusted for stock splits.
On November 20, 2003, the Company completed thepurchase of substantially all of the assets of EndeavorPharmaceuticals, Inc. (“Endeavor”). The operating results ofEndeavor are included in the consolidated financial state-ments subsequent to the November 20, 2003 acquisitiondate. On February 25, 2004, the Company completed thepurchase of 100% of the outstanding shares of Women’sCapital Corporation (“WCC”). The operating results ofWCC are included in the consolidated financial statementssubsequent to the February 25, 2004 acquisition date.
(b) Use of Estimates in the Preparation ofFinancial StatementsThe preparation of financial statements in conformity withaccounting principles generally accepted in the United Statesof America requires management to make estimates and useassumptions that affect the reported amounts of assets andliabilities and disclosure of contingent liabilities at the date ofthe financial statements and the reported amounts of rev-enues and expenses during the reporting period. These esti-mates are often based on judgments, probabilities andassumptions that management believes are reasonable butthat are inherently uncertain and unpredictable. As a result,actual results could differ from those estimates. Managementperiodically evaluates estimates used in the preparation of theconsolidated financial statements for continued reasonable-ness. Appropriate adjustments, if any, to the estimates usedare made prospectively based on such periodic evaluations.
(c) Revenue RecognitionThe Company recognizes product sales revenue when titleand risk of loss have transferred to the customer, when esti-mated provisions for product returns, rebates, includingMedicaid rebates, chargebacks and other sales allowances arereasonably determinable, and when collectibility is reason-ably assured. Accruals for these provisions are presented inthe consolidated financial statements as reductions to rev-enues. Accounts receivable are presented net of allowancesrelating to the above provisions of $149,945 and $141,873at June 30, 2005 and 2004, respectively. Included in accruedliabilities are $10,060 and $11,413 relating to estimatedMedicaid rebates at June 30, 2005 and 2004, respectively.
Alliance, development and other revenue includes: reim-bursements relating to research and development contracts,licensing fees, royalties earned under co-promotion agree-ments and profit splits on certain products. The Companyrecognizes revenues under: (1) research and developmentagreements as it performs the related research and develop-ment; (2) license fees over the life of the product license; and(3) royalties under co-promotion agreements and profit splitsat the time its partner ships the product and title and risk ofloss pass to a third party.
(d) Sales Returns and AllowancesAt the time of sale, the Company simultaneously records esti-mates for various costs, which reduce product sales. Thesecosts include estimates for price adjustments, productreturns, chargebacks, rebates, including Medicaid rebates,prompt payment discounts and other sales allowances. Inaddition, the Company records allowances for shelf-stockadjustments when the conditions are appropriate. Estimatesfor sales allowances such as product returns, rebates andchargebacks are based on a variety of factors including actualreturn experience of that product or similar products, rebatearrangements for each product, and estimated sales by ourwholesale customers to other third parties who have con-tracts with the Company. Actual experience associated withany of these items may be different than the Company’s esti-mates. The Company regularly reviews the factors that influ-ence its estimates and, if necessary, makes adjustments whenit believes that actual product returns, credits and otherallowances may differ from established reserves.
(e) InventoriesInventories are stated at the lower of cost or market. Cost isdetermined on a first-in, first-out (FIFO) basis. The Companyestablishes reserves for its inventory to reflect situations inwhich the cost of the inventory is not expected to be recov-ered. In evaluating whether inventory is stated at the lower ofcost or market, management considers such factors as the
Notes to the Consolidated Financial Statements(in thousands, except for per share amounts)
37

38
party valuation specialists. Useful lives are determinedbased on the expected future period of benefit of the asset,which considers various characteristics of the asset, includingprojected cash flows. The Company reviews goodwill forimpairment annually or more frequently if impairmentindicators arise.
(i) Credit and Market RiskFinancial instruments that potentially subject the Companyto credit risk consist principally of interest-bearing invest-ments and trade receivables. The Company performs ongoingcredit evaluations of its customers’ financial condition andgenerally does not require collateral from its customers.
(j) Cash and Cash EquivalentsCash equivalents consist of short-term, highly liquid invest-ments including money market securities. In March 2005, theCompany concluded that it was appropriate to reclassify itsinvestment in auction rate securities as short-term marketablesecurities. Previously, such investments had been classified onthe balance sheet as cash and cash equivalents. Accordingly,the Company has revised its June 30, 2004 consolidated bal-ance sheet to reclassify auction rate securities in the amountof $391,370 from cash and cash equivalents to short-termmarketable securities.
(k) Property, Plant and EquipmentProperty, plant and equipment is recorded at cost.Depreciation is recorded on a straight-line basis over the esti-mated useful lives of the related assets (3 to 10 years formachinery, equipment, furniture and fixtures and 10 to 45years for buildings and improvements). Amortization of capi-tal lease assets is included in depreciation expense. Leaseholdimprovements are amortized on a straight-line basis over theshorter of their useful lives or the terms of the respective leas-es, with such amortization periods generally ranging from 2to 10 years. Maintenance and repairs are charged to opera-tions as incurred; renewals and betterments are capitalized.
(l) Stock-Based CompensationThe Company has three stock-based employee compensationplans, two stock-based non-employee director compensationplans and an employee stock purchase plan, which aredescribed more fully in Note 14. The Company accounts forthese plans under the intrinsic value method described inAccounting Principles Board Opinion No. 25 “Accountingfor Stock Issued to Employees,” and related Interpretations.Under the intrinsic value method, no stock-based employee
amount of inventory on hand, estimated time required to sellsuch inventory, remaining shelf life and current and expectedmarket conditions, including levels of competition. TheCompany records provisions for inventory reserves as part ofcost of sales.
(f) Income TaxesIncome taxes have been provided for using an asset and lia-bility approach in which deferred tax assets and liabilities arerecognized for the differences between the financial statementand tax basis of assets and liabilities using enacted tax ratesin effect for the years in which the differences are expected toreverse. A valuation allowance is provided for the portion ofdeferred tax assets that are “more-likely-than-not” to beunrealized. Deferred tax assets and liabilities are measuredusing enacted tax rates and laws.
(g) ContingenciesThe Company is involved in various patent, product liabilityand, commercial litigation and claims, government investiga-tions and other legal proceedings that arise from time to timein the ordinary course of its business (see note 17). TheCompany assesses, in consultation with counsel, the need toaccrue a liability for such contingencies and record a reservewhen it determines that a loss related to a matter is bothprobable and reasonably estimable. Because litigation andother contingencies are inherently unpredictable, theCompany’s assessment can involve judgments about futureevents. The Company records anticipated recoveries underexisting insurance contracts when collection is reasonablyassured.
(h) AcquisitionsThe Company accounts for acquired businesses using thepurchase method of accounting which requires that the assetsacquired and liabilities assumed be recorded at the date ofacquisition at their respective fair values. The Company’sconsolidated financial statements and results of operationsreflect an acquired business after the completion of the acqui-sition and are not restated. The cost to acquire a business,including transaction costs, is allocated to the underlying netassets of the acquired business in proportion to their respec-tive fair values. Any excess of the purchase price over theestimated fair values of the net assets acquired is recorded asgoodwill. Amounts allocated to acquired in-process researchand development are expensed at the date of acquisition.When the Company acquires net assets that do not constitutea business, no goodwill is recognized.
The judgments made in determining the estimated fairvalue assigned to each class of assets acquired and liabilitiesassumed, as well as asset lives, can materially impact theCompany’s results of operations. Accordingly, for significantitems, the Company typically obtains assistance from third

compensation cost is reflected in net earnings. The followingtable illustrates the effect on net earnings and earnings pershare if the Company had applied the fair value recognitionprovisions of SFAS No. 123, “Accounting for Stock-BasedCompensation”, to stock-based compensation.
Years Ended June 30,
(in thousands, except per share data) 2005 2004 2003
Net earnings, as reported $214,988 $123,103 $167,566
Add:
Stock-based employee compensation
expense included in reported
net income, net of related tax effects – – –
Deduct:
Total stock-based employee
compensation expense determined
under fair value based method for
all awards, net of related tax effects 20,178 13,747 6,047
Pro forma net earnings $194,810 $109,356 $161,519
Earnings per share:
Basic – as reported $ 2.08 $ 1.21 $ 1.69
Basic – pro forma $ 1.89 $ 1.07 $ 1.63
Diluted – as reported $ 2.03 $ 1.15 $ 1.62
Diluted – pro forma $ 1.84 $ 1.03 $ 1.56
For all plans, the fair value of each option grant wasestimated at the date of grant using the Black-ScholesOption Pricing Model with the following weighted-averageassumptions:
Years Ended June 30,
2005 2004 2003
Average expected term (years) 3.3 3.5 3.7
Risk-free interest rate 2.40% 2.20% 2.31%
Dividend yield 0% 0% 0%
Volatility 48.22% 54.15% 53.73%
Fair value of each
option granted at market $12.90 $17.79 $11.19
(m) Research and DevelopmentResearch and development costs are expensed as incurred.These expenses include the costs of the Company’s researchand development efforts, acquired in-process research anddevelopment, as well as costs incurred in connection with theCompany’s third party collaboration efforts. Pre-approvedmilestone payments made under contract research anddevelopment arrangements prior to regulatory approval areexpensed when the milestone is achieved. Once the productreceives regulatory approval, the Company records anysubsequent milestone payments as intangible assets.
(n) Advertising and Promotion CostsCosts associated with advertising and promotion areexpensed in the period in which the advertising is used andthese costs are included in selling, general and administrativeexpenses. Advertising and promotion expenses totaledapproximately $52,006, $45,637 and $21,377 for the yearsended June 30, 2005, 2004 and 2003, respectively.
(o) Earnings Per ShareThe following is a reconciliation of the numerators and denom-inators used to calculate earnings per common share (“EPS”) aspresented in the consolidated statements of operations:
(in thousands, except per share data) 2005 2004 2003
Numerator for basic and diluted
earnings per share – Net earnings $214,988 $123,103 $167,566
Earnings per common share – basic:
Numerator: Net earnings $214,988 $123,103 $167,566
Denominator: weighted average shares 103,180 101,823 99,125
Earnings per common share - basic $ 2.08 $ 1.21 $ 1.69
Earnings per common share – diluted:
Numerator: Net earnings $214,988 $123,103 $167,566
Denominator: weighted average
shares – diluted 106,052 106,661 103,592
Earnings per common share – diluted $ 2.03 $ 1.15 $ 1.62
Calculation of weighted average
common shares - diluted
Weighted average shares 103,180 101,823 99,125
Effect of dilutive options and warrants 2,872 4,838 4,467
Weighted average shares – diluted 106,052 106,661 103,592
Not included in the calculation of
diluted earnings per share because
their impact is antidilutive:
Stock options outstanding 84 57 1,899
(p) Fair Value of Financial InstrumentsCash, Accounts Receivable, Other Receivables and AccountsPayable – The carrying amounts of these items are a reason-able estimate of their fair value.
Marketable Securities – Marketable securities are recorded attheir fair value (see Note 7).
Other Assets – Investments that do not have a readily deter-minable market value are recorded at cost, as it is a reason-able estimate of fair value or current realizable value.
Long-Term Debt – The fair value at June 30, 2005 and 2004is estimated at $18,000 and $38,000, respectively (see Note11 for carrying value). Estimates were determined by dis-counting the future cash flows using rates currently availableto the Company.
The fair value estimates presented herein are based onpertinent information available to management as of June 30,2005. Although management is not aware of any factors thatwould significantly affect the estimated fair value amounts,such amounts have not been comprehensively revalued forpurposes of these financial statements since that date, andcurrent estimates of fair value may differ significantly fromthe amounts presented herein.
39

40
(q) Asset ImpairmentThe Company reviews the carrying value of its long-termassets for impairment annually and whenever events and cir-cumstances indicate that the carrying value of an asset maynot be recoverable from the estimated future cash flowsexpected to result from its use and eventual disposition. Incases where undiscounted expected future cash flows are lessthan the carrying value, an impairment loss is recognizedequal to an amount by which the carrying value exceeds thefair value of assets.
(r) New Accounting PronouncementsIn December 2004, the Financial Accounting Standards Board(the “FASB”) issued Statement of Financial AccountingStandard (“SFAS”) No. 123(R), “Share-Based Payment,”which revises SFAS No. 123, “Accounting for Stock-BasedCompensation” (“SFAS No. 123”), and supersedesAccounting Principles Board Opinion No. 25, “Accountingfor Stock Issued to Employees” (“APB No. 25”) and amendsSFAS No. 95 “Statement of Cash Flows.” SFAS No. 123(R)requires companies to recognize in their income statement thegrant-date fair value of stock options and other equity-basedcompensation issued to employees and directors. Pro formadisclosure is no longer an alternative. The Company adoptedSFAS No. 123(R) on July 1, 2005. This Statement requiresthat compensation expense for most equity-based awards berecognized over the requisite service period, usually the vest-ing period, while compensation expense for liability-basedawards (those usually settled in cash rather than stock) be re-measured to fair-value at each balance sheet date until theaward is settled. As permitted by SFAS No. 123, theCompany currently accounts for share-based payments toemployees and directors using the intrinsic value method and,as such, recognizes no compensation cost for equity-basedawards. Accordingly, the adoption of SFAS No. 123(R)’s fairvalue method will have an impact on the Company’s results ofoperations, although it will have no net impact on theCompany’s overall financial position or cash flows.
Currently, the Company uses the Black-Scholes formula toestimate the value of stock-based compensation granted toemployees and directors and expects to continue to use thisacceptable option valuation model in the future. BecauseSFAS No. 123(R) must be applied not only to new awards,but to previously granted awards that are not fully vested onthe effective date, compensation cost for some previouslygranted options will be recognized under SFAS No. 123(R).However, had the Company adopted SFAS No. 123(R) inprior periods, the impact of that Statement would haveapproximated the impact described in pro forma net incomeand earnings per share disclosed in Note 1(l) above.
SFAS No. 123(R) also requires the benefits of tax deduc-tions in excess of recognized compensation cost to be report-ed as a financing cash flow, rather than as an operating cashflow as currently required.
The Company will follow the modified prospectivemethod, which requires companies to record compensationexpense for (1) the non-vested portion of previously issuedawards that remain outstanding at the initial date of adop-tion and (2) any awards issued or modified after July 1,2005. Based on the adoption of the modified prospectivemethod, the Company expects to record a pre-tax stockbased compensation expense of approximately $27 million infiscal 2006. This amount represents previously issued awardsvesting in fiscal 2006 and 2006 fiscal year awards expectedto be granted.
In November 2004, the FASB issued Statement No. 151,“Inventory Costs, an amendment of ARB No. 43, Chapter4” (“SFAS No. 151”), to clarify the accounting for abnormalamounts of idle facility expense, freight, handling costs, andwasted materials (spoilage). ARB No. 43 allowed some ofthese “abnormal costs” to be carried as inventory whereasSFAS No. 151 requires that these costs be recognized inincome as incurred. This Statement is effective for theCompany’s fiscal year beginning July 1, 2005. The Companyhas evaluated the effect of adopting SFAS No. 151 and hasdetermined that this statement will not have a significanteffect on its current consolidated financial statements.
In December 2004, the FASB issued FSP FAS 109-1,“Application of FASB Statement No. 109, “Accounting forIncome Taxes,” to the Tax Deduction on QualifiedProduction Activities Provided by the American JobsCreation Act of 2004” (the “Act”), to provide accountingguidance on the appropriate treatment of tax benefits gener-ated by the enactment of the Act. The FSP requires that themanufacturer’s deduction be treated as a special deduction inaccordance with SFAS No. 109 and not as a tax rate reduc-tion. The Company assessed the impact of adopting FSP FAS109-1 on its consolidated financial statements and is expect-ed to realize a slight reduction in its effective tax rate duringfiscal 2006. The Act will be effective for the Company’s fiscalyear beginning July 1, 2005.
Note 2 – Acquisitions
Acquisition of a Urinary Incontinence ProductIn June 2002, the Company acquired certain assets andliabilities from Enhance Pharmaceuticals, Inc. As part of theEnhance acquisition, the Company acquired a ProductDevelopment and License Agreement with Schering AGpursuant to which Barr has been developing a vaginal ringurinary incontinence product that Schering intended to mar-ket and distribute worldwide. On March 31, 2004, Barr andSchering agreed that Barr would (i) acquire the worldwiderights to the product, (ii) forgo all remaining expensereimbursements, development milestones and royalties, (iii)assume all remaining responsibilities for the development and

41
marketing of the product and (iv) pay Schering a milestonepayment upon product approval and a royalty on futureproduct sales. As a result of this agreement, the cash pay-ments Barr expected to receive pursuant to the ProductDevelopment and License Agreement terminated as of March31, 2004. Accordingly, the Company wrote-off, as researchand development expense, the remaining $22,333 of netbook value associated with the initial intangible asset for theproduct license.
Acquisition of Products from WyethIn June 2003, the Company acquired from Wyeth productrights and a sublicense on a product in development. TheCompany also entered into a supply agreement for royaltypayments on future sales. Upon acquisition, $3,946 was writ-ten off as research and development expense because techno-logical feasibility had not been established and the projecthad no alternative future use.
Acquisition of Endeavor Pharmaceuticals, Inc.On November 20, 2003, the Company completed the acqui-sition of substantially all of the assets of EndeavorPharmaceuticals, Inc. (“Endeavor”). The Company acquiredEndeavor to broaden its line of hormone therapy and otherfemale healthcare products. In the transaction, the Companyacquired the currently pending New Drug Applications andintellectual property related to Endeavor’s Enjuvia™ synthet-ic conjugated estrogens product and two other female health-care products in early-stage development.
The total purchase price, including transaction costs of$517, was $35,600 and was allocated to acquired in-processresearch and development. This amount was written-offupon acquisition as research and development expensebecause the projects to develop the acquired products, whichhad not received approval from the FDA, were incompleteand had no alternative future use.
The operating results of Endeavor are included in theCompany’s consolidated financial statements subsequent tothe November 20, 2003 acquisition date.
Acquisition of Women’s Capital CorporationIn February 2004, the Company acquired 100% of the out-standing shares of Women’s Capital Corporation (“WCC”), aprivately held company that marketed the prescription versionof Plan B®, an emergency oral contraceptive product and hadfiled an application with the FDA for an over-the-counter ver-sion of Plan B. The total purchase price, including acquisitioncosts of $198 and net of cash acquired, was $12,273. In addi-
tion, at the time of the purchase, the Company made a pay-ment of $6,690, including principal and interest, to settle anote payable assumed from WCC as part of the acquisition.The fair values of the assets acquired and liabilities assumedin connection with the acquisition were:
Current assets $ 885
Deferred tax assets 3,201
Intangible assets 2,200
Goodwill 4,610
In-process research and development 10,300
Total assets acquired 21,196
Current liabilities 1,423
Debt 7,500
Total liabilities assumed 8,923
Net assets acquired $12,273
Cash paid, net of cash acquired $ 5,773
Note issued to WCC stockholders 6,500
Purchase price $12,273
An intangible asset of $2,200 representing the fair value ofthe currently marketed prescription version of Plan B wasamortized over one year. An acquired in-process research anddevelopment asset in the amount of $10,300, representing theestimated fair value of the unapproved over-the-counter versionof Plan B, was written-off upon acquisition as research anddevelopment expense because the project was incomplete andhad no alternative future use. The difference between the fairvalue of the net assets acquired and the purchase price resultedin goodwill of $4,610. The goodwill and in-process researchand development amounts are not deductible for tax purposes.
The operating results of WCC are included in theCompany’s consolidated financial statements subsequent tothe February 25, 2004 acquisition date. WCC’s results ofoperations prior to the acquisition date were not significant inrelation to the Company’s results of operations.
Acquisition of Certain Assets from Gynetics, Inc.In February 2004, the Company paid $4,200 to purchasecertain assets from Gynetics, Inc. that were being used todevelop, manufacture, distribute, promote, market, use andsell the emergency oral contraceptive known as Preven®
and all rights to an additional emergency oral contraceptiveproduct. The transaction also terminated the Company’sobligations under a non-compete agreement between Barrand Gynetics that would have prevented the Company fromacquiring WCC. As part of the purchase, the Companyagreed to pay Gynetics a royalty on Plan B sales until royaltypayments equal $2,500. The Company has consolidated itsemergency contraception business in the Plan B product.Accordingly, for the year ended June 30, 2004, the Companyrecorded an expense for the $4,200 purchase price as selling,general and administrative expense.

42
Bayer elected to make payments rather than supply theCompany with Ciprofloxacin. Barr recognized the amountsdue under the Supply Agreement as such amounts were real-ized based on the outcome of Bayer’s election. The amountsrealized are reported as proceeds from patent challenge settle-ment. On June 9, 2003, the Company began distributingCiprofloxacin tablets.
Note 4 – Other Receivables
Included in other receivables at June 30, 2004 was a $47,517receivable from Bayer that was collected during the quarterended September 30, 2004.
Note 5 – Inventories, net
The components of inventory are as follows:
June 30,
2005 2004
Raw materials and supplies $ 79,120 $ 86,238
Work-in-process 16,405 17,449
Finished goods 42,113 46,565
$137,638 $150,252
Note 6 – Property, Plant and Equipment, net
The major categories of the Company’s property, plant andequipment are as follows:
June 30,
2005 2004
Land $ 7,461 $ 7,299
Buildings and improvements 135,737 135,636
Machinery and equipment 189,906 175,007
Leasehold improvements 8,414 5,989
Construction in progress 37,584 19,547
379,102 343,478
Less: accumulated
depreciation and amortization (129,617) (106,647)
$249,485 $236,831
Depreciation expense was $31,591, $25,678 and$19,547 for the years ended June 30, 2005, 2004 and 2003,respectively.
Note 7 – Marketable Securities
The Company’s investments in marketable securities are pri-marily classified as “available for sale” and, accordingly, arerecorded at current market value with offsetting adjustmentsto shareholders’ equity, net of income taxes. During fiscal2005, the Company concluded that it was appropriate toreclassify its investment in auction rate securities as short-term marketable securities. Previously, such investments hadbeen classified on the balance sheet as cash and cash equiva-lents. Accordingly, the Company has revised its June 30,2004 consolidated balance sheet to reclassify auction ratesecurities in the amount of $391,370 from cash and cash
Acquisition of Products from Galen (Chemicals) LimitedIn March 2004, the Company acquired from Galen (Chemicals)Limited the exclusive rights to manufacture and marketLoestrin® products in the United States and Loestrin andMinestrin® products in Canada for a $45,000 cash payment.These product rights are recorded as other intangible assetson the consolidated balance sheets and are being amortizedover an estimated useful life of 10 years (see Note 8).
Acquisition of Product from Eastern VirginiaMedical SchoolIn September 2004, the Company exercised its option andpaid $19,250 to buy-out the future royalty interests on cer-tain extended cycle oral contraception products, includingSEASONALE, from the former patent holder for SEASONALE.This payment is recorded as other intangible assets on theconsolidated balance sheets and are being amortized over anestimated useful life of 15 years (see Note 8).
Acquisition of Products from King Pharmaceuticals, IncIn November 2004 and December 2004, the Companyacquired the exclusive rights in the United States for Prefest®
Tablets and Nordette® Tablets from King Pharmaceuticals, Inc.for $15,000 and $12,000, respectively. These product rights arerecorded as other intangible assets on the consolidated balancesheets and are being amortized over an estimated useful life of15 and 5 years, respectively (see Note 8).
Note 3 – Proceeds From Patent Challenge
In January 1997, Bayer AG, Bayer Corporation (collectively,“Bayer”) and the Company agreed to settle the then pendinglitigation regarding Bayer’s patent protecting Ciprofloxacinhydrochloride. Under the settlement agreement, the Companywithdrew its patent challenge by amending its AbbreviatedNew Drug Application (“ANDA”) from a paragraph IV cer-tification (claiming invalidity) to a paragraph III certification(seeking approval upon patent expiry) and acknowledged thevalidity and enforceability of the Ciprofloxacin patent. Asconsideration for this settlement, the Company received anon-refundable payment of $24,550 in January 1997, whichit recorded as proceeds from patent challenge settlement.Concurrent with the Settlement Agreement, the Companyalso signed a contingent, non-exclusive Supply Agreement(“Supply Agreement”) with Bayer that ended at patent expiryin December 2003.
Under the terms of the Supply Agreement, until June 9,2003, Bayer, at its sole option could either (i) allow Barr andAventis, the contractual successor to Barr’s joint venture part-ner in the Cipro patent challenge case, to purchase, at a pre-determined discount to Bayer’s then selling price, quantitiesof Ciprofloxacin for resale under market conditions or (ii)make quarterly cash payments as defined in the Agreement.
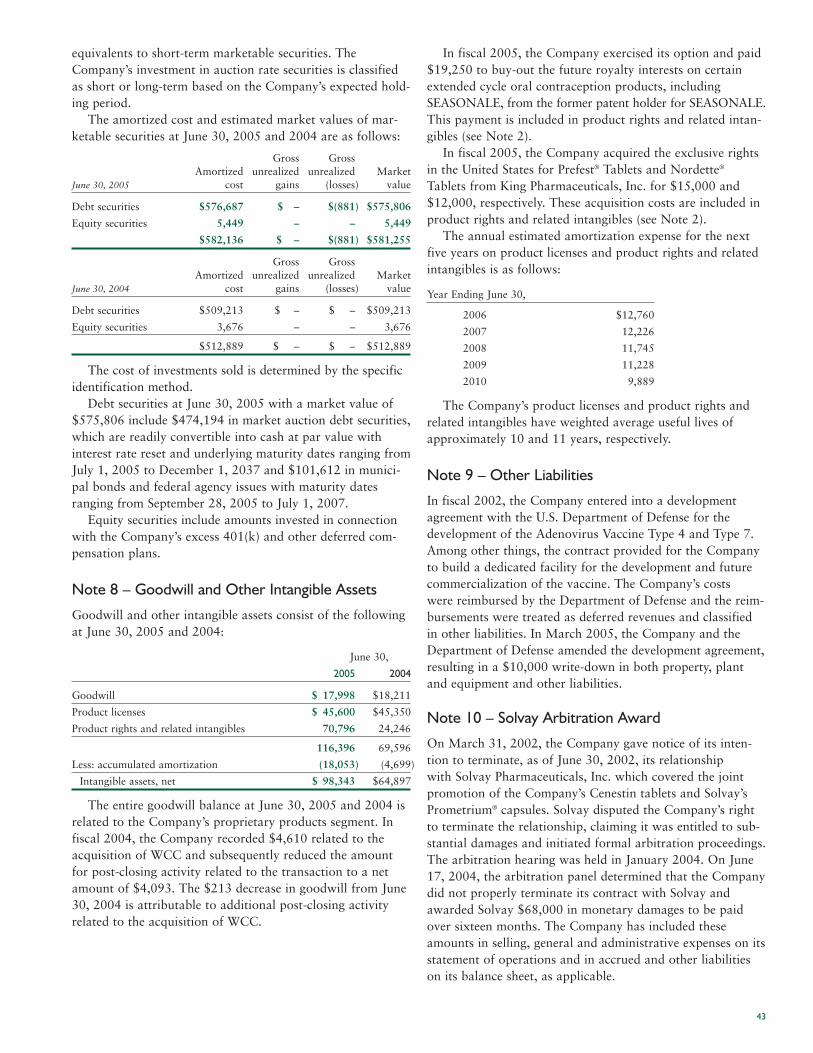
43
In fiscal 2005, the Company exercised its option and paid$19,250 to buy-out the future royalty interests on certainextended cycle oral contraception products, includingSEASONALE, from the former patent holder for SEASONALE.This payment is included in product rights and related intan-gibles (see Note 2).
In fiscal 2005, the Company acquired the exclusive rightsin the United States for Prefest® Tablets and Nordette®
Tablets from King Pharmaceuticals, Inc. for $15,000 and$12,000, respectively. These acquisition costs are included inproduct rights and related intangibles (see Note 2).
The annual estimated amortization expense for the nextfive years on product licenses and product rights and relatedintangibles is as follows:
Year Ending June 30,
2006 $12,760
2007 12,226
2008 11,745
2009 11,228
2010 9,889
The Company’s product licenses and product rights andrelated intangibles have weighted average useful lives ofapproximately 10 and 11 years, respectively.
Note 9 – Other Liabilities
In fiscal 2002, the Company entered into a developmentagreement with the U.S. Department of Defense for thedevelopment of the Adenovirus Vaccine Type 4 and Type 7.Among other things, the contract provided for the Companyto build a dedicated facility for the development and futurecommercialization of the vaccine. The Company’s costswere reimbursed by the Department of Defense and the reim-bursements were treated as deferred revenues and classifiedin other liabilities. In March 2005, the Company and theDepartment of Defense amended the development agreement,resulting in a $10,000 write-down in both property, plantand equipment and other liabilities.
Note 10 – Solvay Arbitration Award
On March 31, 2002, the Company gave notice of its inten-tion to terminate, as of June 30, 2002, its relationshipwith Solvay Pharmaceuticals, Inc. which covered the jointpromotion of the Company’s Cenestin tablets and Solvay’sPrometrium® capsules. Solvay disputed the Company’s rightto terminate the relationship, claiming it was entitled to sub-stantial damages and initiated formal arbitration proceedings.The arbitration hearing was held in January 2004. On June17, 2004, the arbitration panel determined that the Companydid not properly terminate its contract with Solvay andawarded Solvay $68,000 in monetary damages to be paidover sixteen months. The Company has included theseamounts in selling, general and administrative expenses on itsstatement of operations and in accrued and other liabilitieson its balance sheet, as applicable.
equivalents to short-term marketable securities. TheCompany’s investment in auction rate securities is classifiedas short or long-term based on the Company’s expected hold-ing period.
The amortized cost and estimated market values of mar-ketable securities at June 30, 2005 and 2004 are as follows:
Gross GrossAmortized unrealized unrealized Market
June 30, 2005 cost gains (losses) value
Debt securities $576,687 $ – $(881) $575,806
Equity securities 5,449 – – 5,449
$582,136 $ – $(881) $581,255
Gross GrossAmortized unrealized unrealized Market
June 30, 2004 cost gains (losses) value
Debt securities $509,213 $ – $ – $509,213
Equity securities 3,676 – – 3,676
$512,889 $ – $ – $512,889
The cost of investments sold is determined by the specificidentification method.
Debt securities at June 30, 2005 with a market value of$575,806 include $474,194 in market auction debt securities,which are readily convertible into cash at par value withinterest rate reset and underlying maturity dates ranging fromJuly 1, 2005 to December 1, 2037 and $101,612 in munici-pal bonds and federal agency issues with maturity datesranging from September 28, 2005 to July 1, 2007.
Equity securities include amounts invested in connectionwith the Company’s excess 401(k) and other deferred com-pensation plans.
Note 8 – Goodwill and Other Intangible Assets
Goodwill and other intangible assets consist of the followingat June 30, 2005 and 2004:
June 30,
2005 2004
Goodwill $ 17,998 $18,211
Product licenses $ 45,600 $45,350
Product rights and related intangibles 70,796 24,246
116,396 69,596
Less: accumulated amortization (18,053) (4,699)
Intangible assets, net $ 98,343 $64,897
The entire goodwill balance at June 30, 2005 and 2004 isrelated to the Company’s proprietary products segment. Infiscal 2004, the Company recorded $4,610 related to theacquisition of WCC and subsequently reduced the amountfor post-closing activity related to the transaction to a netamount of $4,093. The $213 decrease in goodwill from June30, 2004 is attributable to additional post-closing activityrelated to the acquisition of WCC.
44
Note 11 – Long-term Debt
A summary of long-term debt is as follows:
June 30,
2005 2004
Senior Unsecured Notes(a) $12,000 $17,429
Mortgage notes(b) – 13,200
Note Due to WCC Shareholders(c) 6,500 6,500
18,500 37,129
Less: Current installments of long-term debt (4,000) (7,029)
Total long-term debt $14,500 $30,100
(a)The Senior Unsecured Note consists of a $12,000, 7.01% Note dueNovember 18, 2007. Annual principal payments under the Note amountto $4,000 in each of fiscal years 2006, 2007 and 2008.
The Senior Unsecured Note contains certain covenants including, amongothers, a restriction on dividend payments in excess of $10,000 plus75% of consolidated net earnings subsequent to June 30, 1997.
(b)In February 2005, the Company made a $12,200 payment in completesatisfaction of its mortgage note.
(c)In February 2004, the Company acquired all of the outstanding shares ofWCC. In connection with that acquisition, a four-year $6,500 promis-sory note was issued to WCC. The note bears interest at 2%. The entireprincipal amount and all accrued interest is payable on February 25,2008 (see Note 2).
In August 2004, the Company entered into a new$175,000 revolving credit facility that replaced its prior$40,000 facility. This new facility has a five-year term thatexpires on August 30, 2009. The Company may use thefunds available under the new credit facility for workingcapital, capital expenditures, acquisitions and other generalcorporate purposes. As of June 30, 2005, there were noborrowings outstanding under this facility.
Principal maturities of existing long-term debt for the nextfive years and thereafter are as follows:
Year Ending June 30,
2006 $ 4,000
2007 4,000
2008 10,500
2009 –
2010 –
Note 12 – Related-party Transactions
Dr. Bernard C. Sherman and Jacob M. KayThe Company purchases bulk pharmaceutical materials andsells certain pharmaceutical products and bulk pharmaceuticalmaterials to companies owned or controlled by Dr. BernardC. Sherman. Dr. Sherman was a member of the Company’sBoard of Directors until October 24, 2002 and is the principalstockholder of Sherman Delaware, Inc. which owned approxi-
mately 8.5% of the Company’s outstanding common stock atJune 30, 2005. In addition, Jacob M. Kay, a member of theBoard of Directors, is president of Apotex, Inc., one of thecompanies owned or controlled by Dr. Sherman.
The Company entered into an agreement with Apotex Inc.to share litigation and related costs in connection with theCompany’s Fluoxetine (generic Prozac) patent challenge.Under this agreement certain costs were shown as a reductionto operating expenses while other costs were included as costof sales. Separately, the Company receives a royalty on aproduct marketed and sold by Apotex Inc.
The table below sets forth the statement of operations fortransactions with companies owned or controlled by Dr.Sherman.
Years Ended June 30,
2005 2004 2003
Purchases from the Sherman Cos. $ 5,575 $2,808 $ 3,583
Sales to the Sherman Cos. $10,149 $9,486 $12,727
Recovery of shared litigation costs
included in operating expenses $ 77 $1,004 $ 585
Profit split charged to cost of goods $ 1,027 $3,680 $ 1,440
Royalty revenue $ 216 $ 295 $ –
Note 13 – Income Taxes
A summary of the components of income tax expense is asfollows:
Year Ended June 30,
2005 2004 2003
Current:
Federal $101,355 $101,477 $77,615
State 6,482 18,097 10,911
$107,837 $119,574 $88,526
Deferred:
Federal $ 4,441 $ (41,348) $ 9,010
State 2,610 (6,889) (2,387)
7,051 (48,237) 6,623
Total $114,888 $ 71,337 $95,149
The provision for income taxes differs from amountscomputed by applying the statutory federal income tax rateto earnings before income taxes due to the following:
Year Ended June 30,
2005 2004 2003
Federal income taxes at statutory rate $115,457 $68,054 $91,950
State income taxes,
net of federal income tax effect 9,092 6,687 8,207
Tax credits (6,900) (5,900) (1,000)
Write-off of in-process research
and development – 3,605 –
Other, net (2,761) (1,109) (4,008)
$114,888 $71,337 $95,149

45
The temporary differences that give rise to deferred taxassets and liabilities as of June 30, 2005 and 2004 are asfollows:
2005 2004
Deferred tax assets:
Net operating loss $ 3,677 $ 5,113
Receivable reserves 17,833 29,888
Inventory 2,865 2,707
Warrants issued 16,366* –
Capital loss carryforward 2,864 3,122
Amortization of intangibles/goodwill 60,467 28,673
Deferred revenue 7,239 7,400
Natural Biologics loan – 6,673
Tax credit carryforward – 15
Investments 320* –
Solvay litigation 4,003 20,226
Other 7,108 6,043
Total deferred tax assets 122,742 109,860
Deferred tax liabilities:
Plant and equipment (24,905) (19,889)
Other (3,452) (4,196)
Total deferred tax liabilities (28,357) (24,085)
Less valuation allowance (3,657) (4,682)
Net deferred tax asset $ 90,728 $ 81,093
*Changes reflected directly in equity.
At June 30, 2005 and 2004, as a result of certain acquisi-tions, the Company had cumulative regular net operating losscarryforwards of approximately $3,568 and $10,195, respec-tively, for federal and state income tax purposes, which willexpire in the years 2018 to 2023. There is an annual limita-tion on the utilization of the net operating loss carryforward,which is calculated under Internal Revenue Code Section 382.
The tax credit carryforward is primarily comprised ofcredits related to alternative minimum tax payments, whichhave no expiration.
The Company has established a valuation allowance toreduce the deferred tax asset recorded for certain tax credits,capital loss carryforwards, and certain net operating losscarryforwards. A valuation allowance is recorded becausebased on available evidence, it is more-likely-than-not that adeferred tax asset will not be realized. The valuationallowance reduces the deferred tax asset to the Company’sbest estimate of the net deferred tax asset that, more-likely-than-not, will be realized. The valuation allowance willbe reduced when and if the Company determines that thedeferred income tax assets are likely to be realized.Accordingly, during the year ended June 30, 2005, theCompany reduced the valuation allowance by a net of$1,018 due to the utilization of certain tax capital losses andthe write-off of certain deferred tax assets and related valua-tion allowances.
Note 14 – Shareholders’ Equity(Shares and Per Share amounts expressed in whole numbers)
Employee Stock Option PlansThe Company has three employee stock option plans, theBarr Pharmaceuticals, Inc. 2002 Stock and Incentive AwardPlan (the “2002 Option Plan”), the Barr Pharmaceuticals,Inc. 1993 Stock Incentive Plan (the “1993 Option Plan”) andthe Barr Pharmaceuticals, Inc. 1986 Option Plan, which wereapproved by the shareholders and which authorize the granti-ng of options to officers and employees to purchase theCompany’s common stock. On February 20, 2003, all sharesavailable for grant in the 1993 Option Plan were transferredto the 2002 Option Plan and all subsequent grants have beenmade under the 2002 Option Plan. Effective June 30, 1996,options were no longer granted under the 1986 Option Plan.For fiscal 2005, 2004 and 2003, there were no options thatexpired under this plan.
All options granted prior to June 30, 1996 under the 1993Option Plan and 1986 Option Plan, become exercisablebetween one and two years from the date of grant and expireten years after the date of grant except in cases of death ortermination of employment as defined in each Plan. Alloptions outstanding on October 24, 2001 became fully vest-ed upon completion of the Duramed merger. Options grantedafter October 24, 2001 are exercisable between one and fiveyears from the date of grant. Through fiscal 2000, no optionhad been granted under either the 1993 Option Plan or the1986 Option Plan at a price below the current market priceof the Company’s common stock on the date of grant.Options granted after February 20, 2003 become exercisablebetween one and three years from the date of grant andexpire ten years after the date of grant except in cases ofdeath or termination of employment.
In addition, the Company has options outstanding underthe terms of various former Duramed plans. These includethe 1986 Stock Option Plan (the “Duramed 1986 Plan”), the1988 Stock Option Plan (the “1988 Plan”), the 1997 StockOption Plan (the “1997 Plan”), and the 2000 Stock OptionPlan (the “2000 Plan”). All outstanding options under theDuramed plans, with the exception of options held by certainsenior executives of Duramed, vested as of October 24,2001, the effective date of the merger. Such options wereassumed by Barr under the same terms and conditions aswere applicable under the Duramed stock option plans underwhich the options were granted. The number of options andrelated exercise prices have been adjusted to a Barr equiva-lent number of options and exercise price pursuant to themerger. Subsequent to October 24, 2001, additional optionsare no longer granted under these Duramed plans.

46
attract and retain experienced directors. On February 20,2003, all shares available for grant under the 1993 Directors’Plan were transferred to the 2002 Directors’ Plan.
A summary of the activity for the three fiscal years endedJune 30, 2005, adjusted for the March 2004 and 2003 3-for-2 stock splits is as follows:
Weighted-AverageNo. of Shares Exercise Price
Outstanding at July 1, 2002 1,102,044 $14.77
Granted 101,250 26.76
Canceled (59,270) 32.87
Exercised (464,061) 9.75
Outstanding at June 30, 2003 679,963 18.40
Granted 118,125 49.02
Canceled – –
Exercised (154,499) 17.75
Outstanding at June 30, 2004 643,589 22.97
Granted 45,000 37.87
Canceled – –
Exercised (58,568) 5.28
Outstanding at June 30, 2005 630,021 $25.68
Available for grant
(2,798,438 authorized) 906,469
Exercisable at June 30, 2003 578,714 $16.94
Exercisable at June 30, 2004 576,089 $19.92
Exercisable at June 30, 2005 585,021 $24.74
Available for grant and authorized amounts are for the2002 Directors’ Plan only, because as of June 30, 2003,options are no longer granted under the 1993 Directors’ Planand the 1991 Duramed Directors’ Plan.
Employee Stock Purchase PlanDuring fiscal 1994, the shareholders ratified the adoption bythe Board of Directors of the 1993 Employee StockPurchase Plan (the “Purchase Plan”) to offer employees aninducement to acquire an ownership interest in the Company.The Purchase Plan permits eligible employees to purchase,through regular payroll deductions, an aggregate of1,518,750 shares of common stock at approximately 85% ofthe fair market value of such shares. Under the PurchasePlan, 159,620, 81,708 and 115,704 shares of common stockwere purchased during the years ended June 30, 2005, 2004and 2003, respectively.
WarrantsDuring 1999, in conjunction with an amendment to a financ-ing agreement, the Company granted to a bank warrants topurchase 63,410 shares of the Company’s common stock atan exercise price of $22.19. These warrants vested immedi-ately. In December 1999, the financing agreement wasamended to reset the exercise price of 50% of the warrantsto $15.62 per share. During 2000, based on an antidilutiveclause in the agreement, the number of warrants was adjust-ed to 66,340. The price of 33,426 warrants was adjusted to
A summary of the activity for the three fiscal years endedJune 30, 2005, adjusted for the March 2004 and 2003 3-for-2 stock splits, is as follows:
Weighted-AverageNo. of Shares Exercise Price
Outstanding at July 1, 2002 7,388,259 $16.43
Granted 2,109,333 26.74
Canceled (208,047) 27.92
Exercised (1,354,542) 12.57
Outstanding at June 30, 2003 7,935,003 19.51
Granted 1,779,545 43.01
Canceled (148,026) 28.74
Exercised (1,699,190) 11.82
Outstanding at June 30, 2004 7,867,332 26.26
Granted 1,419,300 35.41
Canceled (103,965) 37.60
Exercised (961,609) 15.46
Outstanding at June 30, 2005 8,221,058 $28.96
Available for grant
(20,067,188 authorized) 4,469,292
Exercisable at June 30, 2003 5,557,977 $16.79
Exercisable at June 30, 2004 4,839,386 $20.02
Exercisable at June 30, 2005 5,236,178 $24.57
Available for grant and authorized amounts are for the2002 Option Plan only, because as of June 30, 2003 optionsare no longer granted under any of the other option plansdiscussed above.
Non-Employee Directors’ Stock Option PlansDuring fiscal year 1994, the shareholders approved the BarrPharmaceuticals, Inc. 1993 Stock Option Plan for Non-Employee Directors (the “1993 Directors’ Plan”). All optionsgranted under the 1993 Directors’ Plan have ten-year termsand are exercisable at an option exercise price equal to themarket price of the common stock on the date of grant. Eachoption is exercisable on the date of the first annual share-holders’ meeting immediately following the date of grant ofthe option, provided there has been no interruption of theoptionee’s service on the Board before that date.
On October 24, 2002, the shareholders approved the BarrPharmaceuticals, Inc. 2002 Stock Option Plan for Non-Employee Directors (the “2002 Directors’ Plan”). This plan,among other things, enhances the Company’s ability to

47
$21.05 and the remaining 32,918 warrants were repriced to$15.03. In November 2001 and January 2002 a total of57,294 of the warrants were exercised. As of June 30, 2005,warrants for 9,046 shares were outstanding and remain exer-cisable until July 2009.
On May 12, 2000, in combination with the issuance ofSeries G preferred stock, the Company granted warrants topurchase 288,226 common shares at a price of $9.54 pershare. The warrants vested immediately. In April 2005 all288,226 warrants were exercised.
In March 2000, the Company issued warrants grantingDuPont the right to purchase 1,687,500 shares of Barr’scommon stock at $13.93 per share, and 1,687,500 shares at$16.89 per share, respectively. Each warrant was immediatelyexercisable. In March 2004, holders of these warrants exer-cised the warrants through a cashless exercise which resultedin the issuance of 2,340,610 shares of our common stock.
The following table summarizes information about stockoptions and warrants outstanding at June 30, 2005:
Options and Warrants Outstanding
WeightedRange of Number Average WeightedExercise Outstanding Remaining Average
Prices at 6/30/05 Contractual Life Exercise Price
$ 3.06 – 24.57 2,593,015 3.48 $ 13.39
25.26 – 33.70 2,232,002 6.89 27.79
33.91 – 37.87 2,253,615 7.90 35.57
37.91 – 51.61 1,781,493 8.15 43.50
8,860,125 6.40 $28.72
Options and Warrants Exercisable
Range of Number WeightedExercise Exercisable Average
Prices at 6/30/05 Exercise Price
$ 3.06 – 24.57 2,593,015 $ 13.39
25.26 – 33.70 1,681,269 28.05
33.91 – 37.87 907,265 36.26
37.91 – 51.61 648,696 43.97
5,830,245 $24.58
Note 15 – Savings and Retirement
The Company has a savings and retirement plan (the “401(k)Plan”) which is intended to qualify under Section 401(k) ofthe Internal Revenue Code. Employees are eligible to partici-pate in the 401(k) Plan in the first month following themonth of hire. Participating employees may contribute up toa maximum of 60% of their earnings before or after taxes,limited to a maximum of $14 for pre-tax contributions. The
Company is required, pursuant to the terms of its collectivebargaining agreement, to contribute to each union employee’saccount an amount equal to the 2% minimum contributionmade by such employee. The Company may, at its discretion,make cash contributions equal to a percentage of the amountcontributed by an employee to the 401(k) Plan up to a maxi-mum of 10% of such employee’s compensation. Participantsare always fully vested with respect to their own contribu-tions and any profits arising therefrom. Participants becomefully vested in the Company’s contributions and related earn-ings after five full years of employment.
The Company’s contributions to the 401(k) Plans were$7,650, $6,534 and $5,549 for the years ended June 30,2005, 2004 and 2003, respectively.
The Company has a non-qualified plan (“Excess Plan”) thatenables certain executives to defer up to 60% of their compen-sation in excess of the qualified plan. The Company may, at itsdiscretion, contribute a percentage of the amount contributedby the individuals covered under this Excess Plan to a maxi-mum of 10% of such individual’s compensation. In fiscal years2005, 2004 and 2003, the Company chose to make contribu-tions at the 10% rate to this plan. As of June 30, 2005 and2004, the Company had an asset and matching liability for theExcess Plan of $5,141 and $3,563, respectively.
The Company has an unfunded pension plan covering twonon-employee directors of Duramed who were elected priorto 1998 and who had served on Duramed’s Board for at leastfive years. At the time of the merger with Barr, two Durameddirectors were eligible to receive benefits. The plan providesan annual benefit, payable monthly over each director’s life,from the time a participating director ceased to be a memberof the Board, equal to 85% and 60%, respectively, of thedirector’s most recent annual Board fee, as adjusted annuallyto reflect changes in the Consumer Price Index. As of June30, 2005 and 2004, the Company has recorded $447 and$466, respectively, as a long-term liability representing thepresent value of the estimated future benefit obligation to theeligible directors. The right of a director to receive benefitsunder the plan is forfeited if the director engages in anyactivity determined by the Board to be contrary to the bestinterests of the Company.
In October 2003, the Board of Directors approved theBarr Pharmaceuticals, Inc. Non-Qualified DeferredCompensation Plan (the “Plan”) that was adopted effectiveNovember 1, 2003. The Plan provides for certain executivesto defer all or a portion of their salary or bonus for a partic-ular calendar year. In addition, the Company will make amatching contribution subject to certain limitations asdefined in the Plan. The matching contribution as well as theemployee deferral are invested in the Plan as directed by theparticipant, and are payable on the terms and subject to theconditions provided in the Plan. As of June 30, 2005 and2004, the Company had an asset and matching liability forthe Plan of $308 and $114, respectively.

48
Note 16 – Other Income (Expense), Net
A summary of other income (expense), net is as follows:
Year Ended June 30,
2005 2004 2003
Proceeds from insurance settlement $4,600 $ – $ –
Loss on limited partnerships (796) (1,346) –
Other 59 (187) (128)
Total other income (expense), net $3,863 $(1,533) $(128)
Note 17 – Commitments and Contingencies
LeasesThe Company is party to various leases, which relate to therental of office facilities and equipment. The Companybelieves it will be able to extend such leases, if necessary. Thetable below shows the future minimum rental payments,exclusive of taxes, insurance and other costs under noncan-cellable long-term lease commitments at June 30, 2005.
Year Ending June 30,
2006 2007 2008 2009 2010 Thereafter
Operating leases $4,359 $3,981 $3,379 $3,281 $3,189 $15,586
Capital leases 1,692 856 204 95 32 –
Minimum lease
payments $6,051 $4,837 $3,583 $3,376 $3,221 $15,586
Investment in Venture FundsDuring the second quarter of fiscal 2004, the Company madeinvestments, as a limited partner, in two separate venturecapital funds as part of its continuing efforts to identify newproducts, new technologies and new licensing opportunities.The Company has committed up to a total of $15,000 foreach of these funds over a five and 10-year period, as definedby each fund. As of June 30, 2005 and June 30, 2004, theCompany had invested $5,941 and $3,500, respectively, inthese funds. The Company accounts for these investmentsusing the equity method of accounting.
Employment AgreementsThe Company has entered into employment agreements withcertain key employees. The current terms of these agreementsexpire at various dates through 2007, subject to certainrenewal provisions.
Product Liability InsuranceThe Company’s insurance coverage at any given time reflectsmarket conditions, including cost and availability, existing atthe time it is written, and the decision to obtain insurancecoverage or to self-insure varies accordingly. If the Companywere to incur substantial liabilities that are not covered byinsurance or that substantially exceed coverage levels oraccruals for probable losses, there could be a material adverseeffect on its financial statements in a particular period.
The Company uses a combination of self-insurance andtraditional third-party insurance policies to cover productliability claims. On September 30, 2004, the Company electedto terminate a “finite-risk” insurance arrangement that it hadin place for two years, and in connection with such termina-tion increased its traditional third-party product liabilitycoverage, as discussed below.
The Company maintains third-party insurance thatprovides coverage, subject to specified co-insurance require-ments, for the cost of product liability claims arising duringthe current policy period, which began on October 1, 2004and ends on September 30, 2005, between an aggregateamount of $25,000 and $75,000. The Company is self-insured for up to the first $25,000 of costs incurred relatingto product liability claims arising during the current policyperiod. In addition, the Company has obtained extendedreporting periods under previous policies for claims arisingprior to the current policy period. The current period andextended reporting period policies exclude certain products;the Company would be responsible for all product liabilitycosts arising from these excluded products.
The Company has been incurring significant legal costsassociated with its hormone therapy litigation (see below). Todate, these costs have been covered under extended reportingperiod policies that provide up to $25,000 of coverage. As ofJune 30, 2005, there was approximately $13,000 of coverageremaining under these policies. The Company has recorded areceivable for legal costs incurred and expected to be recov-ered under these policies. Once the coverage from theseextended reporting period policies has been exhausted, futurelegal and settlement costs will be covered by a combinationof self-insurance and other third-party insurance layers.
Indemnity ProvisionsFrom time-to-time, in the normal course of business, theCompany agrees to indemnify its suppliers, customers andemployees concerning product liability and other matters.For certain product liability matters, the Company hasincurred legal defense costs on behalf of certain of itscustomers under these agreements. No amounts have beenrecorded in the financial statements for probable losses withrespect to the Company’s obligations under such agreements.
In September 2001, Barr filed an ANDA for the genericversion of Aventis’ Allegra® tablets. Aventis has filed a law-suit against Barr claiming patent infringement. A trial datefor the patent litigation has not been scheduled, but trial isexpected in early 2006. In June 2005, the Company enteredinto an agreement with Teva Pharmaceuticals USA, Inc.which allows Teva to manufacture and launch Teva’s genericversion of Aventis’ Allegra® product during the Company’s180 day exclusivity period, in exchange for Teva’s obligationto pay the Company a specified percentage of Teva’s operat-ing profit, as defined, earned on sales of the product. TheCompany intends to recognize the amounts it earns underthis arrangement at the time Teva ships product to itscustomers and will classify such amounts on the “Alliance,development and other” revenue line of the statement ofoperations. The agreement also provides that each company

49
these matters, litigation is inherently unpredictable.Consequently, the Company could in the future incur judg-ments or enter into settlements that could have a materialadverse effect on its consolidated financial statements in aparticular period.
Summarized below are the more significant matters pend-ing to which the Company is a party. As of June 30, 2005,the Company’s reserve for the liability associated with claimsor related defense costs for these matters, other than theDesogestrel/Ethinyl Estradiol matter described below, is notmaterial.
Patent MattersDesogestrel/Ethinyl Estradiol SuitIn May 2000, the Company filed an abbreviated new drugapplication (“ANDA”) seeking approval from the FDA tomarket the tablet combination of desogestrel/ethinyl estradioltablets and ethinyl estradiol tablets, the generic equivalent ofOrganon Inc.’s Mircette® oral contraceptive regimen. TheCompany notified Bio-Technology General Corp. (“BTG”),the owner of the patent for the Mircette product, pursuant tothe provisions of the Hatch-Waxman Act and BTG filed apatent infringement action in the United States DistrictCourt for the District of New Jersey seeking to prevent theCompany from marketing the tablet combination. InDecember 2001, the District Court granted summaryjudgment in favor of the Company, finding that its genericproduct did not infringe the patent at issue in the case. BTGappealed the District Court’s decision. In April 2002, theCompany launched its Kariva® product, the generic versionof Mircette. In April 2003, the U.S. Court of Appeals for theFederal Circuit reversed the District Court’s decision grantingsummary judgment in the Company’s favor and remandedthe case to the District Court for further proceedings.
In July 2003, BTG (now Savient) filed an amendedcomplaint adding Organon (Ireland) Ltd. and Organon USAas plaintiffs. The amended complaint seeks damages andenhanced damages based upon willful infringement. TheCompany filed an answer to BTG’s amended complaint inJuly 2003. The Company believes that it has not infringedBTG’s patent and because of this, it continues to market andsell Kariva. Nevertheless, Organon seeks to recover lostprofits or a reasonable royalty of up to $100,000 from thedate of launch through June 30, 2005. If BTG and Organonare successful, the Company could be liable for damages forpatent infringement and the damages could be significant.In addition, an adverse ruling likely would prohibit theCompany from continuing to sell its Kariva product.
On June 15, 2005 the Company entered into a non-bind-ing Letter of Intent (“LOI”) with Organon (Ireland) Ltd.,Organon USA and Savient Pharmaceuticals, Inc. to acquirethe NDA for Mircette, obtain a royalty free patent license topromote Mircette in the United States and dismiss all pend-ing litigation between the parties in exchange for a paymentby the Company of up to $155,000. The parties will notbe contractually bound unless and until they negotiate and
will indemnify the other for a portion of any patent infringe-ment damages they might incur, so that the parties will shareany such damage liability in proportion to their respectiveshares of Teva’s net profits.
On September 1, 2005, Teva launched its generic versionof Allegra. At September 30, 2005, the Company, in accor-dance with FASB Interpretation No. 45 “Guarantor’sAccounting and Disclosure Requirements for Guarantees,Including Indirect Guarantees of Indebtedness to Others”may be required to record a liability to reflect the fair valueof the indemnification obligation it has undertaken. Becausethe Company continues to believe that it and Teva have meri-torious defenses in the litigation, the Company expects thisliability to be significantly smaller than the income it expectsto earn from the arrangement with Teva.
Litigation SettlementOn October 22, 1999, the Company entered into a settlementagreement with Schein Pharmaceutical, Inc. (now part ofWatson Pharmaceuticals, Inc.) relating to a 1992 agreementregarding the pursuit of a generic conjugated estrogens prod-uct. Under the terms of the settlement, Schein relinquishedany claim to rights in Cenestin in exchange for a payment of$15,000 made to Schein in 1999. An additional $15,000payment is required under the terms of the settlement ifCenestin achieves total profits (product sales less product-specific cost of goods sold, sales and marketing and otherrelevant expenses) of greater than $100,000 over any fiveyear or less period prior to October 22, 2014.
Litigation MattersThe Company is involved in various legal proceedings inci-dental to its business, including product liability, intellectualproperty and other commercial litigation and antitrustactions. The Company records accruals for such contingen-cies to the extent that it concludes a loss is probable and theamount can be reasonably estimated. Additionally, theCompany records insurance receivable amounts from thirdparty insurers when appropriate.
Many claims involve highly complex issues relating tocausation, label warnings, scientific evidence and other mat-ters. Often these issues are subject to substantial uncertaintiesand therefore, the probability of loss and an estimate of theamount of the loss are difficult to determine. The Company’sassessments are based on estimates that the Company, inconsultation with outside counsel, believes are reasonable.Although the Company believes it has substantial defenses in

50
execute definitive agreements and the pending anti-trust reviewis satisfactorily resolved, as discussed below. If consummated,the transaction would permit the Company to promoteMircette through its Duramed sales force, which could increasesales of both Mircette and Kariva. If the transaction is not con-summated, the Company expects to continue to vigorouslydefend its position in the Mircette litigation.
In July 2005, the parties made the required Hart ScottRodino filings with the Federal Trade Commission (“FTC”)regarding the proposed transaction. On August 1, 2005, theFTC issued a “second request,” asking the Company andOrganon to provide detailed information concerning theproposed transaction. The second request signals possibleFTC concerns about the proposed transaction and createsadditional uncertainty whether the transaction will be con-summated on the proposed, or other terms.
The proposed transaction is contingent upon satisfactorycompletion of the FTC’s Hart Scott Rodino review and thenegotiation of mutually satisfactory definitive agreements.However, because the proposed transaction includes, as oneof its components, a payment in settlement of litigation, it ispresumed under Generally Accepted Accounting Principles(“GAAP”) to give rise to a “probable loss,” as defined inSFAS No. 5, “Accounting for Contingencies”. In consultationwith outside advisors and based on preliminary valuations ofthe assets the Company would acquire if the transactioncloses on the terms presently contemplated, the Company hasrecorded a charge of $63,238 as of June 30, 2005 to reflectthe proposed litigation settlement. The Company may reversethe charge, in whole or in part, in the future if the transac-tion does not close and it prevails in the litigation or isultimately held liable for a lesser amount of damages. If thetransaction does not close and an unfavorable verdict wereto be rendered against the Company at trial, the ultimateamount of damages payable by it could be significantly moreor less than the $63,238 charge it has recorded in connectionwith the propose litigation settlement.
Desmopressin Acetate SuitIn July 2002, the Company filed an ANDA seeking approvalfrom the FDA to market desmopressin acetate tablets, thegeneric equivalent of Aventis’ DDAVP product. TheCompany notified Ferring AB, the patent holder, and Aventispursuant to the provisions of the Hatch-Waxman Act inOctober 2002. Ferring and Aventis filed a suit in the UnitedStates District Court for the Southern District of New Yorkin December 2002 for infringement of one of the four patentslisted in the Orange Book for desmopressin acetate tablets,seeking to prevent the Company from marketing desmo-pressin acetate tablets until the patent expires in 2008. InJanuary 2003, the Company filed an answer and counter-claim asserting non-infringement and invalidity of all fourlisted patents. In January 2004, Ferring amended theircomplaint to add a claim of willful infringement.
On February 7, 2005, the court granted summary judg-ment in the Company’s favor. Ferring and Aventis haveappealed. On July 5, 2005, the Company launched its genericproduct. If Ferring and Aventis are successful in reversing thegrant of summary judgment and ultimately prevail in thecase, the Company could be liable for damages for patentinfringement that could exceed the Company’s profit on thesale of Desmopressin Acetate. In addition, an adverse rulinglikely would prohibit the Company from continuing to sellits Desmopressin Acetate product.
Product Liability MattersHormone Therapy LitigationThe Company has been named as a defendant in approxi-mately 3,100 personal injury product liability cases broughtagainst the Company and other manufacturers by plaintiffsclaiming that they suffered injuries resulting from the use ofcertain estrogen and progestin medications prescribed to treatthe symptoms of menopause. The cases against the Companyinvolve either or both of the Company’s Cenestin product orthe use of the Company’s medroxyprogesterone acetate prod-uct, which typically has been prescribed for use in conjunc-tion with Premarin or other hormone therapy products. Allof these products remain approved by the FDA and continueto be marketed and sold to customers. While the Companyhas been named as defendants in these cases, fewer than athird of the complaints actually allege the plaintiffs took aproduct manufactured by the Company, and the Company’sexperience to date suggests that, even in these cases, a highpercentage of the plaintiffs will be unable to demonstrateactual use of a Company product. For that reason, by theend of June 2005, nearly 1,500 of the 3,100 cases had beendismissed and, based on discussions with the Company’soutside counsel, several hundred more are expected to bedismissed in the near future.
The Company believes it has viable defenses to the allega-tions in the complaints and is defending the actions vigorously.
Antitrust MattersInvamed, Inc./Apothecon, Inc.In February 1998, Invamed, Inc. and Apothecon, Inc., bothof which have since been acquired by Sandoz, Inc., which is asubsidiary of Novartis AG, named the Company and severalothers as defendants in lawsuits filed in the United StatesDistrict Court for the Southern District of New York, alleg-ing violations of antitrust laws and also charging that theCompany unlawfully blocked access to the raw materialsource for Warfarin Sodium. The two actions have been con-solidated. On May 10, 2002, the District Court granted sum-mary judgment in the Company’s favor on all antitrust claimsin the case, but found that the plaintiffs could proceed totrial on their allegations that the Company interfered with analleged raw material supply contract between Invamed andthe Company’s raw material supplier. Invamed andApothecon appealed the District Court’s decision to theUnited States Court of Appeals for the Second Circuit. Trialon the merits was stayed pending the outcome of the appeal.

51
On October 18, 2004, the Court of Appeals reversed theDistrict Court’s grant of summary judgment and held that theplaintiffs have raised triable issues of material fact on theirantitrust claims.
The Company believes that the suits filed by Invamed andApothecon are without merit and is vigorously defending itsposition. The plaintiffs were seeking damages of approximate-ly $120,000 as of December 31, 2000, and if successful ontheir underlying claims may seek to obtain treble damages.
Ciprofloxacin (Cipro®) Antitrust Class ActionsThe Company has been named as a co-defendant with BayerCorporation, The Rugby Group, Inc. and others in approxi-mately 38 class action complaints filed in state and federalcourts by direct and indirect purchasers of Ciprofloxacin(Cipro®) from 1997 to the present. The complaints allegedthat the 1997 Bayer-Barr patent litigation settlement agree-ment was anti-competitive and violated federal antitrust lawsand/or state antitrust and consumer protection laws. A priorinvestigation of this agreement by the Texas AttorneyGeneral’s Office on behalf of a group of state AttorneysGeneral was closed without further action in December 2001.
The lawsuits included nine consolidated in California statecourt, one in Kansas state court, one in Wisconsin statecourt, one in Florida state court, and two consolidated inNew York state court, with the remainder of the actionspending in the United States District Court for the EasternDistrict of New York for coordinated or consolidated pre-trial proceedings (the “MDL Case”). On March 31, 2005,the Court in the MDL case granted summary judgment in theCompany’s favor and dismissed all of the federal actionsbefore it. On June 7, 2005, plaintiffs filed notices of appealto the United States Court of Appeals, but a briefing scheduleand argument date have not yet been set.
On September 19, 2003, the Circuit Court for the Countyof Milwaukee dismissed the Wisconsin state class action forfailure to state a claim for relief under Wisconsin law.Plaintiffs appealed, but the appeal has been stayed pending adecision by the Wisconsin Supreme Court in another caseinvolving similar legal issues. On October 17, 2003, theSupreme Court of the State of New York for New YorkCounty dismissed the consolidated New York state classaction for failure to state a claim upon which relief could begranted and denied the plaintiffs’ motion for class certifica-tion. Plaintiffs have appealed that decision, with briefing tobe completed in the fall of 2005. On April 13, 2005, theSuperior Court of San Diego, California ordered a stay of theCalifornia state class actions until after the resolution of anyappeal in the MDL case. On April 22, 2005, the DistrictCourt of Johnson County, Kansas similarly stayed the actionbefore it, until after any appeal in the MDL case. The Floridastate class action remains at a very early stage, with no statushearings, dispositive motions, pre-trial schedules, or a trialdate set as of yet.
The Company believes that its agreement with BayerCorporation reflects a valid settlement to a patent suit andcannot form the basis of an antitrust claim. Based on thisbelief, the Company is vigorously defending itself in thesematters. The Company anticipates that these matters maytake several years to resolve, and although it is not possibleto forecast the outcome of these matters, an adverse judg-ment in any of the pending cases could adversely affect theCompany’s consolidated financial statements.
Tamoxifen Antitrust Class ActionsTo date approximately 31 consumer or third-party payorclass action complaints have been filed in state and federalcourts against Zeneca, Inc., AstraZeneca PharmaceuticalsL.P. and the Company alleging, among other things, that the1993 settlement of patent litigation between Zeneca and theCompany violated the antitrust laws, insulated Zeneca andthe Company from generic competition and enabled Zenecaand the Company to charge artificially inflated prices forTamoxifen citrate. A prior investigation of this agreement bythe U.S. Department of Justice was closed without furtheraction. On May 19, 2003, the U.S. District Court dismissedthe complaints for failure to state a viable antitrust claim.The cases are now on appeal.
The Company believes that its agreement with Zenecareflects a valid settlement to a patent suit and cannot formthe basis of an antitrust claim. Based on this belief, theCompany is vigorously defending itself in these matters. TheCompany anticipates that these matters may take severalyears to resolve.
Medicaid Reimbursement CasesThe Company, along with numerous other pharmaceuticalcompanies, has been named as a defendant in separateactions brought by the states of Alabama, Kentucky andIllinois, the Commonwealth of Massachusetts, the City ofNew York, and the following counties in New York: Albany,Allegany, Broome, Cattaraugus, Cayuga, Chautauqua,Chenango, Erie, Fulton, Genesee, Greene, Herkimer,Jefferson, Madison, Monroe, Nassau, Niagara, Oneida,Onondaga, Putnam, Rensselaer, Rockland, Saratoga, St.Lawrence, Steuben, Suffolk, Tompkins, Warren, Washington,Wayne, Westchester, and Yates. In each of these matters, theplaintiffs seek to recover damages and other relief for allegedovercharges for prescription medications paid for or reim-bursed by their respective Medicaid programs. The Companybelieves that it has not engaged in any improper conduct andis vigorously defending itself.
The Commonwealth of Massachusetts case and the NewYork cases, with the exception of the action filed by ErieCounty, are currently pending in the United States DistrictCourt for the District of Massachusetts. Those actions are atan early stage with no trial dates set. The Erie County caseis currently stayed in the United States District Court for theWestern District of New York, and the Judicial Panel onMulti-District Litigation has been asked to transfer the actionto the District of Massachusetts.
52
The Alabama case was filed in Alabama state court,removed to the United States District Court for the MiddleDistrict of Alabama, and recently returned to state court withno trial date currently set. The Illinois case was filed inIllinois state court and recently removed to the United StatesDistrict Court for the Northern District of Illinois, with apending motion to return the case to state court and no trialdate currently set. The Kentucky case was filed in Kentuckystate court and recently removed to the United States DistrictCourt for the Eastern District of Kentucky, with a pendingmotion to return the case to state court and no trial datecurrently set.
Other LitigationAs of June 30, 2005, the Company was involved with otherlawsuits incidental to its business, including patent infringe-ment actions, product liability, and personal injury claims.Management, based on the advice of legal counsel, believesthat the ultimate outcome of these matters will not have amaterial adverse effect on the Company’s consolidated finan-cial statements.
Note 18 – Segment Reporting
The Company operates in two reportable business segments:generic pharmaceuticals and proprietary pharmaceuticals.
Generic PharmaceuticalsGeneric pharmaceutical products are therapeutically equivalentto a brand name product and are marketed primarily towholesalers, retail pharmacy chains, mail order pharmacies
and group purchasing organizations. These products areapproved for distribution by the FDA through the ANDAprocess. The Company also distributes, from time to time,product manufactured for Barr by the brand name company.Tamoxifen and Ciprofloxacin are examples of products Barrhas distributed and are included in the generic pharmaceuticalssegment.
In fiscal year 2005, three customers accounted for 23%,17% and 11% of generic sales. In fiscal year 2004, three cus-tomers accounted for 24%, 14% and 13% of generic productsales. In 2003, four customers accounted for 21%, 17%, 13%and 11% of total generic product sales.
Proprietary PharmaceuticalsProprietary pharmaceutical products are generally patent-protected products marketed directly to health care profession-als. These products are approved by the FDA primarilythrough the New Drug Application process. Barr’s proprietarysegment also includes products whose patents have expiredbut continue to be sold under trade names to capitalize on pre-scriber and customer loyalties and brand recognition.
In fiscal year 2005, 2004 and 2003, three customersaccounted for 25%, 18%, 10% and 21%, 20%, 15% and15%, 19%, 11% of proprietary product sales, respectively.
The accounting policies of the segments are the same asthose described in Note 1. The Company evaluates the per-formance of its operating segments based on net revenues andgross profit. Barr does not report depreciation expense, totalassets and capital expenditures by segment as such informationis neither used by management nor accounted for at the seg-ment level. Net revenues and gross profit information for theCompany’s operating segments consisted of the following:
2005 % of sales 2004 % of sales 2003 % of sales
Product Sales:Proprietary $ 278,786 27% $ 146,087 11% $ 57,662 6%Generic 751,388 73% 1,150,622 89% 837,226 94%
Total product sales $1,030,174 100% $1,296,709 100% $894,888 100%
2005 Margin % 2004 Margin % 2003 Margin %
Gross profit:Proprietary $ 239,516 86% $ 117,994 81% $ 48,536 84%Generic 486,578 65% 545,970 47% 422,253 50%
Total gross profit $ 726,094 70% $ 663,964 51% $470,789 53%

53
NO T E 19 – Quarterly Data (Unaudited)
A summary of the quarterly results of operations is as follows:
Three Month Period Ended
Sept. 30 Dec. 31 Mar. 31 June 30
Fiscal Year 2005:Total revenues $244,508 $257,369 $265,007 $280,515Cost of sales 69,638 78,059 77,653 78,730Net earnings 52,135 59,387 61,345 42,121
Earnings per common share – diluted(1) $ 0.49 $ 0.56 $ 0.58 $ 0.40
Price Range of Common StockHigh $ 42.80 $ 46.90 $ 50.45 $ 54.29Low $ 32.01 $ 35.07 $ 43.71 $ 47.00
Sept. 30 Dec. 31 Mar. 31 June 30
Fiscal Year 2004:Total revenues $310,711 $374,124 $321,085 $303,168Cost of sales 160,901 207,722 145,288 118,834Net earnings 38,535 35,069 35,139 14,360
Earnings per common share – diluted(1)(2) $ 0.37 $ 0.33 $ 0.33 $ 0.13
Price Range of Common Stock(2)
High $ 50.33 $ 56.91 $ 53.99 $ 49.25Low $ 38.83 $ 45.17 $ 45.70 $ 32.89
(1)The sum of the individual quarters may not equal the full year amounts due to the effects of the market prices in the application of the treasury stockmethod. During its three most recent fiscal years, the Company did not pay any cash dividends.
(2)Adjusted for the March 16, 2004 3-for-2 stock split effected in the form of a 50% stock dividend (See Note 1).

To the Board of Directors and Shareholders ofBarr Pharmaceuticals, Inc.:
We have audited the accompanying consolidated balancesheets of Barr Pharmaceuticals, Inc. and subsidiaries (the“Company”) as of June 30, 2005 and 2004, and the relatedconsolidated statements of operations, shareholders’ equity,and cash flows for each of the three years in the period endedJune 30, 2005. We also have audited management’s assess-ment, included in the accompanying Management’s Reporton Internal Control over Financial Reporting, that theCompany maintained effective internal control over financialreporting as of June 30, 2005, based on criteria establishedin Internal Control – Integrated Framework issued by theCommittee of Sponsoring Organizations of the TreadwayCommission. The Company’s management is responsible forthese financial statements and for maintaining effective inter-nal control over financial reporting, and for its assessment ofthe effectiveness of internal control over financial reporting.Our responsibility is to express an opinion on these financialstatements, an opinion on management’s assessment, andan opinion on the effectiveness of the Company’s internalcontrol over financial reporting based on our audits.
We conducted our audits in accordance with the standardsof the Public Company Accounting Oversight Board (UnitedStates). Those standards require that we plan and performthe audit to obtain reasonable assurance about whether thefinancial statements are free of material misstatement andwhether effective internal control over financial reportingwas maintained in all material respects. Our audit of finan-cial statements included examining, on a test basis, evidencesupporting the amounts and disclosures in the financial state-ments, assessing the accounting principles used and signifi-cant estimates made by management, and evaluating theoverall financial statement presentation. Our audit of internalcontrol over financial reporting included obtaining an under-standing of internal control over financial reporting, evaluat-ing management’s assessment, testing and evaluating thedesign and operating effectiveness of internal control, andperforming such other procedures as we considered necessaryin the circumstances. We believe that our audits provide areasonable basis for our opinions.
A company’s internal control over financial reporting is aprocess designed by, or under the supervision of, the compa-ny’s principal executive and principal financial officers, or per-sons performing similar functions, and effected by thecompany’s board of directors, management, and other person-nel to provide reasonable assurance regarding the reliability offinancial reporting and the preparation of financial statementsfor external purposes in accordance with generally accepted
accounting principles. A company’s internal control overfinancial reporting includes those policies and procedures that(1) pertain to the maintenance of records that, in reasonabledetail, accurately and fairly reflect the transactions and dispo-sitions of the assets of the company; (2) provide reasonableassurance that transactions are recorded as necessary to per-mit preparation of financial statements in accordance withgenerally accepted accounting principles and that receipts andexpenditures of the company are being made only in accor-dance with authorizations of management and directors of thecompany; and (3) provide reasonable assurance regarding pre-vention or timely detection of unauthorized acquisition, use,or disposition of the company’s assets that could have a mate-rial effect on the financial statements.
Because of the inherent limitations of internal controlover financial reporting, including the possibility of collusionor improper management override of controls, materialmisstatements due to error or fraud may not be prevented ordetected on a timely basis. Also, projections of any evalua-tion of the effectiveness of the internal control over financialreporting to future periods are subject to the risk that thecontrols may become inadequate because of changes inconditions, or that the degree of compliance with the policiesor procedures may deteriorate.
In our opinion, the consolidated financial statementsreferred to above present fairly, in all material respects, thefinancial position of the Company as of June 30, 2005 and2004, and the results of its operations and its cash flows foreach of the three years in the period ended June 30, 2005, inconformity with accounting principles generally accepted inthe United States of America. Also, in our opinion, manage-ment’s assessment that the Company maintained effectiveinternal control over financial reporting as of June 30, 2005,is fairly stated, in all material respects, based on the criteriaestablished in Internal Control – Integrated Frameworkissued by the Committee of Sponsoring Organizations of theTreadway Commission. Furthermore, in our opinion, theCompany maintained, in all material respects, effectiveinternal control over financial reporting as of June 30, 2005,based on the criteria established in Internal Control –Integrated Framework issued by the Committee ofSponsoring Organizations of the Treadway Commission.
Parsippany, New JerseySeptember 9, 2005
Report of Independent RegisteredPublic Accounting Firm
54

55
Management is responsible for establishing and maintainingadequate internal control over financial reporting. We main-tain internal control over financial reporting designed to pro-vide reasonable assurance regarding the reliability of financialreporting and the preparation of financial statements forexternal purposes in accordance with generally acceptedaccounting principles in the United States of America.
Because of its inherent limitations, any system of internalcontrol over financial reporting, no matter how welldesigned, may not prevent or detect misstatements due to thepossibility of collusion or improper override of controls, orthat misstatements due to error or fraud may occur that arenot detected. Also, projections of any evaluation of effective-ness to future periods are subject to the risk that controlsmay become inadequate because of changes in conditions, orthat the degree of compliance with the policies or proceduresmay deteriorate.
Management conducted an assessment of the effectivenessof the Company’s internal control over financial reporting asof June 30, 2005 using criteria established in InternalControl – Integrated Framework issued by the Committee ofSponsoring Organizations of the Treadway Commission(COSO). This assessment included an evaluation of thedesign of the Company’s internal control over financialreporting and testing of the operational effectiveness of itsinternal control over financial reporting. Based on this assess-ment, management has concluded that the Company main-tained effective internal control over financial reporting as ofJune 30, 2005, based upon the COSO framework criteria.
Management’s assessment of the effectiveness of theCompany’s internal control over financial reporting as ofJune 30, 2005 has been audited by Deloitte & Touche LLP,an independent registered public accounting firm, as stated intheir report which appears herein.
September 9, 2005
Management’s Report on Internal Control OverFinancial Reporting
Year Ended June 30,
(in thousands, except per share data) 2005 2004 2003 2002 2001(1)
Statements of Operations DataTotal revenues $1,047,399 $1,309,088 $ 902,864 $1,188,984 $593,151Earnings before income taxes 329,876 194,440 262,715 337,537 101,793Income tax expense 114,888 71,337 95,149 125,318 38,714Net earnings applicable to common shareholders 214,988 123,103 167,566 210,269 62,566Earnings per common share – basic 2.08 1.21 1.69(4) 2.17(4)(5) 0.66(4)(5)
Earnings per common share – diluted 2.03 1.15 1.62(4) 2.06(4)(5) 0.63(4)(5)
2005 2004 2003 2002 2001(1)
Balance Sheet DataWorking capital $ 780,386 $ 670,601 $ 582,183 $ 457,393 $313, 101Total assets 1,482,846 1,333,269 1,180,937 888,554 666, 516Long-term debt (2) 15,493 32,355 34,027 42,634 65,563Shareholders’ equity (3) 1,233,970 1,042,046 867,995 666,532 416,777
(1)Financial data presented for the fiscal year ended June 30, 2001 has been restated to include the historical financial data of Duramed,which Barr acquired in October 2001.
(2)Includes capital leases and excludes current installments.(3)The Company has not paid a cash dividend in any of the above years.(4)Amounts have been adjusted for the March 16, 2004 3-for-2 stock split effected in the form of a 50% stock dividend
(See Note 1 to the consolidated financial statements).(5)Amounts have been adjusted for the March 17, 2003 3-for-2 stock split effected in the form of a 50% stock dividend
(See Note 1 to the consolidated financial statements).
Selected Financial Data
The following data has been derived from our consolidatedfinancial statements and should be read in conjunction with
those statements, together with “Management’s Discussion andAnalysis of Financial Condition and Results of Operations.”

56
To supplement its consolidated financial statements presentedin accordance with accounting principles generally acceptedin the United States of America (“GAAP”), the Company isproviding this summary to reflect the adjusted earnings pershare effect of certain unusual or infrequent charges thatwere taken for the year ended and June 30, 2005 and 2004.The Company believes that the adjusted earnings per shareinformation presented above provides useful information toboth management and investors concerning the approximateimpact of the above items. The Company also believes thatincluding the effect of these items in earnings per share allowsmanagement and investors to better compare the Company’sfinancial performance from period-to-period, and to bettercompare the Company’s financial performance with that of itscompetitors. The presentation of this additional informationis not meant to be considered in isolation of, or as a substitutefor, results prepared in accordance with GAAP.
Fiscal 2005
For the year ended June 30, 2005, these excluded chargesconsist of the following:
Selling, General & Administrative◆ An after tax charge of $0.37 per fully diluted share related
to the $63.2 million charge related to a potential litigationsettlement and product acquisition of Organon’s Mircette®.
Fiscal 2004
For the year ended June 30, 2004, these excluded chargesconsist of the following:
Selling, General & Administrative◆ An after-tax charge of $0.05 per fully diluted share result-
ing from a charge of $8.5 million related to the settlementof patent challenge litigation between Galen Holdings PLCand the Company regarding Galen’s Estrostep® oral contra-ceptive and femhrt® hormone therapy products.
◆ An after-tax charge of $0.41 per fully diluted share result-ing from the $68.2 million award rendered in favor ofSolvay Pharmaceuticals, Inc. by the arbitration panel adju-dicating the claim by Solvay that the Company’s whollyowned subsidiary, Duramed Pharmaceuticals, Inc., did notproperly terminate its contract with Solvay regarding thejoint promotion of Duramed’s Cenestin® Tablets.
Research & Development◆ An after-tax charge of $0.21 per fully diluted share taken
in the quarter ended December 31, 2003 resulting from a$35.6 million write-off of in-process research and develop-ment acquired from Endeavor Pharmaceuticals, Inc.
◆ Combined after-tax charges of $0.12 per fully diluted sharetaken in the quarter ended March 31, 2004 resulting fromthe $10.3 million in-process research and developmentcharge associated with the emergency contraception acqui-sition from Women’s Capital Corporation, and from the$4.2 million acquisition of certain emergency contraceptionassets from Gynetics, Inc., which was recorded in selling,general and administrative.
◆ An after-tax charge of $0.13 per fully diluted share takenin the quarter ended March 31, 2004 resulting from the$22.3 million write-off associated with acquiring fromSchering AG the worldwide rights to the oxybutynintransvaginal ring product for urinary incontinence that iscurrently in development.
◆ An after-tax charge of $0.10 per fully diluted share takenin the quarter ended September 30, 2003 related to theestablishment of a $15.7 million reserve against theamount of principal and accrued interest owed to Barr byNatural Biologics, LLC.
Reconciliation of GAAP EPS to Adjusted EPSfor the Fiscal Years Ended June 30, 2005 and 2004 (unaudited)
Fiscal Years Ended June 30, 2005 2004
Earnings per common share – assuming dilution $ 2.03 $1.15After tax effect of:
Mircette settlement charge 0.37 –Galen patent settlement costs – 0.05Solvay arbitration award – 0.41In-process research and development acquired from Endeavor – 0.21Emergency contraception acquisition charges – 0.12Write-off of intangible asset – 0.13Provision for losses on loans to Natural Biologics – 0.10
Earnings per common share – assuming dilution, net of charges $ 2.40 $2.17

Barr Pharmaceuticals, Inc.400 Chestnut Ridge RoadWoodcliff Lake, NJ 07677
1-800-BARRLAB
www.barrlabs.com
®