barnes group investor overview
TRANSCRIPT
Barnes Group Investor Overview April 2015
-2-
This presentation contains forward-looking statements. Forward-looking statements are made based upon management's good faith expectations and beliefs concerning future developments and their potential effect upon the Company. These forward-looking statements are subject to risks and uncertainties that may cause actual results to differ materially from those expressed in the forward-looking statements, including the risks and uncertainties set forth under our full disclosure located at the end of this presentation and included in our SEC filings. The Company assumes no obligation to update our forward-looking statements. References to adjusted financial results are non-GAAP measures. You will find a GAAP reconciliation table at the end of this presentation.
Safe Harbor Statement
2013 Completes
Divestiture of
Acquires
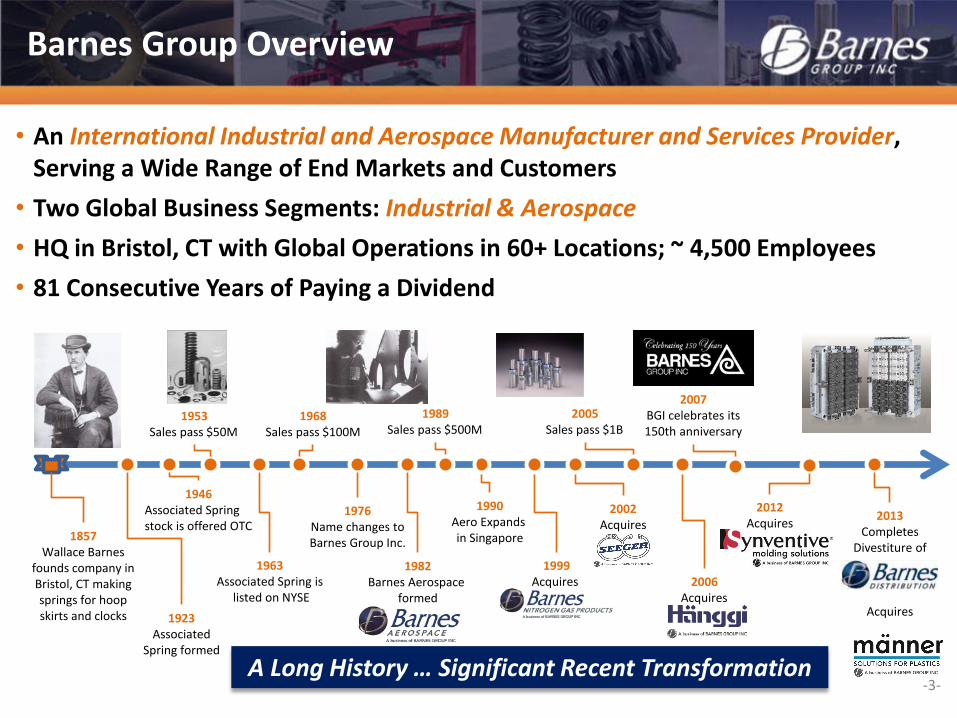
Barnes Group Overview
-3-
1857 Wallace Barnes
founds company in Bristol, CT making springs for hoop skirts and clocks 1923
Associated Spring formed
1946 Associated Spring stock is offered OTC
1963 Associated Spring is
listed on NYSE
1968 Sales pass $100M
1976 Name changes to Barnes Group Inc.
1953 Sales pass $50M
1982 Barnes Aerospace
formed
2005 Sales pass $1B
1990 Aero Expands in Singapore
2007 BGI celebrates its 150th anniversary
2002 Acquires
1999 Acquires
1989 Sales pass $500M
2006 Acquires
2012 Acquires
• An International Industrial and Aerospace Manufacturer and Services Provider, Serving a Wide Range of End Markets and Customers
• Two Global Business Segments: Industrial & Aerospace
• HQ in Bristol, CT with Global Operations in 60+ Locations; ~ 4,500 Employees
• 81 Consecutive Years of Paying a Dividend
A Long History … Significant Recent Transformation
-4-
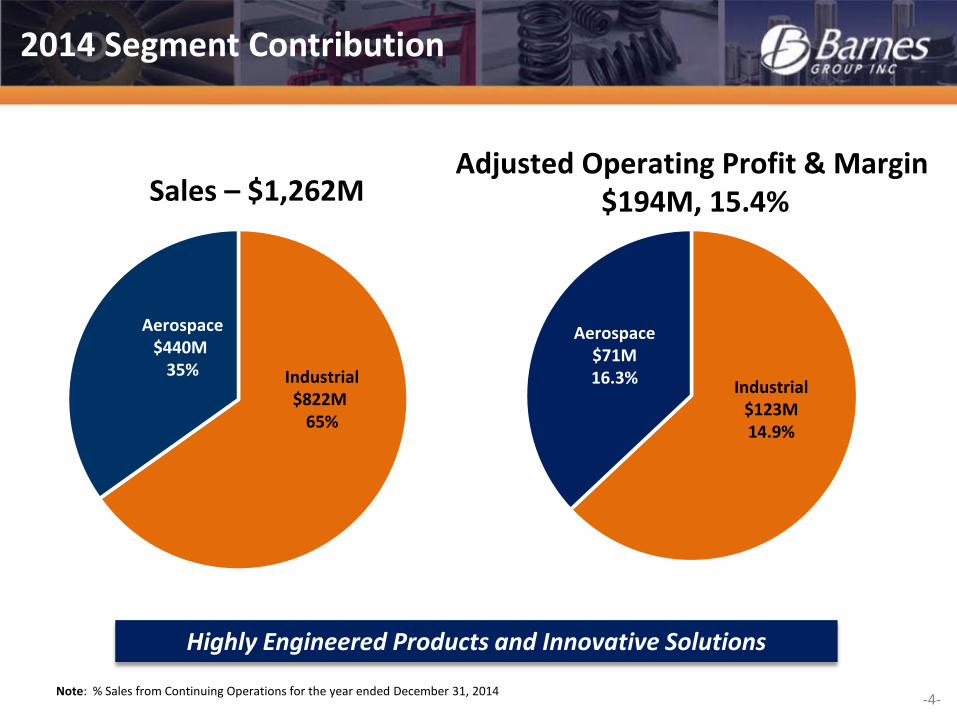
Highly Engineered Products and Innovative Solutions
Note: % Sales from Continuing Operations for the year ended December 31, 2014
Americas 56%
2014 Segment Contribution
Aero OEM 28%
Aero Aftermarket
10%
Aerospace $440M
35%
Sales – $1,262M
Industrial $822M
65%
Industrial $123M 14.9%
Aerospace $71M 16.3%
Adjusted Operating Profit & Margin $194M, 15.4%

-5-
Global, Diversified End Markets
Note: % Sales from Continuing Operations for the year ended December 31, 2014
End Markets
Transportation 32%
Industrial 33%
Europe 28%
Asia 17%
Geography
Americas 55%
2014 Sales by End Markets & Geography
Aero OEM 26%
Aero Aftermarket
9%
-6-
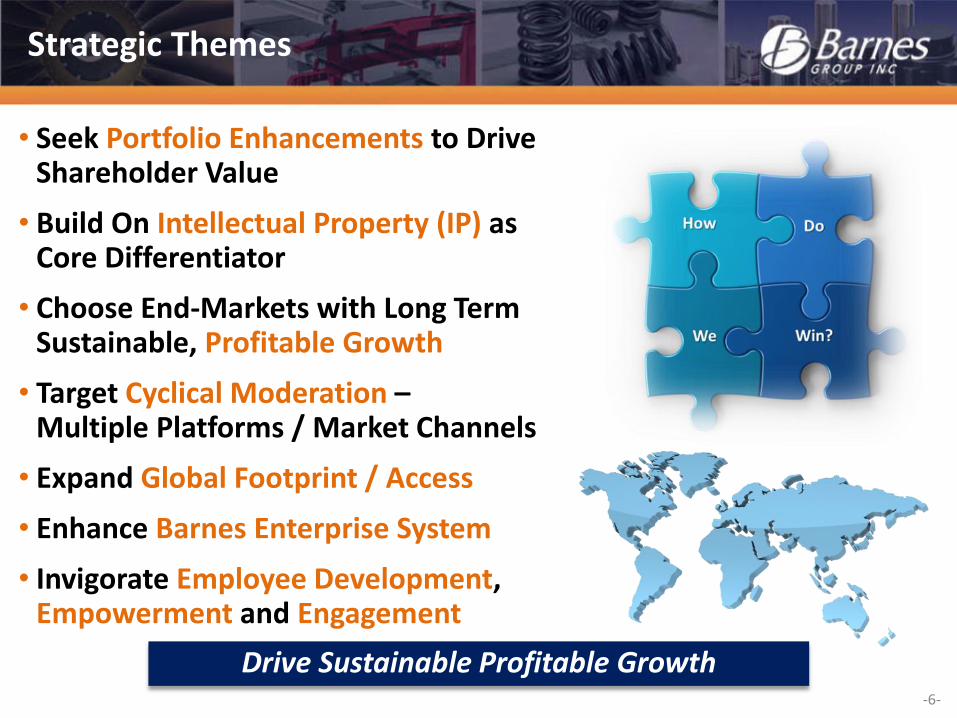
Drive Sustainable Profitable Growth
Strategic Themes
• Seek Portfolio Enhancements to Drive Shareholder Value
• Build On Intellectual Property (IP) as Core Differentiator
• Choose End-Markets with Long Term Sustainable, Profitable Growth
• Target Cyclical Moderation – Multiple Platforms / Market Channels
• Expand Global Footprint / Access
• Enhance Barnes Enterprise System
• Invigorate Employee Development, Empowerment and Engagement
-7-
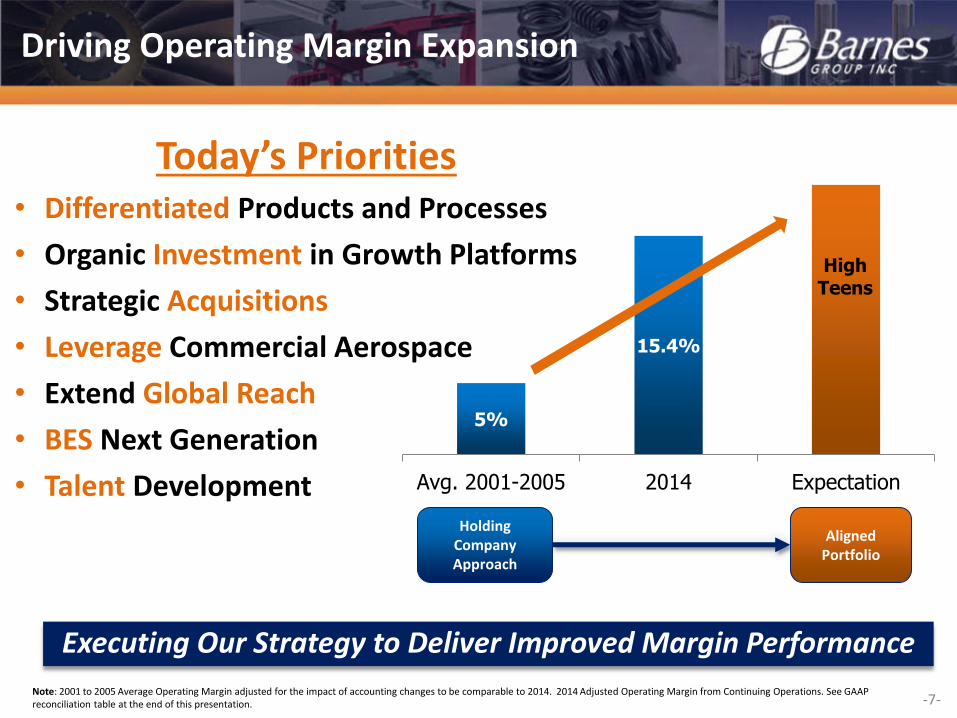
5%
15.4%
High Teens
Avg. 2001-2005 2014 Expectation
Holding Company Approach
Aligned Portfolio
Note: 2001 to 2005 Average Operating Margin adjusted for the impact of accounting changes to be comparable to 2014. 2014 Adjusted Operating Margin from Continuing Operations. See GAAP reconciliation table at the end of this presentation.
Today’s Priorities • Differentiated Products and Processes
• Organic Investment in Growth Platforms
• Strategic Acquisitions
• Leverage Commercial Aerospace
• Extend Global Reach
• BES Next Generation
• Talent Development
Executing Our Strategy to Deliver Improved Margin Performance
Driving Operating Margin Expansion
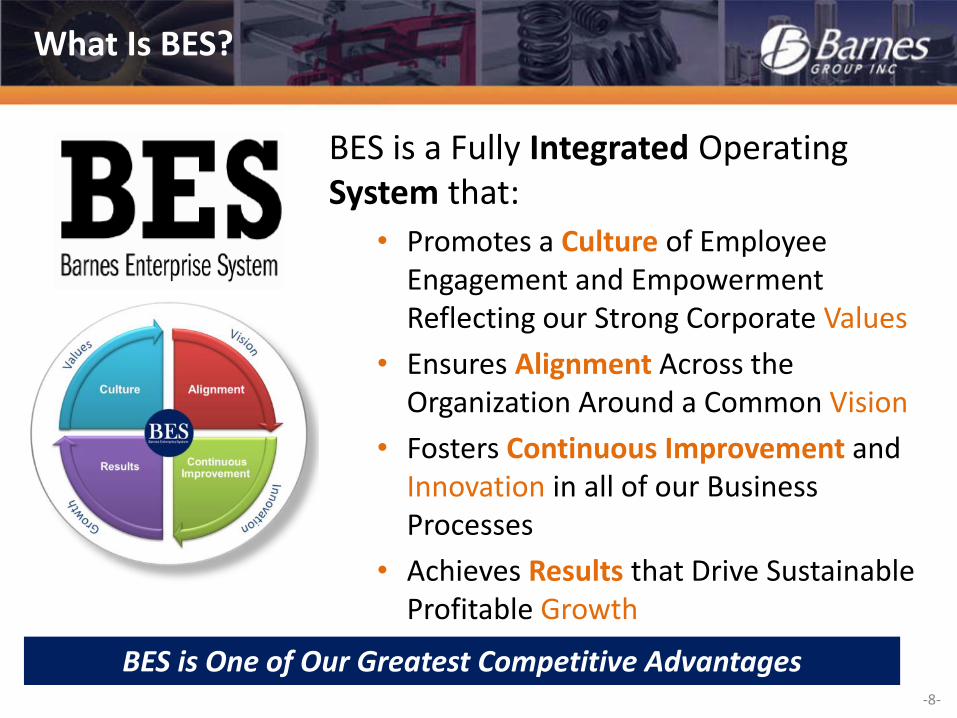
What Is BES?
BES is a Fully Integrated Operating System that:
• Promotes a Culture of Employee Engagement and Empowerment Reflecting our Strong Corporate Values
• Ensures Alignment Across the Organization Around a Common Vision
• Fosters Continuous Improvement and Innovation in all of our Business Processes
• Achieves Results that Drive Sustainable Profitable Growth
BES is One of Our Greatest Competitive Advantages -8-
-9-
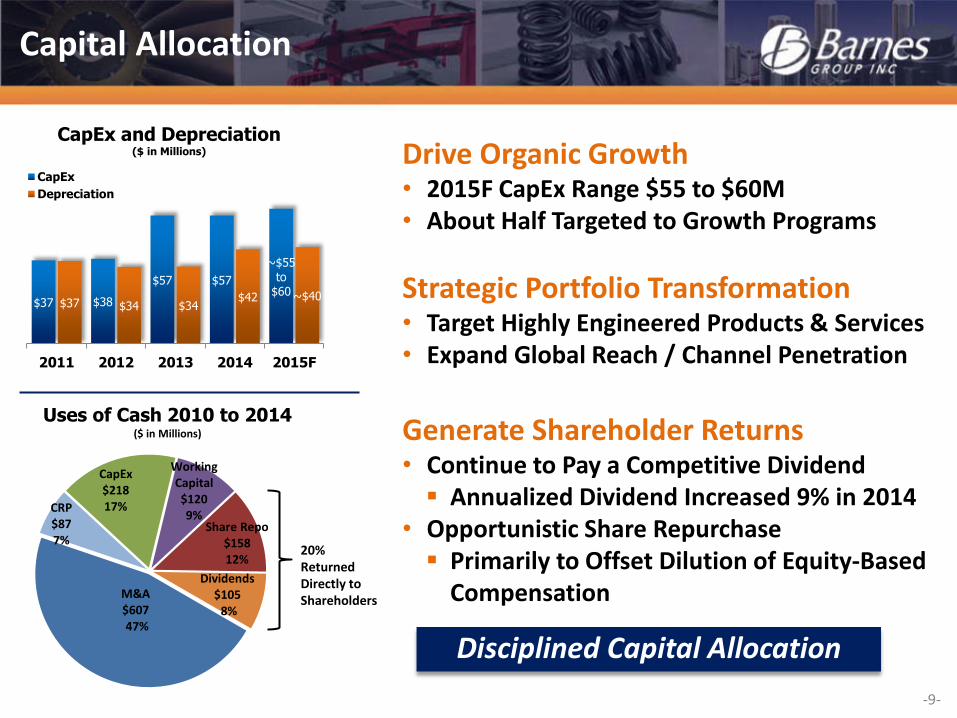
Disciplined Capital Allocation
$37 $38
$57 $57
~$55
to $60
$37 $34 $34 $42 ~$40
2011 2012 2013 2014 2015F
CapEx
Depreciation
CapEx and Depreciation ($ in Millions) Drive Organic Growth
• 2015F CapEx Range $55 to $60M • About Half Targeted to Growth Programs
Strategic Portfolio Transformation • Target Highly Engineered Products & Services • Expand Global Reach / Channel Penetration
Generate Shareholder Returns • Continue to Pay a Competitive Dividend Annualized Dividend Increased 9% in 2014
• Opportunistic Share Repurchase Primarily to Offset Dilution of Equity-Based
Compensation
Capital Allocation
M&A $607 47%
CapEx $218 17%
Working Capital $120 9%
Share Repo $158 12%
CRP $87 7%
Dividends $105 8%
Uses of Cash 2010 to 2014 ($ in Millions)
20% Returned Directly to Shareholders
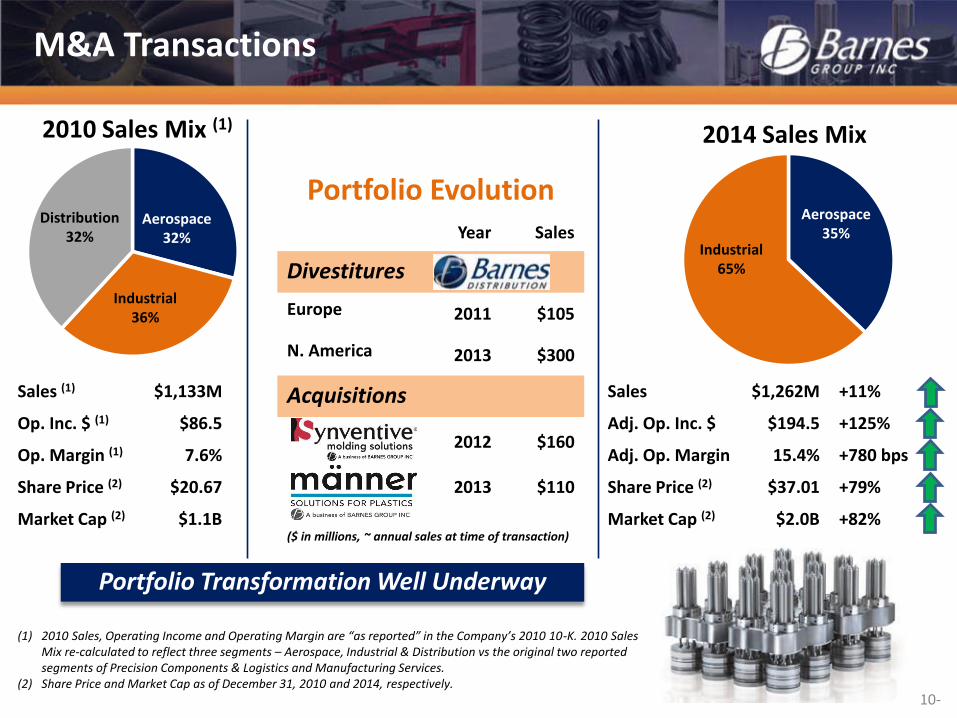
Portfolio Evolution Year Sales
Divestitures
Europe 2011 $105
N. America 2013 $300
Acquisitions
2012 $160
2013 $110
($ in millions, ~ annual sales at time of transaction)
M&A Transactions
2010 Sales Mix (1)
Industrial 36%
Aerospace 32%
Distribution 32%
2014 Sales Mix
Industrial 65%
Aerospace 35%
Sales (1) $1,133M
Op. Inc. $ (1) $86.5
Op. Margin (1) 7.6%
Share Price (2) $20.67
Market Cap (2) $1.1B
Sales $1,262M +11%
Adj. Op. Inc. $ $194.5 +125%
Adj. Op. Margin 15.4% +780 bps
Share Price (2) $37.01 +79%
Market Cap (2) $2.0B +82%
Portfolio Transformation Well Underway
-10-
(1) 2010 Sales, Operating Income and Operating Margin are “as reported” in the Company’s 2010 10-K. 2010 Sales Mix re-calculated to reflect three segments – Aerospace, Industrial & Distribution vs the original two reported segments of Precision Components & Logistics and Manufacturing Services.
(2) Share Price and Market Cap as of December 31, 2010 and 2014, respectively.
-11-
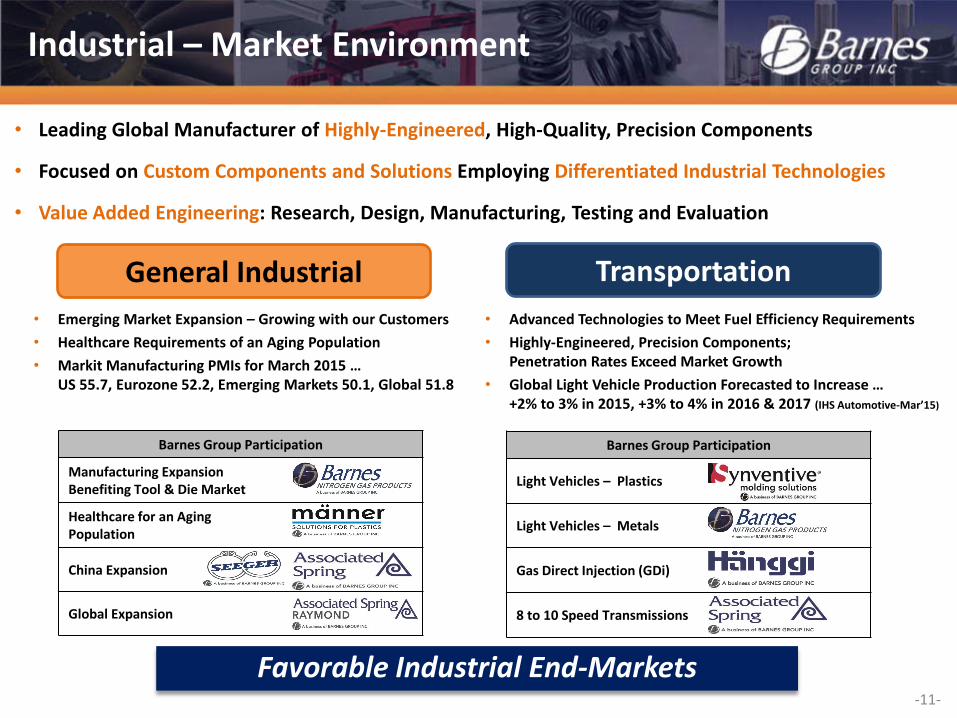
• Leading Global Manufacturer of Highly-Engineered, High-Quality, Precision Components
• Focused on Custom Components and Solutions Employing Differentiated Industrial Technologies
• Value Added Engineering: Research, Design, Manufacturing, Testing and Evaluation
Industrial – Market Environment
Favorable Industrial End-Markets
Transportation General Industrial
• Advanced Technologies to Meet Fuel Efficiency Requirements
• Highly-Engineered, Precision Components; Penetration Rates Exceed Market Growth
• Global Light Vehicle Production Forecasted to Increase … +2% to 3% in 2015, +3% to 4% in 2016 & 2017 (IHS Automotive-Mar’15)
Barnes Group Participation
Light Vehicles – Plastics
Light Vehicles – Metals
Gas Direct Injection (GDi)
8 to 10 Speed Transmissions
• Emerging Market Expansion – Growing with our Customers
• Healthcare Requirements of an Aging Population
• Markit Manufacturing PMIs for March 2015 … US 55.7, Eurozone 52.2, Emerging Markets 50.1, Global 51.8
Barnes Group Participation
Manufacturing Expansion Benefiting Tool & Die Market
Healthcare for an Aging Population
China Expansion
Global Expansion
-12-
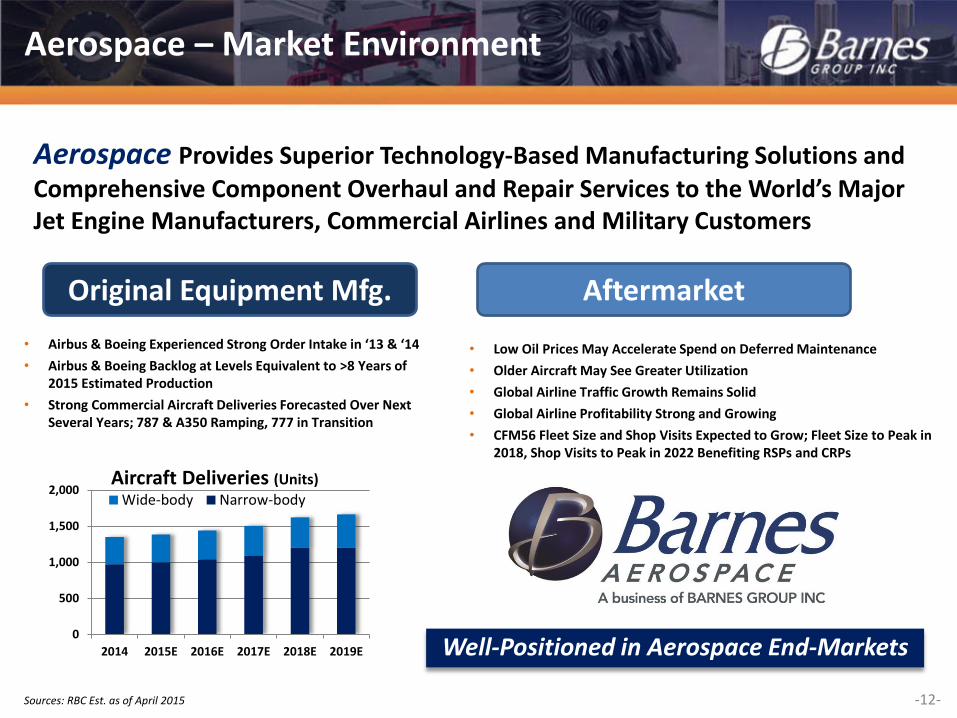
Aerospace Provides Superior Technology-Based Manufacturing Solutions and
Comprehensive Component Overhaul and Repair Services to the World’s Major Jet Engine Manufacturers, Commercial Airlines and Military Customers
Aerospace – Market Environment
Original Equipment Mfg. Aftermarket
• Airbus & Boeing Experienced Strong Order Intake in ‘13 & ‘14
• Airbus & Boeing Backlog at Levels Equivalent to >8 Years of 2015 Estimated Production
• Strong Commercial Aircraft Deliveries Forecasted Over Next Several Years; 787 & A350 Ramping, 777 in Transition
• Low Oil Prices May Accelerate Spend on Deferred Maintenance
• Older Aircraft May See Greater Utilization
• Global Airline Traffic Growth Remains Solid
• Global Airline Profitability Strong and Growing
• CFM56 Fleet Size and Shop Visits Expected to Grow; Fleet Size to Peak in 2018, Shop Visits to Peak in 2022 Benefiting RSPs and CRPs
0
500
1,000
1,500
2,000
2014 2015E 2016E 2017E 2018E 2019E
Wide-body Narrow-body
Aircraft Deliveries (Units)
Sources: RBC Est. as of April 2015
Well-Positioned in Aerospace End-Markets
-13-
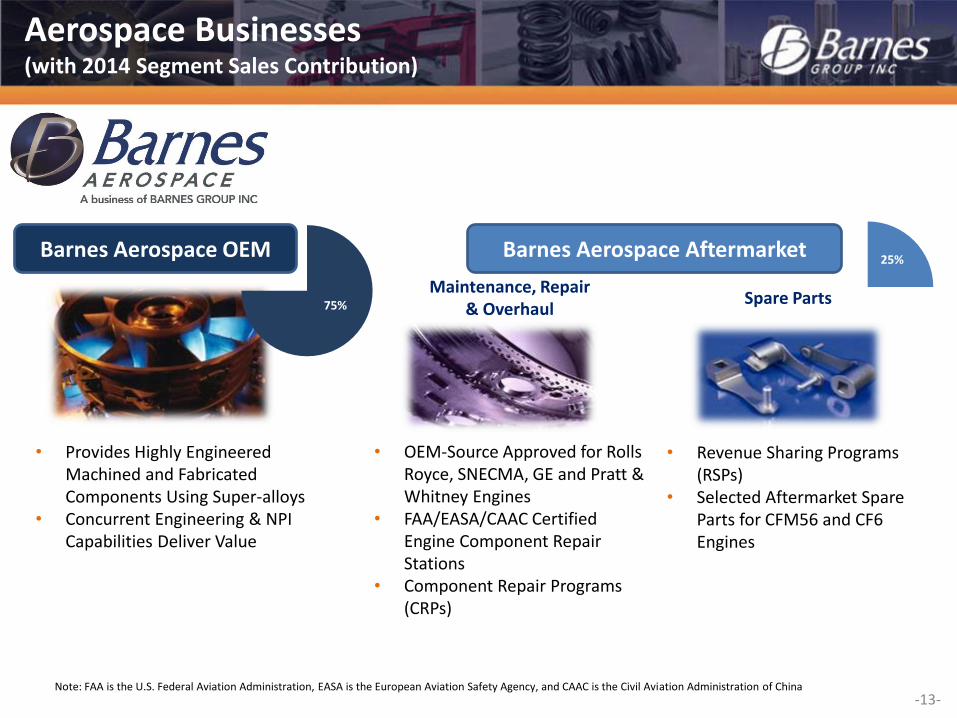
• Provides Highly Engineered Machined and Fabricated Components Using Super-alloys
• Concurrent Engineering & NPI Capabilities Deliver Value
• OEM-Source Approved for Rolls Royce, SNECMA, GE and Pratt & Whitney Engines
• FAA/EASA/CAAC Certified Engine Component Repair Stations
• Component Repair Programs (CRPs)
• Revenue Sharing Programs (RSPs)
• Selected Aftermarket Spare Parts for CFM56 and CF6 Engines
Maintenance, Repair & Overhaul
Spare Parts
Aerospace Businesses (with 2014 Segment Sales Contribution)
Note: FAA is the U.S. Federal Aviation Administration, EASA is the European Aviation Safety Agency, and CAAC is the Civil Aviation Administration of China
75%
25% Barnes Aerospace OEM Barnes Aerospace Aftermarket
Barnes Aftermarket RSPs and CRPs
2.43 2.45 2.49 2.57
2.77 2.89 19.6
21.0 22.3
23.4 24.2 24.5
0
5
10
15
20
25
1.0
1.5
2.0
2.5
3.0
2013 2014 2015 2016 2017 2018
Fle
et S
ize
(0
00
s)
Esti
mat
ed S
ho
p V
isit
s (0
00
s)
CFM56 Family of Engines
Shop Visits Fleet Size
0.96 0.90
0.83 0.85 0.82
0.78
3.8 3.7 3.5
3.3 3.0 2.9
0
1
2
3
4
0.4
0.6
0.8
1.0
2013 2014 2015 2016 2017 2018
Fle
et S
ize
(00
0s)
Esti
mat
ed S
ho
p V
isit
s (0
00
s)
CF6 Family of Engines
Shop Visits Fleet Size
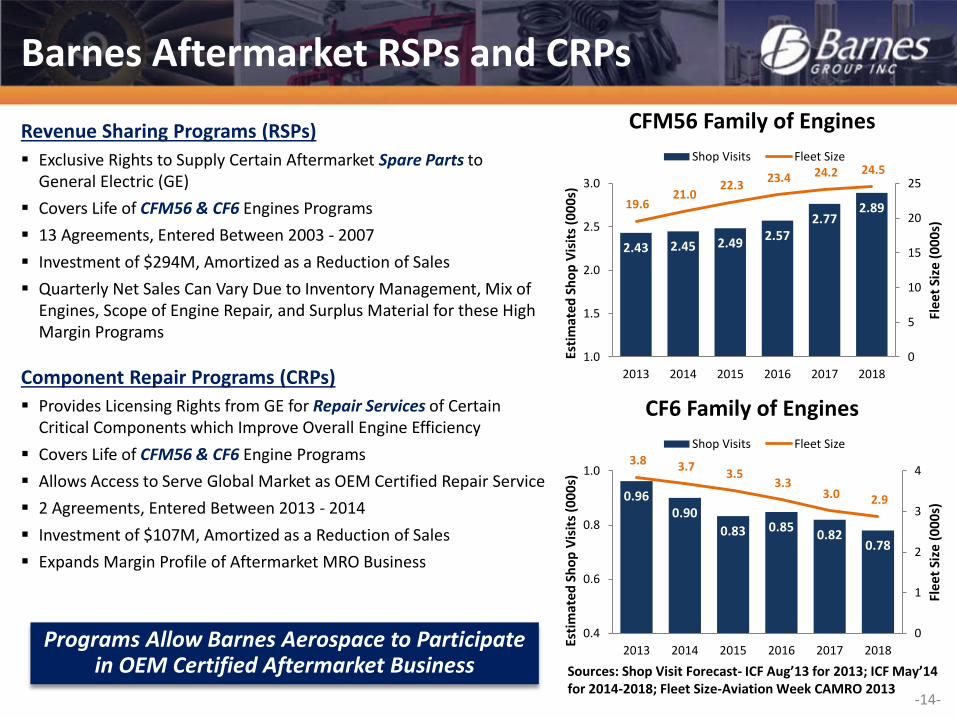
Revenue Sharing Programs (RSPs)
Exclusive Rights to Supply Certain Aftermarket Spare Parts to General Electric (GE)
Covers Life of CFM56 & CF6 Engines Programs
13 Agreements, Entered Between 2003 - 2007
Investment of $294M, Amortized as a Reduction of Sales
Quarterly Net Sales Can Vary Due to Inventory Management, Mix of Engines, Scope of Engine Repair, and Surplus Material for these High Margin Programs
Component Repair Programs (CRPs)
Provides Licensing Rights from GE for Repair Services of Certain Critical Components which Improve Overall Engine Efficiency
Covers Life of CFM56 & CF6 Engine Programs
Allows Access to Serve Global Market as OEM Certified Repair Service
2 Agreements, Entered Between 2013 - 2014
Investment of $107M, Amortized as a Reduction of Sales
Expands Margin Profile of Aftermarket MRO Business
Sources: Shop Visit Forecast- ICF Aug’13 for 2013; ICF May’14 for 2014-2018; Fleet Size-Aviation Week CAMRO 2013
Programs Allow Barnes Aerospace to Participate in OEM Certified Aftermarket Business
-14-
-15-
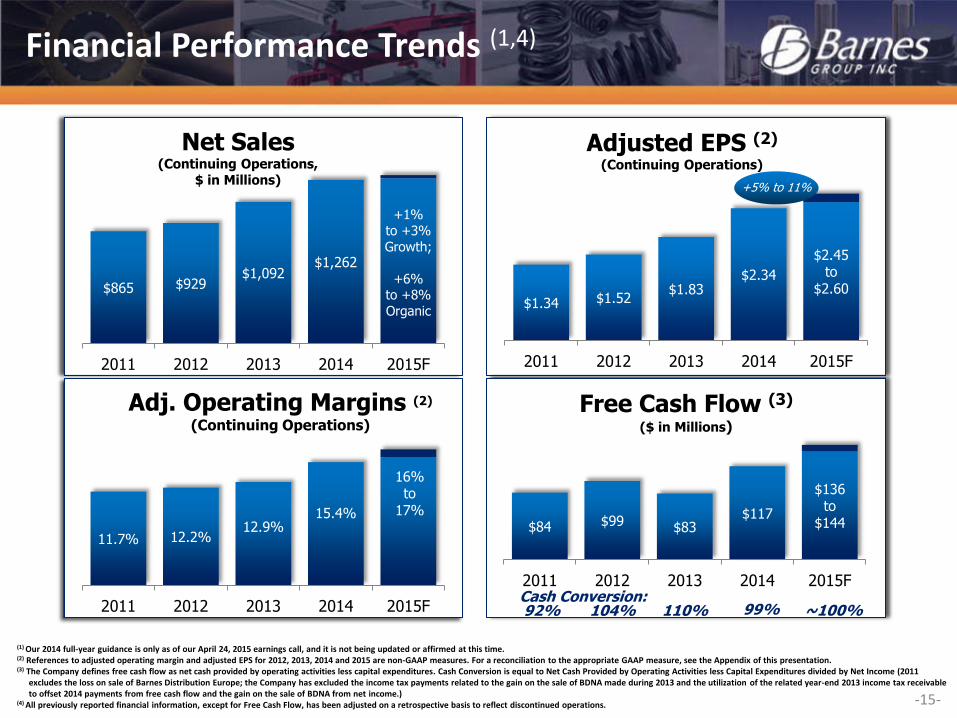
(1) Our 2014 full-year guidance is only as of our April 24, 2015 earnings call, and it is not being updated or affirmed at this time. (2) References to adjusted operating margin and adjusted EPS for 2012, 2013, 2014 and 2015 are non-GAAP measures. For a reconciliation to the appropriate GAAP measure, see the Appendix of this presentation. (3) The Company defines free cash flow as net cash provided by operating activities less capital expenditures. Cash Conversion is equal to Net Cash Provided by Operating Activities less Capital Expenditures divided by Net Income (2011
excludes the loss on sale of Barnes Distribution Europe; the Company has excluded the income tax payments related to the gain on the sale of BDNA made during 2013 and the utilization of the related year-end 2013 income tax receivable to offset 2014 payments from free cash flow and the gain on the sale of BDNA from net income.)
(4) All previously reported financial information, except for Free Cash Flow, has been adjusted on a retrospective basis to reflect discontinued operations.
$865 $929 $1,092
$1,262
+1%
to +3%
Growth;
+6% to +8%
Organic
2011 2012 2013 2014 2015F
Net Sales (Continuing Operations,
$ in Millions)
$1.34 $1.52 $1.83
$2.34
$2.45 to
$2.60
2011 2012 2013 2014 2015F
Adjusted EPS (2)
(Continuing Operations)
11.7% 12.2% 12.9%
15.4%
16% to
17%
2011 2012 2013 2014 2015F
Adj. Operating Margins (2)
(Continuing Operations)
$84 $99 $83 $117
$136 to
$144
2011 2012 2013 2014 2015F
Free Cash Flow (3)
($ in Millions)
92% 104% 110% 99% Cash Conversion:
~100%
+5% to 11%
Financial Performance Trends (1,4)
-16-
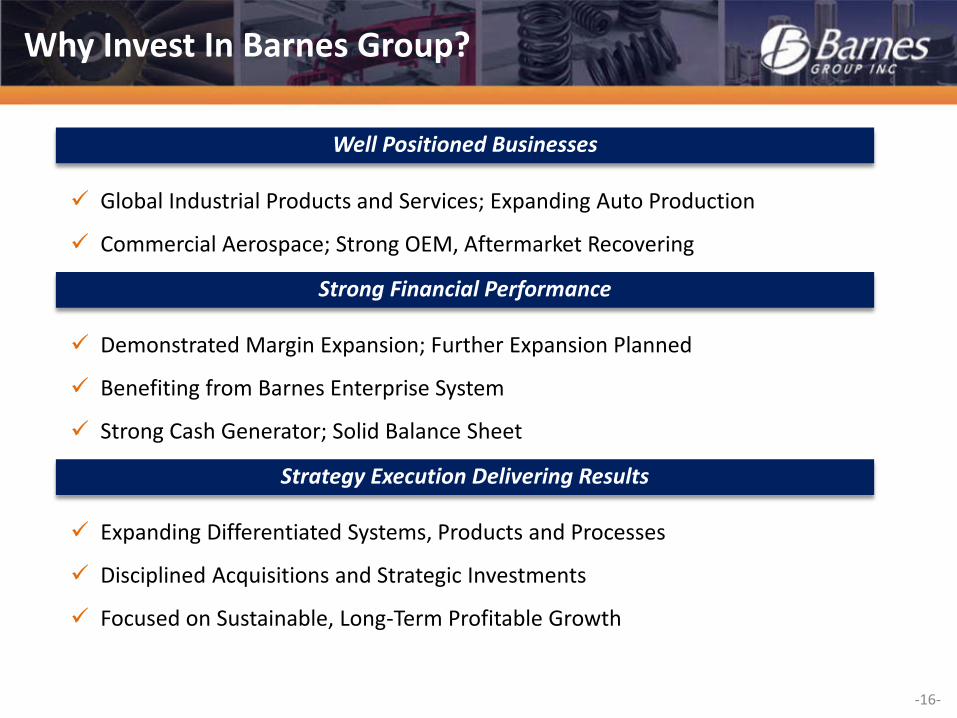
Global Industrial Products and Services; Expanding Auto Production
Commercial Aerospace; Strong OEM, Aftermarket Recovering
Demonstrated Margin Expansion; Further Expansion Planned
Benefiting from Barnes Enterprise System
Strong Cash Generator; Solid Balance Sheet
Expanding Differentiated Systems, Products and Processes
Disciplined Acquisitions and Strategic Investments
Focused on Sustainable, Long-Term Profitable Growth
Well Positioned Businesses
Strong Financial Performance
Strategy Execution Delivering Results
Why Invest In Barnes Group?
Appendix
-18-
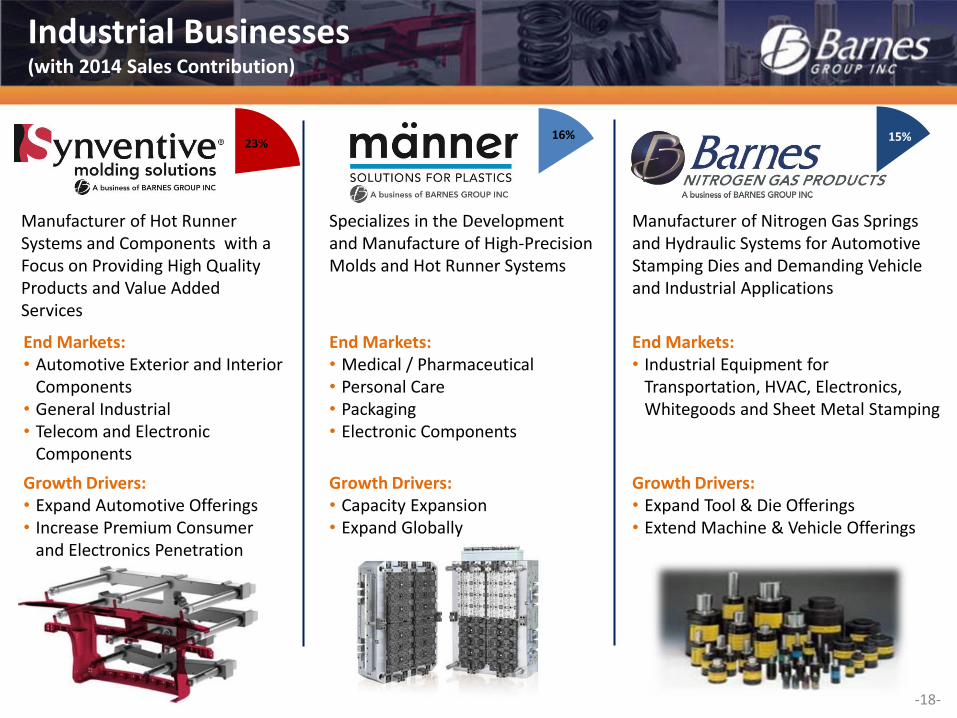
Industrial Businesses (with 2014 Sales Contribution)
Manufacturer of Hot Runner Systems and Components with a Focus on Providing High Quality Products and Value Added Services
Growth Drivers: • Expand Automotive Offerings • Increase Premium Consumer
and Electronics Penetration
End Markets: • Automotive Exterior and Interior
Components • General Industrial • Telecom and Electronic
Components
Specializes in the Development and Manufacture of High-Precision Molds and Hot Runner Systems
Growth Drivers: • Capacity Expansion • Expand Globally
End Markets: • Medical / Pharmaceutical • Personal Care • Packaging • Electronic Components
Manufacturer of Nitrogen Gas Springs and Hydraulic Systems for Automotive Stamping Dies and Demanding Vehicle and Industrial Applications
Growth Drivers: • Expand Tool & Die Offerings • Extend Machine & Vehicle Offerings
End Markets: • Industrial Equipment for
Transportation, HVAC, Electronics, Whitegoods and Sheet Metal Stamping
23% 16% 15%
-19-
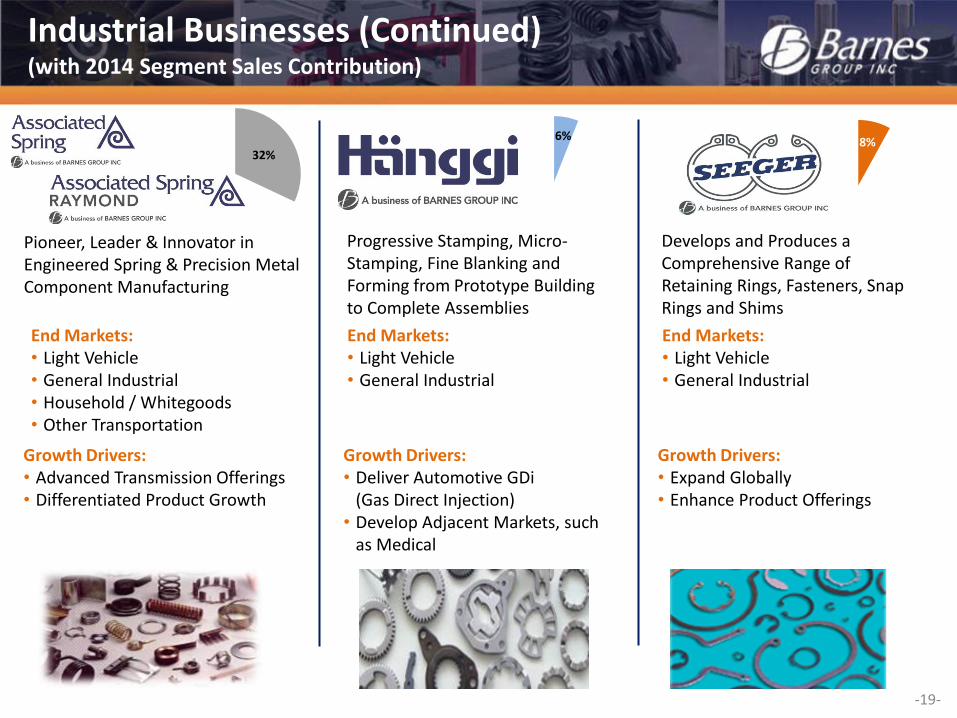
Industrial Businesses (Continued) (with 2014 Segment Sales Contribution)
Pioneer, Leader & Innovator in Engineered Spring & Precision Metal Component Manufacturing
Growth Drivers: • Advanced Transmission Offerings • Differentiated Product Growth
End Markets: • Light Vehicle • General Industrial • Household / Whitegoods • Other Transportation
Progressive Stamping, Micro-Stamping, Fine Blanking and Forming from Prototype Building to Complete Assemblies
Growth Drivers: • Deliver Automotive GDi
(Gas Direct Injection) • Develop Adjacent Markets, such
as Medical
End Markets: • Light Vehicle • General Industrial
Develops and Produces a Comprehensive Range of Retaining Rings, Fasteners, Snap Rings and Shims
Growth Drivers: • Expand Globally • Enhance Product Offerings
End Markets: • Light Vehicle • General Industrial
32%
6% 8%
-20-
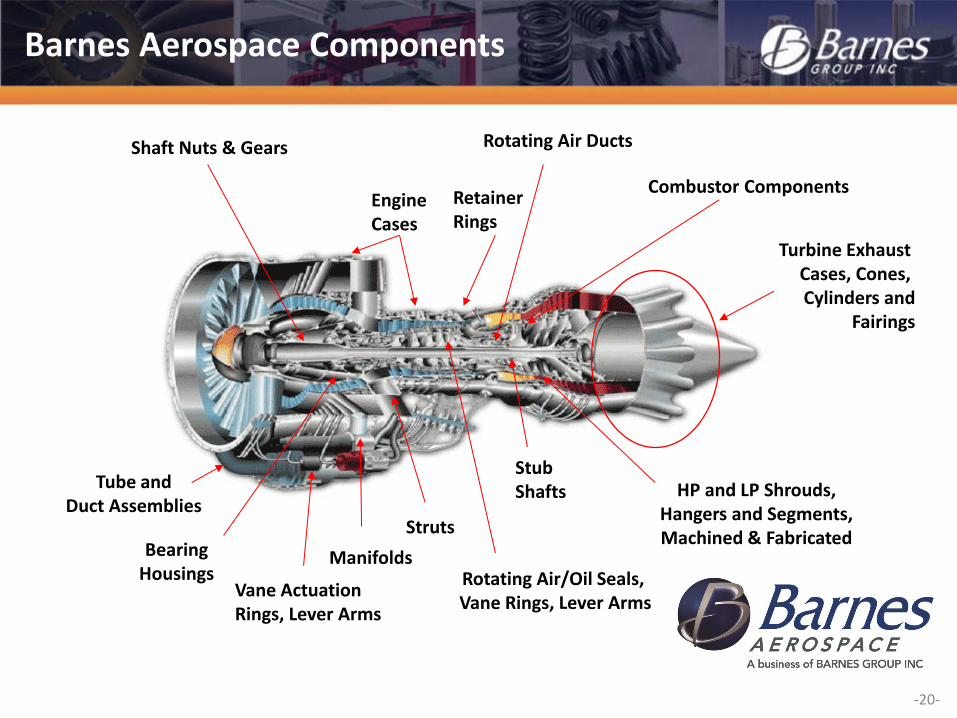
Shaft Nuts & Gears
Engine Cases
Retainer Rings
Rotating Air Ducts
HP and LP Shrouds, Hangers and Segments, Machined & Fabricated
Turbine Exhaust Cases, Cones, Cylinders and
Fairings
Combustor Components
Rotating Air/Oil Seals, Vane Rings, Lever Arms
Stub Shafts
Struts
Manifolds Bearing Housings
Tube and Duct Assemblies
Vane Actuation Rings, Lever Arms
Barnes Aerospace Components
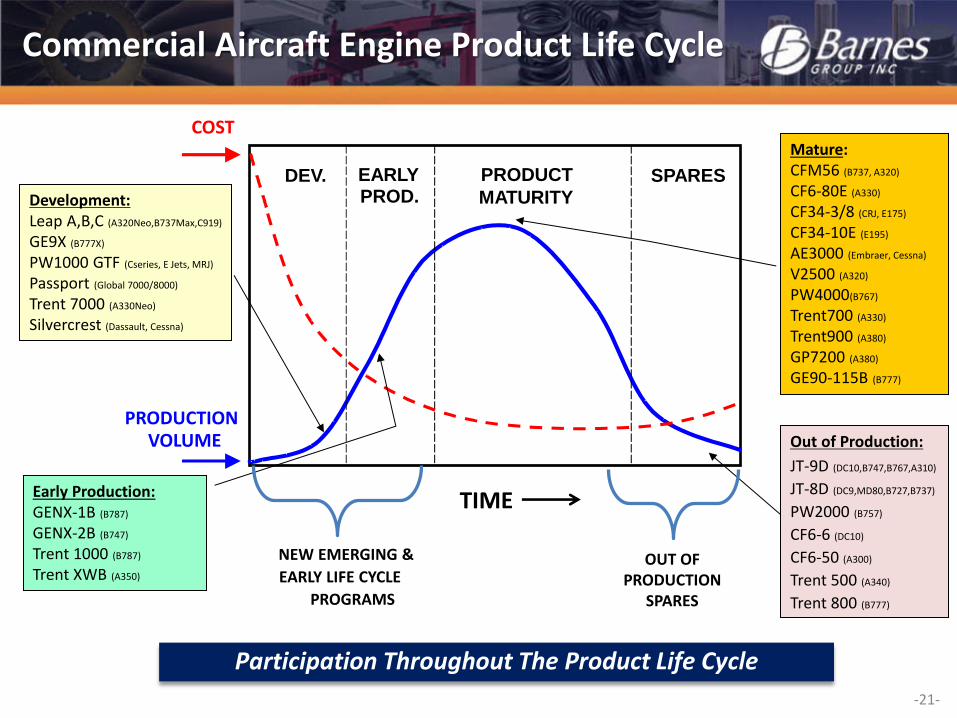
-21-
Out of Production:
JT-9D (DC10,B747,B767,A310)
JT-8D (DC9,MD80,B727,B737)
PW2000 (B757)
CF6-6 (DC10)
CF6-50 (A300)
Trent 500 (A340)
Trent 800 (B777)
Development: Leap A,B,C (A320Neo,B737Max,C919)
GE9X (B777X)
PW1000 GTF (Cseries, E Jets, MRJ)
Passport (Global 7000/8000)
Trent 7000 (A330Neo)
Silvercrest (Dassault, Cessna)
DEV. EARLY PROD.
PRODUCT
MATURITY SPARES
PRODUCTION VOLUME
TIME
COST
OUT OF PRODUCTION
SPARES
NEW EMERGING &
EARLY LIFE CYCLE
PROGRAMS
Mature: CFM56 (B737, A320)
CF6-80E (A330)
CF34-3/8 (CRJ, E175)
CF34-10E (E195)
AE3000 (Embraer, Cessna)
V2500 (A320)
PW4000(B767)
Trent700 (A330)
Trent900 (A380)
GP7200 (A380)
GE90-115B (B777)
Early Production: GENX-1B (B787)
GENX-2B (B747)
Trent 1000 (B787)
Trent XWB (A350)
Participation Throughout The Product Life Cycle
Commercial Aircraft Engine Product Life Cycle
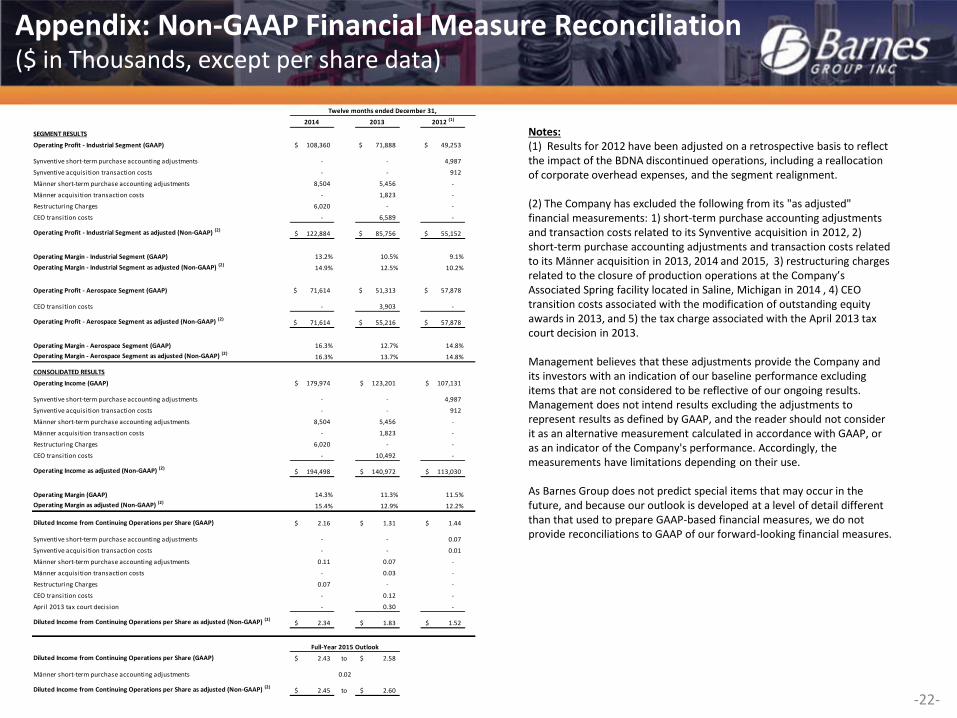
Appendix: Non-GAAP Financial Measure Reconciliation ($ in Thousands, except per share data)
-22-
2014 2013 2012 (1)
SEGMENT RESULTS
Operating Profit - Industrial Segment (GAAP) 108,360$ 71,888$ 49,253$
Synventive short-term purchase accounting adjustments - - 4,987
Synventive acquisition transaction costs - - 912
Männer short-term purchase accounting adjustments 8,504 5,456 -
Männer acquisition transaction costs - 1,823 -
Restructuring Charges 6,020 - -
CEO transition costs - 6,589 -
Operating Profit - Industrial Segment as adjusted (Non-GAAP) (2)122,884$ 85,756$ 55,152$
Operating Margin - Industrial Segment (GAAP) 13.2% 10.5% 9.1%
Operating Margin - Industrial Segment as adjusted (Non-GAAP) (2)14.9% 12.5% 10.2%
Operating Profit - Aerospace Segment (GAAP) 71,614$ 51,313$ 57,878$
CEO transition costs - 3,903 -
Operating Profit - Aerospace Segment as adjusted (Non-GAAP) (2)71,614$ 55,216$ 57,878$
Operating Margin - Aerospace Segment (GAAP) 16.3% 12.7% 14.8%
Operating Margin - Aerospace Segment as adjusted (Non-GAAP) (2)16.3% 13.7% 14.8%
CONSOLIDATED RESULTS
Operating Income (GAAP) 179,974$ 123,201$ 107,131$
Synventive short-term purchase accounting adjustments - - 4,987
Synventive acquisition transaction costs - - 912
Männer short-term purchase accounting adjustments 8,504 5,456 -
Männer acquisition transaction costs - 1,823 -
Restructuring Charges 6,020 - -
CEO transition costs - 10,492 -
Operating Income as adjusted (Non-GAAP) (2)194,498$ 140,972$ 113,030$
Operating Margin (GAAP) 14.3% 11.3% 11.5%
Operating Margin as adjusted (Non-GAAP) (2)15.4% 12.9% 12.2%
Diluted Income from Continuing Operations per Share (GAAP) 2.16$ 1.31$ 1.44$
Synventive short-term purchase accounting adjustments - - 0.07
Synventive acquisition transaction costs - - 0.01
Männer short-term purchase accounting adjustments 0.11 0.07 -
Männer acquisition transaction costs - 0.03 -
Restructuring Charges 0.07 - -
CEO transition costs - 0.12 -
April 2013 tax court decision - 0.30 -
Diluted Income from Continuing Operations per Share as adjusted (Non-GAAP) (2)2.34$ 1.83$ 1.52$
Diluted Income from Continuing Operations per Share (GAAP) 2.43$ to 2.58$
Männer short-term purchase accounting adjustments 0.02
Diluted Income from Continuing Operations per Share as adjusted (Non-GAAP) (2)2.45$ to 2.60$
Twelve months ended December 31,
Full-Year 2015 Outlook
Notes: (1) Results for 2012 have been adjusted on a retrospective basis to reflect the impact of the BDNA discontinued operations, including a reallocation of corporate overhead expenses, and the segment realignment. (2) The Company has excluded the following from its "as adjusted" financial measurements: 1) short-term purchase accounting adjustments and transaction costs related to its Synventive acquisition in 2012, 2) short-term purchase accounting adjustments and transaction costs related to its Männer acquisition in 2013, 2014 and 2015, 3) restructuring charges related to the closure of production operations at the Company’s Associated Spring facility located in Saline, Michigan in 2014 , 4) CEO transition costs associated with the modification of outstanding equity awards in 2013, and 5) the tax charge associated with the April 2013 tax court decision in 2013. Management believes that these adjustments provide the Company and its investors with an indication of our baseline performance excluding items that are not considered to be reflective of our ongoing results. Management does not intend results excluding the adjustments to represent results as defined by GAAP, and the reader should not consider it as an alternative measurement calculated in accordance with GAAP, or as an indicator of the Company's performance. Accordingly, the measurements have limitations depending on their use. As Barnes Group does not predict special items that may occur in the future, and because our outlook is developed at a level of detail different than that used to prepare GAAP-based financial measures, we do not provide reconciliations to GAAP of our forward-looking financial measures.
-23-
Safe Harbor Statement
This presentation contains forward-looking statements as defined in the Private Securities Litigation Reform Act of 1995. Forward-looking statements often address our expected future operating and financial performance and financial condition, and often contain words such as "anticipate," "believe," "expect," "plan," "strategy," "estimate," "project," and similar terms. These forward-looking statements do not constitute guarantees of future performance and are subject to a variety of risks and uncertainties that may cause actual results to differ materially from those expressed in the forward-looking statements. These include, among others: difficulty maintaining relationships with employees, including unionized employees, customers, distributors, suppliers, business partners or governmental entities; failure to successfully negotiate collective bargaining agreements or potential strikes, work stoppages or other similar events; difficulties leveraging market opportunities; changes in market demand for our products and services; rapid technological and market change; the ability to protect intellectual property rights; introduction or development of new products or transfer of work; higher risks in international operations and markets; the impact of intense competition; and other risks and uncertainties described in documents filed with or furnished to the Securities and Exchange Commission ("SEC") by the Company, including, among others, uncertainties relating to conditions in financial markets; currency fluctuations and foreign currency exposure; future financial performance of the industries or customers that we serve; our dependence upon revenues and earnings from a small number of significant customers; a major loss of customers; inability to realize expected sales or profits from existing backlog due to a range of factors, including insourcing decisions, material changes, production schedules and volumes of specific programs; the impact of government budget and funding decisions; changes in raw material or product prices and availability; integration of acquired businesses; restructuring costs or savings; the continuing impact of prior acquisitions and divestitures and any other future strategic actions, including acquisitions, joint ventures, divestitures, restructurings, or strategic business realignments, and our ability to achieve the financial and operational targets set in connection with any such actions; the outcome of pending and future legal, governmental, or regulatory proceedings and contingencies and uninsured claims; future repurchases of common stock; future levels of indebtedness; and numerous other matters of a global, regional or national scale, including those of a political, economic, business, competitive, environmental, regulatory and public health nature. The Company assumes no obligation to update our forward-looking statements.
24