barclays ceo energy/power conference - encana.com · barclays ceo energy/power conference eric...
TRANSCRIPT
Encana Corporation
Barclays CEO Energy/Power Conference
Eric Marsh | Executive Vice-President, Encana Corp. & Sr. Vice-President, USA Division
September 6, 2012 | New York, NY
take a closer look
1
2
Greater Sierra (inc. Horn River)
Duvernay
Cutbank Ridge (inc. Montney)
Bighorn
Coalbed Methane
Jonah
DJ NiobraraNiobrara/Mancos
Piceance
TexasHaynesville
Tuscaloosa
*Excludes confidential land.
Collingwood/Utica
Deep Panuke
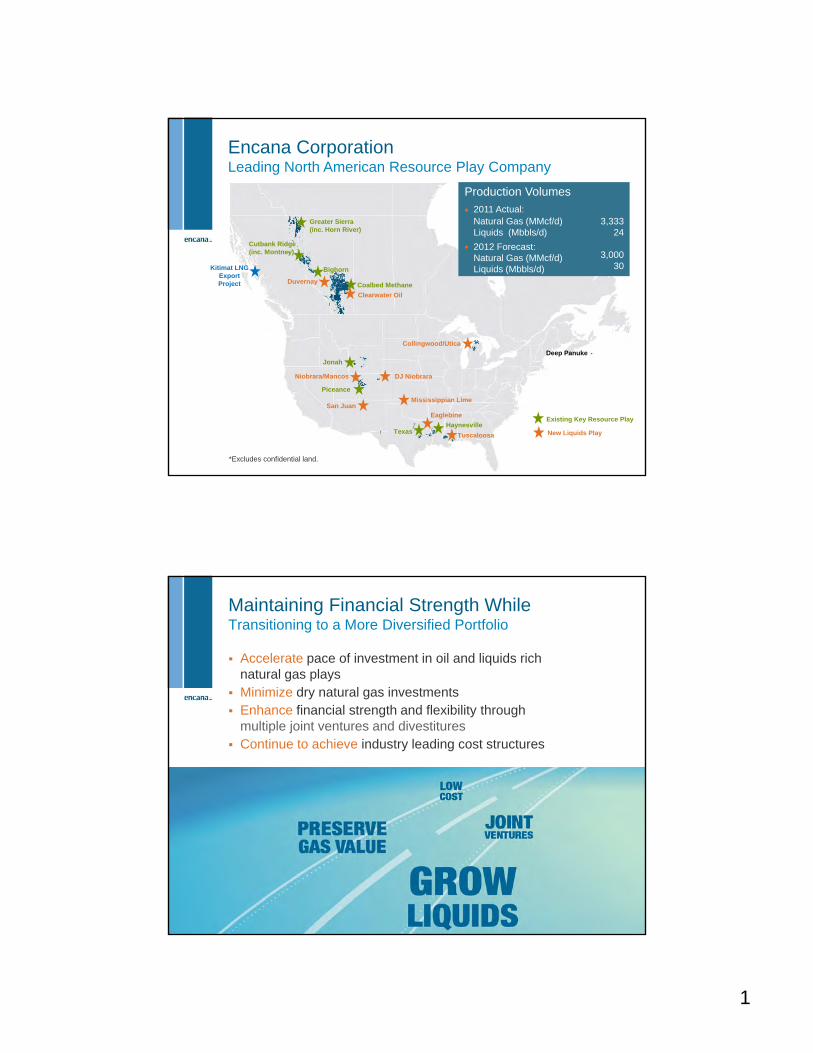
Encana CorporationLeading North American Resource Play Company
Kitimat LNG Export Project
Existing Key Resource Play
New Liquids Play
Mississippian LimeSan Juan
Eaglebine
Production Volumes
• 2011 Actual:
•
Natural Gas (MMcf/d)Liquids (Mbbls/d)
2012 Forecast:Natural Gas (MMcf/d)Liquids (Mbbls/d)
3,33324
3,00030
Clearwater Oil
3
Accelerate pace of investment in oil and liquids rich natural gas plays
Minimize dry natural gas investments Enhance financial strength and flexibility through
multiple joint ventures and divestitures Continue to achieve industry leading cost structures
Maintaining Financial Strength While Transitioning to a More Diversified Portfolio
2
4
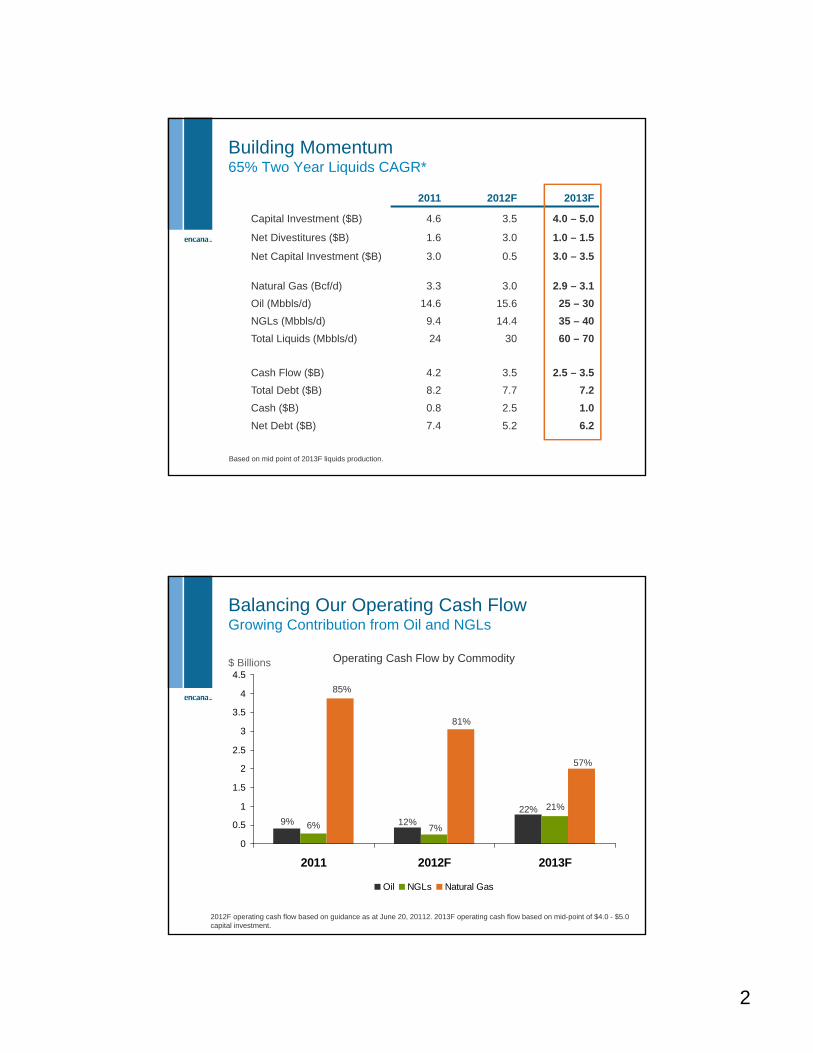
Building Momentum65% Two Year Liquids CAGR*
2011 2012F 2013F
Capital Investment ($B) 4.6 3.5 4.0 – 5.0
Net Divestitures ($B) 1.6 3.0 1.0 – 1.5
Net Capital Investment ($B) 3.0 0.5 3.0 – 3.5
Natural Gas (Bcf/d) 3.3 3.0 2.9 – 3.1
Oil (Mbbls/d) 14.6 15.6 25 – 30
NGLs (Mbbls/d) 9.4 14.4 35 – 40
Total Liquids (Mbbls/d) 24 30 60 – 70
Cash Flow ($B) 4.2 3.5 2.5 – 3.5
Total Debt ($B) 8.2 7.7 7.2
Cash ($B) 0.8 2.5 1.0
Net Debt ($B) 7.4 5.2 6.2
Based on mid point of 2013F liquids production.
5
Balancing Our Operating Cash FlowGrowing Contribution from Oil and NGLs
0
0.5
1
1.5
2
2.5
3
3.5
4
4.5
2011 2012F 2013F
Oil NGLs Natural Gas
$ Billions
2012F operating cash flow based on guidance as at June 20, 20112. 2013F operating cash flow based on mid-point of $4.0 - $5.0 capital investment.
9% 6%
85%
81%
12%7%
57%
21%22%
Operating Cash Flow by Commodity

3
6
Base capital program funded by cash flow Expect to achieve net divestitures of $1.0B - $1.5B High degree of confidence in our ability to execute joint ventures and
divestitures Will only spend beyond cash flow once additional proceeds are secured
through divestitures or JVs
2013 Capital Program Funding SourcesMaintaining Financial Strength & Flexibility a Top Priority
4
Capital ($B)
2
0
1
3
5Expected proceeds
Preliminary Projections of 2013 Capital
Base program
Additional proceeds
Minimum expected proceeds
2013F cash flow generation $2.5B - $3.5B
Assumptions: 2013F NYMEX $3.50, WTI $90, NGLs 40% of WTI; hedge price is $5.24 on 500 MMcf/d. Field condensate booked as oil.
7
Transitioning to a More Balanced PortfolioAccelerating Pace of Development in Oil & Liquids Rich Natural Gas Plays
Liquids PlayOriginal 2012FWells
Current 2012F Wells
Duvernay 5 - 10 10
Tuscaloosa 5 12
DJ Basin Niobrara 10+ 12
Eaglebine 6 12
Piceance Niobrara/Mancos
5+ 5+
San Juan 5 12
Collingwood/Utica - 5
Mississippian Lime - 15
Clearwater Oil - 30
Other 2 – 5 2 - 5
Total 40 - 45 115 - 120
Increased oil and liquids rich natural gas land position to ~3 million net acres over past 3 years
Accelerated pace of exploration and delineation
Achieved technical success across most plays
Expect to drill up to 350 wells in 2013
Expect multiple plays to reach commerciality in 2012
Expect meaningful contribution to 2013F production and cash flow
4
8
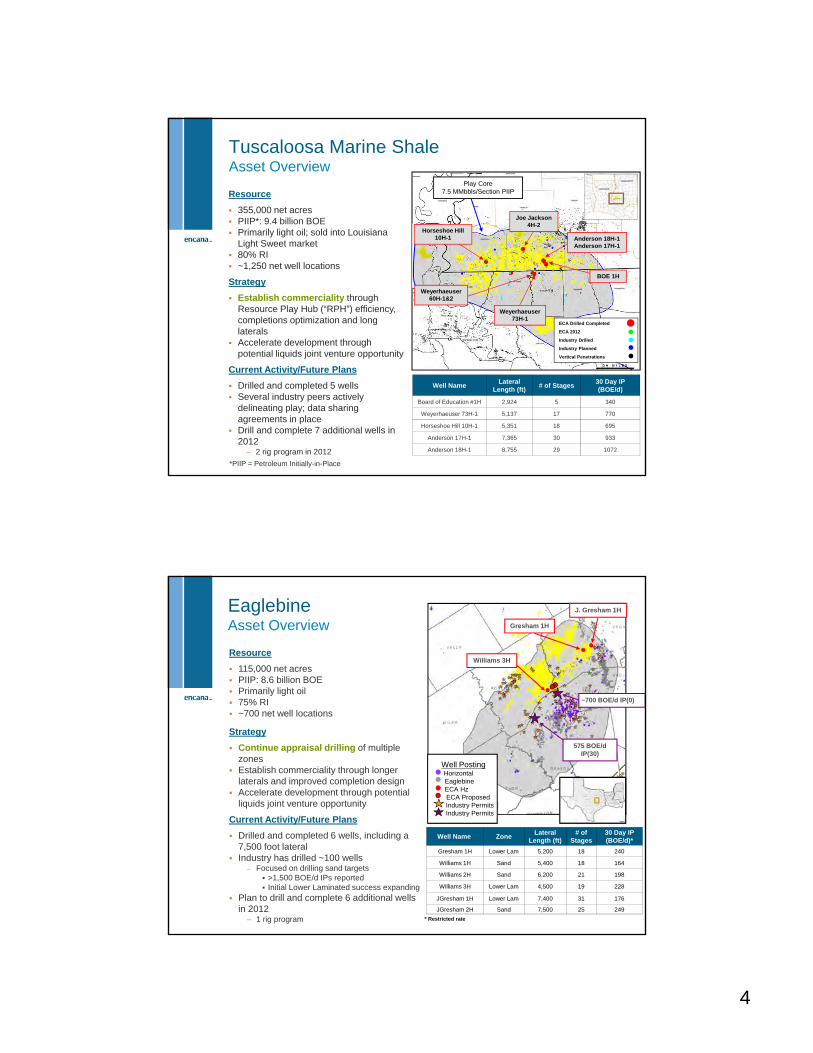
Tuscaloosa Marine Shale Asset Overview
Weyerhaeuser 73H-1
BOE 1H
Anderson 18H-1 Anderson 17H-1
Joe Jackson 4H-2
Play Core 7.5 MMbbls/Section PIIP
ECA Drilled Completed
ECA 2012
Industry Drilled
Industry Planned
Vertical Penetrations
Well NameLateral
Length (ft)# of Stages
30 Day IP (BOE/d)
Board of Education #1H 2,924 5 340
Weyerhaeuser 73H-1 5,137 17 770
Horseshoe Hill 10H-1 5,351 18 695
Anderson 17H-1 7,365 30 933
Anderson 18H-1 8,755 29 1072
Weyerhaeuser 60H-1&2
Horseshoe Hill 10H-1
Resource
355,000 net acres PIIP*: 9.4 billion BOE Primarily light oil; sold into Louisiana
Light Sweet market 80% RI ~1,250 net well locations
Strategy
Establish commerciality through Resource Play Hub (“RPH”) efficiency, completions optimization and long laterals
Accelerate development through potential liquids joint venture opportunity
Current Activity/Future Plans
Drilled and completed 5 wells Several industry peers actively
delineating play; data sharing agreements in place
Drill and complete 7 additional wells in 2012
– 2 rig program in 2012
*PIIP = Petroleum Initially-in-Place
9
EaglebineAsset Overview
Well Name ZoneLateral
Length (ft)# of
Stages30 Day IP (BOE/d)*
Gresham 1H Lower Lam 5,200 18 240
Williams 1H Sand 5,400 18 164
Williams 2H Sand 6,200 21 198
Williams 3H Lower Lam 4,500 19 228
JGresham 1H Lower Lam 7,400 31 176
JGresham 2H Sand 7,500 25 249
* Restricted rate
Resource
115,000 net acres PIIP: 8.6 billion BOE Primarily light oil 75% RI ~700 net well locations
Strategy
Continue appraisal drilling of multiple zones
Establish commerciality through longer laterals and improved completion design
Accelerate development through potential liquids joint venture opportunity
Current Activity/Future Plans
Drilled and completed 6 wells, including a 7,500 foot lateral
Industry has drilled ~100 wells– Focused on drilling sand targets
>1,500 BOE/d IPs reported Initial Lower Laminated success expanding
Plan to drill and complete 6 additional wells in 2012
– 1 rig program
Gresham 1H
J. Gresham 1H
Williams 3H
~700 BOE/d IP(0)
575 BOE/d IP(30)
Well PostingHorizontal EaglebineECA HzECA ProposedIndustry PermitsIndustry Permits
5
10
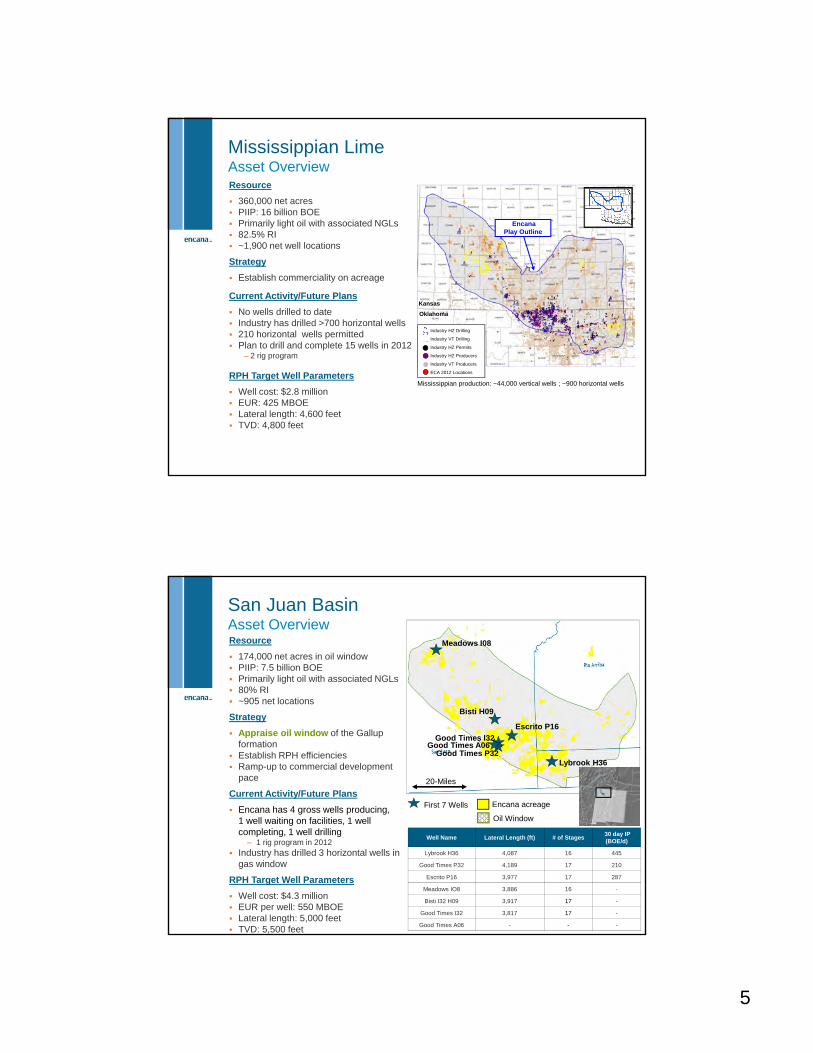
Mississippian LimeAsset Overview
Kansas
Oklahoma
EncanaPlay Outline
Industry HZ Drilling
Industry VT Drilling
Industry HZ Permits
Industry HZ Producers
Industry VT Producers
ECA 2012 Locations
Mississippian production: ~44,000 vertical wells ; ~900 horizontal wells
Resource
360,000 net acres PIIP: 16 billion BOE Primarily light oil with associated NGLs 82.5% RI ~1,900 net well locations
Strategy
Establish commerciality on acreage
Current Activity/Future Plans
No wells drilled to date Industry has drilled >700 horizontal wells 210 horizontal wells permitted Plan to drill and complete 15 wells in 2012
– 2 rig program
RPH Target Well Parameters
Well cost: $2.8 million EUR: 425 MBOE Lateral length: 4,600 feet TVD: 4,800 feet
11
San Juan BasinAsset Overview
Well Name Lateral Length (ft) # of Stages30 day IP (BOE/d)
Lybrook H36 4,087 16 445
Good Times P32 4,189 17 210
Escrito P16 3,977 17 287
Meadows IO8 3,886 16 -
Bisti I32 H09 3,917 17 -
Good Times I32 3,817 17 -
Good Times A06 - - -
First 7 Wells Encana acreage
NM
20-Miles
Lybrook H36
Escrito P16
Meadows I08
Bisti H09
Good Times P32
Oil Window
Resource
174,000 net acres in oil window PIIP: 7.5 billion BOE Primarily light oil with associated NGLs 80% RI ~905 net locations
Strategy
Appraise oil window of the Gallup formation
Establish RPH efficiencies Ramp-up to commercial development
pace
Current Activity/Future Plans
Encana has 4 gross wells producing, 1 well waiting on facilities, 1 well completing, 1 well drilling
– 1 rig program in 2012 Industry has drilled 3 horizontal wells in
gas window
RPH Target Well Parameters
Well cost: $4.3 million EUR per well: 550 MBOE Lateral length: 5,000 feet TVD: 5,500 feet
Good Times I32Good Times A06

6
12
DuvernayAsset Overview
Resource
400,000 net acres
97% average working interest
PIIP*: ~8.7 billion BOE
50 – 60 API oil gravity
1,020 – 1,170 Btu/scf average heat content
1,000 – 1,600 net well locations
160 – 330 acre expected well spacing
Strategy
Appraisal and early Resource Play Hub (RPH) development evaluation
Current Activity/Future Plans
10 wells planned for 2012– 2 rig program
Continue reservoir characterization
Design liquids handling facilities
Upgrade roads and infrastructure
13
Duvernay The Encana Advantage Encana has captured over half of
the high-graded liquids rich gas condensate fairway
Encana free condensate yield results are top quartile
Estimate 30 Tcf and 4 Bbbls PIIP on Encana lands
Cutting edge reservoir characterization techniques
Well developed infrastructure and access to markets enables early production growth
WellLateral
Length (ft)# of
StagesGas
(MMcf/d)Field Liquid Yields
(bbls/MMcf)
11-8-62-24W5 Vertical 1 0.2 300
16-5-62-24W5 3,940 10 2.7 200
13-17-43-4W5* 4,100 10 0.5 190
13-5-43-6W5 1,700 8 1.6 120
* The 13-17 well was highly restricted
RPH Target Well Parameters
Well cost: $15 million
EUR per well: – 3 – 6 Bcf
– 350 – 600 Mbbls
Lateral length: 3,500 – 6,500 feet
TVD: 8,300 – 13,000 feet

7
14
Increasing Liquids Extraction with Deep CutLow-Risk, Low-Cost Barrels
Planned Deep Cut expansions:
– 5,000 bbls/d at Musreau – Q3 2012
– 3,000 bbls/d at Gordondale –Q4 2012
– 12,000 bbls/d at Resthaven –Phase 1 Q2 2014
– 11,800 bbls/d at Dawson Creek – Q3 2015
– Plus additional expansions
15
$1.39 $1.38
$1.01
$0.70$0.88
$1.39
$0.00
$0.50
$1.00
$1.50
$2.00
$2.50
$3.00
Dewpoint Shallow Cut Deep Cut
Natural Gas NGLs
Increasing Exposure to Oil and NGLsLiquids Value Uplift
C$/Mcfe*
* Based on 1,100 Btu/Mcf wellhead gas yielding approximately 90 bbls of NGLs per 1 MMcf. Before transportation costs. Canadian Deep Basin illustrative example.
Price Differential Example on 1 Mcf at the Wellhead
8
16
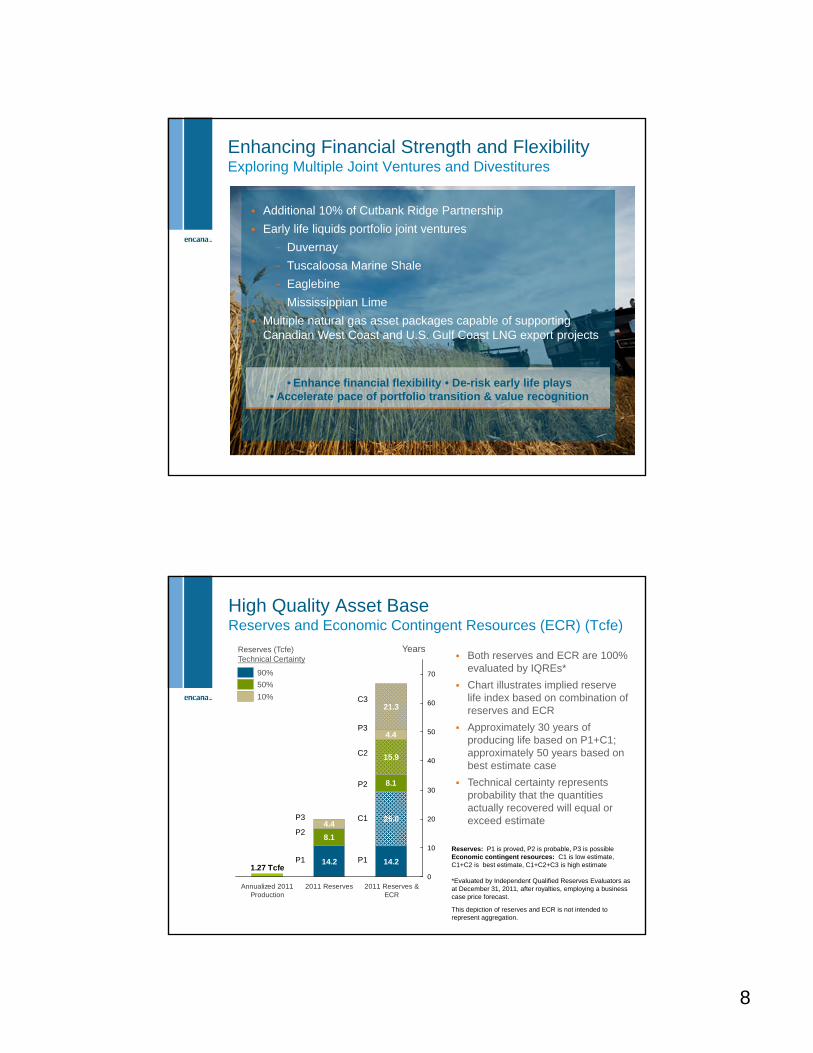
Enhancing Financial Strength and FlexibilityExploring Multiple Joint Ventures and Divestitures
Additional 10% of Cutbank Ridge Partnership
Early life liquids portfolio joint ventures
− Duvernay
− Tuscaloosa Marine Shale
− Eaglebine
− Mississippian Lime
Multiple natural gas asset packages capable of supporting Canadian West Coast and U.S. Gulf Coast LNG export projects
• Enhance financial flexibility • De-risk early life plays • Accelerate pace of portfolio transition & value recognition
17
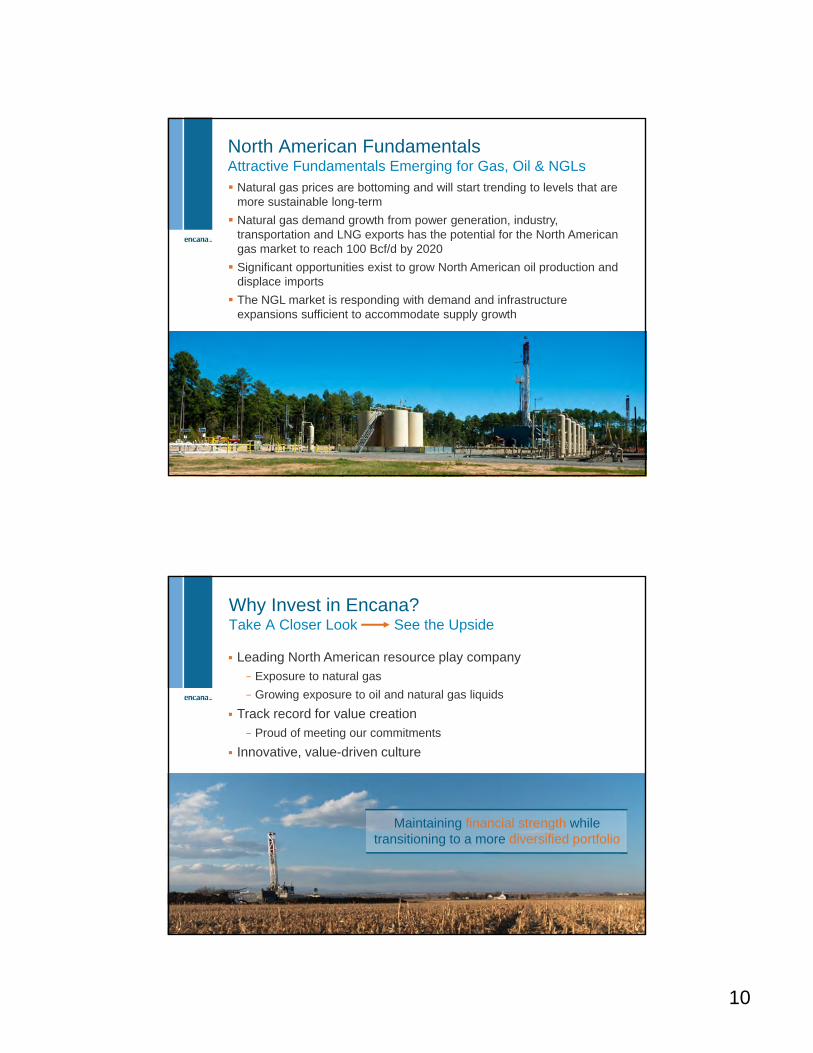
High Quality Asset BaseReserves and Economic Contingent Resources (ECR) (Tcfe)
Reserves: P1 is proved, P2 is probable, P3 is possibleEconomic contingent resources: C1 is low estimate, C1+C2 is best estimate, C1+C2+C3 is high estimate
*Evaluated by Independent Qualified Reserves Evaluators as at December 31, 2011, after royalties, employing a business case price forecast.
This depiction of reserves and ECR is not intended to represent aggregation.
Both reserves and ECR are 100% evaluated by IQREs*
Chart illustrates implied reserve life index based on combination of reserves and ECR
Approximately 30 years of producing life based on P1+C1; approximately 50 years based on best estimate case
Technical certainty represents probability that the quantities actually recovered will equal or exceed estimate
Years
14.2 14.2
8.1
25.04.4
8.1
1.27 Tcfe
15.9
4.4
21.3
0
10
20
30
40
50
60
70
80
90
100
Annualized 2011Production
2011 Reserves 2011 Reserves &ECR
0
10
20
30
40
50
60
70
P1
P2
P3
P1
P2
P3
C1
C2
C3
90%
50%
10%
Reserves (Tcfe)Technical Certainty

9
18
$1.5 billion of long term debt maturing in the next five years
$1.8 billion of cash and short term investments at June 30, 2012; expect ~$2.5 billion by year end
~$5 billion of undrawn bank lines committed until 2015
Joint venture partners are expected to partially fund development of select plays
Maintain investment grade credit rating as it provides cost effective financing options
− Moody’s – Baa2 (Stable)
− Standard & Poor’s – BBB (Stable)
− DBRS – BBB+ (Negative)
Encana CorporationLiquidity Supports Execution of Strategy
19
Continue to Achieve Industry Leading Cost StructuresEncana - North America’s Resource Play Specialist
Established history of developing resource plays from the
ground up:
From early stage identification
– Supported by dedicated new venture teams
To large scale commercialization
– “Resource Play Hub” development model
Ingrained culture of innovation and defineddevelopment model with a successful track record
10
20
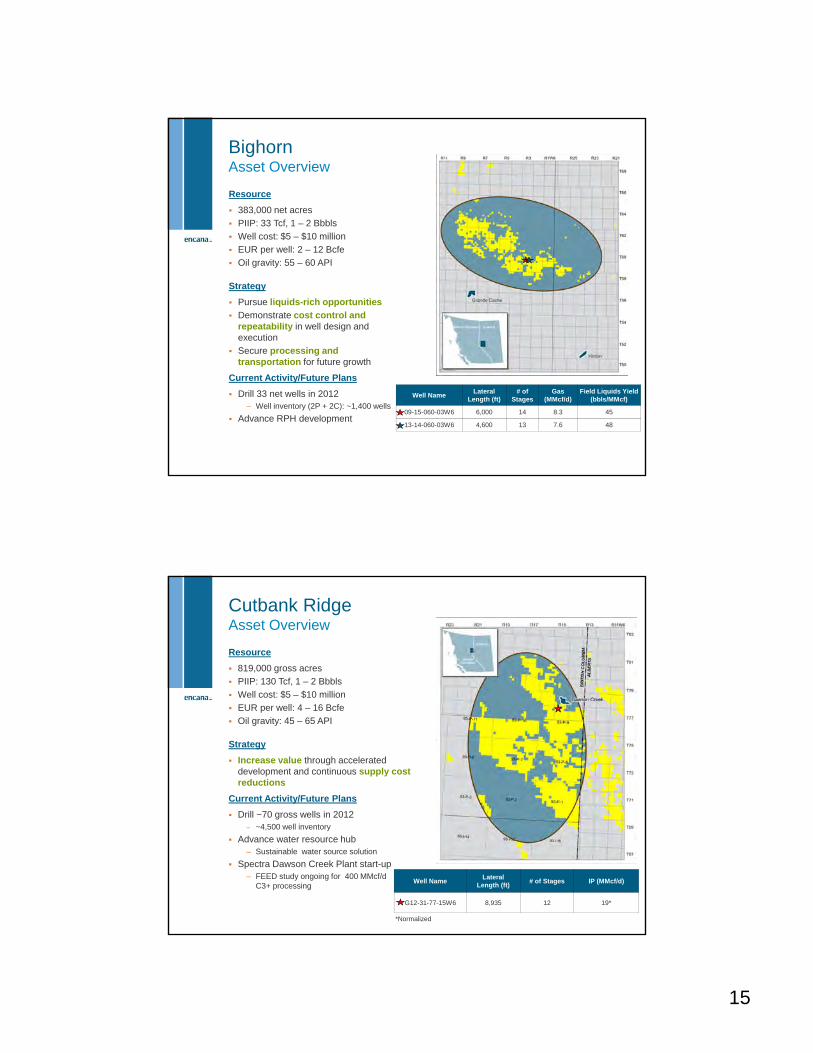
North American Fundamentals Attractive Fundamentals Emerging for Gas, Oil & NGLs
Natural gas prices are bottoming and will start trending to levels that are more sustainable long-term
Natural gas demand growth from power generation, industry, transportation and LNG exports has the potential for the North American gas market to reach 100 Bcf/d by 2020
Significant opportunities exist to grow North American oil production and displace imports
The NGL market is responding with demand and infrastructure expansions sufficient to accommodate supply growth
21
Maintaining financial strength while transitioning to a more diversified portfolio
Why Invest in Encana?Take A Closer Look See the Upside
Leading North American resource play company
− Exposure to natural gas
− Growing exposure to oil and natural gas liquids
Track record for value creation
− Proud of meeting our commitments
Innovative, value-driven culture

11
Supplemental
23
0 1 2 3 4 5 6 7 8
Other
Jonah
Texas
Piceance
Haynesville
Bighorn
CBM
Horn River
Greater Sierra
Peace River Arch
Cutbank Ridge1
2
3
1P (Proved)
Reserves
Evaluated by Independent Qualified Reserves Evaluators as of December 31, 2011.*Increase relative to year-end 20101. Includes Montney, Cadomin and Doig in B.C.; includes Partnership and Non-Partnership reserves and resources.2. Includes Gordondale, Pipestone and Sexsmith.3. Greater Sierra is Jean Marie only (excluding Horn River).
Proved Reserves and 1C Economic Contingent Resources (Tcfe)
1C (Low Estimate)
Economic Contingent Resources
Tremendous Resource PotentialIncreased 1C Economic Contingent Resources by 25%*
High quality, low risk inventory – 90%
probability.

12
24
Comprehensive Disclosure of Reserves & ResourcesLargest Reserves and Resource Life in Encana’s History
Encana Reserves and Resources (Tcfe) 1
Estimated reserves Estimated economic contingent resources
KRPP1
Proved
P2
Probable
P3
PossibleC1 C2 C3
Cutbank Ridge 2 1.7 0.7 0.5 6.0 2.1 3.6
Peace River Arch 3 0.5 0.1 0.1 1.3 0.3 0.3
Greater Sierra 4 1.3 0.9 0.5 2.2 2.6 5.2
CBM 1.9 0.4 0.4 1.4 0.1 0.2
Bighorn 1.2 0.6 0.3 1.1 1.4 1.6
Haynesville 2.4 2.6 0.8 4.2 4.1 3.6
Piceance 1.5 1.0 0.7 3.2 3.0 3.2
Texas 0.7 0.6 0.1 3.5 1.2 2.1
Jonah 1.8 0.5 0.5 0.3 0.7 0.7
Other 5 1.2 0.7 0.5 1.8 0.4 0.8
Total 14.2 8.1 4.4 25.0 15.9 21.3
1. As of December 31, 2011 using forecast prices and costs. 2. Includes Montney, Cadomin and Doig in B.C.; includes Partnership and Non-Partnership reserves and resources. 3. Includes Gordondale, Pipestone and Sexsmith.4. Includes Horn River.5. Includes Panuke, DJ, Wind/Green River Basins, Canadian non-KRP.
25
Reserves and Contingent Resources Definitions
Characterization of Petroleum Initially in Place (PIIP)Reserve – Resource DescriptionPetroleum Resource Management System
SPE – PRMS
Deve lopme ntnot viable
Onproduc tion
P lay
Prospect
Lead
Deve lopme ntunc larifiedor on hold
Deve lopme ntpe nding
Justified fordevelopme nt
App roved fordevelopment
Project MaturitySub-Classes
Inc
rea
sing
Ch
an
ce o
f C
om
me
rcia
lity
Increasing Uncertainty of Recovery
PROSPECTIVE RESOURCES
-------------Commercially or Physically Unrecoverable---------------
CONTINGENT R ESOURCES1C (Low ) 2C (Best)
3C (High)
P 90Es tima te
P 50Estimate
P10E stimate
UN
DIS
CO
VE
RE
DD
ISC
OV
ER
ED
SU
B-C
OM
ME
RC
IAL
CO
MM
ER
CIA
L
LowBest
High
SU
B-E
CO
NO
MIC
EC
ON
OM
IC
-------------Commercially or Physically Unrecoverable---------------
Incr
eas
ing
Ch
anc
e o
f C
om
me
rcia
lityP ossible (P3)Probab le (P2)Proved (P1)
RESERVES
1P2P
3P

13
26
Leading N.A. Resource Play CompanyEncana Resource Play Execution Methodology
Resource Play Methodology
Work With Governments – Engage Stakeholders Address Infrastructure
Exploration
Assemble Land Base
Pilot
Understand Technical
CommercialDemonstration
Crack Technical Nut
CommercialDevelopment
Manufacturing Style
PlayOptimization
Lookbacks & Learnings
Encana has a defined and highly successful methodology for developing resource plays “from the ground up” that will
support the advancement of new liquids focused opportunities
27
Implement Mitsubishi and Toyota joint ventures
Evaluate Duvernay and other potential liquids-rich assets
Advance liquids extraction through deep-cut midstream arrangements
Initiate Clearwater liquids development
Pursue additional joint venture activity
Transition of Cabin and Cutbank midstream infrastructure to 3rd
party operators
Canadian Division2012 – 2013 Strategic Focus
Encana Land (Dec. 31, 2011)
Total Canadian Division Net Acres: ~8.5 MM

14
28
0
5
10
15
20
25
30
2011 2012F 2013F
Oil NGLs
Continuing development of liquids rich plays
– Bighorn, Peace River Arch (PRA) Montney
Advancing Duvernay appraisal
Implementing deep cut processing
– Musreau, Gordondale
Evaluating Clearwater oil plays
2013F production
– NGLs: ~25 Mbbls/d
– Oil: ~8 Mbbls/d
– Natural gas: ~1,600 MMcf/d
Canadian Division Production Profile2012 and 2013 Liquids Growth Strategy
Liquids Production (Mbbls/d)
29
Peace River Arch Asset Overview
WellLateral
Length (ft)# of
StagesGas
(MMcf/d)Field Liquids Yield
(bbls/MMcf)
10-22-78-11W6 10,600 18 6.7 41
1-5-79-11W6 7,298 14 5.8 16
9-6-79-11W6 12,900 18 5.2 103
Resource
435,000 net acres
PIIP: 36 Tcf, 1 – 3 Bbbls
Well cost: $7.5 – $11.5 million
EUR per well: 4 – 16 Bcfe
Oil gravity: 47 – 63 API
Strategy
Accelerate liquids production
Advance multi-well pad development
Current Activity/Future Plans
Drill 21 Montney Hz wells in 2012– Well inventory (2P + 2C): 300 wells
Infill drilling in core area
Retain core lands
Expand infrastructure
15
30
BighornAsset Overview
Well NameLateral
Length (ft)# of
StagesGas
(MMcf/d)Field Liquids Yield
(bbls/MMcf)
09-15-060-03W6 6,000 14 8.3 45
13-14-060-03W6 4,600 13 7.6 48
Resource
383,000 net acres
PIIP: 33 Tcf, 1 – 2 Bbbls
Well cost: $5 – $10 million
EUR per well: 2 – 12 Bcfe
Oil gravity: 55 – 60 API
Strategy
Pursue liquids-rich opportunities
Demonstrate cost control and repeatability in well design and execution
Secure processing and transportation for future growth
Current Activity/Future Plans
Drill 33 net wells in 2012– Well inventory (2P + 2C): ~1,400 wells
Advance RPH development
31
Cutbank RidgeAsset Overview
Well NameLateral
Length (ft)# of Stages IP (MMcf/d)
G12-31-77-15W6 8,935 12 19*
*Normalized
Resource
819,000 gross acres
PIIP: 130 Tcf, 1 – 2 Bbbls
Well cost: $5 – $10 million
EUR per well: 4 – 16 Bcfe
Oil gravity: 45 – 65 API
Strategy
Increase value through accelerated development and continuous supply cost reductions
Current Activity/Future Plans
Drill ~70 gross wells in 2012 – ~4,500 well inventory
Advance water resource hub – Sustainable water source solution
Spectra Dawson Creek Plant start-up– FEED study ongoing for 400 MMcf/d
C3+ processing

16
32
Clearwater Asset Overview
Resource
4.6 million net acres
Encana owns mineral rights on 78% of lands
Average royalty rate of ~2%
PIIP: 12 Tcf (CBM), 200 MMbbls
Strategy
Advance conventional oil plays
Maintain CBM competence
Current Activity/Future Plans
Plan to drill 30 Clearwater oil wells
Pause on dry gas activity
Execute on Wheatland Toyota JV– 2 – 3 rig program
Estimated well inventory (2P + 2C): ~13,200 wells
33
100
1000
10000
100000
0 500 1000 1500 2000 2500 3000 3500 4000 4500 5000 5500 6000 6500
Flow Time (hrs)
Norm
alize
d G
as R
ate
(m
cf/d)
Nor
mal
ized
Gas
Rat
e (M
cf/d
)
Production hours
13-8-70-9W6 Slickwater Performance
Avg Well Performance Pre-Slickwater
Pipestone Slickwater PerformanceNormalized Production
Top decile performance
10% lower completion cost
Pipestone
Saturn
Sundown
Bissette
Upper Montney
Lower Montney
13-8-70-9W6
17
34
0
20
40
60
80
100
CARD. DUNV. CDTT Vertical Wells FLHR F / WLRCH A
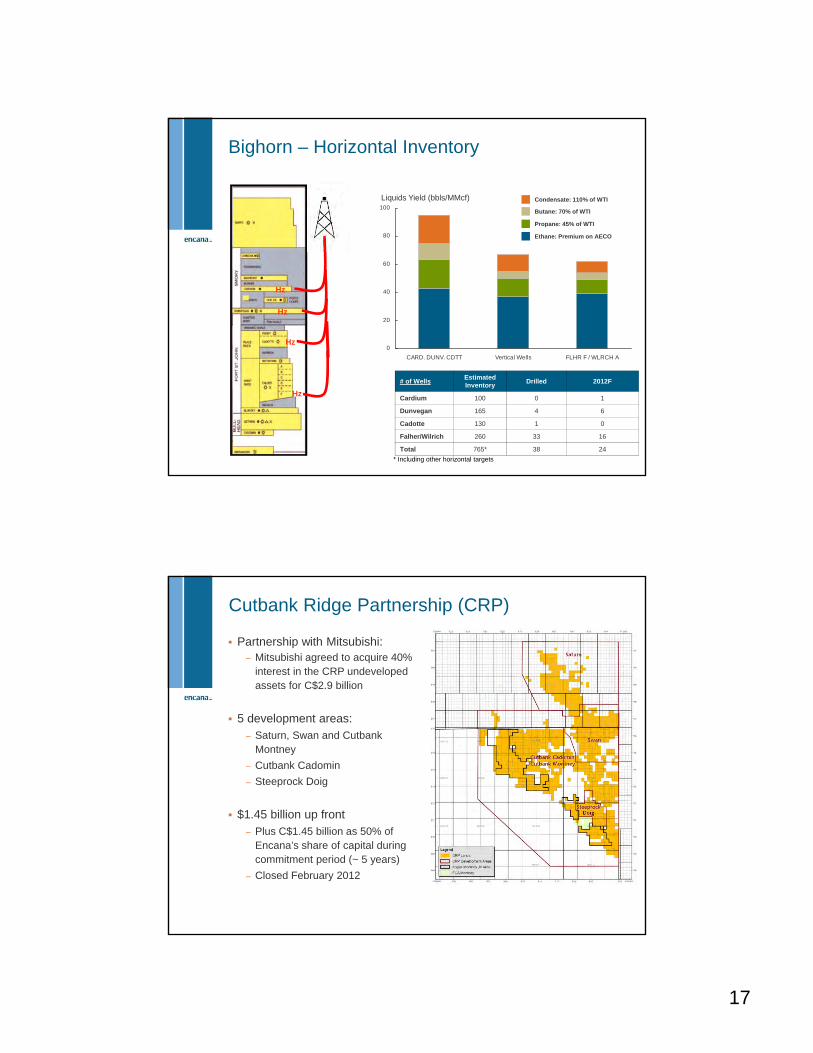
Bighorn – Horizontal Inventory
# of WellsEstimatedInventory
Drilled 2012F
Cardium 100 0 1
Dunvegan 165 4 6
Cadotte 130 1 0
Falher/Wilrich 260 33 16
Total 765* 38 24
* Including other horizontal targets
Hz
Hz
Hz
Hz
Condensate: 110% of WTI
Butane: 70% of WTI
Propane: 45% of WTI
Ethane: Premium on AECO
Liquids Yield (bbls/MMcf)
35
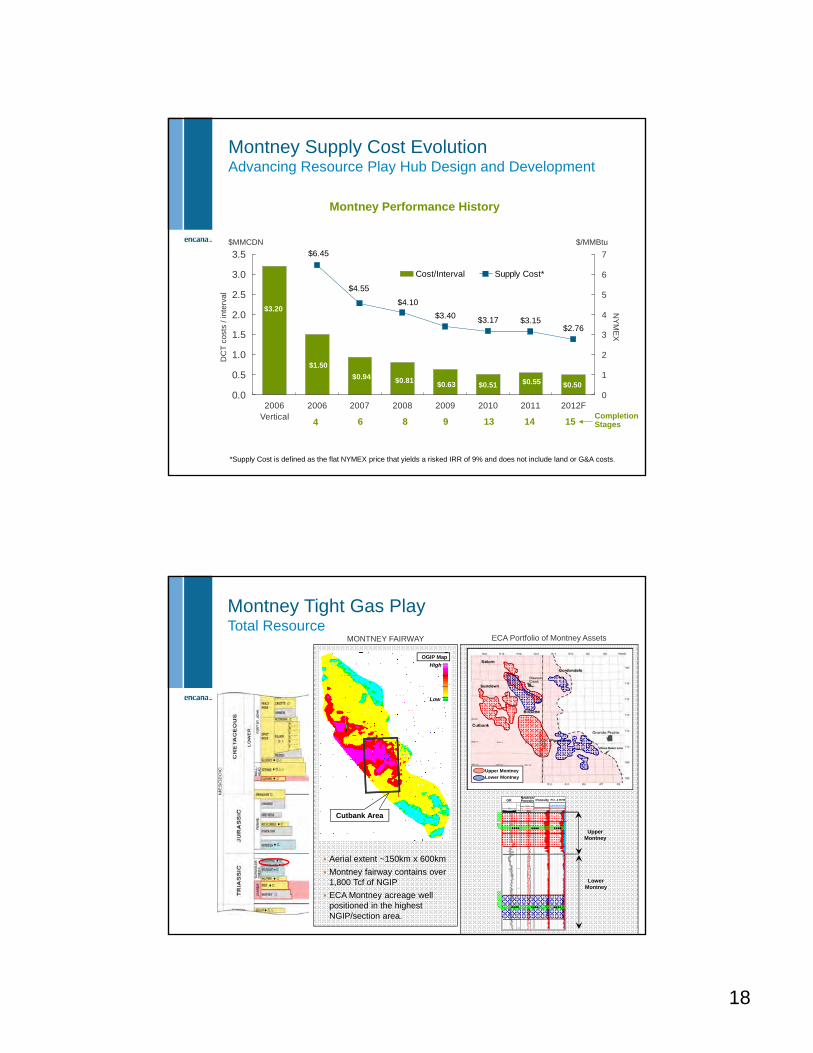
Cutbank Ridge Partnership (CRP)
Partnership with Mitsubishi:– Mitsubishi agreed to acquire 40%
interest in the CRP undeveloped assets for C$2.9 billion
5 development areas:– Saturn, Swan and Cutbank
Montney
– Cutbank Cadomin
– Steeprock Doig
$1.45 billion up front– Plus C$1.45 billion as 50% of
Encana’s share of capital during commitment period (~ 5 years)
– Closed February 2012
18
36
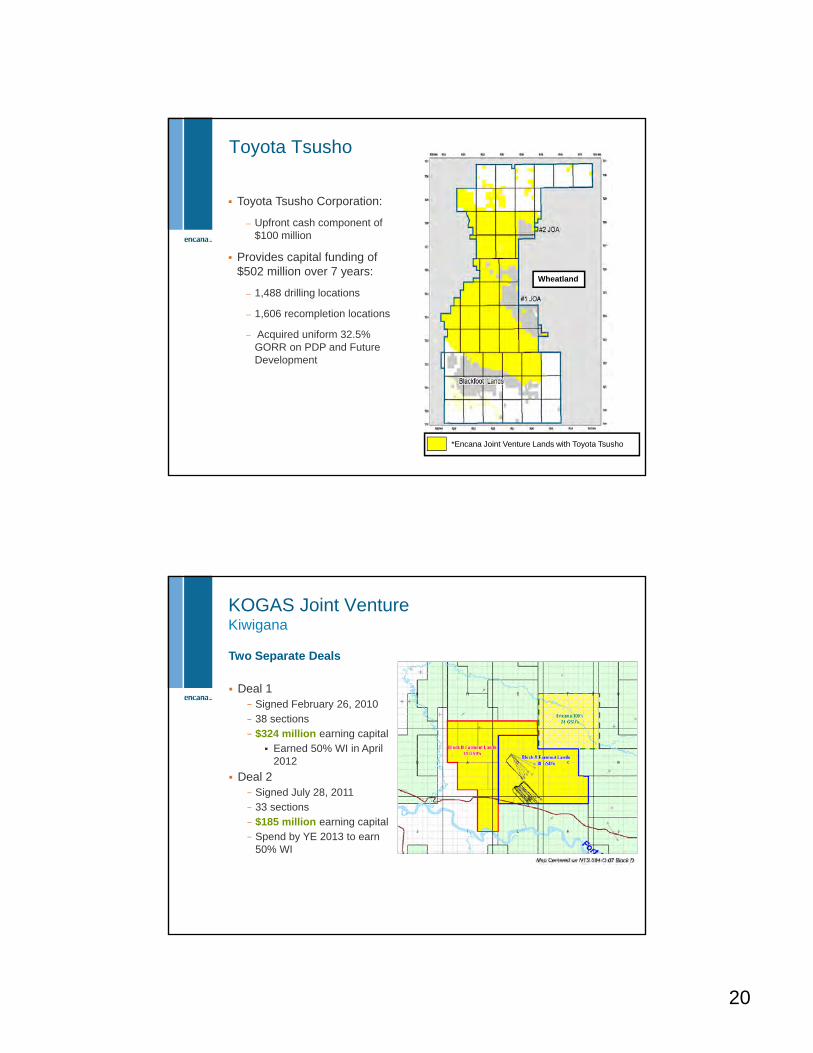
Montney Supply Cost EvolutionAdvancing Resource Play Hub Design and Development
*Supply Cost is defined as the flat NYMEX price that yields a risked IRR of 9% and does not include land or G&A costs.
$0.50$0.55
$3.20
$0.63 $0.51
$1.50
$0.94 $0.81
$3.17 $3.15$2.76
$4.10
$6.45
$4.55
$3.40
0.0
0.5
1.0
1.5
2.0
2.5
3.0
3.5
2006Vertical
2006 2007 2008 2009 2010 2011 2012F0
1
2
3
4
5
6
7
Cost/Interval Supply Cost*
$/MMBtu$MMCDN
Montney Performance HistoryD
CT
cos
ts /
inte
rval
NY
ME
X
4 6 8 9 13Completion Stages14 15
37
Aerial extent ~150km x 600km
Montney fairway contains over 1,800 Tcf of NGIP
ECA Montney acreage well positioned in the highest NGIP/section area.
MONTNEY FAIRWAY
High
Montney Tight Gas Play Total Resource
GR_1GAPI0 200
2500
2550
2600
2650
2700
2750
2451.5
2754.0
MD
2451.5
2754.0
NPSS_1V/V0.45 -0.15
RHOB_2
K/M31950 2950
EVAL_MONTNEY.PHIT_1V/V0.15 0
EVAL_MONTNEY.PHIT_1V/V0.15 0
EVAL_MONTNEY.VOL_UWAT_V/V0.15 0
GR Porosity
Upper Montney
Neutron/Porosity
Lower Montney
Por. & BVW
ECA Portfolio of Montney Assets
Cutbank Area
OGIP Map
Low
Upper Montney
Lower Montney

19
38
5 well pilot: Improved initial rates compared to offsetting wells
Cost reduction expected with continued optimization
More sustainable approach to completions
Gas Rate/100m (Mcf/d)
Production Days
Pilot Wells
Offsets
60% Increase
Improved Completions ResultsSlickwater/Cluster Perforation Application
39
Clearwater Business Unit Liquids Potential
Currently evaluating more than 9
prospective oil zones
300 high graded oil locations identified
to date
Well cost: $1 – $3 million
EUR per well: 60 – 150 Mbbls
Oil gravity: 30 – 40 API
Current ECA Key Oil Zones
20
40
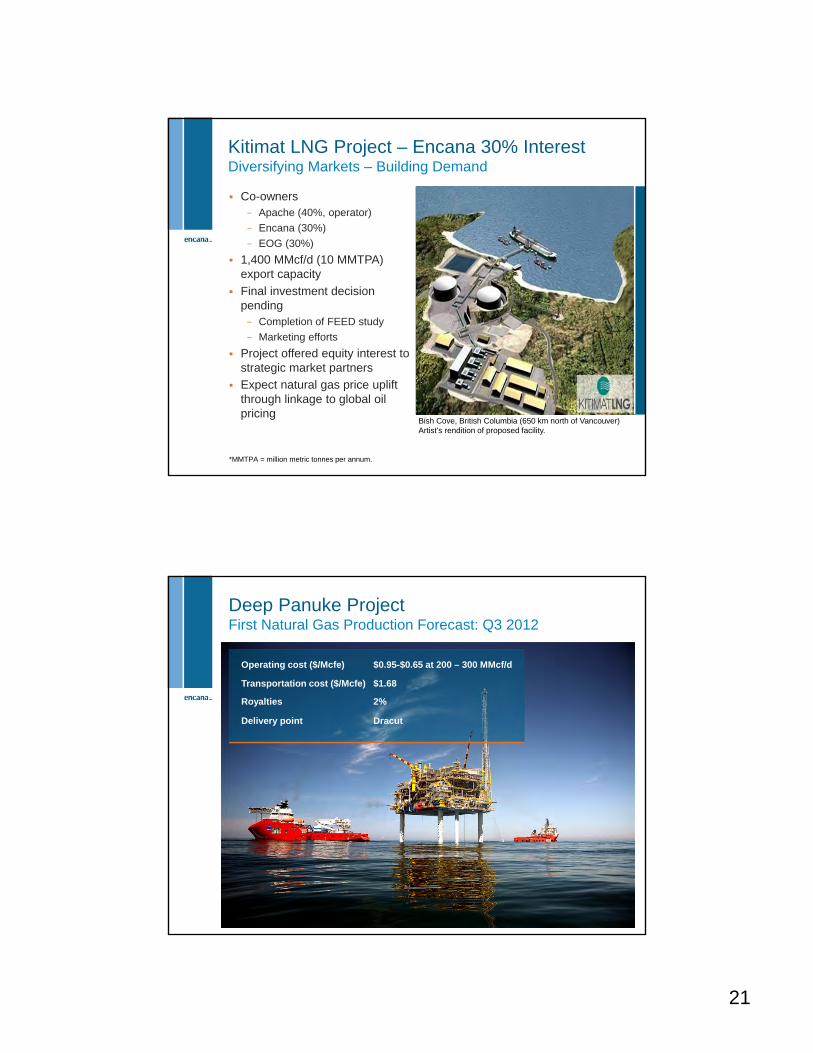
Toyota Tsusho
*Encana Joint Venture Lands with Toyota Tsusho
Wheatland
Toyota Tsusho Corporation:
– Upfront cash component of $100 million
Provides capital funding of $502 million over 7 years:
– 1,488 drilling locations
– 1,606 recompletion locations
– Acquired uniform 32.5% GORR on PDP and Future Development
41
KOGAS Joint VentureKiwigana
Two Separate Deals
Deal 1− Signed February 26, 2010− 38 sections− $324 million earning capital
Earned 50% WI in April 2012
Deal 2− Signed July 28, 2011− 33 sections− $185 million earning capital − Spend by YE 2013 to earn
50% WI
21
42
Kitimat LNG Project – Encana 30% InterestDiversifying Markets – Building Demand
Co-owners− Apache (40%, operator)
− Encana (30%)
− EOG (30%)
1,400 MMcf/d (10 MMTPA) export capacity
Final investment decision pending− Completion of FEED study
− Marketing efforts
Project offered equity interest to strategic market partners
Expect natural gas price uplift through linkage to global oil pricing
Bish Cove, British Columbia (650 km north of Vancouver)Artist’s rendition of proposed facility.
*MMTPA = million metric tonnes per annum.
43
Deep Panuke ProjectFirst Natural Gas Production Forecast: Q3 2012
Operating cost ($/Mcfe) $0.95-$0.65 at 200 – 300 MMcf/d
Transportation cost ($/Mcfe) $1.68
Royalties 2%
Delivery point Dracut
22
44
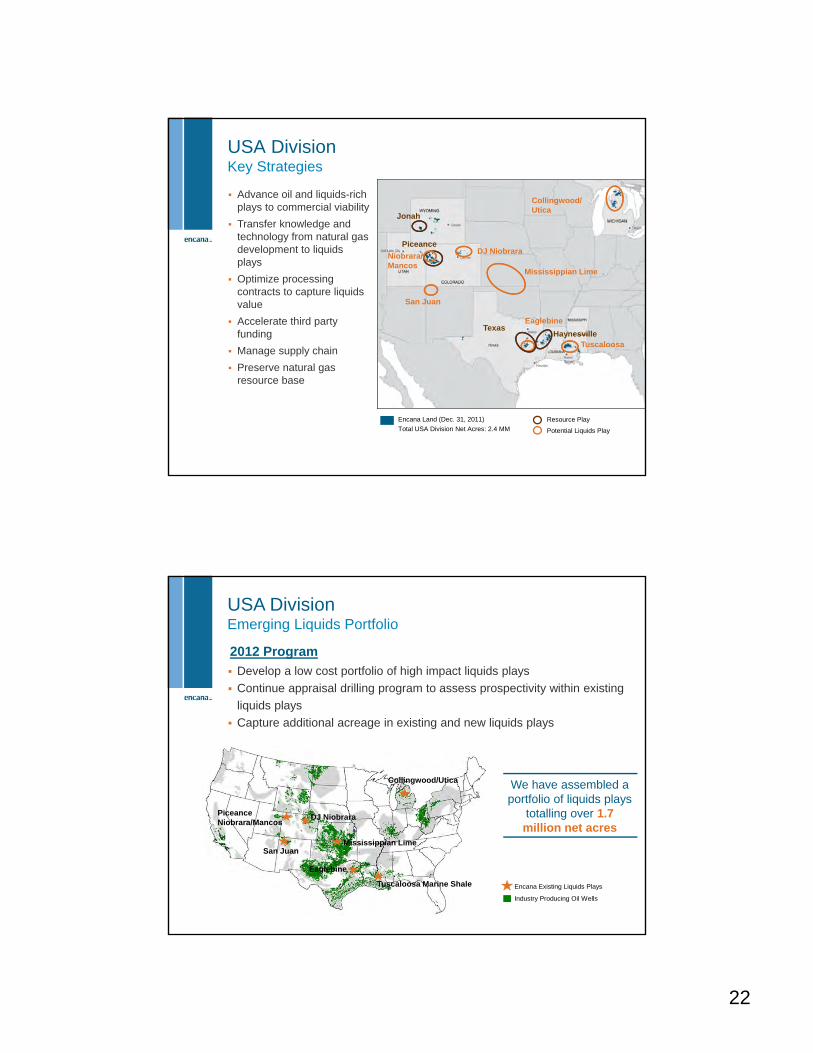
Advance oil and liquids-rich plays to commercial viability
Transfer knowledge and technology from natural gas development to liquids plays
Optimize processing contracts to capture liquids value
Accelerate third party funding
Manage supply chain
Preserve natural gas resource base
USA DivisionKey Strategies
Encana Land (Dec. 31, 2011)
Total USA Division Net Acres: 2.4 MM
Resource Play
Potential Liquids Play
Jonah
Piceance
Niobrara/Mancos
DJ Niobrara
TexasHaynesville
Collingwood/Utica
Tuscaloosa
Mississippian Lime
San Juan
Eaglebine
45
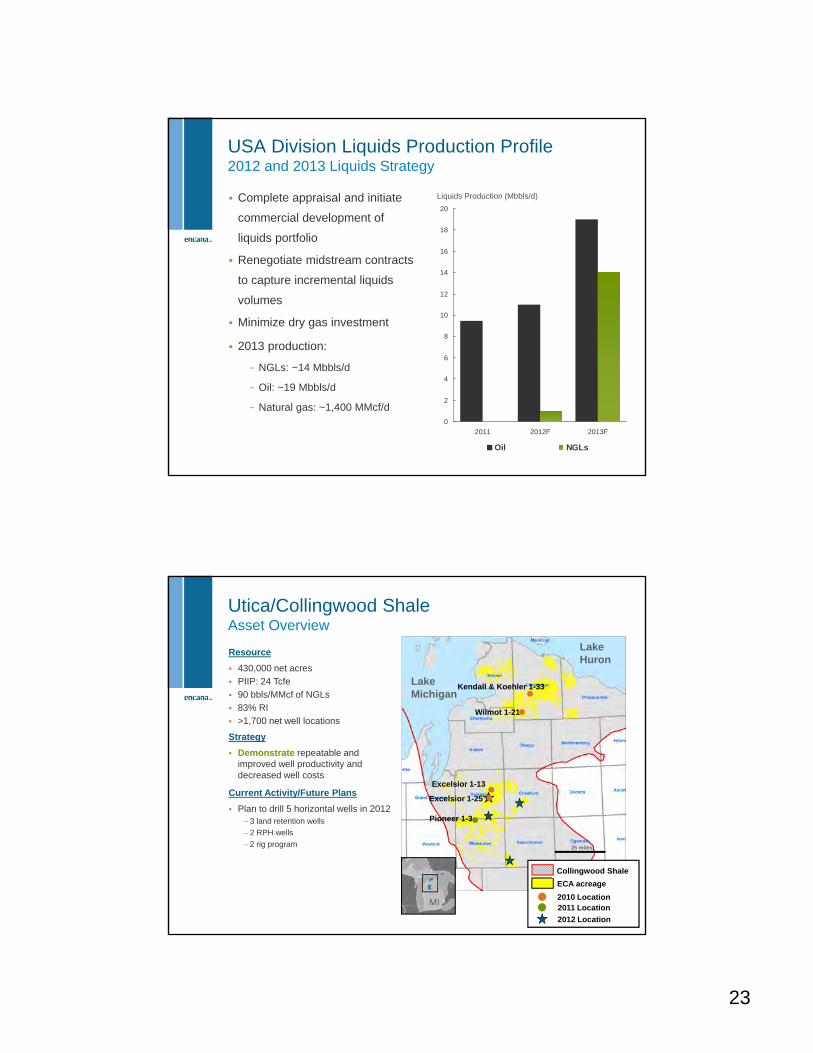
USA DivisionEmerging Liquids Portfolio
Develop a low cost portfolio of high impact liquids plays
Continue appraisal drilling program to assess prospectivity within existing
liquids plays
Capture additional acreage in existing and new liquids plays
2012 Program
Encana Existing Liquids Plays
Industry Producing Oil Wells
We have assembled a portfolio of liquids plays
totalling over 1.7 million net acres
DJ Niobrara
San JuanMississippian Lime
Tuscaloosa Marine Shale
Collingwood/Utica
Eaglebine
PiceanceNiobrara/Mancos
23
46
0
2
4
6
8
10
12
14
16
18
20
2011 2012F 2013F
Oil NGLs
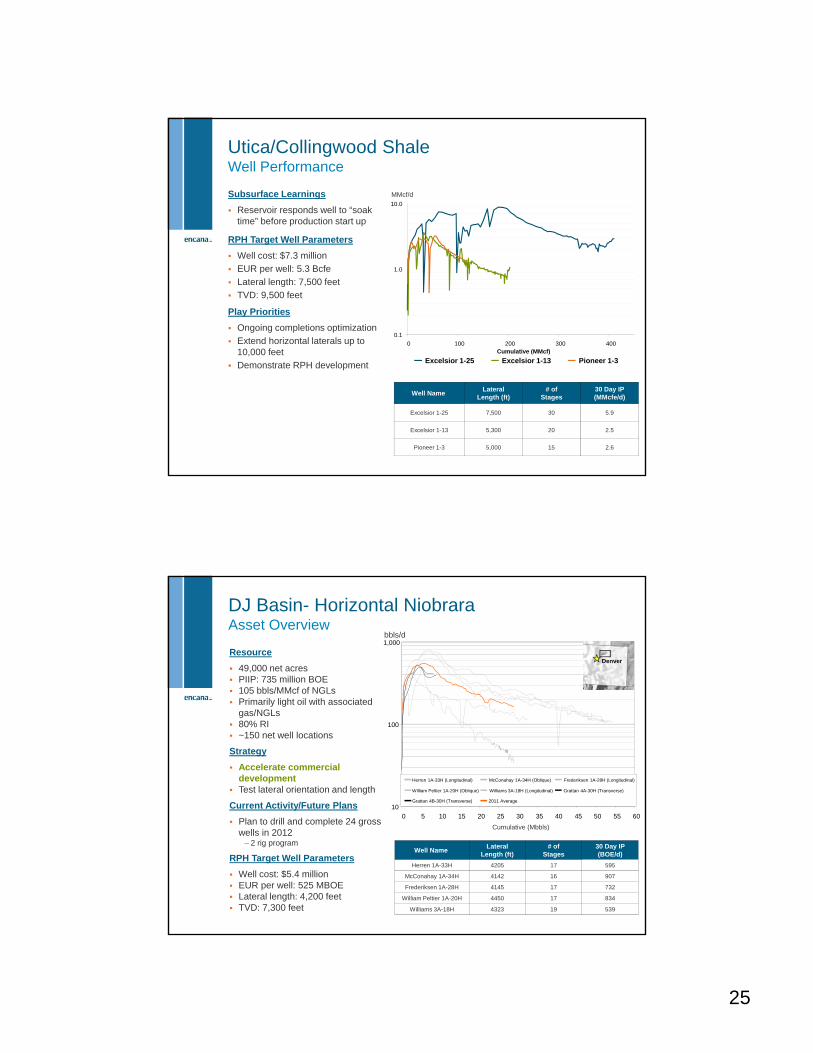
USA Division Liquids Production Profile2012 and 2013 Liquids Strategy
Complete appraisal and initiate
commercial development of
liquids portfolio
Renegotiate midstream contracts
to capture incremental liquids
volumes
Minimize dry gas investment
2013 production:
− NGLs: ~14 Mbbls/d
− Oil: ~19 Mbbls/d
− Natural gas: ~1,400 MMcf/d
Liquids Production (Mbbls/d)
47
Utica/Collingwood ShaleAsset Overview
Lake Michigan
Lake Huron
ECA acreage
Collingwood Shale
2010 LocationMI
25 miles
2011 Location
2012 Location
Pioneer 1-3
Excelsior 1-25
Excelsior 1-13
Wilmot 1-21
Kendall & Koehler 1-33
Resource
430,000 net acres
PIIP: 24 Tcfe
90 bbls/MMcf of NGLs
83% RI
>1,700 net well locations
Strategy
Demonstrate repeatable and improved well productivity and decreased well costs
Current Activity/Future Plans
Plan to drill 5 horizontal wells in 2012– 3 land retention wells
– 2 RPH wells
– 2 rig program

24
48
Oil Rate (Bbls/d)
Subsurface Learnings
Longer laterals & enhanced completions delivering improved performance
Data sharing agreements with peers accelerating play understanding
Flowing wells under restricted rates maintains completion integrity
Operational Learnings
Identified operational target zone Eliminated one casing string Drilled and completed 8,800 foot lateral Rapidly improving drilling performance
RPH Target Well Parameters
Well cost: $12.8 million EUR per well: 730 MBOE Lateral length: 7,500 feet TVD: 13,000 feet
Play Priorities
Reduce well costs, drill longer laterals, enhance repeatability
Improve EURs through completion design
Tuscaloosa Marine Shale Well Performance & Key Learnings
10
100
1,000
10,000
0 10,000 20,000 30,000 40,000 50,000 60,000
Cumulative Oil (bbls)
10
100
1,000
10,000
Anderson 18H-1 Anderson 17H-1 HH 10H-1 Weyer 73H-1
-
Anderson 18H-1EUR: Pending
Anderson 17H-1EUR: Pending
Weyerhaeuser 73H-1EUR: 300 Mbbls (340 MBOE)
Horseshoe hill 10H-1EUR: 450 Mbbls (510 MBOE)
49
EaglebineWell Performance & Key Learnings
Encana average lateral length to date is 6,000’
Lower LaminatedSand
Subsurface Learnings
Lower Laminated zone capable of >700 BOE/d
Testing the impact of restricted rate flowback on EUR
Normalized well production meeting type curve expectations on 2 wells
Operational Learnings
7,500 foot lateral drilled and completed
RPH Target Well Parameters
Well cost: $7.5 million EUR: 465 MBOE Lateral length: 7,500 feet TVD: 7,500 feet
Play Priorities
Infrastructure and operational processes in place
Enhance completion techniques Validate type curve
10
100
1,000
0 5,000 10,000 15,000 20,000 25,000 30,000
Cumulative Oil, bbls
Oil
Rat
e, B
OE
/d
Gresham Trust #1H Clyde Williams #1H Clyde Williams #2H Clyde Williams #3H John Gresham #1H John Gresham #2H
25
50
Utica/Collingwood ShaleWell Performance
Well NameLateral
Length (ft)# of
Stages30 Day IP (MMcfe/d)
Excelsior 1-25 7,500 30 5.9
Excelsior 1-13 5,300 20 2.5
Pioneer 1-3 5,000 15 2.6
Subsurface Learnings
Reservoir responds well to “soak time” before production start up
RPH Target Well Parameters
Well cost: $7.3 million
EUR per well: 5.3 Bcfe
Lateral length: 7,500 feet
TVD: 9,500 feet
Play Priorities
Ongoing completions optimization
Extend horizontal laterals up to 10,000 feet
Demonstrate RPH development
0.1
1.0
10.0
0 100 200 300 400Cumulative (MMcf)
MMcf/d
Excelsior 1-25 Excelsior 1-13 Pioneer 1-3
51
10
100
1,000
0 5 10 15 20 25 30 35 40 45 50 55 60
Cumulative (Mbbls)
Herren 1A-33H (Longitudinal) McConahay 1A-34H (Oblique) Frederiksen 1A-28H (Longitudinal)
William Peltier 1A-20H (Oblique) Williams 3A-18H (Longitudinal) Grattan 4A-30H (Transverse)
Grattan 4B-30H (Transverse) 2011 Average
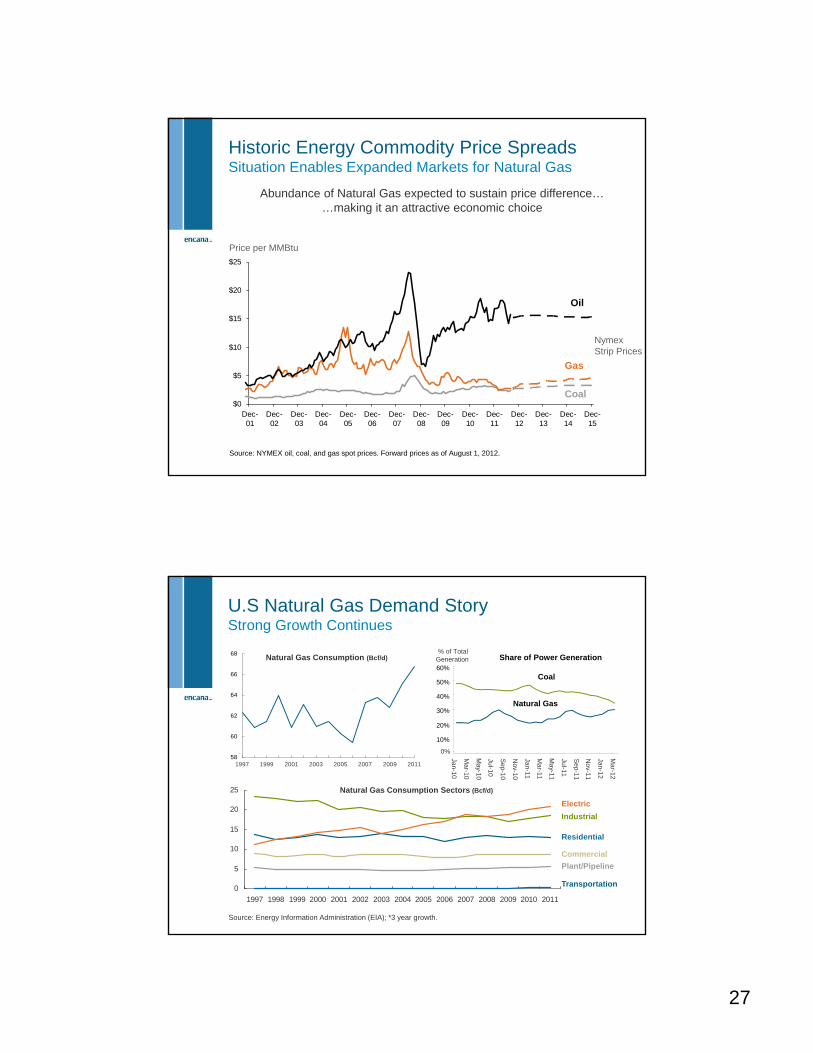
DJ Basin- Horizontal NiobraraAsset Overview
Well NameLateral
Length (ft)# of
Stages30 Day IP (BOE/d)
Herren 1A-33H 4205 17 595
McConahay 1A-34H 4142 16 907
Frederiksen 1A-28H 4145 17 732
William Peltier 1A-20H 4450 17 834
Williams 3A-18H 4323 19 539
DenverResource
49,000 net acres PIIP: 735 million BOE 105 bbls/MMcf of NGLs Primarily light oil with associated
gas/NGLs 80% RI ~150 net well locations
Strategy
Accelerate commercial development
Test lateral orientation and length
Current Activity/Future Plans
Plan to drill and complete 24 gross wells in 2012
– 2 rig program
RPH Target Well Parameters
Well cost: $5.4 million EUR per well: 525 MBOE Lateral length: 4,200 feet TVD: 7,300 feet
bbls/d

26
52
HaynesvilleSupply Cost Evolution
0
1
2
3
4
5
6
2008LR
2009LR
2010RPH
2011RPH
2012F
Continuous completion design evolution
Optimum well density
Slowback
Deeper longer wells
Ultra long laterals
Cross Unit regulatory reform
Increased vertical integration
High temperature tools
Next generation rotary steerable
Continued refinement of Resource Play Hub
35 %
Supply cost ($/mcfe)
LR = land retention; RPH = resource play hub
53
HaynesvilleResource Play Hub Long Lateral
Current Pattern640 acre, 4,600 ft lateral
Previously undeveloped setback area
Planned RPH Well
Lease Retention Well
New Planned Pattern1,920 acre, 7,500 ft lateral
Encana Leading the Way
1st Cross Unit permits granted in the State of Louisiana
1st Cross Unit well drilled
Enhancement to RPH Efficiencies
Successfully drilled six long laterals (average lateral length 7,300 feet)
Combined with RPH development efficiencies to deliver <$3.00 SC
13% additional recovery
Future plans for 10,000 feet laterals
Significant Positive EH&S Impact
Reduced footprint
Reduced development traffic
27
54
$0
$5
$10
$15
$20
$25
Dec-01
Dec-02
Dec-03
Dec-04
Dec-05
Dec-06
Dec-07
Dec-08
Dec-09
Dec-10
Dec-11
Dec-12
Dec-13
Dec-14
Dec-15
Gas
Price per MMBtu
Oil
Source: NYMEX oil, coal, and gas spot prices. Forward prices as of August 1, 2012.
Coal
Abundance of Natural Gas expected to sustain price difference……making it an attractive economic choice
Nymex Strip Prices
Historic Energy Commodity Price SpreadsSituation Enables Expanded Markets for Natural Gas
55
0%
10%
20%
30%
40%
50%
60%
Jan-10
Mar-10
May-10
Jul-10
Sep-10
Nov-10
Jan-11
Mar-11
May-11
Jul-11
Sep-11
Nov-11
Jan-12
Mar-12
% of TotalGeneration
Coal
Natural Gas
58
60
62
64
66
68
1997 1999 2001 2003 2005 2007 2009 2011
Share of Power Generation
0
5
10
15
20
25
1997 1998 1999 2000 2001 2002 2003 2004 2005 2006 2007 2008 2009 2010 2011
Plant/Pipeline
Electric
Industrial
Commercial
Transportation
Residential
Source: Energy Information Administration (EIA); *3 year growth.
U.S Natural Gas Demand StoryStrong Growth Continues
Natural Gas Consumption Sectors (Bcf/d)
Natural Gas Consumption (Bcf/d)

28
56
Short-term: Coal to Gas DisplacementHistorical and Implied by Gas Forward Curve
0
2
4
6
8
10
12
Jan2010
May2010
Sep2010
Jan2011
May2011
Sep2011
Jan2012
May2012
Sep2012
Jan2013
May2013
Sep2013
Forecast Displacement Measured Displacement Henry Hub, May 21 NYMEX, June 1
Source: Encana fundamentals, Ventyx; *Note: Displacement is measured relative to 2008.
The forward curve implies about 4.1 Bcf/d of displacement year over year from July to December
Bcf/d
57
Source: Encana fundamentals, company announcements.
39 GWs of coal-fired capacity retirements have been announced equaling 4 Bcf/d of potential NG demand by 2025
Over 50 GWs of coal-fired capacity are expected to ultimately retire by 2025 representing over 5 Bcf/d of potential NG demand
Long-term: Coal Unit Retirements5 Bcf/d Demand Opportunity

29
58
-7
-6
-5
-4
-3
-2
-1
0
1
2
3
4
5
6
7
Jan 2011 Apr 2011 Jul 2011 Oct 2011 Jan 2012 Apr 2012 Jul 2012 Oct 2012
-1,000
-800
-600
-400
-200
0
200
400
600
800
1,000
Source: Encana Fundamentals, EIA
Coal-to-gas displacement is helping to alleviate a massive storage overhang that resulted from a record warm winter.
Weather Adjusted Supply & Demand (Bcf/d)
Storage Inventories Relative to the EIA 5-year Average (Bcf)
Un
de
r S
up
plie
d
End of Injection Season
Outlook
Increased coal-to-gas displacement has
tightened the gas market
Ove
r S
up
plie
d
Weather Adjusted Supply and DemandDepleting the Storage Overhang
Dec 2012
59
0
10
20
30
40
50
60
70
80
Jan2010
May2010
Sep2010
Jan2011
May2011
Sep2011
Jan2012
May2012
Sep2012
Jan2013
May2013
Sep2013
Dry Gas Liquids Rich Gas Associated Gas EIA + Canadian Pipeline Receipts
Bcf/d
Source: Encana Fundamentals, IHS, EIA Natural Gas Monthly, Canadian pipeline receipts.
North American Gas Production Dry Gas, Liquids Rich Gas and Associated Gas
Production rolled over at the end of the first quarter of 2012, this was expedited by shut-ins.
Forecast
66%
9%
25%
66%
9%
25%
66%
9%
25%
64%
10%
26%
62%
11%
27%
Declining production

30
60
New Natural Gas Demand CreationExcellent Opportunities Diversified Across Many Sectors
Bcf/dShort Term
< 3 yrsMedium Term
3 to 10 yrs Long Term10 years +
Announced Retirements 1 to 2* 2 to 4 4 +
Incremental Power 0 to 1 7 to 9 10 to 14 +
Industrial 0 to 1 2 to 3 3 +
LNG Export – USA 0 2 to 4 4 to 6
LNG Export – Canada 0 2 to 3 2 to 5
Transportation < 0.1 1 to 2 2 +
Gas to Liquids 0 < 1 1 +
Total 1 to 4 16 to 26 26 to 35
*A portion of this demand is currently being realized by natural gas.
61
Supply Factors Supply growth from liquids rich plays and oil plays alone will be
insufficient to balance market requirements
Full-cycle returns for natural gas development will need to be competitive with liquids rich and oil investment alternatives to attract capital
Demand Factors Power generation demand is expected to grow as the existing natural
gas fleet is increasingly utilized and natural gas becomes the preferred fuel for new capacity
Industrial demand is expected to grow as affordable North American feedstock promotes a renaissance in U.S. manufacturing
The transportation sector is expected to grow as natural gas captures market share from traditional liquid fuels
LNG exports will enable access to global markets
Future North American Natural Gas Prices Long-term Sustainability
Natural gas prices will need to range between $4.00 and $6.00/MMBtu to provide acceptable returns for producers and enable demand growth.

31
62
North American Oil Growth, Displacement and Infrastructure Investment
Significant opportunities to grow North American oil production and
displace imports
We expect continued robust growth− Significant investment capital is being
redirected to N.A. oil plays− Emerging plays could experience a rapid
growth profile due to the transfer of technology
New production will continue displacing crude imports− In 2011, the U.S. and Canada imported
over 7 MMbbls/d− Nearly 5 MMbbls/d were light and
medium crudes
Infrastructure investments will be required to access premium markets− Over 7 MMbbls/d of pipeline capacity is
slated to be online by June 2017− Refineries are retooling to handle the
lighter crude slate
63
Demand Factors
North America is one of the lowest cost ethylene producers in the world and we expect ethane demand to thrive as a result
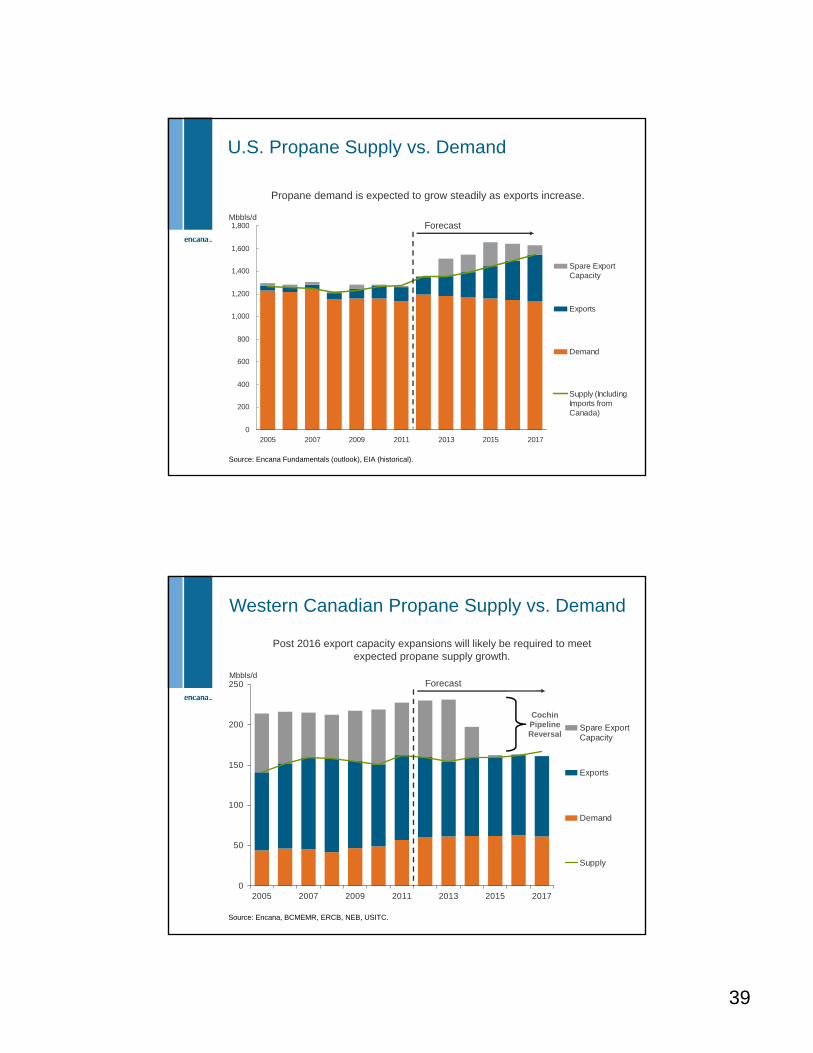
Overall propane demand is expected to grow steadily as exports increase
The heavier NGLs (C4+) are expected to be absorbed into local markets
Infrastructure Factors
Numerous new NGL pipelines are currently under development across North America
Several new pipelines are being developed to relieve constraints between the Mid-Continent and Gulf Coast
Substantial LPG export capacity is being added on the Gulf Coast
North American Natural Gas Liquids Optimism Centered on Long-term Demand Growth
Demand and infrastructure is expected to keep pace with
supply growth
32
64
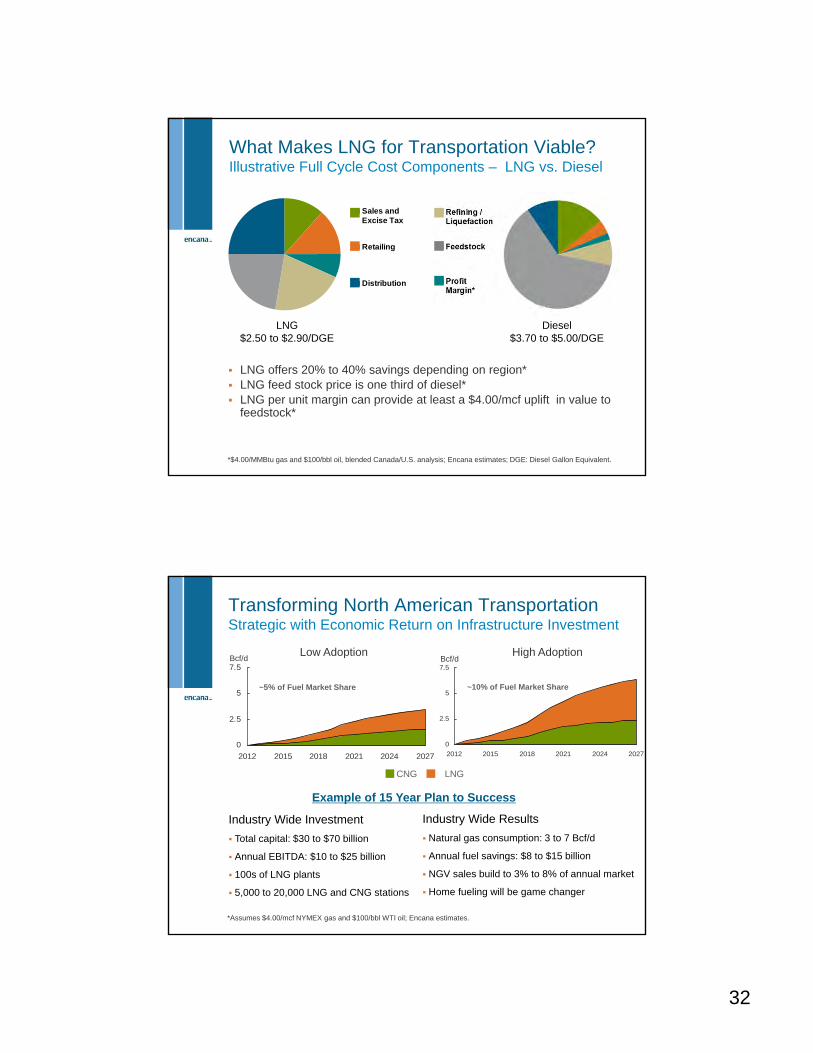
What Makes LNG for Transportation Viable?Illustrative Full Cycle Cost Components – LNG vs. Diesel
Sales andExcise Tax
Retailing
Distribution
LNG offers 20% to 40% savings depending on region* LNG feed stock price is one third of diesel* LNG per unit margin can provide at least a $4.00/mcf uplift in value to
feedstock*
*$4.00/MMBtu gas and $100/bbl oil, blended Canada/U.S. analysis; Encana estimates; DGE: Diesel Gallon Equivalent.
LNG$2.50 to $2.90/DGE
Diesel$3.70 to $5.00/DGE
65
Transforming North American Transportation Strategic with Economic Return on Infrastructure Investment
0
2.5
5
7.5
2012 2015 2018 2021 2024 2027
0
2.5
5
7.5
2012 2015 2018 2021 2024 2027
*Assumes $4.00/mcf NYMEX gas and $100/bbl WTI oil; Encana estimates.
~5% of Fuel Market Share ~10% of Fuel Market Share
Industry Wide Investment
Total capital: $30 to $70 billion
Annual EBITDA: $10 to $25 billion
100s of LNG plants
5,000 to 20,000 LNG and CNG stations
Industry Wide Results
Natural gas consumption: 3 to 7 Bcf/d
Annual fuel savings: $8 to $15 billion
NGV sales build to 3% to 8% of annual market
Home fueling will be game changer
Example of 15 Year Plan to Success
Bcf/dBcf/d
CNG LNG
Low Adoption High Adoption
33
66
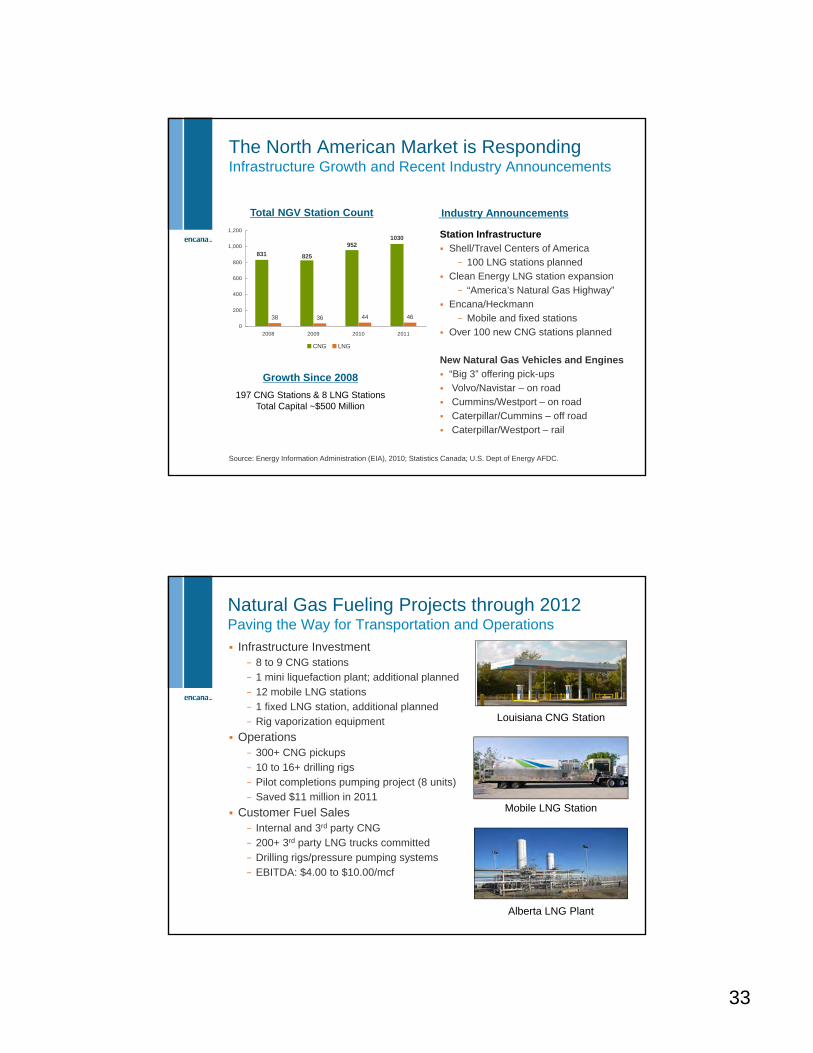
The North American Market is RespondingInfrastructure Growth and Recent Industry Announcements
38 36 44 46
1030
831 825
952
0
200
400
600
800
1,000
1,200
2008 2009 2010 2011
CNG LNG
Total NGV Station Count
Growth Since 2008
197 CNG Stations & 8 LNG Stations Total Capital ~$500 Million
96
Source: Energy Information Administration (EIA), 2010; Statistics Canada; U.S. Dept of Energy AFDC.
Station Infrastructure
Shell/Travel Centers of America
− 100 LNG stations planned
Clean Energy LNG station expansion
− “America’s Natural Gas Highway”
Encana/Heckmann
− Mobile and fixed stations
Over 100 new CNG stations planned
New Natural Gas Vehicles and Engines
“Big 3” offering pick-ups
Volvo/Navistar – on road
Cummins/Westport – on road
Caterpillar/Cummins – off road
Caterpillar/Westport – rail
Industry Announcements
67
Natural Gas Fueling Projects through 2012Paving the Way for Transportation and Operations
Infrastructure Investment− 8 to 9 CNG stations− 1 mini liquefaction plant; additional planned− 12 mobile LNG stations− 1 fixed LNG station, additional planned− Rig vaporization equipment
Operations− 300+ CNG pickups − 10 to 16+ drilling rigs− Pilot completions pumping project (8 units)− Saved $11 million in 2011
Customer Fuel Sales− Internal and 3rd party CNG− 200+ 3rd party LNG trucks committed− Drilling rigs/pressure pumping systems− EBITDA: $4.00 to $10.00/mcf
Louisiana CNG Station
Mobile LNG Station
Alberta LNG Plant

34
68
0
10
20
30
40
50
60
70
2009 2011 2013 2015 2017 2019
Bcf/d
China Korea Taiwan Singapore Thailand India Japan
Forecast
Source: Encana, IEA, IMF, Japan Statistics Bureau, KEEI, National Bureau of Statistics of China, Taiwan Bureau of Energy.
North American LNG Export OpportunityAsian Market Forecast to grow 25 Bcf/d by 2020
United States and Canada Poised to Capture a Material Portion
69
North American Proposed LNG Export Projects
Kitimat T1/T21.4 Bcf/d
2016Greenfield
Received Regulatory Approval
Approval Pending/ Not Filed
Shell/Asian Consortium
1.6 Bcf/d2020
Greenfield
Progress/ PETRONAS
2 Bcf/dUnknownGreenfield
Jordan Cove1.2 Bcf/dUnknownGreenfield
Gulf Coast LNG2.8 Bcf/dUnknownGreenfield
Freeport1.4 Bcf/dQ2 2017
Regas to Export
Cameron1.7 Bcf/dQ4 2016
Regas to Export
Lake Charles2 Bcf/d
UnknownRegas to Export
Cove Point1 Bcf/d
UnknownRegas to Export
Bcf/d of LNG Capacity
Regulatory Approved
Proposed Total
Canada 1.4 3.6 5.0
USA 2.2 10.1 12.3
Total North America
3.6 12.9 17.3
Source: Encana, Company Reports/Filings, J.P. Morgan
Sabine Pass2.2 Bcf/d
Q4 2015 – PH 1Q1 2017 – PH 2Regas to Export

35
70
$0.00
$1.00
$2.00
$3.00
$4.00
$5.00
$6.00
(200) (100) 0 100 200 300 400 500 600 700 800
August 2011 - March 2012 April 2012 - Present
NYMEX
Weekly L48 Storage Inventory Compared to Five-Year Moving Average
Source: Encana Fundamentals, EIA, and CME Group; *Note: the five-year average used in this analysis is not the same as EIA reported five-year average.
Prices fell as inventory relative to the five-year average grew substantially. Starting in April, the relative inventory started to decrease as storage injections
have remained well below the five-year average.
Growing surplus relative to five-year average sends prices lower
Shrinking surplus relative to five-year average sends prices higher
Natural Gas Yield CurveRelative Storage and Price Relationship
71
2.8
0.4
3.3
0.9
-2.1
-0.4
1.0
1.1
0.8
0.6
0.7
0.9
-0.1 -0.3
0.10.2
-0.1
-3
-2
-1
0
1
2
3
4
5
2008 2009 2010 2011 2012 2013
Dry Gas Liquids Rich Gas Associated Gas
Bcf/d
Dry natural gas production is expected to continue to decline and will only partially be offset by increases in liquids rich gas and associated gas production.
North American Production Change by Year Dry, Liquids Rich, and Associated Gas Breakout
Source: Encana Fundamentals, IHS; *Note: Forecast does not contemplate shut-in volumes.
Forecast
2.3
0.10.2
4.9
2.8
(0.4)

36
72
0 2 4 6 8 10 12 14 16 18 20 22
$0.00 - 0.50
$0.50 - 1.00
$1.00 - 1.50
$1.50 - 2.00
$2.00 - 2.50
$2.50 - 3.00
$3.00 - 3.50
$3.50 - 4.00
$4.00 - 4.50
$4.50 - 5.00
$5.00 - 5.50
$5.50 - 6.00
>$6.00
Deliverability from One Year of Drilling (Bcf/d)
Dry Gas Associated Gas (Oil Drilling) Liquids Rich Gas
Supply Cost $/MMBtu (9% after tax return; 2011 costs)
Dry gas development is required to offset annual production declines.
North American Half-Cycle Cost of New Supply 2012 Deliverability at Current Rig Count
Source: Encana Fundamentals; *Note: Does not consider the impact of hedging, JV capital or well inventory.
Gas production required to offset decline from December 2011
73
Tuscaloosa
St. James(LLS)
Source: Encana Fundamentals, EV maps.
North American Oil Plays
Oil Sands
Bakken
Utica
SoCal
Uinta
San Juan
Gulf ofMexico
Greater Permian
WolfberryAvalon Barnett
Eaglebine
Greater Anadarko Cushing
(WTI)
MS Lime
Granite Wash
North Slope
North American oil supply growth is currently being driven by five major supply areas: Western Canadian Oil Sands, Bakken, Greater Anadarko, Greater Permian, and Eagle Ford.
Top 5 growing supply areas
Other supply areas
37
74
Cushing(WTI)
St. James (LLS)
Keystone XLNorth(700)
Flanagan South (585)
Keystone XLMarketLink
(830)
Seaway Projects**
(850)
Trans Mountain
Expansions(450)
NorthernGateway
(850)
10 Projects(>1,500)
2 Projects(275)
Basin(50)
2 Projects(250)
7 Projects (825)
Primary Hub
XX
XX
XX
XX
XX
XX
XX
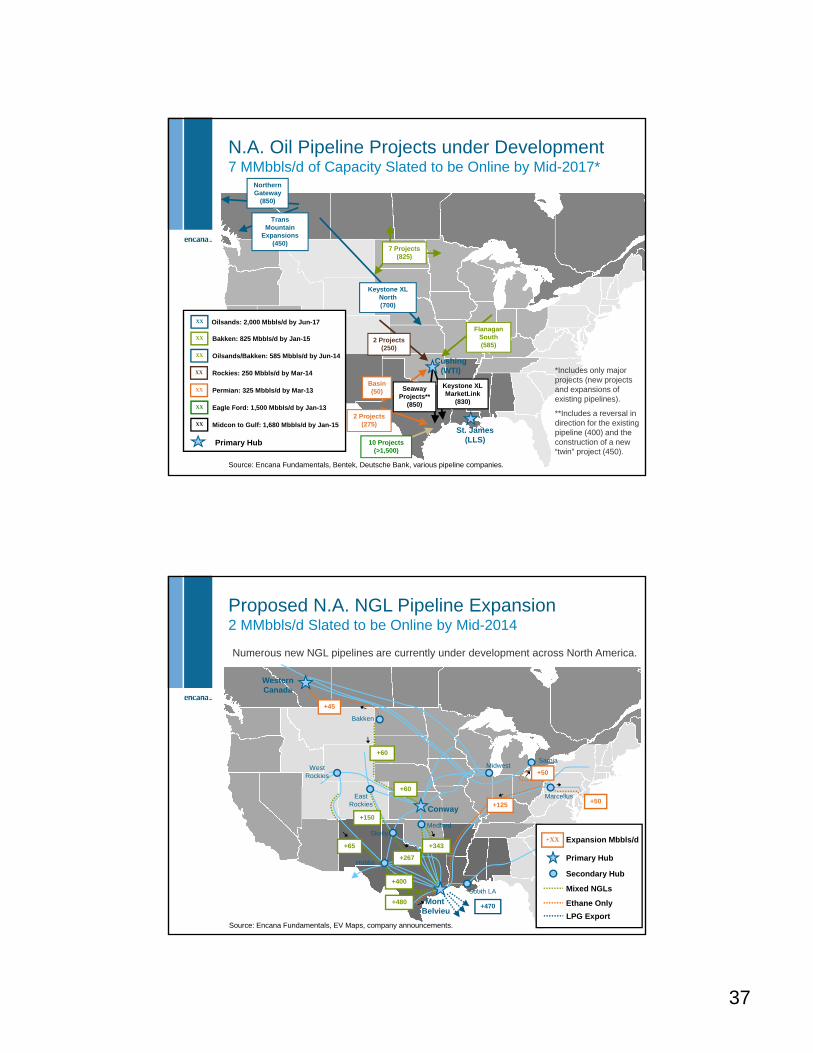
Oilsands/Bakken: 585 Mbbls/d by Jun-14
Bakken: 825 Mbbls/d by Jan-15
Rockies: 250 Mbbls/d by Mar-14
Permian: 325 Mbbls/d by Mar-13
Eagle Ford: 1,500 Mbbls/d by Jan-13
Midcon to Gulf: 1,680 Mbbls/d by Jan-15
Oilsands: 2,000 Mbbls/d by Jun-17
N.A. Oil Pipeline Projects under Development7 MMbbls/d of Capacity Slated to be Online by Mid-2017*
Source: Encana Fundamentals, Bentek, Deutsche Bank, various pipeline companies.
*Includes only major projects (new projects and expansions of existing pipelines).
**Includes a reversal in direction for the existing pipeline (400) and the construction of a new “twin” project (450).
75
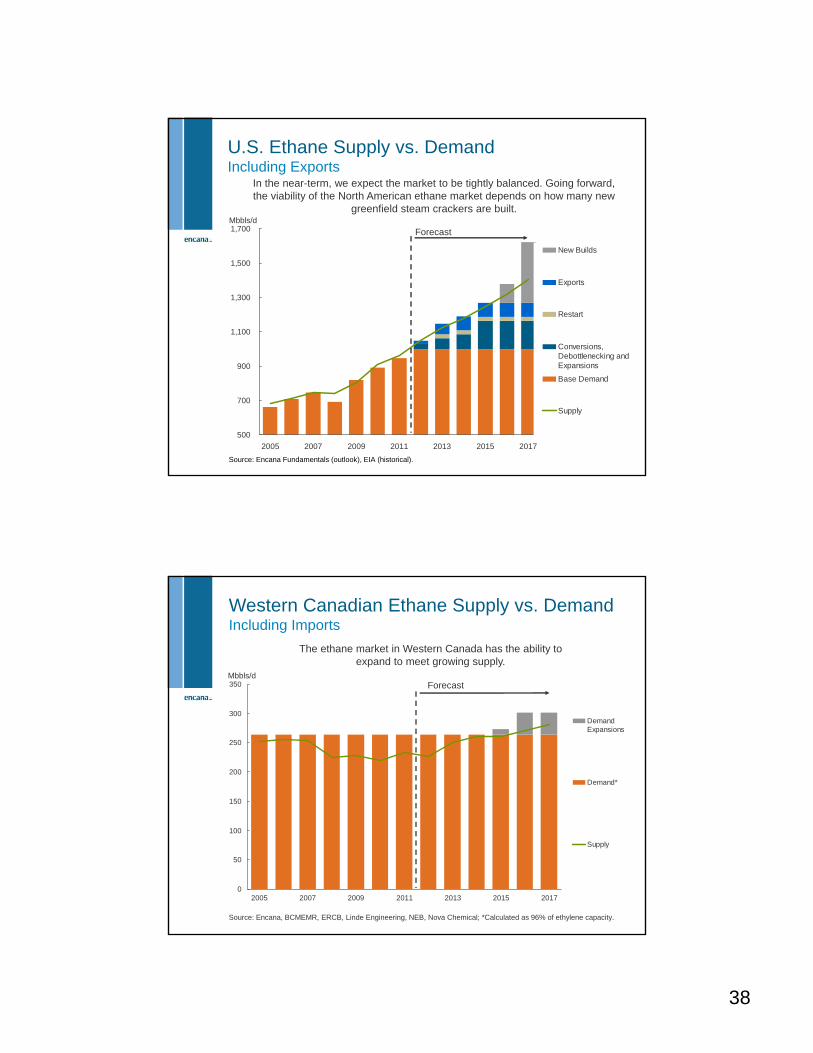
Proposed N.A. NGL Pipeline Expansion 2 MMbbls/d Slated to be Online by Mid-2014
MontBelvieu
Conway
Sarnia
Marcellus
WesternCanada
Hobbs
South LA
East Rockies
SkellyMedford
Midwest
Bakken
West Rockies
+60
+65
+400
+50
+50
+267
+60
+45
+480+470
+150
+125
+343
Primary Hub
Secondary Hub
Mixed NGLs
Ethane Only
LPG Export
+XX Expansion Mbbls/d
Source: Encana Fundamentals, EV Maps, company announcements.
Numerous new NGL pipelines are currently under development across North America.
38
76
500
700
900
1,100
1,300
1,500
1,700
2005 2007 2009 2011 2013 2015 2017
New Builds
Exports
Restart
Conversions,Debottlenecking andExpansions
Base Demand
Supply
Mbbls/d
Source: Encana Fundamentals (outlook), EIA (historical).
U.S. Ethane Supply vs. DemandIncluding Exports
In the near-term, we expect the market to be tightly balanced. Going forward, the viability of the North American ethane market depends on how many new
greenfield steam crackers are built.
Forecast
77
0
50
100
150
200
250
300
350
2005 2007 2009 2011 2013 2015 2017
DemandExpansions
Demand*
Supply
The ethane market in Western Canada has the ability to expand to meet growing supply.
Western Canadian Ethane Supply vs. Demand Including Imports
Source: Encana, BCMEMR, ERCB, Linde Engineering, NEB, Nova Chemical; *Calculated as 96% of ethylene capacity.
Mbbls/dForecast
39
78
0
200
400
600
800
1,000
1,200
1,400
1,600
1,800
2005 2007 2009 2011 2013 2015 2017
Spare ExportCapacity
Exports
Demand
Supply (IncludingImports fromCanada)
Propane demand is expected to grow steadily as exports increase.
Mbbls/d
Source: Encana Fundamentals (outlook), EIA (historical).
U.S. Propane Supply vs. Demand
Forecast
79
0
50
100
150
200
250
2005 2007 2009 2011 2013 2015 2017
Spare ExportCapacity
Exports
Demand
Supply
Western Canadian Propane Supply vs. Demand
Post 2016 export capacity expansions will likely be required to meet expected propane supply growth.
Mbbls/d
Source: Encana, BCMEMR, ERCB, NEB, USITC.
Cochin Pipeline Reversal
Forecast

40
80
0
1
2
3
4
5
6
7
8
9
10
Jan2005
Jul2005
Jan2006
Jul2006
Jan2007
Jul2007
Jan2008
Jul2008
Jan2009
Jul2009
Jan2010
Jul2010
Jan2011
Jul2011
Jan2012
Jul2012
Jan2013
Jul2013
Gulf of Mexico Other Anadarko Granite Wash
Williston Eagle Ford Wolfberry Avalon/Bone Springs
Permian Emerging
Bcf/d
Source: Encana Fundamentals, IHS, EIA.
Gas production from oil-directed drilling is currently 7.1 Bcf/d and is expected to increase to 8.8 Bcf/d by the end of 2013.
Forecast
Associated Gas Production Contribution from Oil Directed Drilling
81
The Evolving NGL Barrel
Ethane (C2) 37%
Propane (C3) 29%
Butanes (C4) 18%
Pentanes (C5+) 16%
Ethane (C2) 42%
Propane (C3) 28%
Butanes (C4) 17%
Pentanes (C5+) 13%
2001
NGL Barrel NGL Barrel
2011
NGL Barrel
2015F*
Ethane (C2) 45%
Propane (C3) 29%
Butanes (C4) 14%
Pentanes (C5+) 12%
The NGL barrel is becoming lighter over time for two reasons:(1) Gas stream’s composition is changing(2) Additional Cryogenic Capacity (Deep Cut facilities) are adding more ethane to the market
Source: Encana, U.S. EIA; *Encana estimate.
Ethane will continue to become a larger portion of the NGL barrel.

41
82
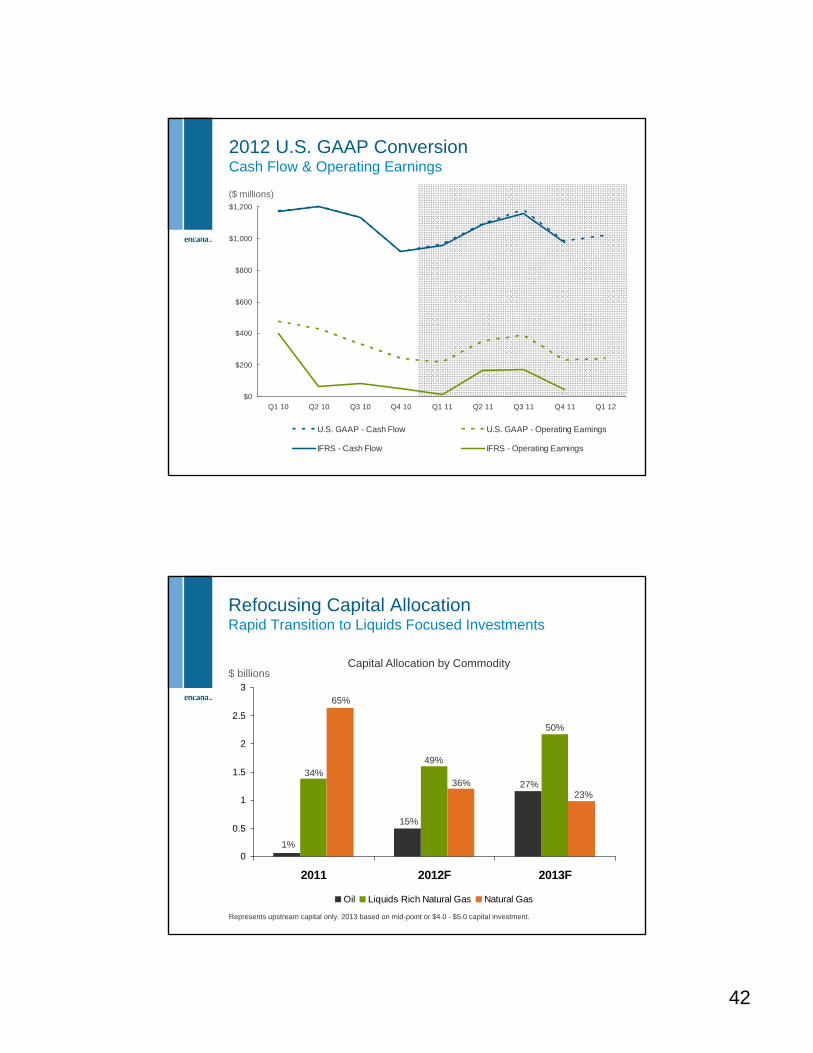
2012 U.S. GAAP Conversion
Encana has adopted U.S. GAAP for 2012 financial reporting
– Previously followed Canadian GAAP/IFRS, with annual U.S. GAAP reconciliations
Why convert?
– Improves comparability of financial results with peers
– Uncertainty on the future role of IFRS in the U.S.
– Provides quarterly U.S. GAAP financial results and analysis
Conversion completed in early 2012
– 2012 first quarter financial statements and MD&A issued under U.S. GAAP
83
APA EOG DVN ECA TLM NXY APC SWN CHK
Credit Rating Comparison As of May 31, 2012
- Indicates ratings below investment grade
S&P Moody’s
AAA Aaa
AA+ Aa1
AA Aa2AA- Aa3
A+ A1
A A2
A- A3
BBB+ Baa1
BBB Baa2
BBB- Baa3
BB+ Ba1
BB Ba2
BB- Ba3
B+ B1B B2
42
84
2012 U.S. GAAP ConversionCash Flow & Operating Earnings
($ millions)
$0
$200
$400
$600
$800
$1,000
$1,200
Q1 10 Q2 10 Q3 10 Q4 10 Q1 11 Q2 11 Q3 11 Q4 11 Q1 12
U.S. GAAP - Cash Flow U.S. GAAP - Operating Earnings
IFRS - Cash Flow IFRS - Operating Earnings
85
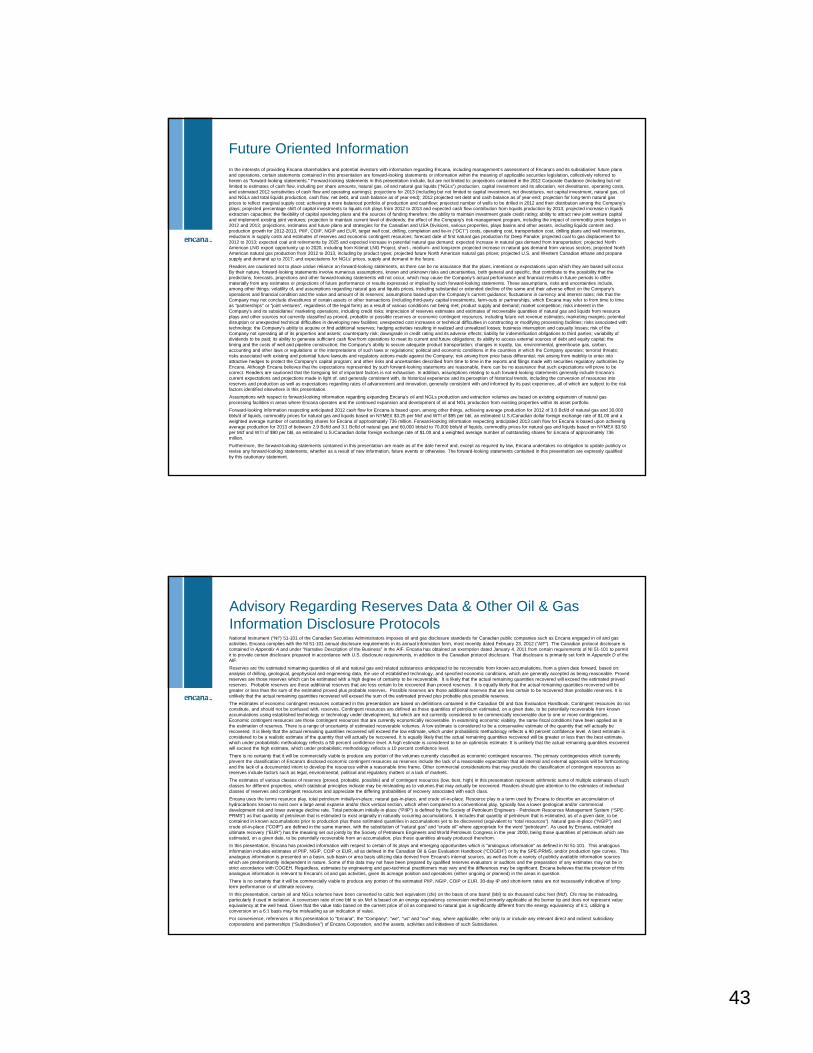
Refocusing Capital AllocationRapid Transition to Liquids Focused Investments
0
0.5
1
1.5
2
2.5
3
2011 2012F 2013F
Oil Liquids Rich Natural Gas Natural Gas
Represents upstream capital only. 2013 based on mid-point or $4.0 - $5.0 capital investment.
$ billions
23%
49%
36% 27%
50%
34%
65%
15%
1%
Capital Allocation by Commodity
43
In the interests of providing Encana shareholders and potential investors with information regarding Encana, including management’s assessment of Encana’s and its subsidiaries’ future plans and operations, certain statements contained in this presentation are forward-looking statements or information within the meaning of applicable securities legislation, collectively referred to herein as “forward-looking statements.” Forward-looking statements in this presentation include, but are not limited to: projections contained in the 2012 Corporate Guidance (including but not limited to estimates of cash flow, including per share amounts, natural gas, oil and natural gas liquids (“NGLs”) production, capital investment and its allocation, net divestitures, operating costs, and estimated 2012 sensitivities of cash flow and operating earnings); projections for 2013 (including but not limited to capital investment, net divestitures, net capital investment, natural gas, oil and NGLs and total liquids production, cash flow, net debt, and cash balance as of year-end); 2012 projected net debt and cash balance as of year-end; projection for long-term natural gas prices to reflect marginal supply cost; achieving a more balanced portfolio of production and cashflow; projected number of wells to be drilled in 2012 and their distribution among the Company’s plays; projected percentage shift of capital investments to liquids rich plays from 2012 to 2013 and expected cash flow contribution from liquids production by 2013; projected increase in liquids extraction capacities; the flexibility of capital spending plans and the sources of funding therefore; the ability to maintain investment grade credit rating; ability to attract new joint venture capital and implement existing joint ventures; projection to maintain current level of dividends; the effect of the Company's risk management program, including the impact of commodity price hedges in 2012 and 2013; projections, estimates and future plans and strategies for the Canadian and USA Divisions, various properties, plays basins and other assets, including liquids content and production growth for 2012-2013, PIIP, COIP, NGIP and EUR, target well cost, drilling, completion and tie-in (“DCT”) costs, operating cost, transportation cost, drilling plans and well inventories, reductions in supply costs and estimates of reserves and economic contingent resources; forecast date of first natural gas production for Deep Panuke; projected coal to gas displacement for 2012 to 2013; expected coal unit retirements by 2025 and expected increase in potential natural gas demand; expected increase in natural gas demand from transportation; projected North American LNG export opportunity up to 2020, including from Kitimat LNG Project; short-, medium- and long-term projected increase in natural gas demand from various sectors; projected North American natural gas production from 2012 to 2013, including by product types; projected future North American natural gas prices; projected U.S. and Western Canadian ethane and propane supply and demand up to 2017; and expectations for NGLs' prices, supply and demand in the future.
Readers are cautioned not to place undue reliance on forward-looking statements, as there can be no assurance that the plans, intentions or expectations upon which they are based will occur. By their nature, forward-looking statements involve numerous assumptions, known and unknown risks and uncertainties, both general and specific, that contribute to the possibility that the predictions, forecasts, projections and other forward-looking statements will not occur, which may cause the Company’s actual performance and financial results in future periods to differ materially from any estimates or projections of future performance or results expressed or implied by such forward-looking statements. These assumptions, risks and uncertainties include, among other things: volatility of, and assumptions regarding natural gas and liquids prices, including substantial or extended decline of the same and their adverse effect on the Company’s operations and financial condition and the value and amount of its reserves; assumptions based upon the Company’s current guidance; fluctuations in currency and interest rates; risk that the Company may not conclude divestitures of certain assets or other transactions (including third-party capital investments, farm-outs or partnerships, which Encana may refer to from time to time as “partnerships” or “joint ventures”, regardless of the legal form) as a result of various conditions not being met; product supply and demand; market competition; risks inherent in the Company’s and its subsidiaries’ marketing operations, including credit risks; imprecision of reserves estimates and estimates of recoverable quantities of natural gas and liquids from resource plays and other sources not currently classified as proved, probable or possible reserves or economic contingent resources, including future net revenue estimates; marketing margins; potential disruption or unexpected technical difficulties in developing new facilities; unexpected cost increases or technical difficulties in constructing or modifying processing facilities; risks associated with technology; the Company’s ability to acquire or find additional reserves; hedging activities resulting in realized and unrealized losses; business interruption and casualty losses; risk of the Company not operating all of its properties and assets; counterparty risk; downgrade in credit rating and its adverse effects; liability for indemnification obligations to third parties; variability of dividends to be paid; its ability to generate sufficient cash flow from operations to meet its current and future obligations; its ability to access external sources of debt and equity capital; the timing and the costs of well and pipeline construction; the Company’s ability to secure adequate product transportation; changes in royalty, tax, environmental, greenhouse gas, carbon, accounting and other laws or regulations or the interpretations of such laws or regulations; political and economic conditions in the countries in which the Company operates; terrorist threats; risks associated with existing and potential future lawsuits and regulatory actions made against the Company; risk arising from price basis differential; risk arising from inability to enter into attractive hedges to protect the Company’s capital program; and other risks and uncertainties described from time to time in the reports and filings made with securities regulatory authorities by Encana. Although Encana believes that the expectations represented by such forward-looking statements are reasonable, there can be no assurance that such expectations will prove to be correct. Readers are cautioned that the foregoing list of important factors is not exhaustive. In addition, assumptions relating to such forward-looking statements generally include Encana’s current expectations and projections made in light of, and generally consistent with, its historical experience and its perception of historical trends, including the conversion of resources into reserves and production as well as expectations regarding rates of advancement and innovation, generally consistent with and informed by its past experience, all of which are subject to the risk factors identified elsewhere in this presentation.
Assumptions with respect to forward-looking information regarding expanding Encana's oil and NGLs production and extraction volumes are based on existing expansion of natural gas processing facilities in areas where Encana operates and the continued expansion and development of oil and NGL production from existing properties within its asset portfolio.
Forward-looking information respecting anticipated 2012 cash flow for Encana is based upon, among other things, achieving average production for 2012 of 3.0 Bcf/d of natural gas and 30,000 bbls/d of liquids, commodity prices for natural gas and liquids based on NYMEX $3.25 per Mcf and WTI of $95 per bbl, an estimated U.S./Canadian dollar foreign exchange rate of $1.00 and a weighted average number of outstanding shares for Encana of approximately 736 million. Forward-looking information respecting anticipated 2013 cash flow for Encana is based upon achieving average production for 2013 of between 2.9 Bcf/d and 3.1 Bcf/d of natural gas and 60,000 bbls/d to 70,000 bbls/d of liquids, commodity prices for natural gas and liquids based on NYMEX $3.50 per Mcf and WTI of $90 per bbl, an estimated U.S./Canadian dollar foreign exchange rate of $1.00 and a weighted average number of outstanding shares for Encana of approximately 736 million.
Furthermore, the forward-looking statements contained in this presentation are made as of the date hereof and, except as required by law, Encana undertakes no obligation to update publicly or revise any forward-looking statements, whether as a result of new information, future events or otherwise. The forward-looking statements contained in this presentation are expressly qualified by this cautionary statement.
Future Oriented Information
National Instrument (“NI”) 51-101 of the Canadian Securities Administrators imposes oil and gas disclosure standards for Canadian public companies such as Encana engaged in oil and gas activities. Encana complies with the NI 51-101 annual disclosure requirements in its annual information form, most recently dated February 23, 2012 (“AIF”). The Canadian protocol disclosure is contained in Appendix A and under “Narrative Description of the Business” in the AIF. Encana has obtained an exemption dated January 4, 2011 from certain requirements of NI 51-101 to permit it to provide certain disclosure prepared in accordance with U.S. disclosure requirements, in addition to the Canadian protocol disclosure. That disclosure is primarily set forth in Appendix D of the AIF.
Reserves are the estimated remaining quantities of oil and natural gas and related substances anticipated to be recoverable from known accumulations, from a given date forward, based on: analysis of drilling, geological, geophysical and engineering data, the use of established technology, and specified economic conditions, which are generally accepted as being reasonable. Proved reserves are those reserves which can be estimated with a high degree of certainty to be recoverable. It is likely that the actual remaining quantities recovered will exceed the estimated proved reserves. Probable reserves are those additional reserves that are less certain to be recovered than proved reserves. It is equally likely that the actual remaining quantities recovered will be greater or less than the sum of the estimated proved plus probable reserves. Possible reserves are those additional reserves that are less certain to be recovered than probable reserves. It is unlikely that the actual remaining quantities recovered will exceed the sum of the estimated proved plus probable plus possible reserves.
The estimates of economic contingent resources contained in this presentation are based on definitions contained in the Canadian Oil and Gas Evaluation Handbook. Contingent resources do not constitute, and should not be confused with, reserves. Contingent resources are defined as those quantities of petroleum estimated, on a given date, to be potentially recoverable from known accumulations using established technology or technology under development, but which are not currently considered to be commercially recoverable due to one or more contingencies. Economic contingent resources are those contingent resources that are currently economically recoverable. In examining economic viability, the same fiscal conditions have been applied as in the estimation of reserves. There is a range of uncertainty of estimated recoverable volumes. A low estimate is considered to be a conservative estimate of the quantity that will actually be recovered. It is likely that the actual remaining quantities recovered will exceed the low estimate, which under probabilistic methodology reflects a 90 percent confidence level. A best estimate is considered to be a realistic estimate of the quantity that will actually be recovered. It is equally likely that the actual remaining quantities recovered will be greater or less than the best estimate, which under probabilistic methodology reflects a 50 percent confidence level. A high estimate is considered to be an optimistic estimate. It is unlikely that the actual remaining quantities recovered will exceed the high estimate, which under probabilistic methodology reflects a 10 percent confidence level.
There is no certainty that it will be commercially viable to produce any portion of the volumes currently classified as economic contingent resources. The primary contingencies which currently prevent the classification of Encana's disclosed economic contingent resources as reserves include the lack of a reasonable expectation that all internal and external approvals will be forthcoming and the lack of a documented intent to develop the resources within a reasonable time frame. Other commercial considerations that may preclude the classification of contingent resources as reserves include factors such as legal, environmental, political and regulatory matters or a lack of markets.
The estimates of various classes of reserves (proved, probable, possible) and of contingent resources (low, best, high) in this presentation represent arithmetic sums of multiple estimates of such classes for different properties, which statistical principles indicate may be misleading as to volumes that may actually be recovered. Readers should give attention to the estimates of individual classes of reserves and contingent resources and appreciate the differing probabilities of recovery associated with each class.
Encana uses the terms resource play, total petroleum initially-in-place, natural gas-in-place, and crude oil-in-place. Resource play is a term used by Encana to describe an accumulation of hydrocarbons known to exist over a large areal expanse and/or thick vertical section, which when compared to a conventional play, typically has a lower geological and/or commercial development risk and lower average decline rate. Total petroleum initially-in-place (“PIIP”) is defined by the Society of Petroleum Engineers - Petroleum Resources Management System (“SPE-PRMS”) as that quantity of petroleum that is estimated to exist originally in naturally occurring accumulations. It includes that quantity of petroleum that is estimated, as of a given date, to be contained in known accumulations prior to production plus those estimated quantities in accumulations yet to be discovered (equivalent to “total resources”). Natural gas-in-place (“NGIP”) and crude oil-in-place (“COIP”) are defined in the same manner, with the substitution of “natural gas” and “crude oil” where appropriate for the word “petroleum”. As used by Encana, estimated ultimate recovery (“EUR”) has the meaning set out jointly by the Society of Petroleum Engineers and World Petroleum Congress in the year 2000, being those quantities of petroleum which are estimated, on a given date, to be potentially recoverable from an accumulation, plus those quantities already produced therefrom.
In this presentation, Encana has provided information with respect to certain of its plays and emerging opportunities which is “analogous information” as defined in NI 51-101. This analogous information includes estimates of PIIP, NGIP, COIP or EUR, all as defined in the Canadian Oil & Gas Evaluation Handbook (“COGEH”) or by the SPE-PRMS, and/or production type curves. This analogous information is presented on a basin, sub-basin or area basis utilizing data derived from Encana's internal sources, as well as from a variety of publicly available information sources which are predominantly independent in nature. Some of this data may not have been prepared by qualified reserves evaluators or auditors and the preparation of any estimates may not be in strict accordance with COGEH. Regardless, estimates by engineering and geo-technical practitioners may vary and the differences may be significant. Encana believes that the provision of this analogous information is relevant to Encana's oil and gas activities, given its acreage position and operations (either ongoing or planned) in the areas in question.
There is no certainty that it will be commercially viable to produce any portion of the estimated PIIP, NGIP, COIP or EUR. 30-day IP and short-term rates are not necessarily indicative of long-term performance or of ultimate recovery.
In this presentation, certain oil and NGLs volumes have been converted to cubic feet equivalent (cfe) on the basis of one barrel (bbl) to six thousand cubic feet (Mcf). Cfe may be misleading, particularly if used in isolation. A conversion ratio of one bbl to six Mcf is based on an energy equivalency conversion method primarily applicable at the burner tip and does not represent value equivalency at the well head. Given that the value ratio based on the current price of oil as compared to natural gas is significantly different from the energy equivalency of 6:1, utilizing a conversion on a 6:1 basis may be misleading as an indication of value.
For convenience, references in this presentation to “Encana”, the “Company”, “we”, “us” and “our” may, where applicable, refer only to or include any relevant direct and indirect subsidiary corporations and partnerships (“Subsidiaries”) of Encana Corporation, and the assets, activities and initiatives of such Subsidiaries.
Advisory Regarding Reserves Data & Other Oil & Gas Information Disclosure Protocols

(1) 2012 guidance based on NYMEX of $3.25/Mcf, WTI of $95.00/bbl and a U.S./Canadian dollar exchange rate of $1.00.(2) Forecast includes an estimate for a cash tax recovery, including transactions closed to date. Further information on income tax can be found in Note 8 of the audited Annual Consolidated Financial Statements dated
December 31, 2011. (3) This guidance refers to certain non-GAAP measures including cash flow and operating earnings. Cash flow is a non-GAAP measure defined as Cash from Operating Activities excluding net change in other assets and
liabilities, net change in non-cash working capital from continuing operations and cash tax on sale of assets. Operating Earnings is defined as Net Earnings excluding non-recurring or non-cash items that Management believes reduces the comparability of the Company's financial performance between periods. These after-tax items may include, but are not limited to, unrealized hedging gains/losses, impairments, foreign exchange gains/losses, income taxes related to divestitures and adjustments to normalize the effect of income taxes calculated using the estimated annual effective tax rate.
(4) Excludes one-time items associated with The BOW building.(5) Excludes gas processing costs which are now included as part of Transportation and Processing Expense.
ADVISORY: In the interests of providing Encana Corporation (“Encana” or the “Company”) shareholders and potential investors with information regarding Encana, including management’s assessment of Encana’s and its subsidiaries’ future plans and operations, certain statements contained in this document are forward-looking statements or information within the meaning of applicable securities legislation, collectively referred to herein as “forward-looking statements.” Forward-looking statements in this document include, but are not limited to: estimates of cash flow, including per share amounts, natural gas, oil and natural gas liquids production, capital investment and its allocation, net divestitures, operating costs, and estimated 2012 sensitivities of cash flow and operating earnings.
Readers are cautioned not to place undue reliance on forward-looking statements, as there can be no assurance that the plans, intentions or expectations upon which they are based will occur. By their nature, forward-looking statements involve numerous assumptions, known and unknown risks and uncertainties, both general and specific, that contribute to the possibility that the predictions, forecasts, projections and other forward-looking statements will not occur, which may cause the Company’s actual performance and financial results in future periods to differ materially from any estimates or projections of future performance or results expressed or implied by such forward-looking statements. These assumptions, risks and uncertainties include, among other things: volatility of, and assumptions regarding natural gas and liquids prices, including substantial or extended decline of the same and their adverse effect on the Company’s operations and financial condition and the value and amount of its reserves; assumptions based upon the Company’s current guidance; fluctuations in currency and interest rates; risk that the Company may not conclude divestitures of certain assets or other transactions (including third-party capital investments, farm-outs or partnerships, which Encana may refer to from time to time as “partnerships” or “joint ventures”, regardless of the legal form) as a result of various conditions not being met; product supply and demand; market competition; risks inherent in the Company’s and its subsidiaries’ marketing operations, including credit risks; imprecision of reserves estimates and estimates of recoverable quantities of natural gas and liquids from resource plays and other sources not currently classified as proved, probable or possible reserves or economic contingent resources, including future net revenue estimates; marketing margins; potential disruption or unexpected technical difficulties in developing new facilities; unexpected cost increases or technical difficulties in constructing or modifying processing facilities; risks associated with technology; the Company’s ability to acquire or find additional reserves; hedging activities resulting in realized and unrealized losses; business interruption and casualty losses; risk of the Company not operating all of its properties and assets; counterparty risk; downgrade in credit rating and its adverse effects; liability for indemnification obligations to third parties; variability of dividends to be paid; its ability to generate sufficient cash flow from operations to meet its current and future obligations; its ability to access external sources of debt and equity capital; the timing and the costs of well and pipeline construction; the Company’s ability to secure adequate product transportation; changes in royalty, tax, environmental, greenhouse gas, carbon, accounting and other laws or regulations or the interpretations of such laws or regulations; political and economic conditions in the countries in which the Company operates; terrorist threats; risks associated with existing and potential future lawsuits and regulatory actions made against the Company; risk arising from price basis differential; risk arising from inability to enter into attractive hedges to protect the Company’s capital program; and other risks and uncertainties described from time to time in the reports and filings made with securities regulatory authorities by Encana. Although Encana believes that the expectations represented by such forward-looking statements are reasonable, there can be no assurance that such expectations will prove to be correct. Readers are cautioned that the foregoing list of important factors is not exhaustive. In addition, assumptions relating to such forward-looking statements generally include Encana’s current expectations and projections made in light of, and generally consistent with, its historical experience and its perception of historical trends, including the conversion of resources into reserves and production as well as expectations regarding rates of advancement and innovation, generally consistent with and informed by its past experience, all of which are subject to the risk factors identified elsewhere in this document.
Assumptions with respect to forward-looking information regarding expanding Encana's oil and NGLs production and extraction volumes are based on existing expansion of natural gas processing facilities in areas where Encana operates and the continued expansion and development of oil and NGL production from existing properties within its asset portfolio.
Furthermore, the forward looking statements contained in this document are made as of the date hereof and, except as required by law, Encana undertakes no obligation to update publicly or revise any forward looking statements, whether as a result of new information, future events or otherwise. The forward looking statements contained in this document are expressly qualified by this cautionary statement.
Operating Costs ($ millions)
775Upstream Operating Costs (5)
400Administrative Expense
3.3Upstream
4.75- per common share, diluted ($/share)
2012F
1300$0.05 decrease in the U.S./Canadian dollar exchange rate
5065$10/bbl increase in the WTI oil price
115150$0.50/Mcf increase in the NYMEX natural gas price
Operating Earnings (3)Cash Flow (3)2012 Sensitivities (1) ($ millions)
(3.0)Net Divestitures
3.5Total Capital Investment
0.2Corporate & Other (4)
Capital Investment ($ billions)
30Oil and NGLs (Mbbls/d)3,000Natural Gas (MMcf/d)
Production (after royalties)
3.5Total Cash Flow (1)(2)(3)
Cash Flow ($ billions, except per share amount)
2012F ENCANA CORPORATE GUIDANCE
US$, U.S. GAAP
June 20, 2012

encana.com
Investor Relations Contacts
Ryder McRitchie | Vice-President, Investor Relations403.645.2007 | [email protected]
Lorna Klose | Manager, Investor Relations403.645.6977 | [email protected]