barclays ceo energy-power conference · original assumptions: 2017 wti $50bbl /nymex $2.75mcf and...
TRANSCRIPT

CONFERENCESEPTEMBER 4-5, 2018
BARCLAYS CEO ENERGY-POWER
WPX Today
2
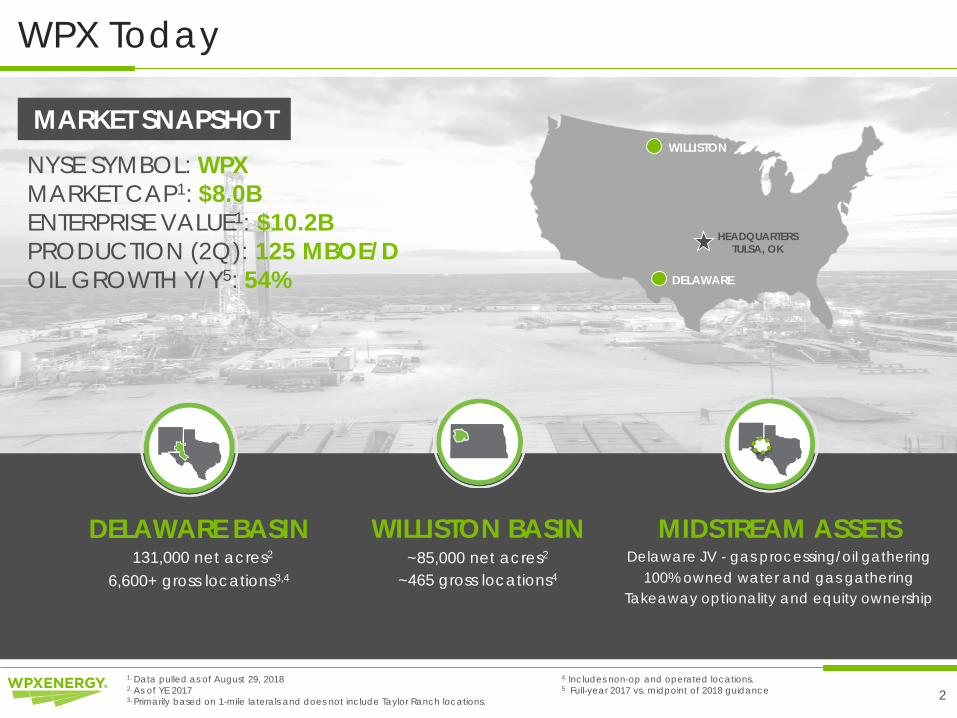
HEADQUARTERSTULSA, OK
DELAWARE BASIN~131,000 net acres2
6,600+ gross locations3,4
WILLISTON BASIN~85,000 net acres2
~465 gross locations4
MIDSTREAM ASSETSDelaware JV - gas processing/oil gathering
100% owned water and gas gathering Takeaway optionality and equity ownership
NYSE SYMBOL: WPXMARKET CAP1: $8.0BENTERPRISE VALUE1: $10.2BPRODUCTION (2Q): 125 MBOE/D OIL GROWTH Y/Y5: 54%
MARKET SNAPSHOT
4. Includes non-op and operated locations. 5 Full-year 2017 vs. midpoint of 2018 guidance
1. Data pulled as of August 29, 20182. As of YE 20173. Primarily based on 1-mile laterals and does not include Taylor Ranch locations.
DELAWARE
WILLISTON
2018 Highlights
3
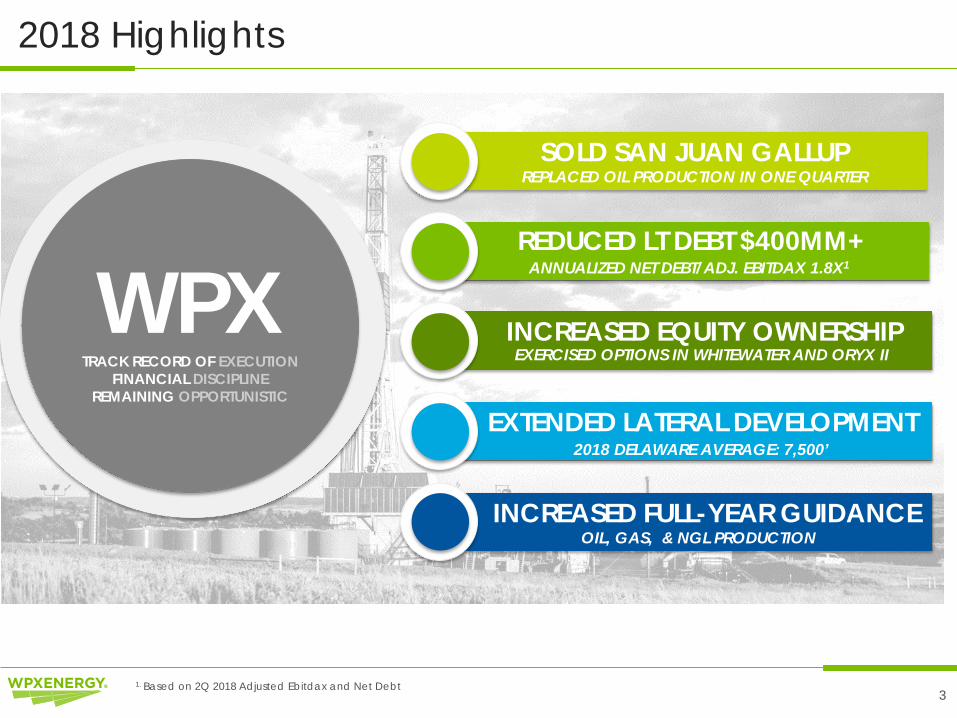
WPXTRACK RECORD OF EXECUTION
FINANCIAL DISCIPLINEREMAINING OPPORTUNISTIC
INCREASED FULL-YEAR GUIDANCEOIL, GAS, & NGL PRODUCTION
SOLD SAN JUAN GALLUPREPLACED OIL PRODUCTION IN ONE QUARTER
EXTENDED LATERAL DEVELOPMENT2018 DELAWARE AVERAGE: 7,500’
INCREASED EQUITY OWNERSHIPEXERCISED OPTIONS IN WHITEWATER AND ORYX II
REDUCED LT DEBT $400MM+ANNUALIZED NET DEBT/ADJ. EBITDAX 1.8X1
1. Based on 2Q 2018 Adjusted Ebitdax and Net Debt
$-
$5
$10
$15
$20
$25
$30
$35
$40
0
50
100
150
200
250
300
1Q2012
2Q2012
3Q2012
4Q2012
1Q2013
2Q2013
3Q2013
4Q2013
1Q2014
2Q2014
3Q2014
4Q2014
1Q2015
2Q2015
3Q2015
4Q2015
1Q2016
2Q2016
3Q2016
4Q2016
1Q2017
2Q2017
3Q2017
4Q2017
1Q2018
2Q2018
Oil NGL Gas Unhedged Adjusted Ebitdax/BOE
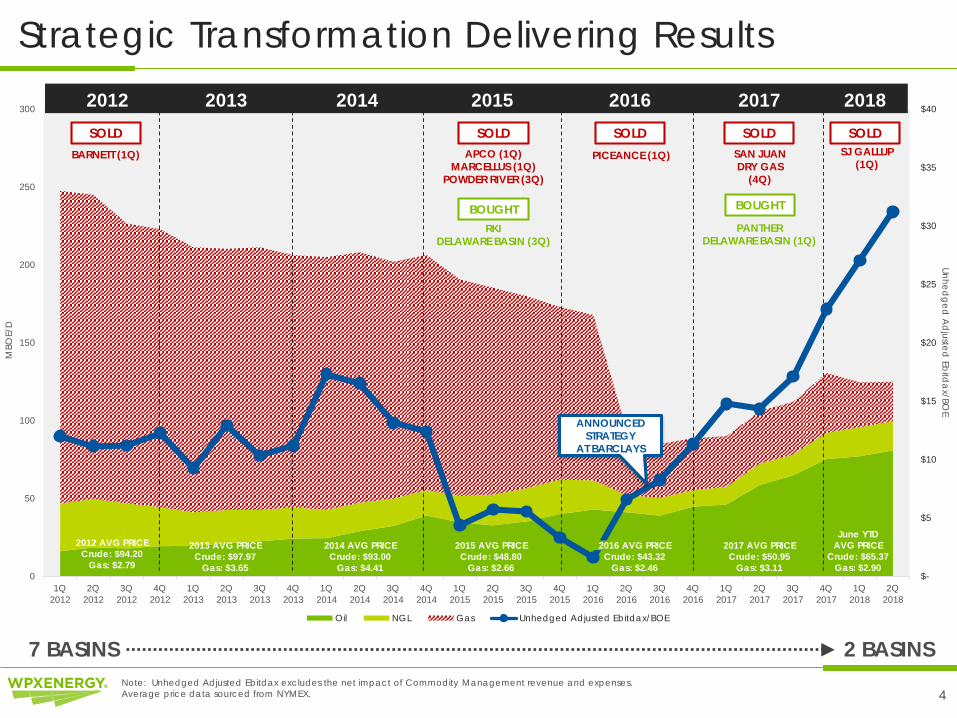
Strategic Transformation Delivering Results
4
Unhedged
Ad
justed Eb
itda
x/BOE
MBO
E/D
APCO (1Q)MARCELLUS (1Q)
POWDER RIVER (3Q)
PICEANCE (1Q) SAN JUAN DRY GAS
(4Q)
2012 AVG PRICECrude: $94.20
Gas: $2.79
2013 AVG PRICECrude: $97.97
Gas: $3.65
2014 AVG PRICECrude: $93.00
Gas: $4.41
2015 AVG PRICECrude: $48.80
Gas: $2.66
2017 AVG PRICECrude: $50.95
Gas: $3.11
June YTDAVG PRICE
Crude: $65.37Gas: $2.90
BARNETT (1Q)
7 BASINS
RKIDELAWARE BASIN (3Q)
2012 2013 2014 2015 2016 2017 2018
2 BASINS
SJ GALLUP (1Q)
SOLD SOLD
BOUGHT
SOLD SOLD
BOUGHT
PANTHERDELAWARE BASIN (1Q)
SOLD
Note: Unhedged Adjusted Ebitdax excludes the net impact of Commodity Management revenue and expenses.Average price data sourced from NYMEX.
2016 AVG PRICECrude: $43.32
Gas: $2.46
ANNOUNCED STRATEGY
AT BARCLAYS
0%
10%
20%
30%
40%
50%
60%
70%
80%
0
20
40
60
80
100
2016 2017 2018LOW CASE HIGH CASE% OIL (PREVIOUS) % OIL (ACTUAL)
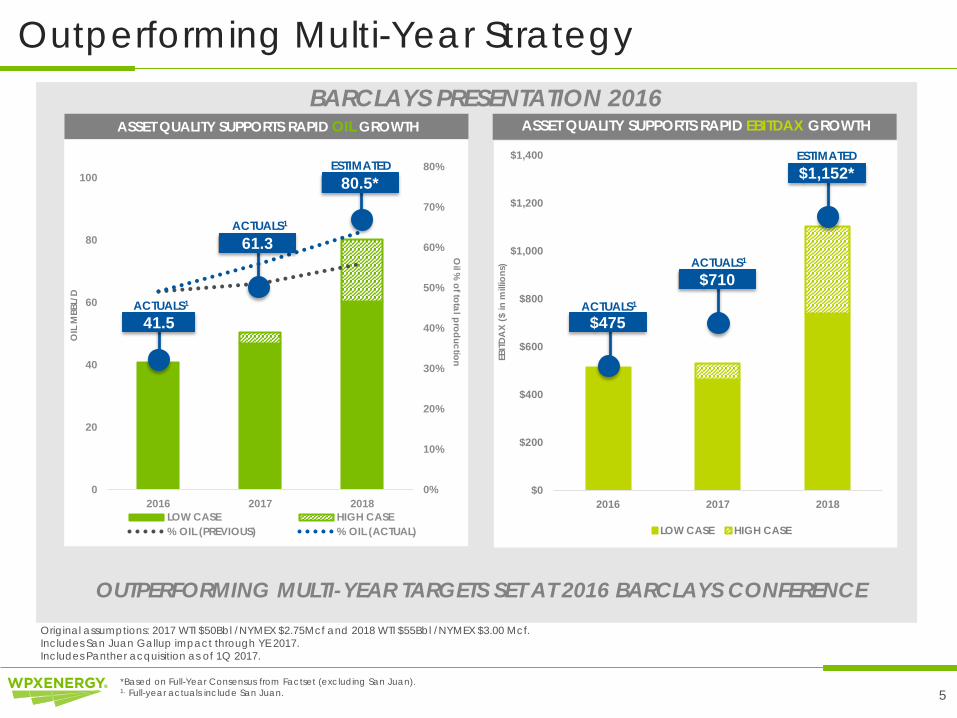
Outperforming Multi-Year Strategy
5
$0
$200
$400
$600
$800
$1,000
$1,200
$1,400
2016 2017 2018
LOW CASE HIGH CASE
$710
$475
$1,152*
41.5
61.3
80.5*
*Based on Full-Year Consensus from Factset (excluding San Juan).1. Full-year actuals include San Juan.
Oil %
of total production
OIL
MBB
L/D
ASSET QUALITY SUPPORTS RAPID EBITDAX GROWTH
ACTUALS1
ACTUALS1
ESTIMATED
ACTUALS1
ACTUALS1
ESTIMATED
Original assumptions: 2017 WTI $50Bbl /NYMEX $2.75Mcf and 2018 WTI $55Bbl /NYMEX $3.00 Mcf. Includes San Juan Gallup impact through YE 2017.Includes Panther acquisition as of 1Q 2017.
ASSET QUALITY SUPPORTS RAPID OIL GROWTH
BARCLAYS PRESENTATION 2016
OUTPERFORMING MULTI-YEAR TARGETS SET AT 2016 BARCLAYS CONFERENCE
EBITD
AX
($ in
mill
ions
)
Delaware Overview
6
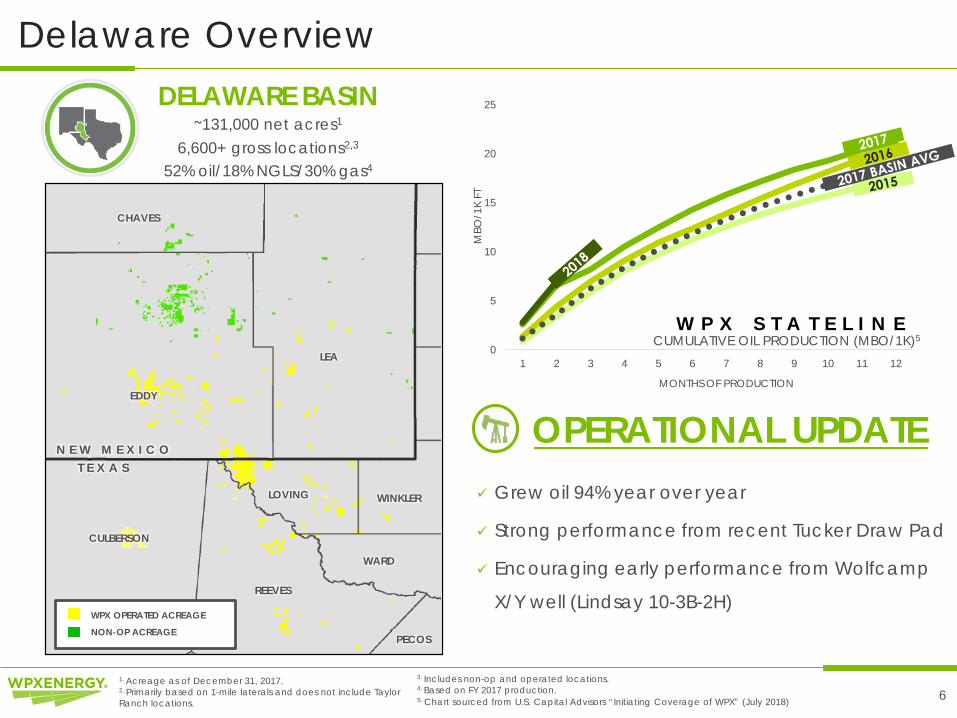
DELAWARE BASIN~131,000 net acres1
6,600+ gross locations2,3
52% oil/18% NGLS/30% gas4
CULBERSON
LEA
EDDY
WARD
REEVES
LOVING
PECOS
WINKLER
CHAVES
WPX OPERATED ACREAGE
NON-OP ACREAGE
N E W M E X I C OT E X A S
1. Acreage as of December 31, 2017.2. Primarily based on 1-mile laterals and does not include Taylor Ranch locations.
Grew oil 94% year over year
Strong performance from recent Tucker Draw Pad
Encouraging early performance from Wolfcamp
X/Y well (Lindsay 10-3B-2H)
OPERATIONAL UPDATE
0
5
10
15
20
25
1 2 3 4 5 6 7 8 9 10 11 12
MONTHS OF PRODUCTION
MBO
/1K
FT
W P X S T A T E L I N E CUMULATIVE OIL PRODUCTION (MBO/1K)5
5. Chart sourced from U.S. Capital Advisors “Initiating Coverage of WPX” (July 2018)
3. Includes non-op and operated locations. 4. Based on FY 2017 production.

Williston Overview
7
WILLIAMS
MOUNTRAIL
MCKENZIE
DUNN
MCLEAN
MERCER
WILLISTON BASIN~85,000 net acres1
~465 gross locations2
86% oil/7% NGLS/7% gas3
WPX OPERATED ACREAGE
0
50
100
150
200
250
300
0 30 60 90 120 150 180 210 240 270 300 330 360
CUM
MBO
E
NORMALIZED DAYS ON PRODUCTION
7
Grew oil 39% year over year
Continued strong performance from North Sunday
Island wells
Impressive well results from Mandaree South
OPERATIONAL UPDATE
1. Acreage as of December 31, 2017.2. Includes non-op and operated locations. 3. Based on FY 2017 production.
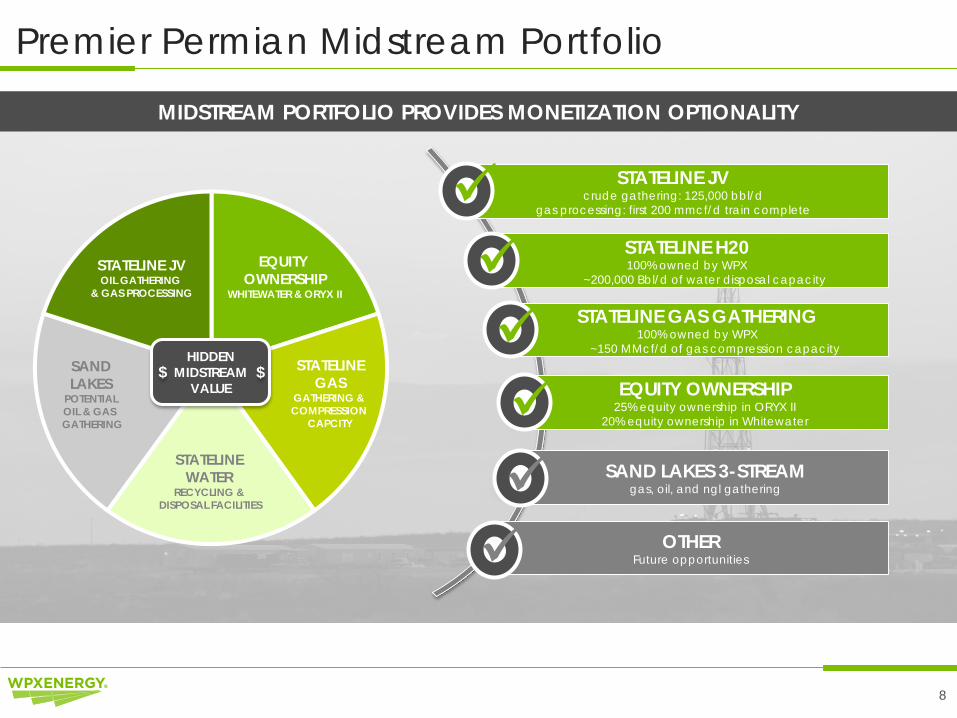
STATELINE JV crude gathering: 125,000 bbl/d
gas processing: first 200 mmcf/d train complete
Premier Permian Midstream Portfolio
8
HIDDEN MIDSTREAM
VALUE
STATELINE JVOIL GATHERING
& GAS PROCESSING
EQUITY OWNERSHIP
WHITEWATER & ORYX II
SAND LAKES
POTENTIALOIL & GAS GATHERING
STATELINE WATER
RECYCLING &DISPOSAL FACILITIES
STATELINE GAS
GATHERING & COMPRESSION
CAPCITY
STATELINE H20100% owned by WPX
~200,000 Bbl/d of water disposal capacitySTATELINE GAS GATHERING
100% owned by WPX~150 MMcf/d of gas compression capacity
EQUITY OWNERSHIP25% equity ownership in ORYX II
20% equity ownership in WhitewaterSAND LAKES 3-STREAM
gas, oil, and ngl gathering
OTHERFuture opportunities
MIDSTREAM PORTFOLIO PROVIDES MONETIZATION OPTIONALITY
$ $
WPX Protected from Midland Basis Widening
9
-30%
-20%
-10%
0%
10%
20%
30%
($15.00) Midland Basis Diff
($20.00) Midland Basis Diff
WPX Peer 1 Peer 2 Peer 3 Peer 4 Peer 5 Peer 6 Peer 7 Peer 8
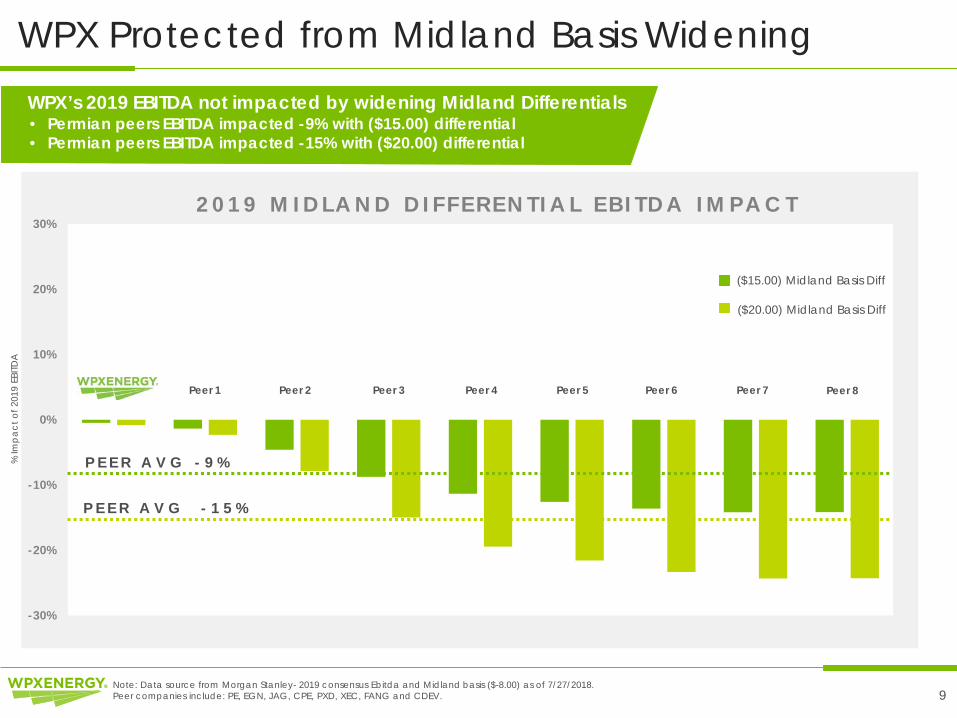
WPX’s 2019 EBITDA not impacted by widening Midland Differentials
P E E R A V G - 9 %
P E E R A V G - 1 5 %
Note: Data source from Morgan Stanley- 2019 consensus Ebitda and Midland basis ($-8.00) as of 7/27/2018. Peer companies include: PE, EGN, JAG, CPE, PXD, XEC, FANG and CDEV.
2 0 1 9 M I D L A N D D I F F E R E N T I A L E B I T D A I M P A C T
% Im
pa
ct o
f 201
9 EB
ITDA
• Permian peers EBITDA impacted -9% with ($15.00) differential• Permian peers EBITDA impacted -15% with ($20.00) differential
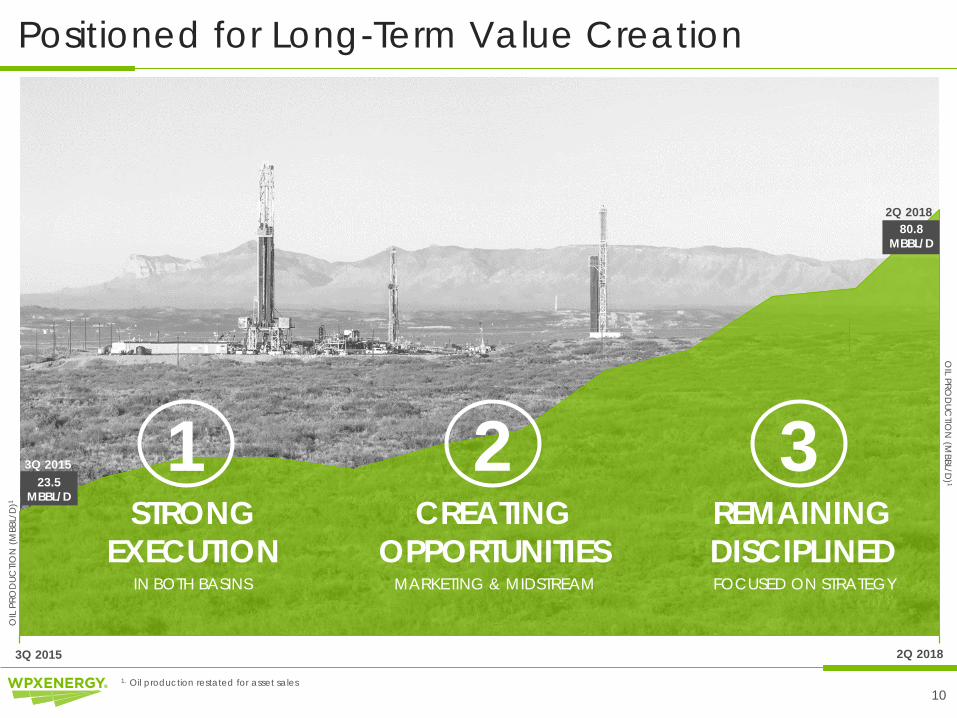
Positioned for Long-Term Value Creation
10
1 2 3STRONG
EXECUTIONCREATING
OPPORTUNITIESREMAINING DISCIPLINED
IN BOTH BASINS MARKETING & MIDSTREAM FOCUSED ON STRATEGY
0-
OIL PRO
DUC
TION
(MBBL/D
) 1
3Q 2015 2Q 2018
80.8MBBL/D
81-23.5
MBBL/D
3Q 2015
2Q 2018
1. Oil production restated for asset sales
OIL
PRO
DUC
TION
(M
BBL/
D)1

DisclaimersThe information contained in this summary has been prepared to assist you in making your own evaluation of the Company and does not purport to contain all of the information you may consider important in deciding whether to invest in shares of the Company’s common stock. In all cases, it is your obligation to conduct your own due diligence. All information contained herein, including any estimates or projections, is based upon information provided by the Company. Any estimates or projections with respect to future performance have been provided to assist you in your evaluation but should not be relied upon as an accurate representation of future results. No persons have been authorized to make any representations other than those contained in this summary, and if given or made, such representations should not be considered as authorized.
Certain statements, estimates and financial information contained in this summary constitute forward-looking statements or information. Such forward-looking statements or information involve known and unknown risks and uncertainties that could cause actual events or results to differ materially from the results implied or expressed in such forward-looking statements or information. While presented with numerical specificity, certain forward-looking statements or information are based (1) upon assumptions that are inherently subject to significant business, economic, regulatory, environmental, seasonal, competitive uncertainties, contingencies and risks including, without limitation, the ability to obtain debt and equity financings, capital costs, construction costs, well production performance, operating costs, commodity pricing, differentials, royalty structures, field upgrading technology, and other known and unknown risks, all of which are difficult to predict and many of which are beyond the Company's control, and (2) upon assumptions with respect to future business decisions that are subject to change.
There can be no assurance that the results implied or expressed in such forward-looking statements or information or the underlying assumptions will be realized and that actual results of operations or future events will not be materially different from the results implied or expressed in such forward-looking statements or information. Under no circumstances should the inclusion of the forward-looking statements or information be regarded as a representation, undertaking, warranty or prediction by the Company or any other person with respect to the accuracy thereof or the accuracy of the underlying assumptions, or that the Company will achieve or is likely to achieve any particular results. The forward-looking statements or information are made as of the date hereof and the Company disclaims any intent or obligation to update publicly or to revise any of the forward-looking statements or information, whether as a result of new information, future events or otherwise. Recipients are cautioned that forward-looking statements or information are not guarantees of future performance and, accordingly, recipients are expressly cautioned not to put undue reliance on forward-looking statements or information due to the inherent uncertainty therein.
11
The SEC requires oil and gas companies, in filings made with the SEC, to disclose proved reserves, which are those quantities of oil and gas, which, by analysis of geoscience and engineering data, can be estimated with reasonable certainty to be economically producible – from a given date forward, from known reservoirs, under existing economic conditions, operating methods, and governmental regulations. The SEC permits the optional disclosure of probable and possible reserves. We have elected to use in this presentation “probable” reserves and “possible” reserves, excluding their valuation. The SEC defines “probable” reserves as “those additional reserves that are less certain to be recovered than proved reserves but which, together with proved reserves, are as likely as not to be recovered.” The SEC defines “possible” reserves as “those additional reserves that are less certain to be recovered than probable reserves.” The Company has applied these definitions in estimating probable and possible reserves. Statements of reserves are only estimates and may not correspond to the ultimate quantities of oil and gas recovered. Any reserve estimates provided in this presentation that are not specifically designated as being estimates of proved reserves may include estimated reserves not necessarily calculated in accordance with, or contemplated by, the SEC’s reserves reporting guidelines. Investors are urged to consider closely the disclosure regarding our business that may be accessed through the SEC’s website at www.sec.gov.
The SEC’s rules prohibit us from filing resource estimates. Our resource estimations include estimates of hydrocarbon quantities for (i) new areas for which we do not have sufficient information to date to classify as proved, probable or even possible reserves, (ii) other areas to take into account the low level of certainty of recovery of the resources and (iii) uneconomic proved, probable or possible reserves. Resource estimates do not take into account the certainty of resource recovery and are therefore not indicative of the expected future recovery and should not be relied upon. Resource estimates might never be recovered and are contingent on exploration success, technical improvements in drilling access, commerciality and other factors.
This presentation may include certain financial measures, including adjusted EBITDAX (earnings before interest, taxes, depreciation, depletion, amortization and exploration expenses), that are non-GAAP financial measures as defined under the rules of the Securities and Exchange Commission.
This presentation is accompanied by a reconciliation of these non-GAAP financial measures to their nearest GAAP financial measures. Management uses these financial measures because they are widely accepted financial indicators used by investors to compare a company’s performance. Management believes that these measures provide investors an enhanced perspective of the operating performance of the company and aid investor understanding. Management also believes that these non-GAAP measures provide useful information regarding our ability to meet future debt service, capital expenditures and working capital requirements. These non-GAAP financial measures should not be considered in isolation or as substitutes for a measure of performance prepared in accordance with United States generally accepted accounting principles.
Reserves Disclaimer
WPX Non-GAAP Disclaimer