barbed wire and barbless wire strand from argentina ... · and barbless wire strand from argentina...
TRANSCRIPT

BARBED WIRE AND BARBLESS WIRE STRAND FROM AR-GENTINA, BRAZIL AND POLAND
Determination of the Commission In Investigations Nos. 731-TA-208, 209 and 21 O (Preliminary) Un'der the Tariff Act of 1930,Together With the Information
. Obtained In the Investigations
USITC PUBLICATION 1831
JANUARY 1985
United States International Trade Connlsalon I Wahington, DC 20436

JN!Tf.:.D STATES INTERNATIONAL TRADE COMMISSION
COMMISSIONERS
Paula Stem, Chairwoman
Susan W ~ Llebeler, Vice Chairman
Alfred E. Eckes
Seeley G. Lodwick
David B. Rohr
Kenneth R. Mason; Secretary to the Commission
Staff Assigned:
Bruce Cates, Office of Investigations Laszlo Boszormenyi, Office of Industries
Jeff Anspacher, Office of Economics Marvin Claywell, Office of Investigations
Stephen McLaughlin, Office of the General Counsel Robert Eninger, Supervisory Investigator
Address all communications to
Office of the Secretary
United States International Trade Commission
Washington, D.C. 2q435

C 0 N T E N T S
Determinations 1 Views of the Commission 3 Information obtained in the investigations:
Introduction A-1 Previous investigations A-1 Nature and extent of the alleged LTFV sales A-2 The products:
Description and uses A-2 U.S. tariff treatment A-3
U.S. producers A-4 U.S. importers A-5 The U.S. market:
Channels of distribution A-5 Apparent consumption A-5
Consideration of alleged material injury to an industry in the United States:
U.S. production, capacity, and capacity utilizatio A-6 U.S. producers• shipments A-8 U.S. exports A-10 U.S. producers• inventories A-12 Employment and wages A-12 Financial experience of y.s. producers A-14
Overall establishment operations A-14 Barbed wire A-14 Capital expenditures A-17 Investment in pr.oductive facilities A-18 Capital and investment A-18
Consideration of alleged threat of material injury to an industry in the United States A-18
U.S. importers' inventories A-18 Foreign producers and their capacity to generate exports A-18
Argentina A-19 Brazil A-20
Consideration of the causal relationship between alleged material injury or the threat thereof and alleged LTFV imports:
U.S. imports A-21 Barbed wire A-21 Barbless wire strand A-21
U.S. market penetration by the alleged LTFV imports A-25 Prices A-25
Barbed wire, 12.5 gauge, 2 points A-26 Barbed wire, 12.5 gauge, 4 points A-32 Barbed wire, 15.5 gauge, 2 points A-32 Barbed wire, 15.5 gauge, 4 points A-32 Barbless wire strand A-32
Exchange rates A-33 Lost sales A-33 Lost
Appendix A. Appendix B. Appendix C.
revenues A-35 The Commission's Federal Register notice of investigations~ A-37 List of witnesses appearing at the Commission's conference~ A-39 Supplemental price tables A-41

ii
!:'. . CONTENTS .1:
.. ~- .
Tables
1. Barbed wire and barbless wire strand: U.S. producers' shipments, imports for consumption, exports of domestic merchandise, and apparent consumption, 1981-83, January-September 1983, and January-September 198~ A-6
2. Barbed wire and barbleis wire strand: U.S. production, production capacity, and capacity utilization, by firms, 1981-83, January-October 1983, and January-October 1984 A-7
3. Barbed wire and barbless wire strand: Domestic shipments by U.S. producers, by firms, 1981-83, January-October 1983, and January-October 1984 A-9
4 .. Barbed wire and barbless wire strand: U.S. exports of domestic merchandise, by principal markets, 1981-83, January-September 1983, and January-September 1984 A-11
5. Barbed wire and barbless wire strand: U.S. producers' inventories of domestically produced merchandise, by firms, as of December 31, 1981-83, and October 31, 1983-84 A-12
6. Barbed wire and barbless wire strand: Average number of production and related workers and hours worked by and wages and total compensation paid to such employees, 1981-83, January-October 1983, and January-October 1984 A-13
7. Income-and-loss experience of 4 U.S. firms on the overall operations of their establishments within which barbed wire is produced, 1981-83, interim 1983, and interim 1984 A-15
8. Income-and-loss experience of 4 U.S. firms on their operations producing barbed wire, 1981-83, interim 1983, and interim· 1984 A-16
9. U.S. producers' capital expenditures and fixed assets employed in their establishments within which barbed wire is produced, 1981-83, January-October 1983, and January-October 1984 A-17
10. Barbed wire and barbless wire strand: Argentina's production, capacity, capacity utilization, domestic shipments, and exports, 1981-83, January-October 1983, and January-October 1984 A-19
11. Barbed wire and barbless wire strand: U.S. imports for consumption, by types and by specified sources, 1981-83, January-September. 1983, and January-September 1984 A-22
12. Barbed wire: U.S. imports for consumption, by principal sources, 1981-83, January-September 1983, and January-September 1984 A-23
13. Barbless wire strand: U.S. imports for consumption, by principal sources. 1981-83, January-September 1983, and January-September 1984 A-24
14. Barbed wire and barbless wire strand: Share of U.S. consumption supplied by Argentina, Brazil, Poland, all other countries, and U.S. producers, 1981-83, January-September 1983, and January-September 1984 A-25
15. Barbed wire (12.5 gauge, 2 point, 5-inch· spacing): U.S. producers' and importers' weighted-average net f.o.b. selling prices per reel and margins of underselling by imports, by quarters, January. 1982-September 1984 A-27

iii
CONTENTS
16. Barbed wire (12.5 gauge, 4 point, 5-inch spacing): U.S. producers'' and importers' weighted-average net f.o.b. selling prices per reel and margins of underselling by imports, by quarters, 3anuary 1982-September 1984 A-28
17. Barbed wire (15.5 gauge, 2 point, 5-inch spacing): U.S. p~oducers' and importers' weighted-average net f.o.b. selling prices per reel and margins of underselling by imports, by quarters, 3anuary 1982-September 1984 . A-29
18. Barbed wire {15.5 gauge, 4 point, 5-inch spacing): U.S. producers' and importers' weighted-average net f.o.b. selling prices per reel and margins of underselling by imports, by quarters, 3anuary 1982-September 1984 A-30
19. Barbless lflire strand: U.S. producers• and importers• weighted-average net f .o.b. selling prices per reel and margins of under-selling by imports, by quarters, 3anuary 1982-September 1984 A-31
20. Nominal and real exchange-rate indexes between the U.S. dollar and the Argentine peso and the Brazilian cruzeiro, by quarters, January 1981-September 1984 A-34
Note.--Information that would reveal the confidential operations of individual concerns may not be published and ·therefore has been deleted from this report. Such deletions are indicated by asterisks.


UNITED STATES INTERru~TIONAL TRADE COMMISSIO~ Washington, DC
Investigations ~os, 731-TA-208, 209, and 210 (Preliminary)
8AR~ED WIRE AND BARBLESS WIRE ST~AND FROM ARGENTINA, B~AZIL, AruD POLAND
On the basis of the record l/ developed in investigations Nus. 731-TH-208,
209, and 210 (Preliminary), the Commission d~termines, pursuant to section
733(a) of the Tariff Act of 1930 (19 U.S.C. § 1673b(a)). that there is a
~eason~ble indication that an industry in the United States is materially
and barbless wire strand, provided for in it~ms 642.02 and 642.11,
respectively, of the Tariff Sch~clules of the United States, which are
allegedly being sdd in the Uriited States at less than fair value (LTFV),
On November 19, 19B4, petitions were filed with the U,S. International
Trade Commission and the U.S. De~artment of Commerce by coynsel on behalf of
Forbes Steel & Wire Cor~ .• Canonsburg. PH, The petitions ~ere also supported
by CF&I Steel Cor~., Pueblo, CO, Davis Walker Corp., Los Afigeles, CA, and
Oklahoma Steel Wire Corp., Madill, OK. The petitions allege that barbed wire
and barbl~ss wire strand from Argentina, ~razil, and Poland are beir.~, or ar~
lik~ly tu be, sold in the United Stat~s at LTFV. Accordingly. effective
November 19, 1984, the Commission instituted pr~liminary antidumping
investigations to d~termine whether there is a reasonable indication that an
iridustry in the United States is materially injureci, or is threatened with
material injury, or the establishment of an industry 1n the United Stat~s is
!/Th~ "recorci" is d~f ned in s~ction 207.2(i) of th~ commission's Rules of Practice and ~roceclur;e ( 9 C.F.R. § 207,2(i)).

2
materially retarded, by reason of the importation of such merchandise into the
United States.
Notice of the institution of the Commission's investigations and of a
public conference to be held in connection therewith was given by posting
copies of the notice in the Office of the Secretary, U.S. International Trade
Commission, Washington, DC, and by publishing the notice in the Federal
Register of November 28, 1984 (49 F.R. 46816). The conference was held in
Wash~ngton, DC, on December 12, 1984, and all persons who requested.the·
opportunity were permitted to appear in person or by counsel. The
Commission• s determinations in these investigations were made in an open'
"Government in the Sunshine" meeting held on January 2, 1985.
. ~.

3
VIEWS OF THE COMMISSION
We have determined that there is a reasonable indication that an industry
in the United States is materially injured by reason of imports of barbed wire
and barbless wire strand from Argentina which are aliegedly sold at less than
fair value (LTFV). We also have determined that there is a reasonable
indication that an industry in the United States is materially injured by
reason of such imports from Brazil. Finally, we have determined that there is
a reasonable indication that an industry in the United States is materially
injured by reason of such imports from Poland.
In the following analysis, we explain our finding that there is one like
product and the appropriate industry for the purpose of making a material
injury assessment consists of the domestic producers of barbed wire and
barbless wire strand. We then discuss why there is a reasonable indication
that the domestic industry is suffering material injury by reason of LTFV
imports from each country.
Domestic industry
As a threshold inquiry, the Commission is required to identify the
domestic industry to be examined for the purpose of making an assessment of
material injury. !/
1/ Section 771(4){A) of the Tariff Act of 1930 defines the term "industry" as-"the domestic producers as a whole of a like product, or those producers whose collective output of the like product constitutes a major proportion of the total domestic production of that product." 19 U.S.C. § 1677(4)(A). Section 771 {10). in turn. defines "like product" as a "product which is like, or in the absence of like, most similar in characteristics and uses with the articles subject to an investigation .... 11 19 U.S.C. § 1677(10).

The imported products covered by these investigations are barbed wire and
barbl~ss wire strand, which are galvanized steel products produced from low-
and medium-carbon steel wire rod. The wire ranges in size. from 12-1/2 ,to 18
gauge material. It is produced by drawing wire rod through dies to.' the
desired size and then passing it through a molten zinc bath so that th~ wire
will be corrosion resistant. Two strands of wire are then fed intc;:i a_,mj'lch~r.te·
that twists the wires around each other. Then, when producing barbed wire; ·a.
third and sometimes a fourth wire is fed into the machine,. wrapped around the -
two twisted wires, and cut to form barbs. ~/ There is no distinction-between,
the imported and domestic products. .. ' I·.'.
We conclude that domestically produced barbed wire and barbless wire:.
strand constitute a single like product and, consequently, the domes-tic ·•.··.
industry consists of the U.S. producers of barbed wire and barbless wire
strand. ~/ This determination is based on the nearly identical. ·
characteristics of low tensile barbed wire, high tensile barbed wire; ·and
barbless wire strand and the equivalent uses to which they are put.·. All. three
types of barbed and barbless wire are produced from the same raw material . .... .
They all pass through the same production process, up until the final stage of
production. They are produced in the same plant by the same employees and are
~I Report of the Commission (Report) at A-2-3. . ~I The respondents in these investigations have suggested that there may be
two or three like products: high tensile barbed wire, low tensile barbed wire, and barbless wire strand. On the basis of the information available at this time we have rejected their suggestion. However, we reserve the•rigtit·to-, reconsider this determination should a final investigation take place. In the relatively longer investigation period provided for a final investigation, the Commission staff will attempt to obtain information from both domestic and foreign producers for each of these three wire products in order to determine whether separate like product and domestic industry analyses are warranted.

5
distributed to the consumer through the same channels of distribution. ii
They are all used primarily for fencing in agricultural applications and have
a similar useful life. ~/ In 1984, 10 firms produced barbed wire and/or
barbless wire strand in 11 plants in the United States. §/
Condition of the domestic industry
Under Section 733 of the.Tariff Act of 1930, as amended, the Commission
is required to determine, in the first instance, whether there is a reasonable
indication that an industry in the United States is materially injured or
threatened with material injury~ ZI In making a material injury
determination, the Commission considers, among other factors, whether there
are declines in production, capacity utilization, sales, market share,
employment, wages, and profitability. !/
ii Report at A-2-3, A-5; Posthearing Brief of Petitioner at 3-6. §I The primary reason for selecting barbless over barbed wire is the type of
livestock that the purchaser will fence in. Barbless wire is used to res~rain show horses or other animals that could be seriously harmed by barbs, while barbed wire is used for cattle. The primary reason for selecting low tensile barbed wire over high tensile barbed wire, and vice versa, is traditional use and habit, not any inherent difference between them. Report at A-3.
§I The ten firms and the location of their production facilities are as follows: Atlantic Steel Co., Atlanta, GA; Bekaert Steel and Wire Co., Van Buren, AR; CF&I Steel Corp., Pueblo, CO.; Continental Steel Corp., Kokomo, IN; Davis Walker Corp., Los Angeles, CA; Forbes Steel & Wire Corp., Canonsburg, PA and Wilmington, DE; Keystone Consolidated Ind. Inc., Peoria, IL; Nagle Wire Corp. of Colorado, Rocky Ford, CO; Northwestern Steel & Wire Co., Sterling, IL; and Oklahoma Steel Wire Co., Inc., Madill, OK. Armco, Inc., Middleton, OH ceased production of barbed wire and barbless wire strand in May 1983. Atlantic Steel ceased production of barbed wire and barbless wire strand in July 1984.
?/ 19 U.S.C. § 1673(b). The statute defines "material injury" as "harm which is not inconsequential, immaterial, or unimportant." 19 U.S.C. § 1677(7).
!/ 19 U.S.C. § 1677(7)(C)(iii).

6
U.S. production of barbed ·wire and barbless wire strand declined overall
between 1981 and 1983, and the trend continued through January-October 1984.
Overall production decreased by 18 percent between 1981 ard 1983 and dropped
by 37 percent in January-October 1984, compared with production in
January-October 1983. ~/ While some of this decline can be attributed to the
cessation of production by two producers, every producer who submitted data to
the Commission registered a decline in production for this period. 10/
Capacity utilization in the domestic industry has steadily declined
during the period of these investigations. capacity utilization measurQd 56.9
percent in 1981 and fell to 52.9 percent in 1983. Then it dropped
substantially to 34.2 percent in January-October 1984. 11/
Domestic shipments of barbed wire and barbless wire strand declined
irregularly during 1981-83 before dropping substantially in January-October
1984. Available data indicate an 18 percent decline from 1981 to 1983,
followed by a 35 percent decline for January-October 1984, compared with
January-October 1983. 12/ Exports, which represent less then 5 percent of
U.S. producers' shipments, also declined during the period of the·
investigation. 13/ The domestic market share of U.S. producers has declined
slowly from 79.8 percent in 1981 to 77.5 percent in 1983, and then dropped
sub~tantially to 66.5 percent for January-September 1984. 14/
?_/ Report at A--6. 10/ Id. !!/ Id. at A--6-8. Some domestic producers, such as Forbes, the petitioner,
have expanded capacity during the period of these investigations, while, others, such as Armco and Atlantic, have ceased production.
12/ Id. at A-8. 13/ Id. at A-10. 14/ Id. at A-25, Table 14.

7
Available data on employment and wages show a steady ·decline -in all
areas. The number of production workers dropped by 21 percent from 1981 to
1983, and dropped by 25 percent in January-October 1984, compared with the
similar period for 1983. 15/ Total hours worked by production workers and
total wages and compensation paid to those workers registered similar
declines. 16/
Four firms. accounting for less than half of reported U.S. production in
1983, furnished usable income-and-loss data concerning their barbed wire
operations. 17/ The data indicate that net ·sales have dropped by 41 percent
during 1981-83, and by an additional 46 percent for the period January-October
1984, compared with the similar period in 1983. 18/ The data also indicate
that the four reporting firms sustained aggregate operating losses and net
losses in each of the reporting periods. 19/ Operating losses more than
quadrupled between 1981 and January-October 1984. Net losses almost
quadrupled between 1981 and January-October 1984. 20/
Reasonable indication of material injury by reason of the alleged LTFV imports
In making its determination whether there is a reasonable indication that
material injury to the domestic industry is "by reason of" allegedly LTFV
imports. 21/ the Commission must consider. among other factors. the volume of
15/ Id. at A-12-13 .. 16/ Id. at A-13. 17/ Id. at A-14 . .ill Id. 19/ Id. at A~14-16. 20/ !!!· at A-14; Table 8. 211 19 ·u.s.c. § 1673(b).

8
imports, the effect of • t . - r"_i_.k_·-=-1 mpor 5 -0n prlces ln .·. _ United States for the like
product, and the impact of such imports on t~e relevant domestic
industry. 22/ On the basis of the data obtained in these investigations, we
conclude that there is a reasonable indication that LTF~ imports from each of
the countri~s subject to investigation have separately caused material injury
to the domestic barbed wire and barbless wire strand indLlstry. 23/ Our
decision is based primarily on the significant increases in m-~rket penetration
by imports from each country, and en the substantial mar~ins of urr~erselling.
During the period of these investigations, imports from each country
data indicate that prices of imports from each country have steadily
decreased, while domestic prodLlcers' prices have reIT:.ained relatively
stable. 25/ Therefore, the margin of underselling by im~;:irh from each of the
three countries has also increased. The Commission staff investigated
confirmed that there were instances of U.S. produc~rs having lost sales or
revenue to imports from each of the three countries subject to investigation
22/ 19 u.s.c. § 1677(7). 23/ Since we find injury to th~ domestic industry D~ reason of imports from
each country individually, there is no need to addr~ss the issLle of cumLllation at this time. Howev~r, should a final in¥~stigation tak~ place, we do not preclLlde cumulation if the information obtained ther~in so warrants. 24/ ~~port at ~-21-25, Table 12; A-25, Table 1~. The re-arket share of im~rts
from Arg~ntina has risen from 0.6 p~rc~nt in 19S1 to 4.8 perc~nt in JanLlary-September 1984. The market shar~ of ~razilian imparts increas~d from 0.5 perc~nt in 1981 to ~LO percent in January-Sept~mb~r 1984. Themarket share of imports from Poland has risen from ~.4 percent in 1981 to 4.4 perc~nt in January-September 19~4. 25/ Id. at A-26. 26! Id. at A-33-35.

9
Argentina. Market penetration of importS of barbed wire andbarbless
wire strand from Argentina i_ncreased from 0. 6 percent of U.S. consumption in
1981 to 2. 9 percent in 1983 and .;then to 4. 8 percent in January-September
1984. 27/ A.vailab1e data indicate. that th~ margin of underselling for barbed
wire products fro.m Argentina has peen as high ·as.74.8 percent in 1984. 28/
Brazil. Market penetration of imports of barbed wire and barbless wire
strand from Brazil increased from 0.5 percent of U.S. consumption in 1981 to
3.8 percent in 1983 and then to 8.0 percent in January-September 1984. 29/
Available data indicate that there have been substantial margins of
underselling for all types of wire products from Brazil and that current
margins range from 10.S percent to 38.3 percent. Prior margins of
underselling were in a similar range. 30/ • Polan.q. Market penetration of imports from barbed wire and barbless wire
strand from Poland declined from 3.4 percent of U.S. consumption in 1981 to
1.2 percent in 1982. However, market penetration then increased to 3.6
percent in 1983 and, further, to 4.4 percent in January-September 1984. 31/
Avai'lable data indicate that there have been substantial margins of
underselling for all types of wire products actually imported from Poland.
Currently, those margins range from 35 percent to 50.9 percent. Prior margins
of underselling have been in a similar range. 32/
27/ Id. at A-25. 28/ Id. at A-26-33, Tables 15-19. 29/ Id. at A-25. 30/ Id. at A-26-33, Tables 15-19. 31/ Id. at A-25. 32/ Id. at A-26-33, Tables 15-19.

10
Conclusion
On the basis of the foregoing discussion and the information available to
the Commission at this time. we determine that there is a reasonable
indication that the U.S. barbed wire and barbless wire strand industry is
separately and materially injured by reason of imports of barbed wire and
barbless wire strand from Arg~ntina. Brazil and Poland, allegedly being sold
in the United States at less than fair value.

A-1
INFORMATION OBTAINED IN THE INVESTIGATIONS
Introduction
On November 19, 1984, petitions were filed with the U.S. International Tra.de Commission and the U.S. Department of Commerce by counsel on behalf of Forbes Steel & Wire Corp., Canonsburg, PA, alleging that barbed wire and barbless wire strand !/ from Argentina, Brazil, and Poland are ·being, or are likely to be, sold in the United States at less than fair value (LTFV). 2/ Accordingly, effective November 19, 1984, the Commission instituted -investigations Nos. 731-TA-208, 209, and 210 (Preliminary) under section 733(a) of the Tariff Act of 1930 (19 U.S.C. § 1673b(a)). The purpose of the Commission's investigations is to determine whether there is a reasonable indication that an industry in the United States is materially injured, or is threatened with material injury, or the establishment of an industry in the United States is materially retarded, by reason of imports from Argentina, Brazil, and Poland of barbed wire and barbless wire strand which are allegedly sold at LTFV.
The statute directs the Commission to make its determination within 45 days of the receipt of a petition or, in these cases, by January 3, 1985. Notice of the institution of the Commission's investigations was given by posting copies of the notice in the Office of the Secretary, U.S. International Trade Commission, Washington, DC, and by publishing the notice in the Federal Register of November 28, 1984 (4g FR 46916). ~/ The Commission held a public conference in Washington, DC, on December 12, 1984, at which all interested parties were allowed to present information and data for consideration by the Commission. y The Commission voted or1 these investigations in an open "Government in the Sunshine" meeting held on January 2,. 1985.
Previous Investigations
Barbed wire and barbless wire strand have not been the subject of previous antidumping or countervailing duty investigations, but they were among the products included in the Commission's recent investigation No. TA-201-51, Carbon and Certain Alloy Steel Products. ~/ On the basis of information developed in that investigation, the Commission, on July 24, 1984, notified the President of its determination that certain products (including wire and wire products) were being imported into the United States in such
1/ Barbed wire and barbless wire strand are provided for in items 642.02 and 54l.11, respectively, of the Tariff Schedules of the United States (TSUS). The barbless wire strand included in these investigations is loosely twisted double wire strand suitable for fencing. ~I According to the petition, three additional U.S. manufacturers, CF&I
Steel Corp., Pueblo, CO, Davis Walker Corp., Los Angeles, CA, and Oklahoma Steel Wire Co., Inc., Madill, OK, are in support of the petition. ~/A copy of the Commission's Federal Register notice is presented in app. A. 1/ A list of witnesses who appeared at the public conference is _presented in
app. B. ~/ Carbon and Certain Alloy Steel Products, Report to The President on
Investigation No. TA-201-Sl ... , USITC Publication 1553, July 1984.

increased quantities as to be a substantial cause of serious ir.1ury to the domestic industries producing articles like or directly competitive with the imported articles. 11 On September 18, 1984, the President announced his determination that import relief would not be provided to the industry, as it was not in the national ecoriomic interest.
ruature and Extent of the ~lleged LTFV Sales
The petition alleges that the LTFV margins are SS.4 percent for import$ from Argentina, 55. 4 percent for imports from Brazil, and 29. 5 percent for imports from Poland. ~/ To support the allegations of LTFV sales, the petitioner arrived at the United States prices by using the prices at which the barbed wire from Argentina, Brazil, and Polarid is offered for sale in the United States, adjusted to reflect the cost of importil!g the merchandise from each of the subject countrhs. .~/ To arrive at the foreign market value of barbed wire from ~rgentina and Brazil, the petitioner used U.S. producers' · costs of productior; adjusted for differences in the costs of production in
~:~:~:~::a~~~tB::~~!·i~1de~:~:~~=cip~!a~~eh:;i~es!~t:h~~~t:~;~e:re~l~~~!~ the merchandise is sold in a non-state-coritrolled economy for home-market con~wmption (or for export, if the home market is too small). §/ Ne . information i;.Jas available to the p~ti tio:mer on home-market-economy surrogates; therefore, for Poland, the foreign-market value ~~s determined from the average entered price of the barbed wir~ imported into the United States in· 1983, excluding imports from Poland, the Peoples' Repyblic of China, Austria, and Taiwan. §/
The Products
Barbed wire and barbless wire strand are galvanized steel products produced from lo~'- and mediu~-carbon steel wire rod. The wire rod is drawn into wire through dies, thereby increasing the strength and ductility of th~ wire while diminishing its cross-sectional area. The drawn wire is then passed through a molten-zinc bath where a corrosion-resistant zinc coating is
l/ Chairwoman Stern and Vice Chairman Liebeler dissented in the voting with respect to wire and wire products (this product group included barbed wir~ and barbless wire strand).
ii Hnnexes to the petition were received by the Commission from counsel for the petitioner on Dec. 5, 1984, The petition further alleges that critical circumstances exist because (a) importers of barbed wire from Argentina, Brazil, and Poland knew, or should have known, that the exporters ~ere selli~~ the merchandise ~t LTFV, given the margin between foreign market values and the U.S. price, and (b) there have been ~~ssive imports over a relatively short period from each of the countries irivohed.
11 Petition, pp. 10, 14, and 18. ii Petition, pp. 12, 13, anci 17. ~i Tariff Act of 1930, section 773(c). ~/ Petition, pp. 20-23,

~-3
applied. Two strands of the wire are then fed into a machine that twists tnem evenly under tension. ~hen producing barbed wire (which accounts for about 98 percent of aggregate U.S. production of barbed wire and barbless wire strand), a third wire~anci a fourth, in the case of four-point barbed wire~is fed into the machine, wrapped around the two twisted wires, and cut to form the barbs. The barbs are commonly spaced at intervals of 4 or 5 inches, The machinery for manufacturing barbed wire has changed little in recent ~ears and is generally the same worldwide, The wire, which ranges in size from 12.5- to lB~~auge material, is then coiled into reels and wrapped in a protective cover for shipment.
categ:~~e:m~~i~=~b~~c~~~!~~~wT~:~;~je0~a~:~e~~~!~ !~e~i!:!~so;w~t=~~~~d) and high tensile (or "Gaucho"). Both are rated for 950 pounds of minimum breaking strength. Lo~; tensile wire is the traditional barbed wire used in the United States, and it accounts for an estimated 70 ~ercent of domestic production. !/ Its major advantage, compared with high tensile wire, is its greater ease of installation. Low tensile barbed wire is chiefly 12.5 gauge (0.099 inch in diameter), four-point material. It is generally sold in 80~pound, 1,320-foot reels (also known as rolls or spools).
High tensile barbed wire, which was introduced in the United States in 1966, currently accounts for an estimated 30 percent of domestic production. ~! The major advantages cf high tensile wire are its lighter weight (which can result in lower cost per linear foot installed) and its longer e~pected life (20 years, compared with 10 to 15 years for low tensile wire). The longer life expectancy of the high tensile wire is due to its heavier zinc coating and its greater resistance to sagging. High-tensile barbed wire is chiefly 15.5 gauge (0.067 inch in diameter), four-point material. It is. generally sold in 43.5-pound, 1,320-foot reels.
Barbed wire is used for fencing in agricultural applications (about 90 percent of consumption) and in a variety of industrial-security applications (about 5 percent of consumption). The Feder~l Government also purchases barbed wire for security applications through the Federal Supply and Services Branch of the General Services Administration and through the Defense Industrial Supply Center (about 5 percent of consumption).
Twisted barbless wire strand is usually used when barbed wire would cause harm to certain livestock, such as sh0'4 horses.
U.S. tariff tr~atment
Imports of barbed wire are classified under lLem 642.02 of the TSUS. Such imports are free of duty regardless of origin. Im~orts of the barbless wire strand subject to these investigations are classified under item 642.1105 of the Tariff Schedules of the United States A~notated. This item provides for iron or steel wire strand of loosely twisted double wire, suitable for
1/ Low tensile barbed wire has a tensile strength of 61,700 oound5 per square inch (PSI).
~I High tensile barbed wire has a tensile strength of 135,000 PSI.

A-4
fencing, not fitted with fittings, not made up into articles, and not covered with nonmetallic material. The column 1 rate of duty under TSUS item 642.11 is 5.9 percent ad valorem, the column 2 rate of duty for products of Communist countries (enumerated in general headnote 3(f)) is 35 percent ad valorem, and the least developed developing country rate of duty is 4.9 percent ad valorem. The column 1 rate of duty under TSUS item 642.11 is scheduled for staged reductions through 1987, when it will reach the final rate of 4.9 percent ad valorem. Imports under item 642.11 are not eligible for benefits under the Generalized System of Preferences, but products of designated beneficiary countries may be entered free of duty under the Caribbean Basin Initiative.
U.S. Producers
In 1983, 11 firms produced barbed wire and/or barbless wire strand in 12 plants in the United States. The names of the U.S. producers, the locations of their production facilities, and their production in 1983 are shown in the following tabulation (in short tons): l/
Firm and plant location Production in 1983
Armco, Inc. J:./ Middletown, OH-----------------------
Atlantic Steel Co. it Atlanta, GA1--------------------------
Bekaert Steel and Wire Co. Van Buren, AR·------------------------
CF&I Steel Corp. 11 Pueblo, Cn---------------------------
Continental Steel Corp. ~/ Kokomo, IN1----------------------------
0avis Walker Corp. 11 Los Angeles, CA1----------------------
Forbes Steel & Wire Corp. 11 Canonsburg, PA, and Wilmington, OE-------------------
Keystone Consolidated Ind. Inc. Peoria, IL ~/-------------------
Nagle Wire Corp. of Colorado Rocky Ford, CO--------------------·
Northwestern Steel & Wire Co. Sterling, IL ~/--------------------~
Oklahoma Steel Wire Co., Inc. !/ Madill, OK-------------------------
Total-------------------------------
*** *** *** *** *** ***
***
***
***
***
*** 70,151
11 Ceased production of barbed wire and barbless wire strand in May 1983. ~/ Ceased production of barbed wire and barb1ess wire strand in July 1984. 11 In support of the petition. ii Data obtained by questionnaire in investigation No. TA-201-51.
!/ Unless otherwise noted, the term "ton" refers to a short ton (2,000 pounds).

A-S
U.S. Importers
Data were obtained by the Commission from six firms that imported barbed wire and barbless wire strand. One of these firms imported the subject merchandise from Argentina, three firms imported from Brazil, and two firms imported from Poland. In 1983, the responding firms accounted for about *** percent of U.S. imports of barbed wire and barbless wire strand from Argentina, *** percent of imports from Brazil, and *** percent of imports from Poland.
The U.S. Market
Channels of distribution
· Both U.S. manufacturers and importers sell most of their barbed wire and barbless wire strand to wholesalers/distributors, as shown in the following tabulation (data are for 1983):
Percent of total sales by--Channel of distribution Producers
Wholesalers/distributors------------Farm cooperatives-------------------Other !/--------------~------------
Tota 1----------------------------
64 31 s
100
Importers
70 6
24 100
!/ Includes sales to lumber chain stores, farm supply stores (other than cooperatives), and the Federal Government.
Apparent consumption
. Apparent U.S. consumption of barbed wire and barbless wire strand declined from 135,000 tons in 1981 to 86,000 tons in 1982, or by 36 percent. ll Consumption increased in 1983 to an estimated 130,000 tons, up Sl percent from consumption in 1982 but 4 percent below consumption in 1981. Estimated consumption in January-September 1984 was 71,000 tons, 34 percent below the estimated consumption of 108,000 tons in January-September 1983 (table 1). According to industry sources, factors contributing to the substantial decline in consumption since 1981 include the general economic recession in 1982 and greatly reduced activity in the oil and gas industries in the Gulf States. About 7S percent of the barbed wire produced each year is consumed in the region of the United States between the Mississippi River and the Rocky:· Mountains. 2/
li During the period for which the Comi~ission requested data, barbed wire accounted for about 98 percent of U.S. production and imports of barbed wire and barbless wire strand. Because of the low volume of barbless wire strand produced, most firms could not provide separate data for their operations on this product. ll Summary of Trade and Tariff Information on certain metal products, USITC
publication 841, May 1983, p. 14.

A-6
Table 1. --Barbed wire and barb less wire strand: U.S. producers• shipments, imports for consumption, exports of domestic merchandise, and apparent consumption, 1981-83, January-September 1983, and January-September 1984
Ratio to Apparent consumption
Period Imports :Exports: con- Pro-
Producers'
shipments sumption ducers' : Imports
:shipments: Tons --Percent--·
1981----··· .. -·-: 1982-·-~~~~-
110, 539 71,024
·~---:1/ 102,518 1983 January-
September-1983-------: 11 85,233 1984------: l/ 48,435
27,258 2,552 18,465 3,399 29,272 1,599
24,135 1,322 23,847 1,086
135,245 79.8 86,090 78.6
=l/ 130, 191 l/ 77.5
:.!/ 108,046 .!/ 77.7 :11 71, 196 l/ 66.5
l/ Estimated by the staff of the U.S. International Trade Commission.
Source: Compiled from offi.cial statistics of the U.S. Department of Commerce, except as noted.
Consideration of Alleged Material Injury to an Industry in the United States
U.S. production, capacity, and capacity utilization
20.2 21. 4
l/ 22.5
.!/ 22.3 l/ 33.5
U.S. production of barbed wire and barb less wire strand declined overall between 1981 and 1983, and that trend continued through January-October 1984. U.S. production declined from 85,065 tons in 1981 to 62,972 tons in 1982, or by· 26 percent. Production increased by 11 percent in 1983 to 70, 150 tons, but it was still 18 percent below production in 1981. Data submitted by responding firms show a decline in production of 37 percent in January-October 1984, compared with production in January-October 1983 (table 2). The closing of the Armco plant in May 1983 and the cessation of production by Atlantic in July 1984 contributed significantly to the decline in production reported for January-October 1984, but each of the other producers for which data are available also produced less in January-October 1984 than in the corresponding period of 1983.
Production capacity is not available for Armco, but total capacity ·of the other producers increased annually from 112,932 tons in 1981 to 121,858 tons in 1983, an increase of 8 percent. Firms that supplied data for JanuaryOctober 1984 reported an increase in capacity of 9 percent from their capacity in January-October 1983. * * *· l/
l/ * * *

Table z.-Barbed ~ire and barbless wire strand: U.S. production, production capacity, and capacity utilization, by firms, 19Bl-g3, JanLlary-October 1963, and January-October 19S4
January-October-··-Firm 1981 1982 1983
Production (tons)
Armco 11-···--·---... ~)(~ ~)(;: ~KM ~~K *·** Atlantic 2/~·-----~--· -: ::K;;: ::K~ ::K)( ::i<K ;;:K~
Bekaert--··--~-----· --· ----~------·-· : ::K~ ::K:: ::K* ~** *·** CF&I-.. --~·······--- · ::K:: ;;:)(;: ~MM ;:)(M ::M:: Continental-·----·---·------ ::M~ ;;:M;;: ~KM ;;:~M *** Oa v i s L•.!a lk er----·---·------- :: ><:: :: ><:: :: >< * :: :< >< :: M::
Forbes - ··~---------~ ~><:: ::M:: ~MM ~*M *** Keystone-·--~--------~ ::M~ ::M:: ~KM ::KM ~ic:
Nag le--- ::M:: ~M:: ;;:)(~ ~MM ·ii:**
Northwestern ::M:: ::M:: ~MM ::MK ~M::
Oklahoma Steel-··-----· -··---·---; ~M:: ~)(~ ;;:)(~ ~MM ::M~ ~-------'-~----~~------'----~---'---~
Total-~-·--------- ~5.06~ 52,97z 70,150 37,048 23;339
Armco JJ--------~-Atlantic ?J---Bekaer7-CF&l-----Continental Davis W~lker Forbes Keys tone--·-·-···--------Nag k·--- ·--~-~----~ Northwesterri·-------Ok lahoma Stee 1 -
Total-----
~)(~
~)(~
~)(;;:
)(K::
~)(;;:
~)(;;:
;: )(;:
112,932
See footnotes at end of table.
Capacity (tons)
:: )(:: ~)(;;:
;:)(~
:: )(:: ;;:)(;;:
:: )(:: ~)(~
:: )(:: ~)(~
:: )(:: :-: )(::
:: I( ii
~)(~
:: )(~ :: )( ::
~)(~
;;:)(~
121,858
:: )( )( ::'.if)(
:: )( )( ~)()(
:: '.i( It . ;:)()(
~!( )(
;;: )()(
::KM
~)()(
;;: j()(
62.,349
~)(~
~)(;;:
·it-** ~)(;::
·it-M*
~)(~
*** ~)(;::
*** ~)(X
58,185

A-8
Table 2.--Barbed' wire and barbless wire strand: U.S. production, production, capacity, and capacity utilization, by firms, 1981-83; Ja".'uary-October 1983, and January-October 1984--Continued
Firm
Armco .!/ Atlantic '/;./ Bekaert-------CF&I-------------Continental----------Oavis Walker Forbes---------------Keystone---·---------Nagle Northwestern-----------~
Oklahoma Steel----· Average ii----------
1981
*** *** *** *** *** *** *** *** *** *** *** 56.9
1/ Ceased operations in May 1983.
1982
Capacity
*** *** *** *** *** *** *** *** *** *** *** 41.0
~/ Atlantic ceased production in July 1984. !/ Not available. ~I Excludes Armco.
January-Octobe~ 1983
.1983 1984
utilization (percent)
*** *** '*** *** *** *** *** *** *** *** *** *** *** *** *** *** *** *** *** *** *** *** *** *** *** *** *** ***" *** *** *** *** *** 52.9 50.3 34.2
Source: Compiled from data submitted in response to questionnaires of the U.S. International Trade Commission.
Capacity utilization by the producers of barbed wire and barbless wire strand measured 57 percent in 1981 and then fell to 41 percent in 1982 and 53 percent in 1983. Capacity utilization by each of the responding producers was lower in January-October 1984 than in January-October 1983.
U.S. producers• shipments
Domestic shipments of barbed wire.and barbless wire strand by U.S. producers declined irregularly during 1981-83 and, although complete data are not available for January-October 1983 and January-October 1984, all firms that supplied data reported substantially lower sales in the 1984 period than in the 1983 period. Shipments by the responding U.S. producers declined from 85,204 tons in 1981 to 67,902 tons in 1982, or by 20 percent. Shipments in 1983 increased by about 3 percent to 69,639 tons, but they r~mained 18 percent below shipments in 1981. The incomplete partial year data show a 35-percent decline in shipments in January-October 1984 from shipments in JanuaryOctober 1983, although some of the decline can be attributed to the closing of the Armco plant in May 1983 and the halting of production by Atlantic in July 1984 (table 3).

A-9
Table 3.-Barbed wire and barbless wire strand: Domestic shipments by U.S. producers, by firms, 1981-83, January-October 1983, and January-October 1984
January-October-Firm 1981 1982 1983
1983 1984
Quantity (tons)
Armco .!/-·---- *** *** *** *** *** Atlantic ~/----·------ *** *** *** *** *** Bekaert *** *** *** *** *** CF&I---·------- *** *** *** *** *** Continental----------- *** *** *** *** *** Davis Walker---------- *** *** *** *** *** Forbes *** *** *** *** *** Keystone *** *** *** *** ***
. Nagle--·----------- *** *** *** *** *** Northwestern1--------~ *** *** *** *** *** Oklahoma Steel--·--- *** ---: *** *** *** ***
T,otal--·--·-----·--- ----"'-'-'~-'--"----....~-=---..;.-_;;..;;;..,.__..;;..;;;......;.,._;;..;;...~~-'----=2:...;4'"',-=6-=9_,_7 85,204 67,902 69,639 37,925
Value ( l, 000 dollars)
*** *** *** *** *** *** *** *** *** *** *** *** *** *** *** *** *** *** *** *** *** *** *** *** *** *** *** *** *** *** *** *** *** *** *** *** *** *** *** *** *** *** *** ***
58,920 47,305 48,567 27,212
See footnotes at end of table.

A-10
Table 3.~Barbed wire and barbless wire strand: Domestic shipm~nts by U.S. producers, by firms, 1981-83, January-October 1983, and January.-October 1984--Continued
January-October~
Firm 1981 1982 1983 1983 1984
Unit value (per ton)
Armco .!/ *** *** *** *** *** Atlantic '!:_/ *** *** *** *** *** Bekaert *** *** *** *** *** CF&J: *** *** *** *** *** Continental *** *** *** *** ·>Hf*
Davis Walker--· *** *** *** *** *** Forbes *** *** *** *** : *** ' Keystone---· *** *** *** *** *** Nagle *** *** *** *** *** Northwestern *** *** *** *** *** Oklahoma Steel -·--: *** *** *** *** ***
Average 692 697 . 699 718 724
1/ Armco ceased barbed wire production in May 1983. 1,1 Atlantic ceased production in July 1984. ~I Not available.
Source: Compiled from data submitted in response to questionnaires of the U.S. International Trade Commission.
U.S. exports
U.S. exports of barbed wire and barbless wire strand, which are not reported separately in official statistics by the U.S. Department of Commerce, declined irregularly from 2,552 tons in 1981 to 1,599 tons in 1983, or by 37 percent. Exports continued to decline in January-September 1984, dropping 18 percent from exports in January-September 1983. Exports represented an annual average of less than 5 percent of U.S. producers' shipments during the 1981-83 period. Principal markets for U.S. exports during the period included Saudi Arabia, the United Kingdom, and Singapore (table 4).

A-11
Table 4.-Barbed wire and barbless wire strand: U.S. exports 1/ of domestic merchandise, by principal markets, 1981-83, January-September 1983, and January-September 1984
Jan.-Sept.-Market 1981 1982 1983
1983 1984
Quantity (tons)
Saudi Arabia 194 751 348 283 272 United Kingdo 122 104 417 389 128 Singapore·---.. 630 480 102 89 184 Republic of South Africa--: 224 65 53 40 13 Australia- 4 27 13 2 10 Cayman Islands 89 113 103 86 28 West Germany 93 83 70 46 29 Canada · 352 111 87 83 94 Mexico 249 202 57 53 46 All others 592 1,463 349 251 282
Total-·- 2,552 3,399 1,599 11322 11086
Value (1, 000 dollars)
Saudi Arabia 292 617 2,095 1,582 654 United Kingdom----- .. 577 290 1,154 1,047 155 Singapore-·- 3,376 3,018 610 582 641 Republic of South Africa--: 956 248 244 188 67 Australia· 32 105 166 36 85 Cayman Islands 55 114 88 70 22 West Germany 128 95 86 58 36 canada 275 132 86 82 51 Mexico 287 167 49 45 23 All others 1,829 2,395 715 529 1,444
Total 7,807 7,181 5 1 293 41219 3,257
Unit value (per ton)
Saudi Arabia $1,509 $821 $6,022 $5,595 $2,554-United Kingdo 4,738 2,791 2,765 2,694 1,203 Singapore 5, 361 6,289 5,997 6,528 3,477 Republic of South Africa--: 4,274 3,812 4,586 4,662 5,133 Australia 8,345 3,937 12,444 15,414 8,561 Cayman Islands 617 1,013 855 810 802 West Germany 1,379 1,155 1,228 1,266 1,227 Canada 781 1,191 984 990 961 Mexico 1,150 '824 850 842 497 All others 3,068 1,636 2,055 2, 116 5,130
Average 3,059 2, 112 3,309 3,192 2,997
1/ Schedule B No. 642.0300.
Source: Compiled from official statistics of the U.S. Department of Commerce.

A-12
U.S. producers' inventories
U.S. producers' yearend inventories of barbed wire and barbless wire strand declined by one-third from 9,676 tons in 1981 to 6,500 tons in 1982. Inventories then increased in 1983 to 8,879 tons, up 37 percent from those in 1982 but 8 percent lower than the yearend 1981 inventory level. Firms that supplied partial-year data reported a decline of 21 percent in inventories from October 31, 1983, to October 31, 1984 (table 5). As a share of their shipments, producers' yearend inventories averaged 11.4 percent in 1981, 9.6 percent in 1982, and 12.8 percent in 1983.
Table 5.--Barbed wire and barbless wire strand: U.S. producers' inventories of domestically produced merchandise, by firms, as of December 31, 1981~83, and October 31, 1983-84
Firm
Armco !/----·---Atlantic 2/---·----Bekaert CF&I--·----------Continental-----
{In tons)
December 31--
1981 1982
*** *** *** *** *** *** *** *** *** *** *** *** *** *** *** *** *** *** *** *** *** ***
October 31-.
1983 1983 1984
*** *** *** *** *** *** *** *** *** *** *** *** *** *** *** *** *** *** *** *** ***" *** *** *** *** *** *** *** *** *** *** *** ***
Davis Walker Forbes-------------Key stone---------------Nagle---------------Northwestern--------Oklahoma Steel-------
-----------'~---__;.------...;...----------"---------- Total------------- 9,676 6,500
11 Armco ceased production in May 1983. £/ Atlantic ceased production in july 1984. 11 Not available.
8,879 2,957 2,344
Source: Compiled from data submitted in response to questionnaires of the U.S. International Trade Commission ..
Employment and wages
Data on employment and wages were obtained from six of the U.S. producers of barbed wire and barbless wire strand. The number of production workers employed at the reporting establishments dropped annually from 151 in 1981 to 119 in 1983, a decline of 32 employees or 21 percent. Employment continued to
A-13
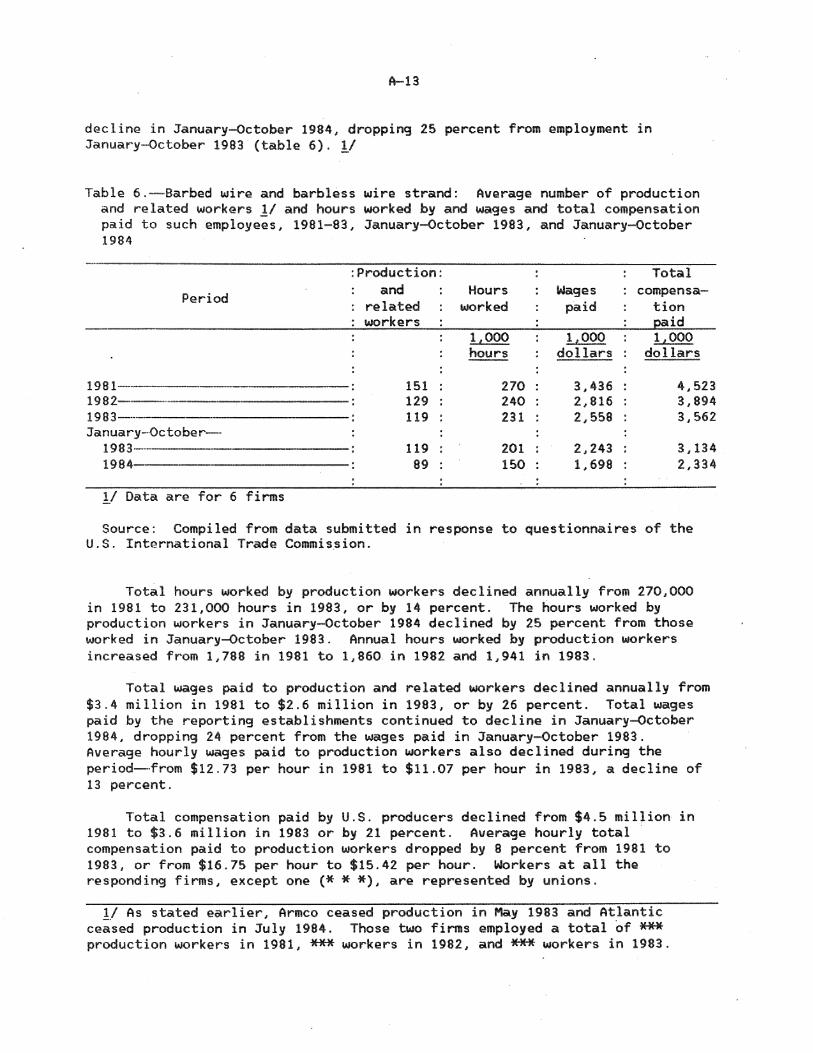
decline in January-October 1984, droppi"9 25 percent from employment in January-October 1983 (table 6). !/
Table 6.-Barbed wire and barbless wire strand: Average number of production and related workers 11 and hours worked by and wages and total compensation paid to such employees, 1981-83, January-October 1983, and January-October 1984
Period
1981 19 8 2----...... 1983·-····-·-------------January-·October-1983-·----·--------1984
!/ Data are for 6 firms
:Production: and
related workers
151 129 119
119 89
Hours worked
1,000 hours
270 240 231
201 150
Total Wages compensa-
paid ti on paid
1,000 1,000 dollars dollars
3,436 4,523 2,816 3,894 2,558 3, 562
2,243 3,134 1,698 2,334
Source: Compiled from data submitted in response to questionnaires of the U.S. International Trade Commis.sion.
Total hours worked by production workers declined annually from 270,000 in 1981 to 231,000 hours in 1983, or by 14 percent. The hours worked by production workers in January-October 1984 declined by 25 percent from those worked in J~nuary-October 1983. Annual hours worked by production workers increased from 1,788 in 1981 to 1,860 in 1982 and 1,941 in 1983.
Total wages paid to production and related workers declined annually from $3.4 million in 1981 to $2.6 million in 1983, or by 26 percent. Total wages paid by the reporting establishments continued to decline in January-October 1984, dropping 24 percent from the wages paid in January-October 1983. Average hourly wages paid to production workers also declined duri"9 the period-·from $12. 73 per hour in 1981 to $11.07 per hour in 1983, a decline of 13 percent.
Total compensation paid by U.S. producers declined from $4.5 million in 1981 to $3.6 million in 1983 or by 21 percent. Average hourly total · compensation paid to production workers dropped by 8 percent from 1981 to 1983, or from $16.75 per hour to $15.42 per hour. Workers at all the respondi"9 firms, except one (* * *), are represented by unions.
!/ As stated earlier, Armco ceased production in May 1983 and Atlantic ceased production in July 1984. Those two firms employed a total of *** production workers in 1981, ***workers in 1982, and*** workers in 1983.

A-14
Financial experience of U.S. ·producers
Four firms, accounting for*** percent of reported U.S. production of barbed wire in 1983, furnished usable income-and-loss data concerning both their overall establishment operations and their operations on barbed wire alone. 1:.1
Overall establishment operations.--Net sales of all products produced in the establishments within which barbed wire is produced declined annually from ***to***, or by*** percent, during 1981-83 (table 7). Such sales rose*** percent to *** during the interim period that ended on October 31, 1984, compared with net sales of*** in the corresponding period of 1983. The four reporting firms earned an operating income of ***, or *** percent of net sales, in 1981 but then sustained operating losses of ***, or *** percent of net· sales, and ***, or *** percent of net sales, in 1982 and 1983, respectively. The four firms earned an operating income of***, or*** percent of net sales, during the interim period that ended October 31, 1984, compared with an operating loss of ***, or *** percent of net sales, for the corresponding period of 1983.
Barbed wire.--Net sales of barbed wire declined annually from*** to ***, or by*** percent, during 1981-83 (table 8). Net sales of barbed wire continued to decline during interim 1984, dropping to ***, compared with net sales of *** in the corresponding period of 1983. The four firms sustained &ggregate operating losses and net losses in each of the reporting periods. During 1981-83, the operating losses ranged from ***, or *** percent of net sales, in 1981 to ***, or *** percent of net sales, in 1982. The four firms sustained an aggregate operating loss of ***, or *** percent of net sales, during the interim period of 1984, compared with an operating loss of ***, or ***percent of net sales, for the corresponding period of 1983. Three firms sustained operating and net losses in 1981 and 1983, and two firms sustained such losses in 1982 and 1984. ll
The income-and-loss experience of U.S. producers, stated in terms of average per ton selling prices, production costs, and general, selling, and administrative (GSA) expenses, is shown in the following tabulation (in dollars per ton):
Average Average Average Average Period
1981 1982 1983 Interim 1983 Interim 1984
1/ * * * ll * * *
selling price
*** *** *** *** ***
cost to GSA operating produce expenses loss
*** *** *** *** *** *** *** *** *** *** *** *** *** *** ***

~- 15
Item 1981 1982 198~
Interim period ended October ~1-
Net sales .. ···--·--1, 000 dollars~: JOE~ M~~ -~-~;; ~~)(
Cost of goods sol~ ~~: MK~ )(~~ ~~~ ~~)( ~KM ---~-..;._--~~_.:., _____ ..:._ ____ _;_ ____ __
Gross income or (loss)~~fo-; KK~ K~~ """ ~~K *·** General, selling, and admin- ;
istrative expenses 1,000 dollars-:
Operating income or (loss) 1, 000 dollars-;
Other income (or expense),
_____ ..;._ ____ _.:., _____ ..:._ ____ _,.;... ____ _
net--· ·---····~ 1, 000 dollars-; -~--K_K_~........:.. ____ K_·~-~-.:..----~-~_'.:__:. ____ ~_~_><_,.;... ____ ~~-*-*-Net income or (loss)
before income taxes--·do--· -·····; Depreciation and
amortization~~·-····----do----: ------"---------'-----~..._-----'---~--Cash flow from operations
1,000 dollars-; Ratio to net sales:
Gross income or (loss) percent-:
Operating income or (loss)· ~ ..
ruet income or (loss) before income taxes
Cost of goods solcl--=~o~: General, selling, ancl
administrative expenses percent-;
Number of firms reporting·Operating losse~·~----fiiet losses
1/ Interim data are for 3 firms.
KM~
KM~
K~~
)(~~
~~)(
~~K
2 1
***
~MK
~MK
1. 1
Source: Compiled from data submitted :;.n res~nnse to questiormaires of the U.S. International Trade Commission.

A=:i.6
Tabk 8.-·· Incame=and-kss ex~erier.ce of 4 lLS, firm~ Ofi their o~eratkns producirig barbed wire, 19~1=83, interim 19~3, and ifit~rim 1984 !/
It~m
Net sahs: Value,--- 1,000 dollars-: Quantity short tofis-'-:
Cost of goods sold
1981
K~M
K~*
IE~;:
IE~ii
Interim ~eriod ended Octob"'r ~1-
1983 1984
~IO(
~ j( )(
)(;~)(
)(;:;;)(
1, 000 dollars-: K~IE K~a i«IE~ ~MK >i~IE -~~----'--~~--.:.-~~~-~-~-~.......:..-----Gross income or (loss )-~O--··-m: K~IE M~~ i()(~ **IE- K~)(
General, s~lling, and administrative-ex~enses
i()t~ ~)()( 1,000 dollars-: K~K )(~;! ~----""--~--_,;,~ _ __....__..:....~~--.......:..-----
0 per at in g luso: do-m -: )!;;:;;)( IE~;! l(l(i;; ~)()(
Other incom~ or : )()(~ ~IEK (e~pense) net de~:
--~--"'-------'------.;.....----.....:..---~~ Net loss befor~ income ta~~s do--: 1(1(~ ~KK
Depr~ciatian and amorti-MIE~ ~IEK zation e~pense do----:
--~---'-~-~~-'--~-~~...:;._-~--.......:..-----Cash flow from operations--~--~dc--:
Ratio to net sales: Gross income or (loss)
percent-: Operating kss----do-----: r.iet loss befor~
income ta~es do----: Cost of goods sold -do--····: General, selling, and
administrative exp~nses percent-:
Number of firms reporting~ Operating losses~-~~~f~et loss--;::;~~------
1.1 * * *·
M~IE
~~)(
3 3
)(~;!
I(;;~
)(~:(
*~~
2
1(1(~
i(J(~
i()(~
:l(J(~
)()(~
)()(~
3 3
~MK
~MIE
~IEK
~MK
~KK
~)()!:
3 3
M~)(
;~~)(
)i~M
)i~)(
2 2
Source: Compil~ci from data submitted in response tn ~uestionnaires of the U.S. International Trade Commission,

A-17
Capital expenditures.--Capital expenditures of four firms for machinery, equipment, and fixtures used in the production of barbed wire are shown in table 9. Such expenditures rose from*** in 1981 to *** in 1982, fell to *** in 1983, and then rose again to *** during interim 1984.
Table 9.-U.S. producers' capital expenditures and fixed assets employed in their establishments within which barbed wire is produced, 1981-83, January-October 1983, and January-October 1984 11
(In thousands of dollars)
Item 1981 1982 1983
:Interim period ending October 31-
Capital expenditures···All products of the
establishments: Land and land improve-:
ments-·-Bui lding or lease
hold improvements-: Machinery, equipment,
and fixtures-· Total
Barbed wire: Land and land improve-:
men ts Building or leasehold
improvements Machinery, equipment,
and fixtures··· Total---·-·,---
Fixed assets ZI employed in the production of-
A 11 products of the establishments:
Original cost---Book value-----
Barbed wire: Original cost---Book value,------
***
***
*** ***
***
***
*** ***
*** *** ..
*** ***:
***
***
*** ***
***
***
***
***
*** ***
***
***
***
***
*** ***
***
***
*** ***
***
*** *** ***
1983 1984
***
*** ***
***
***
*** ***
*** ***
*** ***
***
*** *** ***
*** *** *** ***
*** ***
*** ***
11 The capital expenditure data are for 4 firms and the fixed asset data are for 2 firms.
~I As of the end of the period.
Source: Compiled from data submitted in response to questionnaires of the U.S. International Trade Commission.

A-18
Investment in productive facilities.-Two firms .. supplied data concerning their investment in facilities used to produce barbed wire. As shown in table 9, their aggregate investment in such facilities, valued at cost, rose annually from*** at yearend 1981 to*** as.of October.31, 1984. The book value of such facilities followed the same trend, rising from *** to *** during the reporting period.
Capital and investment.-U.S. producers were asked to describe any actual or potential negative effects of imports of barbed wire and barbless wire strand from Argentina, Brazil, and Poland on their firm's growth, investment, and ability to raise capital. Excerpts from their replies are shown below:
Atlantic: "* * *·"
Bekaert: "* * *·"
CF&I: "* * *.II
Forbes: 11* * *. 11
Consideration of Alleged Threat of Material Injury to an Industry in the United States
In its examination of the question of the threat of material injury to an industry in the United States, the Commission may take into consideration such factors as the rate of increase in alleged LTFV imports, the rate of increase in U.S. market penetration by such imports, the amounts of imports held in inventory in the United States, and the capacity of producers in the countries subject to the investigations to generate exports (including the availability of export markets other than the United States). A discus·sion of the rates of increase in imports of barbed wire and barbless wire strand and of the U.S. market penetration of such imports is presented in the section of this report ent~tled "Consideration of the Causal Relationship Between Alleged Material Injury or the Threat Thereof and Alleged LTFV Imports." Discussions of the available information concerning importers' inventories of such merchandise and the capacity of producers in Argentina, Brazil, and Poland to generate exports follow.
U.S. importers' inventories
Only one of the responding importers maintained inventories of barbed wire and barbless wire strand. * * *·
Foreign producers and their capacity to generate exports
The Commission requested the U.S. Department of State to obtain from Argentina, Brazil, and Poland data on production, exports, and capacity to produce the barbed wire and barbless wire strand that is the subject of these investigations. !/ No data have yet been received pertaining to operations in
!/ Similar requests were made of counsel for the foreign producers.

A-19
Poland. The following information was obtained on operations in ~rgentina and Brazil.
Argentina.-Argentina's !/ production of barbed wire and barbless wire strand more than doubled from *** tons in 1981 to *** tons in 1983. As shown in table 10, Argentina operated at less than *** percent of its capacity throughout the period. Shipments for the domestic market accounted for the great bulk of Argentina's output during 1981 and 1982, bu.t in 1983 about *** percent of its production was exported. Exports to the United States, by far the largest export market for Argentina's output of barbed wire and
Table 10.-Barbed wire and barbless wire strand: Argentina;s production, capacity, capacity utilization, domestic shipments, and exports, 1981-83, Japuary-October 1983, and January-October 1984
January-October-Item 1981 1982 1983 ..
1983 1984
Production- short tons-: *** *** *** 11 11 Capacity-· do-·-·: *** *** *** *** *** Capacity utilization
percent--: *** *** *** !/ !/ Domestic shipments
short tons-: *** *** *** !/ !/ Exports to--
United States do--: *** *** *** *** *** All other countries-~o-: *** *** *** *** ***
Total do--: *** *** *** *** *** Ratio to produ.ction: :
Domestic shipments percent-: *** *** *** 11 11
Total exports do--: *** *** *** !/ !/ Ratio of exports to the
United States to total exports percent-: *** *** *** *** ***
11 Not available.
Source: Compiled from data obtained by the U.S. Department of State.
!/ The data in this section are for only one producer in Argentina-Acindar Industria Argentina (Acindar). The U.S. Embassy in Buenos .Aires reported that "Acindar was the sole exporter of these products.for the period reported, and almost the sole domestic supplier. - Therefore, the figures reported can safely be taken as totals for Argentina."

A-20
barbless wire strand, declined ··from *** tons in 1981 to *** tons in 1982 but then jumped to*** tons in 1983. !/ Exports to the United States in January-October were about *** percent less than those in the corresponding period of 1983.
The Department of State reported that Argentina's production of barbed· wire and barbless wire strand in 1985 is projected at*** tons. Other projections for that year are: domestic shipments-*** tons; tatal exports-*** tons; and exports to the United States~*** tons. No new capacity is projected to come on stream by that time.
Brazil.~The Department of State reported that nine companies manufacture barbed wire and barbless wire strand in Brazil. They are:
Companhia Siderurgica Belgo-Mineira; Companhia Siderurgica Pains; Siderurgica Riograndense, S.A. (Grupo Gerdau); Siderurgica Aconorte, S.A. (Grupo Gerdau); Companhia Siderurgica da Guanabara (Cosigua) (Grupo Gerdau); Siderurgica Mendes Junior, S.A. (recently began production); Siderurgica Barra Mansa, S.A.; Siderurgica FI-EL, S.A.; and Siderurgica Nossa Senhora de Aparecida, S .. A.
Production and capacity data on barbed wire and barbless wire strand operations in Brazil were not available for all o.f the producers. Brazil'~ aggregate exports of such merchandise from 1981 to 1984 were as follows (in short tons): 1:_/
Exports to--
United States Al 1 other countries--Tota1---------
!/ Estimated.
1981
1,321 1,898 3,219
1982
2,367 _fil 3,045
1983
5, 109 --1ll 6,0.38
1984 !/
6,358 2,181 . 8,539
The U.S. Embassy in Rio de Janeiro reports that the entire Brazilian iron and steel industry will remain export oriented. The degree of emphasis on export promotion will depend upon the rate of growth of the domestic market.
Companhia Siderurgica Belgo-Mineira and the Grupo Gerdau accounted for virtually all of the exports to the United States, according to counsel for Grupo Gerdau. Combined data for the two firms are presented in the following tabulation:
11 In comparison, Acindar's reported exports to the United States during 1973-80 ranged from *** tons in 1975 to *** tons in 1973; they averaged *** tons per year during that period.
£/ Compiled from data obtained by the U.S. Department of State.

A-21
January-October-Item 1981 1982 1983
1983
Production short tons-: *** *** *** *** Capacity do-: !/ *** *** *** Capacity utilization
percent-: !/ *** *** *** Exports to the United
States---·--short tons-: *** *** *** *** 1/ Not available.
Consideration of the Causal Relationship Between Alleged Material Injury or the Threat Thereof and Alleged LTFV Imports
U.S. imports
1984
*** *** *** ***
In the aggregate, U.S. imports of barbed wire and barbless wire strand increased irregularly from 27 ,·258 tons in 1981 to 29, 27.2 tons in 1983, or by 7 percent (table 11). Imports declined to 23,847 tons, or by 1 percent, in January-September 1984 from the 24,135 tons entered in January-September 1983. ~arbed wire accounted.for more than 98 percent of the total imports during the period for which the Commission.requested data in these investigations.
Barbed wire.-U.S. imports of barbed wire declined from 1981 to 1982, increased in 1983, and declined in January-September 1984. Such imports dropped from 26,941 tons in 1981 to 18,165 tons in 1982, or by 33 percent, before increasing in 1983 to 28,927 tons, 7 percent above the level of imports in 1981. During January-September 1984, imports were down 2 percent from those in January-September 1983 (table 12). On the basis of quantity, the share of total imports of barbed wire supplied by Argentina increased from 3.1 percent in 1981 to 13.0 percent in 1983; imports from Brazil increased from 2.4 percent of total imports in 1981 to 16.9 percent in 1983; and imports from Poland declined from 17.0 percent of total imports in 1981 to 16.1 percent of the total in 1983. !/
Barbless wire strand.-U.S. imports of barbless wire strand declined from 317 tons in 1981 to 300 tons in 1982, and then increased in 1983 to 345 tons, or by 9 percent from imports in 1981. Imports continued to increase during January-September 1984, reaching 459 tons, more than twice the volume of imports in January-September 1983 (table 13). There were no imports of
!/ In 1983, 27 percent of the barbed wire imported from Argentina entered the United States through the port of New·orleans, 42 percent and 27 percent of the imports from Brazil entered through the ports of New Orleans and Houston, respectively, and 48 percent of the imports from Poland e"ntered through the port of Houston.

A-22
Table 11.-Barbed wire and barbless wire strand: U.S. imports for consumption, by types and by specified sources, 1981-83, January-September 1983, and January-September 1984
(In tons)
Jan. -Sept. --Type and source 1981 1982 1983
1983 1984
Barbed wire: Argentina---- 837 506 3, 771 3,294 3,338 Brazil 643 2,544 4,883 4,305 5,616 Po land--·-···-- 4,590 1,009 4,653 3,335 3,138
Subtotal-- 6,070 4,059 13,307 10,934 12,092 Al 1 others--- 20,871 14,106 15,620 12,994 11, 296
Total 26,941 18,165 28,927 23,928 23,388 Barbless wire strand:
Argentina 0 0 43 43 51 Brazi 1----· 0 114 21 21 86 Poland 0 11 11 11 0
Subtotal-···· .. ··· .. 0 125 75 75 137 A 11 others---- 317 175 270 132 322
Total 317 300 345 207 459 Total:
Argentina 837 506 3,814 3,337 3,389 Brazil 643 2,658 4,904 4,326 5,702 Poland 4,590 1,020 4,664 3,346 3,138
Subtotal 6,070 4, 184 13 I 382 11,009 12,229 All others 21,188 14,281 15,890 13,126 11, 618
Total 27,258 18,465 29,272 24,135 23,847
Source: Compiled from official statistics of the U.S. Department of Commerce.

A-23
Table 12.-Barbed wire: U.s: imports for consumption, by principal sources, 1981-83, January-September 1983, and January-September 1984
Jan.-Sept.-Source 1981 1982 1983
1983 1984
Quantity (tons)
Mexico·----------- 1, 721 2,227 4,976 4,357 2,407 Brazil---·-------- 643 2,544 4,883 4,305 5,616 Poland 4,590 1,009 4,653 3,335 3,138 Republic of Korea------- 9,329 6,316 4,541 3,633 4,869 Bel<lium- 8,248 3,823 4,210 3,350 3,224 Argentina--·-·-- 837 506 3,771 3,294 3,338 A 11 other---·------- __ _,1 ..... ,.._.5 .... 7...-3_....__.1 ...... ...._7_,4 ..... 0_...._-'l"-',""'8 __ 9=2--'---'l'"',--6 ..... 5~5_.;... __ _.;...7.;;..;...97
Total---------- ---=2~6~•-9...;;4~1_;,_~1~8~,~16~5;.......:. __ 2~8~, ..... 9~2~7-=---=2~3~,-9~28::.......:---=23~,.._.3_8=8
Value (1,000 dollars)
Mexico----------- 947 1,049 2,027 1,783 1,044 Brazil 268 1,173 2,023 1,803 2,215 Poland---------- 2,213 441 1,645 1,194 1,053 Republic of Korea----- 4,441 2,859 1,906 1,538 1,862 Belgium------------ 5,889 2,495 2,770 2,200 2,042 Argentina--------- 566 294 1,445 1,266 1,321 A 11 other----- 895 905 985 860 406
Total---------- ---=1=5~·=2=19::.......:---9~,2=1~6;_,.;,_~12 ...... .._.8_0_2--'---=1=0~,-6~43::.......: ___ 9~, ..... 9~4;.;;;;.2
Unit value (per ton)
Mexico- $550 $471 $407 $409 $434 Brazil----------- 417 461 414 419 394 Poland 482 437 353 358 335 Republic of Korea,----- 476 453 420 423 382 Belgiu 714 653 658 657 633 Argentina--------- 676 581 383 385 396 All other·--------- 569 520 521 519 510 __ _.....;;...;;..;;.._.;.. _ _.....;~_.;..----=""'-~-----~--'-----------
Aver age---------- 565 507 443 445 425
Source: Compiled from official statistics of the U.S. Department of Commerce.

A-24
Table 13.-Barbless wire strand: U.S. imports for consumption, by principal sources, 1981-83, January-September 1983, and January~September 1984
Jan.-Sept.-Source 1981 1982 1983
1983 1984
Quantity (tons)·
Mexico 6 38 139 108 160 Argentina 0 0 43 43 51 Republic of Korea 260 137 36 22 53 Brazil 0 114 21 ··21 86. Pol~nd--- 0 11 11 11 O·· All other- 52 1 95 2 109
Total 317 300 345 207 . 459
Value ( 1, 000 dollars)
Mexico-- 2 21 62 so 67 Argentina 17 17 118 Republic of Korea 127 68 15 9 10. Brazil 46 8 8 31 Poland 4 4 : 4 All other 26 3 51 .. 1 77.
Total 155 139 157 88 203·
Unit value (per ton)
Mexico· $427 $544 $449 $458 $417 Argentina 385 385 359 Republic of Korea 487 486 412 .. 406 183 Brazil 401 366 366 363 Poland 342 366 366 -All other 507 479 537 . ,491 712
Average 489 464 456 423 .. 443
·Source: Compiled from official statistics of the U.S. Department of Commerce.

A-25
barbless wire strand from Argentina, Brazil, or Poland in 1981, but in 1983 Argentina supplied 12.5 percent of the total imports; Brazil supplied 6.1 percent; and Poland supplied 3.2 percent.
U.S. market penetration by the alleged LTFV imports
The share of the U.S. market for barbed wire and barbless.wire strand supplied by aggregate imports from Argentina, Brazil, and Poland increased annually from 4.5 percent in 1981 to 10.3 percent in 1983 and reached 17.2 percent in January-September- 1984. Market penetration by imports from Argentina remained at 0.6 percent in 1981 and 1982 and then increased to 2.9 percent in 1983 and 4.8 percent in January-September 1984. Imports from Brazil increased their share of the U.S. market from 0.5 percent in 1981 to 3.8· percent in 1983 and 8.0 percent in January-September 1984. Market penetration by imports from Poland dropped from 3.4 percent in 1981 to 1.2 percent in 1982, and then increased to 3.6 percent in 1983 and 4.4 percent in January-September 1984. (table 14).
Table 14.~Barbed wire and barbless wire strand: Share of U.S. consumption supplied by Argentina, Brazil, Polar.d, all other countries, and U.S. producers, 1981-83, January-September 1983, and January~September 1984
!/ Estimated by the staff of the U.S. International Trade Commission.
Source: Compiled from official statistics of the U.S. Department of Commerce, except as noted.
Prices
Prices of barbed wire and barbless wire strand are quoted to end users such as farmers on a per-reel basis. Although price lists are issued by some producers and importers, such prices do not appear to have been strictly adhered to during the period covered by these investigations. Quantity discounts are not generally given to purchasers. U.S. producers and importers

A-26
usually quote prices on an f;o.b. factory or port-of-entry basis, with the purchaser paying for shipping. According to trade sources, however, domestic producers freight equalize with the domestic supplier nearest to the speci fie customer approximately 50 percent of the time. Transportation is usually provided by the purchasers' own trucks or by an independent trucker or firm. Data obtained in these prelimir1ary investigations indicate that transportation costs typically account for about 4 percent of the purchaser's cost of the barbed wire. Barbed wire is often shipped with other, less bulky and lighter wire, such as chicken wire, in order to· help defray shipping costs.
Producers and importers were requested .to provide the Commission with the weighted-average net f.o.b. prices they received for all sales of each of four representative types of barbed wire and for all sales of barbless wire strand, 11 by quarters, from January 1982 through September 1984. z_/, Such pri~es are net of all discounts and allowances, .and they exclude freight charges incurred in delivering the merchandise to ... the customer.
The weighted-average f.o.b. prices reported by dome.stic producers and importers of barbed wire and barbless wire strand from Argentina, Brazil, and Poland are shown in tables 15-19. In general, the price data reported for each of the five products were similar: U.S, producers' prices remained relatively stable throughout January 1982-September 1984, while importers' prices declined. As a consequence, imports from each 9f . .the three countries under investigation undersold the domestically produced products by increasing amounts in each period for which comparisons could be made.
~arbed wire, 12.5 gauge, 2 points.~Prices and margins of underselling of the domestic product by imports from Brazil and Poland (no data were reported for imports from Argentina) for this type of barbed wire are presented in table 15. The weighted-average domestic price per reel ranged from a low of *** in April-June 1994 to a high of *** in April-June 1992. Domestic weightedaverage prices per reel were stable, varying by no more than 6 percent. Weighted-average prices for imports declined during the period covered~by *** percent for imports from Brazil and ** percent for imports from Poland.
11 The products for which price data were collected were the following: (1) 12.5-gauge barbed wire with 2 points and 5-inch spacing;. (2) 12.5-gauge barbed wire with 4 points and 5-inch spacing; (3) 15.5-gauge barbed wire with 2· points and 5-inch spacing; (4) 15.5-gauge barbed wire with 4 points and 5-inch spacing; and (5) barbless wire strand.
~I Prices were requested both on a per-reel basis and a per-ton basis. Representatives of the producer and importer appearing at the Commission's conference stated that prices are reported on a per-ton basis. However, all purchasers contacted by the staff stated that prices are reported on a perree 1 basis. Since the end user purchases by the reel, not by the ton, prices are discussed in this section on a per-reel basis. Per-ton prices comparable to the per-reel prices shown in this section are presented in app. C. The data show that on a per-ton basis, 15.5-gauge barbed wire (which is believed to be predominantly high tensile wire) is substantially more expensive than 12.5-gauge barbed wire (predominantly low tensile wire). However, on a per-reel basis, the method of sale to the end user, the price of 15.5-gauge barbed wire is less than the price of 12.5-gauge barbed wire.

A-27
Table 15.-Barbed wire (12.5, gauge, 2 point, 5-inch spacing): U.S. producers' and importers' weighted-average net f .o. b. selling prices per reel and margins of underselling by imports, by quarters, January 1982-September 1984
Period U.S. : Argentina : Brazil Poland E?roducers : :
Weighted-average price per reel 1982:
January-March *** !t *** 1:.t April-June *** lt !t !t July-September *** It *** *** October-December---- *** !t *** *** 1983: January-Marc *** !t *** *** A"pril-June *** 1:.t *** *** July-September-· *** !t *** *** October-December *** 1:.t 1:.t ***
1984: January-March *** 1/ *** *** April-June *** it *** *** July-September *** l.t *** ***
Amount of underse 11 ing by imports (per reel) 1982:
January-March 1:.t *** 1:.t April-June !t !t !t July-September : 1:.t *** *** October~December !t *** *** 1983: Januar-y-Marc !t *** *** April-June 1/ *** *** July-September l/ *** *** October-December !t !t .. *** 1984: January-March lt *** *** April-June It *** *** July-September 1/ *** ***
Margin of underselling by imports (percent) 1982:
January-March 1:.t *** !t April-June !t !t !t July-September 1/ *** *** October-December It *** .. *** 1983: January-March !t *** *** April-June !t *** *** July-September !t *** *** October-December 1:.t 1:.t *** 1984: January-March !t *** *** April-June !t *** : *** July-September !t *** ***
!t Not available.
Source: Compiled from data submitted in response to questionnaires of the U.S. International Trade Commission.

A-28
Table 16.--Barbed wire (12.5 9auge, 4 point, 5-inch spacing): U.S. ·producers' and importers' weighted-average net f .o.b. selling prices per reel and margins of underselling by imports, by quarters, January 1982-Sept9'nber 1984
Period
1982: January-March·---· April-June-----· July-September------·-------October-December----------
1983: January-Marchi-------------~
April-June--~------------July-September·----------~ October-December·----------
1984: January-March-----------Apri 1-June----------------July-September·-----
1982: January-March-------------Apri 1-June July-September-----------October-December----------
1983: January~arch-----------Apr i 1-June---------------July-September·-------October-December------
1984: January-March------------Apri 1-June-------------July-September
1982: January-March------------Apri 1-June July-September·--------October-December
1983: January-March-------------Apri 1-June--------------July-September·----------October-December---------
1984: January-March----------Apri 1-June--------------July-September-----------
!/ Not available.
:
U.S. : Argentina : producers : :
Weighted-average
*** : !/ *** !/ *** !/ *** !/
*** *** *** *** *** *** *** *** *** !/ *** *** *** ***
Amount of underselling
!l !/ !/ !/
*** *** *** ***
!/ *** ***
Margin of underselling
!/ !/ !/ !/
*** *** *** ***
!/ *** ***
Brazil Poland
price per reel
*** !/ !/ *** *** ***
*** *** *** *** *** ',*** *** *** *** ·X**
*** *** *** *** *** ***
by imports (per reel)
*** !/ !/ ***
*** *** ~ *** *** *** *** *** *** *** *** *** *** *** *** *** *** ***
by imports (percent)
*** !/ !/ ***
*** *** *** *** *** *** *** *** *** *** *** *** *** *** *** *** *** ***
Source: Compiled from data submitted in response to questionnaires of the U.S. International Trade Commission.

A-29
Table 17.-Barbed wire (15.S·gauge, 2 point, 5-inch spacing): U.S. producers' and importers' weighted-average net f.o.b. selling prices per reel and margins of underselling by imports, by quarters, January 1982-September 1984
Period
1982: January-March-·---·----·--Apri 1-June---July-September October-December--·- ·-----
1983: January-March April-June July-September October-December·--------
1984: January-Marchi--------~ April-June July-September---- ·----
1982: January-Marchi-------~ April-June--------July-September--------October-December--------
1983: January-Marchi---------~
Apri 1-June·--------July-September-------October-December·---------
1984: January-Marchi---------~
April-June1-----------July-September·--------:
1982: January--March·------------Apri 1-June July-September·--------October-December
1983: January-March-·--------Apri l-June1-----------July-September October-Oecember·-----------
1984: January-Marchi~--------~
April-June---·---------July-September·-----~~--
!/ Not available
U.S. : Argentina :
producers : :
Weighted-average
*** 11 *** !/ *** 11 *** !/
*** *** *** *** *** !/ *** 11
*** 11 *** !/ *** ***
Amount of underselHng
!/ !/ !/ !/
*** *** !/
1.1
11 !/
*** Margin of underselling
11 !/ 11 !/
*** *** !/
!/
!/ !/
***
Brazil Poland
price per reel
11 11 !/ !/ 11 11 !/ !/
*** !/ *** 11 *** !/ *** 11
*** 11 *** 1/
*** f /
by imports (per reel)
11 !/ !/ !/ !/ 11 !/. !/
*** !/ *** 1/
*** It *** 11
*** !/ *** !/ *** 1/
by imports (percent)
!/ !/ !/ !/ !/ 11 !/ !/
*** !/ *** !/ *** !/ *** !/
*** !/ *** 1/
*** It
Source: Compiled from data submitted in response to questionnaires of the U.S. IntPrnat;nn~l Tr~dP r.nmmi~~inn

A-30
Table 18.-Barbed wire (15.S gauge, 4 point, S-inch spacing): U.S. producers' and importers• weighted-average net f.o.b. selling prices per reel and. margins of underselling by imports, by quarters, January 1982-September 1984
Period
1982: January-March1--~
Apri l-June July-September·-----October-December
1983: January-March Apri 1-June---Ju ly-September·------------~ October-December
1984: January-March April-June-----------------July-September·------
1982: January-March--------------Apr i 1-June-----------------July-September·-----October-December------------
1983: J'anuary-March1---------------Apri l-June-----------------J~ly-Septe~ber~-----------
October-Oecember·----------1984:
January-March1--------------Apr i l-June July-September·---
1982: January-March•---------------Apri 1-June•----------------~ July-September-·~--October-December·----------
1983: J'anuary-March1---------------Apri l-June•-----------------July-September October-December·-------------
1984: January-March•---------------Apri 1-June----------------July-September·------------~
11 Not available.
U.S. : Argentina : producers : :
Weighted-average
*** 11 *** !/ *** 11 *** !/
*** !/ *** 11 *** *** *** 11
*** 1/
*** It *** 1/
Amount of underselling
11 !/ 1.1 !/
!/ 11
*** 1.1
11 !/ 1/
Margin of underselling
11 !/ 11 !/
!/ 11
*** 11
11 !/ 11
Brazil Poland
price per reel
*** 11 *** !/ *** 1.1 *** !/
*** !/ *** 11 *** !/ *** *** *** *** *** !/ *** ***
by imports (per reel)
*** 1.( *** !/ *** 11 *:** !/
*** !/ *** 1/
*** I1 *** ***· *** *** *** !/ *** ***
by imports (percent)
*** 11 *** !/ *** 1.1 *** !/
*** !/ *** 1.1 *** !/ *** *** *** *** *** !/ *** ***
Source: Compiled from data submitted in response to questionnaires of the U.S. International Trade Commission.

A-31
Table 19.···~Barbless wire strand: U.S. producers' and importers' weightedauerage net f.o.b. selling prices per reel and margins of underselling by imports, by quarters, Januar:t 1982-Septembe~ 19~4
1982; January-;=-iarch ---Apri 1-June-·---··--July-September--------···-·· --October-December--------
1983; January-March Ap.ri 1-June--·-·-·--------Ju ly-September--· October-December
1984: January-f4arch~-~
Apri 1--June-July-September----
U.S. producers
~··~)(
:: :: )( :: :: )( ;;'.-;;'.)(
~;;'.)(
;;'.;;'.;(
:: :: )( ;;'.;;'.;(
;;'.;;'.)(
::~)(
:: :: )(
~rgentina
! I !/ 1 I !/
!/ 1 I 1 I 1 I
1 I 1 I 1 _I
1 I 1 I 11 !/
1c:;;: 1 I )(){~
!/ 1 I 1 I
)(!:;;'. .!/ 1 I 1 I
)(h;~ .! I )(!:;;'. !/ )(){;;'. 1 I
~)()(
;;: )( )(
~mount of underselling by imports (per reel)
1982.: January-f4archt-·------~April-June~--------July-Septemb~r--------October-December---·~~--
1983; January-f-1arch Apri 1-JtHle Ju ly-Septemr.,,,.-October-December
1984; January4;arch----~---
Apri l-June~------~~ July-September ·----
1/ ]J 1/ !/ 1/ !/
l/ !/ 1/ 1/ 1/ l/ !/
1/ 11 1/
.!/ !/
)(~i;: .!/ K:: ~ ~)( )(
~ )( )(
.!I )(~;;: !/
!/
)(~~ .!/ )(~~ !/ )(~~ 1/
F;argin of underselling by imports (percent)
1982: January4;arch Apri I-June· July-September-···-----October-December
1983: January-March April-Jurr July-September~-----~
October-Oecember·--~~~~-
1984: January--l"'~rch April~Jun~
July-Sept~mber·~-~~~~~-
!/ Not available.
11 1 I
! I !/
!/ !/ !/ !/
!/ !/ !/
1/ !/ !/ !/
*** i I ~#
~)()(
!/ 1 I 1 I
~)()( i I =.,,1
.!/ i I if
;;: )()( 'i I £.:
~)()( 1 I ~ )( )( 1 I
Source: Compiled from data sLlbmittecl i~ response to questionnaires of the U.S. International Trade Commission.
)( :: ::
)(;;~

A=S2
Margins cf unciersel ing of U.S.-produced barbed wir" by imports' from Brazil rang~d from 20 to 3 percent, and margins of unders~llins by imports from Poland ransed from ~~ to 54 percent.
~arl;;ed wj.r~, 12. 5 aauge, 4 points .-Pric~s and mar;ins of underselling ;;:;f the domestic product by imports from Ar$entina, Bra~il, and Poland for this specification of b~rbed wire are present~cl in table 16. The weighted-avera$e domestic price per reel ranged from a low of ~~M iri JarHJary=-i""iarch 1994 to a high of ~~* in July=Sept~mber 1992. Oom~stic weighted=averas~ prices per reel were stable, varying by no more thari 5 percent. ltJeighted-average ~ric~s for imports cl~clined during the period covered--by MM~ percent for imports from Argentina; M·>+* percent for imports from Brazil; and *** percent for imports from Poland. Margins of underselling of U.S.=procluced barbed wire by imports from Argentina ranged from 71 to 75 percent; margins of und.,rselling by imports from Brazil ranged from 14 to 36 percent; and margins of unders~llins by imports from Poland rariged from 17 to 45 percent.
Barbed wire, lE;u. 5 qa;;ge, 2 points.-· -?ric~s and margjins of uncl~rsell1ng of the domestic product by imports from Argentina and Srazil (no data were reported for imports from Poland) for this type of barbed wire an:; presented in table 17. The weighted-average domestic price ~er re~l ranged from a low of XX~ in July-September 1983 to a high of M~~ in January-March 1982. After a decline of *** perc~nt in the second quarter of 1982, domestic weightedaverage prices per reel were stabl~. Brazilian wei~hted-av~rage prices per reel declined by *X~ perc~nt. Weighted-averag~ prices for imports from Argentina (data were obtained for only three quarters) declined-by*** percent. Margins of underselling of U.S.-proclucecl barbed wire by imports from Argentina ranged from 52 to 55 perc~nt and margins of unders~llins by imports from Brazil ranged from 17 to 22 percent.
Barbed wire, 15.5 ~auge, 4 poirits.~Prices and margins of underselling of the domestic product by imports from Ar~entina, Brazil, and Poland for this type of barbed wire are presented in table 18. The weighted-average domestic price per reel ranged from a low cf *** in July-September 1984 to a high of *** in January-March 1982. Domestic weighted-average prices per r~el decreased by 7 percent through the third quarter of 1984. 8raz111an weighted-average prices ~er r~el declined through the third quarter of 1984, by .;;:;;:* percent, before rising by K~~ percent in the fourth quarter. Weighteclaverage prices for imports from Poland declin~d by ~MM percent from the fourth quarter of 1983 to the third quarter of 1984. Prices of this typ~ of barbed l-llire from Argentina were obtained for only on~ quarter. The mar<::!iin of underselling of U.S.-procluced barbed wire by imports from Argentina amounted to ~~~ percent in the only quarter for which comparisons could b~ made, Jt;ly-September 1983. f'iargins of underselling by impurts from Brazil ranged from 9 to 22 percent, and margins of underselling by imports from Poland ranged from 32 to 36 p~rcent.
~arbless wire strand.~?rices and margins of underselling of the domestic product by imports from Brazil and Poland (no data were r~ported for impurts from Argentina) for barbless wire strand are pr~sented in table 19. The weighted-average domestic price per reel ranged from a low of ~~* iri JanuaryMarch 1983 to a high of MM~ in October-December 1992. Domestic weightedaverage pric~s were stable, varying by no more than 4 perc~nt. Brazilian

weighted-average prices per r¥el fluctuated, but declined by *** percent between the third quarter of 1982 and the third quarter of 1984. The \.i.!eightedaverage price of imports from Poland declined by ~::K percent from the fourth quarter of 1982 to the first quarter of 1983, the only periods in which such prices were reported. ~argins of underselling of U.S.-produced barbless wire strand by imports from Brazil ranged from 23 to 38 percent and mar~ins of underselling by imports from Poland ra~ged from K~~ to ~~M percent.
Indexes of the nominal and real e~change rates bet~een the U.S. dollar and the Argentine peso and the Brazilian cruzeiro are shown in table 20. 11 The value of the Argentine peso has depreciated significantly in relation to the U.S. dollar, both in nominal terms and in real terms, since 1981. From January-Rarch 1981 through April-June 1984, the nominal value declined by 99.5 percent. The real value, which takes into account the relative rates of inflation in Argentina and the United States, declined by 41.6 percent during this period.
The value of the Brazilian cruzeiro has also depreciated significantly in relation to the U.S. dollar in nominal terms, and, to a lesser e~tent, in r~al terms since 1981. From January-March 1981 through April-June 1984, the nominal value of the cruzeiro declined by 96.5 percent. The real value declined by 20.8 percent during this period.
Lost sales
Domestic producers were asked to fLlrnish the Commission with customer names, quantities, and dates relating to any sales of barbed wir~ or barbless wire strand they have lost since January 1, 1982, to imports of comparable products from Argentina, Brazil, or Poland. ~MM was th~ only producer to u~ke specific allegations of lost sales, reporting five instances involving four firms. ~ll of the alleged lost sales occurr~d in the third quarter of 1983. ***'s alleged lost sales totaled ~::~ tons c~~~ reels) of 12.5-gauge barbed wire, valLled at about M~~ (the weighted-average price of alleged lost sales was XMM per ton). All the firms listed in the allegations were contacted by the Commission's staff; all but one confirmed that they purchased barbed wire from at least one of the countries under investigation. Representatives of all but one of these firms stated that they pLlrchase b-~rbed wire imported from these countries because of price considerations and, in some instances, because of th~ inability of domestic producers to provide the nec~ssary quantities. However, none of the firms contacted were willing to talk. about the specific lost sales allegations m-~de by MM~
11 The nominal exchange-rate indexes are based on quarterly averages published by the International ~onetary Fund in Int~rnational financial Statistics. Nominal exchange rates were adjusted on the basis of producer or industrial price inde~es in the three countries.

A-34
Table 20.~Nominal and real exchange-rate indexes between the U.S. dollar and the Argentine peso and the Brazilian cruzeiro, !/ by quarters, January 1981-September 1984
(Januar~-March 1981=100)
Argentinian peso Brazilian cruzeiro Period
Nominal Real Nominal Real
1981: January-March--·----: 100.0 100.0 100.0 100.0 Apri I-June· 58.4 75.3 84.4 98.6 July-September 42.8 33.3 71.0 95.0 October-December 33.7 26.2 60.0 93.3
1982: January-March ... 21.4 64.1 51.4 93.0 April-June 16.1 60.0 44.0 96.5 July-September 5.8 36.7 37.3 95.9 October-Decembe 5.2 48.0 30.7 91.2
1983: January-March 3.8 50.4 21.7 80.2 April-June 2.8 49.2 14.9 72.5 July-September--· 2.1 55.0 11.1 76.7 October-December 1.2 54.0 8.2 79.2
1984: January-·:flarch· .8 52.4 6.2 78.5 April-June .5 58.4 4.7 78.0 July-September 1:/ £/ 3.5 79.2
!/ Based on exchange rates expressed in U.S. dollars per unit of foreign currency.
ZI Not ava~lable.
Source: Compiled from official statistics of the International Monetary Fund.
*** alleged that it lost sales of *** tons (*** reels} of barbed wire, valued at about ***· to *** because of imports from ***· When contacted by the Commission's staff, a*** representative said that the firm has to purchase barbed wire from*** in order to stay competitive. The representative added that the domestic producers do not react to market conditions and are not willing to meet the competition in terms of price. *** was not willing to confirm or deny the specific lost sales allegations by ***· ·
***was also listed as a lost sale by ***· This instance involved *** tons (*** reels} of barbed wire, valued at ***· allegedly lost in *** to imports from ***· A *** spokesman said that the firm has to purchase barbed wire from *** to stay competitive. He stated that the primary reason the company purchases imports was the inability of domestic producers to meet its requirements in a timely manner. As far as *** was concerned, it would purchase the lowest priced barbed wire of comparable quality. Again, the firm
A-35
was not willing to confirm or deny the specific lost sales allegation made by ***
*** was listed as a lost sale by ***. This allegation involved sales of *X* tons (*** reels) of barbed wire, valued at about ***, lost to imports from ***·in*** 1983. A representative of*** said that it has to purchase*** barbed wire to stay competitive. The representative said that they purchase *** wire in addition to domestic wire, in part because of consumer preferences. However, he was not willing to confirm or aeny the specific lost sales allegation of ***
*** was listed as a lost sale by ***· This instance involved sales of *** tons (*** reels) of barbed wire, valued at about ***, allegedly lost to imports from*** in*** 1983. When contacted by the staff, a representative of *** said that the firm purchases only domestically manufactured barbed wire and barbless wire strand.
Lost revenues
One domestic producer, ***, cited 19 instances in which it allegedly lost revenues on sales of barbed wire to five U.S. customers because of competing products from Argentina, Brazil, and Poland. These alleged instances of lost revenues occurred between August 1982 and December 1984. The total amount of revenue allegedly lost by *** was about *** on sales of *** tons of 12.5-gauge barbed wire (*** on sales of *** tons of 4-point wire and *** on sales of *** tons of 2-point wire).
All of the customers involved in these allegations were contacted by the Commission's staff. Two of the firms indicated that, in 11 instances, the U.S. producer was forced to lower its price due to price competition from at least 1 of the countries under investigation. Although, the other firms involved would not confirm specific allegations, they did indicate that it was possible that the U.S. producer making the allegations might have been forced to lower its initial price because of the presence of lower priced foreign products.
***was listed in *** alleged price reductions made by *** (in ***) in the face of competing products imported from ***· When contacted by the staff, a representative of*** confirmed that*** had lowered the price of its barbed wire ***as a result of lower prices from***·
*** was listed by *** in *** alleged lost revenues involving imports from *** A representative of *** was able to confirm that *** had lowered. its price of barbed wire *** as a result of lower prices from ***·
The remaining companies cited by *** in its lost revenue allegations (which were ***) would not provide specific examples but did say that competition from Argentina, Brazil, and Poland has forced the domestic producers to lower their prices of barbed wire and barbless wire strand.


A-37
APPENDIX A
THE eof'f1ISSION'S FEDERAL REGISTER NOTICE OF INVESTIGATIONS

A-38
481i8 --Fed~ a.,pti.·1VoL4~ No. ZJO ·1 Wednesday, November 28. 1981 {Notlcee
11n11111p11one11oe.nt-i~---- . 210 (Prillnlll•t)J - -
. . . . llMtedWh...ra.t111aWh..,.. Fram Atgeiilllw, .......... Pallnd . , - --MllNCY: lntemaUooal Trade
-.. ACTIOIC lmlibatioa of prebminuy anUd•unsMal lnve•tipUou and ldMJch1Uq of a coaf' ... to be held Ill connection with the mveattaaUom. -
a BIUM11ie Comndt'1on ~aha notice of the m.titatlaa of prelbiUnarr antlclamp11'(1 IDV'81tlptlou Noe. m-T~ - -. ..... 210(PNllmJaarr) .... -MCtloa n:t(a) of Ille Tarftf Adof 1930 ·(ti u.s.c. I tenb(aj) to ditennlne ' ............ reuonable ladlcallln .......... ..,fn .... Unltecl Statala -
materlallr illjured. or It tbreatelild with material inJUl'J. or the utablllhment qi an industry in th United Statea la .. materlallJ retarded. by nuoa of - · lmpOrta flom Aiaen~ Brazil. end Poland of barbed wira ad looaelr . twisted double Wire atrand 1ujtable for fenc:fna purpoaea (barbleu wire). provided for la items 84Z.OZ and ea.11. respectively. of the Tariff ~edules of the _United State1.. which are alleged to be aold In the United Statu.at leA th•a fair value. Aa provided in ~OD 733(a). the Commlaalon muat complete preliminary antldumpins Investigations in 45 days. or in these cases b1 JanDUJ 3. 1985. .
For further information concemin& the conduct of these lnvestiptfona and rules of aenenl applic:ation. connlt the -Commission's Rules of Practice and -- -Procedure. Put 2111, Sabplll'tl A and B · ·(t8 CFR 311). and Pait mt, Subplll'tl A tluvqb B (ti CFR P8rt mt). -wwwnw itAm November t8. t98t. _ ............ ~'llGllCClllTAcr.. -Bruce Cata,...,....). Offic:aof --- -lnveatiptlm:ai,. U.S. International Ti'ade CommiaaJoD, 701 E Street NW .. _ ·
_ WuhJnaton, DC m438. - -
mUat accc:impan, the doC:unienL The SecretUJ will DOI accept• document for _ films without a certificate or iervice.
~ '11le DinCtor pf Operations of the
Comml~ion flu 1eheduled a c:Oaference in connection with these fuvestfptlonafor 9:30 Lm. oli December U. l98f, at the U.S. lntematlonal Trade . Co.Dmisalan Buildin&r 701 E Street NW .. · Washfnaton. OC.- Parties wiahioa to participate In the conference lhould contact Bruce Cates (20Z-SZ3-a368) not later than December 11. 188f. to arranp for their appearenc:e. Partiea in aupport of the impoaition of aatidumpina dutiu In theae invutiptioM and partiea in opposition to the impoaitiaa of suc1a dutiea will eada be collectively allocated
-one hour witbia whicla to make an oral pnisentation at tbe mnfennce.
WritteD Sabpl"'!"
"AnJ P.rion mar tubmlt-ro the -. . -Commiaaicmon~ b,fore December tf. t98t. a writteti statement of Information pertiaeaJ to the" subject of the . lnvestiptfoaa aa provided in I 20'1.tS of the CCJmmiuion"a rules (11CFR2117.15).
...._. A slped oriaiDa1 and foarteen.(14)
-Tbae iaveaupticma arebeiaa - copiu of eacb submiMian ...... be filed lnatituted la .rupoase to a petition &led with the Seaetarf to the Commfuloa Ill
November •a i-.a b 11!!'-..L- s•--1. accordance with section ZOLi of the OD - - - , .. .,..._ .._. __ , __ (19 CFR - _., AD written -'_ • .. ~ ad Wire Cmporatioa, ~ p~ l"lllc. EN&.a,.
Paltk ........................ ' . -_ b!n-:!:-.. -:::.rc:::.s:::i. _ Penou wflhm. to Paittdpere IA di...- public: mapectloli dmlq regular_.
blYeatiptiaaa u partiea must file aa bualneu hoan (8:45 a.m. to 5.-tS p.m.) In entry of appearance with the SecretarJ- - -the omce of the Secretary to the . . to the Commlaaioa. aa provided in_ : Commission. · - - · I 20L11 of the COmmiuioa•a ruin (19 • Any busin~ia informati"On for which CFR mut). not later then seven (1) confidential treatment la desired mut da11 after publicaUan of thia notice In the Fedenl Restster. Any entry of be aubmitt~d leparately. The eaV.lope appearaace..filed after this date will be and all pqea of auch aubmiaaiom mut refened to.the Chairwomu. who will be dearly labeled "Confidential determine whether to accept the late Buaine11 lnformatioa." Confidential entry for aoocf cause shown b1-tbe aubmlAions and requests for pencm dealrlq to 61e the en1r7. confldential treatment must conform
· with the requirements of I ZOUI, aa Senlm I.lat ~ended bJ 49 PR 32589, Aug. 15. 1984).
Punaant to ZOl.tl(d) of the CommlAloa"s rulet (19 CPR ZOl.tt(d)J, - AullladlJ: '111ae lnveetlptlom are belns the Secretary will prepare a aemce llat. c:onclactad •der alllllarQy of the Tariff Act of coatalnioa the namea and addresses of - 1930. lid. VD. 11aia aodce la p•ihlJ.hed all penom.·or their repreeentat1va.· ~-to 121111.12oftbe OnnndM!oa'a who are '8rtfea to these laveatlptlons ~ (tt en 21r1.t.Q. ~f'Oll the expiration of the period far · . Br ordlraf 11111 (;iQ01o•mrnm'•111alaa.111. lilln& itntrlea of appearance. In · - luued: November 2111. 1991• aa:ordanc:e with I 21Jt.tl(c:) of the ruin _ (11 t:l'R 3Dl.18(c:)), eacb document flied --r±asdi a..._. bJ a Put¥ to the bweltlptlmia must be· _ ~ llll'nd oa au other parties to the - . lmestlptlalll (ad ldeatifted bJ the_ lf1Da1W1m,..1MM1:&4l•I servlci 118tJ, and. certdlc:at. of Mnlc:e. .... .. - ••

A-39
APPENDIX B
LIST OF WITNESSES APPEARING AT THE C0.'11MISSION'S CONFERENCE

A-4()
CALlllWl OP PUBLIC COl'fllllfCI
Inve•tigation• •o•. 731-TA-208, 209 an4 210 (Prelillinarr>
BDBID WIU ARD IWitBLISS WIU SftAllD ftOll AllClllTDTA, BRAZIL AID POLAllD .
Those listed below appeared as witnesses at the United States International Trade Commission conference in connection with the subject investigations which began at 9:30 am, December 12, 1984, in the Hearing Room of the USITC Building, 701 B St. R.W., Washington, D.C.
In support of the imposition of antidumping duties
Wiley & Rein--COUBSBL Washington, D.C.
on behalf of
Forbes Steel and Wire Corporation Kr. Lester Wolan--Chairman Kr. Edgar Lauther--Vice President
Charles OWen Verrill, Jr.> __ 0F COUITSBL Robert B. llielsen ) 1
In opposition to the imposition of antidumping duties
Wald, Harkrader & Ross--COUNSEL Washington, D.C.
Q..11.behalf of
Companhia Siderurgica Belgo-Kinera Compania Siderurgica de Guanabara-Cosigua
Christopher A. Dunn) __ 0F COUNSEL Mark Schattner )

A-41
APPENDIX C
SUPPLEMENTAL PRICE TABLES
A-42
Tabless C-1 through C-5.~Barbed wire (by sizes used in tables 15-19): U.S. producers'and importers' weighted-average net f .o.b. selling prices per ton and margins of underselling by imports, by quarters, January 1982-September 1984
* * * * * * *