bank liquidity creation in russia
TRANSCRIPT
This article was downloaded by: [University of Birmingham]On: 24 September 2013, At: 14:57Publisher: RoutledgeInforma Ltd Registered in England and Wales Registered Number: 1072954 Registeredoffice: Mortimer House, 37-41 Mortimer Street, London W1T 3JH, UK
Eurasian Geography and EconomicsPublication details, including instructions for authors andsubscription information:http://www.tandfonline.com/loi/rege20
Bank Liquidity Creation in RussiaZuzana Fungáčová a & Laurent Weill b
a Bank of Finland Institute for Economies in Transition (BOFIT)b Charles UniversityPublished online: 15 May 2013.
To cite this article: Zuzana Fungáčová & Laurent Weill (2012) Bank Liquidity Creation in Russia,Eurasian Geography and Economics, 53:2, 285-299
To link to this article: http://dx.doi.org/10.2747/1539-7216.53.2.285
PLEASE SCROLL DOWN FOR ARTICLE
Taylor & Francis makes every effort to ensure the accuracy of all the information (the“Content”) contained in the publications on our platform. However, Taylor & Francis,our agents, and our licensors make no representations or warranties whatsoever as tothe accuracy, completeness, or suitability for any purpose of the Content. Any opinionsand views expressed in this publication are the opinions and views of the authors,and are not the views of or endorsed by Taylor & Francis. The accuracy of the Contentshould not be relied upon and should be independently verified with primary sourcesof information. Taylor and Francis shall not be liable for any losses, actions, claims,proceedings, demands, costs, expenses, damages, and other liabilities whatsoever orhowsoever caused arising directly or indirectly in connection with, in relation to or arisingout of the use of the Content.
This article may be used for research, teaching, and private study purposes. Anysubstantial or systematic reproduction, redistribution, reselling, loan, sub-licensing,systematic supply, or distribution in any form to anyone is expressly forbidden. Terms &Conditions of access and use can be found at http://www.tandfonline.com/page/terms-and-conditions

285
Eurasian Geography and Economics, 2012, 53, No. 2, pp. 285–299. http://dx.doi.org/10.2747/1539-7216.53.2.285Copyright © 2012 by Bellwether Publishing, Ltd. All rights reserved.
Bank Liquidity Creation in Russia
Zuzana Fungáčová and Laurent Weill1
Abstract: Two EU-based senior economists analyze the contribution of bank liquidity creation to the Russian economy, as well as changes in creation of liquidity occurring dur-ing the global financial crisis. Applying the methodology of Berger and Bouwman’s (2009) study of U.S. banking to a rich panel dataset for Russian banks for the period 1999–2009, the authors compute three alternative measures of bank liquidity creation. They find evidence of increased creation of liquidity in real terms over the period and also determine that state-controlled (versus private) banks and Russia’s largest banks (versus intermediate-size and small banks) contributed most to liquidity creation (lower in Russia than in the U.S.). Their findings suggest that consolidation of the Russian banking sector may prove more instrumen-tal in increasing liquidity creation than privatization per se. Journal of Economic Literature, Classification Numbers: G210, G280, P500. 8 tables, 22 references. Key words: Russia, bank liquidity creation, global financial crisis, bank capital, bank ownership, bank size, bank assets, bank liabilities.
INTRODUCTION
The recent global financial turmoil has highlighted the importance of liquidity provision by banks to the health of the financial system. Indeed, in addition to their role as risk
transformers, banks also function as liquidity creators. They do so by financing relatively illiquid assets with relatively liquid liabilities. In this way, they contribute to financing the economy and facilitating transactions among economic agents. And while the risk transfor-mation function provided by banks has already been widely examined in the literature, the role of banks in liquidity creation has not been investigated thoroughly thus far.
Berger and Bouwman (2009) have suggested a novel approach for measuring the liquid-ity created by banks. They first classify all bank assets and liabilities based on their degree of liquidity, and then assign weights to each item and compute the amount of liquidity created by each bank. Applying this method to the U.S. banking industry between 1993 and 2003, they show that liquidity creation increased throughout the period of observation, and that the most liquidity was created by large banks, multibank holding companies, retail banks, and recently merged banks.
In this paper, we apply the Berger and Bouwman methodology to Russian banks. The period 1999−2009, in particular, offers excellent opportunities for exploring cross-sectional and intertemporal variations in bank liquidity creation in Russia. Not only does it provide evidence concerning the contribution of banks to economic growth by creating liquidity, it also includes an episode of major financial turmoil that lets us assess how a financial crisis
1Respectively, Bank of Finland Institute for Economies in Transition (BOFIT), Snellmaninaukio, PO Box 160, 00101 Helsinki, Finland and Institute of Economic Studies, Charles University, Prague, Czech Republic (Zuzana [email protected]) and Universite de Strasbourg (LaRGE) & EM Strasbourg Business School, 47 Avenue de la Forêt Noire, 67082 Strasbourg, France ([email protected]).
Dow
nloa
ded
by [
Uni
vers
ity o
f B
irm
ingh
am]
at 1
4:57
24
Sept
embe
r 20
13

286 EURASIAN GEOGRAPHY AND ECONOMICS
influences the liquidity creation function of banks. The latter question is especially topical given the current economic problems in the Eurozone and other markets which have made borrowing on international markets more challenging for Russian banks and thus reduced one of the most significant sources of their funding. Starting in the fall of 2011, this has now already been reflected in a tightening of liquidity in the Russian financial sector.2 If the current liquidity squeeze continues, it may significantly restrict the liquidity creation ability of banks in Russia and ultimately the entire process of financial intermediation.
Moreover, we can identify characteristics of Russian banks that might influence liquidity creation. With respect to ownership, Russia is unique in that it never experienced a compre-hensive privatization of its banking sector, unlike most Central and Eastern European coun-tries. Therefore, domestic private and state-owned banks operate in the Russian market today alongside foreign-owned banks, providing a basis for comparison. Insights into the effects of ownership on liquidity creation have important implications for foreign bank entry. Finally, recalling the Berger and Bouwman’s (2009) finding that large banks created relatively more liquidity (in the U.S.), we can use our dataset to examine whether bank size affects liquidity creation in Russia. A positive relationship between liquidity creation and bank size would support the case for further consolidation of Russia’s still-fragmented banking industry.
Our panel dataset consists of quarterly data for the period 1999−2009 for all banks oper-ating in Russia. It is thus unique in the sense that it contains comprehensive, detailed data necessary for the calculation of a variety of liquidity creation measures, it covers Russia’s entire banking industry, and extends over a much longer period (11 years) than any previous study. It is the most current of its kind in terms of providing such detail across such a long time-series. We measure liquidity created by Russian banks by constructing three liquidity creation measures based on category and the maturity classification of balance sheet items.
The few papers applying the new Berger and Bouwman method tend to concentrate on the determinants of liquidity creation. Fungáčová et al. (2010), for example, consider the link between bank capital and liquidity creation by exploring how the implementation of a deposit insurance scheme affected this relationship. Taking advantage of Russia’s experimental implementation of a deposit insurance scheme in 2004, they observed the link between bank capital and liquidity creation, but did not offer detailed information on liquidity creation.
Berger et al. (2010) investigated the impacts of regulatory interventions and capital injec-tions on liquidity creation using a sample of German universal banks, and concluded that such interventions reduced liquidity creation. Rauch et al. (2010) analyzed the potential determi-nants of liquidity creation for a sample of German savings banks by comparing the role of macroeconomic factors such as monetary policy and unemployment with bank-specific fac-tors such as bank size and financial performance. Although their findings support the view that monetary tightening reduces liquidity creation, they observe that bank-specific factors appear to have no influence on liquidity creation, at least in their German sample. Pana et al. (2010) investigated the impact of bank mergers on the liquidity creation in U.S. banks. They document a positive influence of mergers on liquidity creation by banks.
The contribution of the present paper to the burgeoning literature on bank liquidity creation concerns the measurement of bank liquidity creation in Russia and the analysis of two potential determinants, bank ownership and size. In the following section of the paper, we describe the recent developments of the Russian banking industry and the impacts of the
2Based on these liquidity concerns, Moody’s cut its rating of the Russian banking sector from ”stable” to ”nega-tive” in October 2011. For media coverage on Russia’s liquidity situation in late 2011–early 2012, see Russia’s Banks (2011), Walsh (2011), and Iosebashvili (2012).
Dow
nloa
ded
by [
Uni
vers
ity o
f B
irm
ingh
am]
at 1
4:57
24
Sept
embe
r 20
13

fUNGÁČOvÁ and WeiLL 287
current financial crisis. A third section presents our panel data and liquidity creation measures and a fourth describes the results. A final section restates the paper’s major findings.
THE RUSSIAN BANKING INDUSTRY AND THE GLOBAL fINANCIAL CRISIS
The Russian banking sector resembles the banking sectors of other emerging markets in many respects. It enjoyed rapid growth following the 1998 financial crisis and experienced marked increases in its size and the range of banking services it provided. In addition to serv-ing their traditional corporate clients, Russian banks today provide credit to households in forms such as mortgages and credit cards. The legal environment has also improved, thanks to important reforms, including the creation of a robust deposit insurance scheme that now encompasses most of the banking system.3 According to the Central Bank of the Russian Federation (CBR), the ratio of banking sector assets to GDP increased from 33 percent in 1999 to 77 percent in 2011 (CBR, 2012). Lending activities of Russian banks also expanded briskly during the period with the credit-to-GDP ratio increasing from 10 percent to over 40 percent. Despite the significant rise in financial intermediation, however, Russia’s credit-to-GDP ratio is still considerably lower than that of most emerging markets. In 2009, the cor-responding number was about 55 percent for Poland and Brazil, 127 percent for China, and 141 percent for the average EU country (World Bank, 2010).
At the end of 2011, there were 978 credit organizations operating in Russia (CBR, 2012). Banking sector assets were held mainly by large banks; the five largest banks controlled half of banking sector assets at the end of 2011 and the 200 largest banks about 94 percent. Most other banks were quite small, although some of them were regionally important.
As noted above, state-controlled banks continue to dominate the Russian banking, as the country did not experience the wave of bank privatization that occurred in most Central and Eastern European countries. Russia has around 40 state-controlled banks (depending on defi-nition) that hold over half of banking sector assets. The five largest banks in Russia are state-controlled. Foreign bank participation increased during the 2000s; the number of banks with foreign ownership shares rose from 133 in 1999 to 220 in 2011. About half of these banks had foreign ownership stakes greater than 50 percent. Three foreign-owned banks ranked among the 10 largest banks in Russia in 2011, and foreign-owned banks accounted for over 20 per-cent of banking-sector capital.
While Russia’s banks on average were in relatively good shape and not directly exposed to the toxic financial instruments that triggered the global crisis, Russia’s banking sector was nonetheless fully entangled in the global financial crisis by the second half of 2008. The nega-tive shock was transmitted to Russian banks through two main channels: lack of access to foreign financing and a falling oil price.4
The Russian banking sector has traditionally lacked access to long-term funding. As much of the growth in the banking sector in the 2000s was driven by short-term foreign borrowing, the drying-up of foreign refinancing sources in 2008 inflicted a serious toll on Russian banks. Russian companies, too, that had earlier financed investments out of pocket, had begun to rely on international markets for funding. Among the hardest hit were those Russian companies that had used their own shares as collateral. The drop in oil prices severely eroded their share prices, leading to a number of margin calls. Lower share prices also had a knock-on effect for
3For details, see Barisitz (2008).4On how prevailing forms of geo-economic and geopolitical integration contributed to the vulnerabilities of the
former Soviet bloc countries during the global financial crisis, see Smith and Swain (2010). On the impacts of falling oil prices on Russia’s economy during the crisis, see Gaddy and Ickes (2010)—Ed., EGE.
Dow
nloa
ded
by [
Uni
vers
ity o
f B
irm
ingh
am]
at 1
4:57
24
Sept
embe
r 20
13

288 EURASIAN GEOGRAPHY AND ECONOMICS
medium-sized banks that had substantial portions of their assets tied up in the stock market. Falling oil prices combined with a strengthening dollar reduced confidence in the ruble, and the resulting exchange-rate pressure paralyzed Russia’s financial markets (Fungáčová and Solanko, 2009).5 A series of incremental ruble devaluations between November 2008 and February 2009 lowered the ruble-dollar rate by approximately 30 percent.
In autumn 2008, the Russian government and the CBR rapidly implemented a variety of measures to support stability of the financial system and prevent its collapse. These included a temporary decrease in bank reserve requirements, auctions allocating free budgetary resources to banks, non-collateralized CBR loans, and compensation for certain kinds of losses on the interbank market. Measures to recapitalize the banks included providing unsecured subordi-nated loans from the CBR and the development bank Vneshekonombank (VEB). Both state-controlled and private banks were included in this scheme, but the level of reliance on these subordinated loans differed according to bank ownership. Most recapitalization of private banks came from other sources, while most of the capital infusions to state-controlled banks were financed through subordinated loans. VEB also was provided with resources to assist in the refinancing of the foreign debt of Russian firms. In October 2008, Russia’s deposit insurance agency assumed the task of restructuring individual troubled banks. Although all of these measures helped stabilize the Russian banking system, they also increased the role of state-controlled banks in the banking sector. Nevertheless, despite all these efforts, credit growth only resumed in 2010, when economic conditions began to improve.
DATA AND MEASURES
Data
Our dataset consists of the quarterly balance sheet and income statement information on Russian banks provided by the financial information agency Interfax, which collects and organizes data from the CBR.6 We have “cleaned” the original data by excluding those obser-vations in which: (a) the average total-loans-to-total-assets ratio is less than or equal to 5 percent; (b) the sum of deposits equals zero; (c) the capital-to-assets ratio is larger than 100 percent. Furthermore, to avoid the potential distortion of the results by deeply troubled banks or banks that have had their licenses withdrawn by Russian regulators, we removed (d) obser-vations that show a capital-to-assets ratio of less than or equal to 2 percent.7 Finally, (e) we only considered banks participating in the deposit insurance scheme in our analysis (banks excluded from the deposit insurance scheme are prohibited from collecting household depos-its). Applying these rules leaves a sample of nearly 38,000 bank-quarter observations for the period starting in the first quarter of 1999 and ending in the fourth quarter of 2009. Table 1 provides a description of the trends of the main variables in our dataset.
Our identification of foreign-owned banks is based on the CBR data, which defines such banks as those with foreign ownership shares exceeding 50 percent. State-controlled banks are identified using the classification of Vernikov (2009). These include banks majority-owned by the central government, Central Bank of Russia, state-controlled companies, or municipali-ties. We also classify banks by size. Large banks are the 50 largest ranked in terms of total assets. Following the CBR classification, banks that rank from 51 to 200 in terms of total
5For analyses of the exchange rate pressures in the Central and Eastern European countries more broadly during the global financial crisis, see Åslund (2011) and Darvas (2011)—Ed., EGE.
6For a more detailed description of the dataset, see Karas and Schoors (2005).7Russian regulations call for cancellation of a bank’s license when its capital ratio falls below 2 percent.
Dow
nloa
ded
by [
Uni
vers
ity o
f B
irm
ingh
am]
at 1
4:57
24
Sept
embe
r 20
13

fUNGÁČOvÁ and WeiLL 289
assets are classed as medium-sized banks. The remaining small banks accounted on average for about 10 percent of total banking sector assets during our observation period.
Measures of Bank Liquidity Creation
We employ three measures of liquidity creation in our analysis, are all based on the meth-odology developed by Berger and Bouwman (2009). We first classify balance sheet items as liquid, semi-liquid, or illiquid by taking into account how difficult and costly it would be for an owner of each item (i.e., a bank in the case of bank assets; another party in the case of bank liabilities) to liquidate it. This classification applies to all itemized terms for assets, liabilities, and capital.8 We further assign weights to all these items, and then calculate the measures of liquidity creation. Below we define our three measures of liquidity creation and detail how we classify financial items based on liquidity.
The functional form of measuring liquidity creation (Eq. 1) remains the same throughout the paper, while the definitions of each of the right-hand-side terms in the equation change for different measures.
Liquidity Creation (LC) = {½ × illiquid assets + 0 × semi- liquid assets – ½ × liquid assets} + { ½ × liquid liabilities + 0 × semi-liquid liabilities – ½ × illiquid liabilities} – ½ × capital (1)
The first liquidity creation measure we consider is a gross measure that provides an over-all picture of liquidity creation. The second is based on a category classification of balance
8We do not consider off-balance sheet activities, which were insignificant in Russia for most of the investigated period.
Table 1. Description of the Development of the Main Variables (in mill. rubles)
Year
N of bank-
quarter obs.
Total assets Capital Loans to nonbanks Deposits of nonbanks
Mean Sum Mean Sum Mean Sum Mean Sum
1999 3,302 1,086.6 896,958 147.5 121,789 377.8 311,835 608.1 501,9682000 3,411 1,704.3 1,453,383 262.0 223,463 658.7 561,678 947.6 808,0712001 3,498 2,454.9 2,146,782 403.9 353,218 1,101.0 962,860 1,349.9 1,180,5122002 3,519 3,335.3 2,925,000 554.5 487,863 1,651.3 1,452,692 1,886.5 1,659,6672003 3,626 4,526.9 4,100,000 676.4 613,180 2,312.9 2,096,638 2,608.3 2,364,3852004 3,649 5,957.5 5,425,000 814.5 743,043 3,425.1 3,125,000 3,519.2 3,200,0002005 3,675 8,239.4 7,575,000 1,069.5 982,563 4,908.6 4,500,000 5,038.6 4,625,0002006 3,137 13,584.6 10,650,000 1,543.8 1,210,687 8,390.5 6,575,000 8,374.7 6,575,0002007 3,427 18,830.5 16,125,000 2,43 6.1 2,087,157 11,844.3 10,150,000 11 581.7 9,925,0002008 3,396 26,340.8 22,375,000 3,171.5 2,700,000 17,673.9 15,000,000 15,193.0 12,900,0002009 3,277 31,205.8 25,500,000 3,846.7 3,150,000 19,087.0 15,625,000 18,174.6 14,900,000
Dow
nloa
ded
by [
Uni
vers
ity o
f B
irm
ingh
am]
at 1
4:57
24
Sept
embe
r 20
13

290 EURASIAN GEOGRAPHY AND ECONOMICS
sheet items, and the third based on maturity. Tables 2–4 provide a detailed description of the items we used to calculate all three liquidity creation measures.
The first measure (LC1) is a gross indicator in line with Deep and Schaefer (2004). We do not use a detailed category or maturity classification of different balance sheet items here. Instead, the underlying assumption in the LC1 calculation is that we account for the most important categories of assets and liabilities that can be classed as liquid or illiquid (Table 2). Total deposits are regarded as liquid liabilities and capital as illiquid item. On the asset side, we assume total loans are illiquid assets, whereas current account and securities investment are liquid assets.
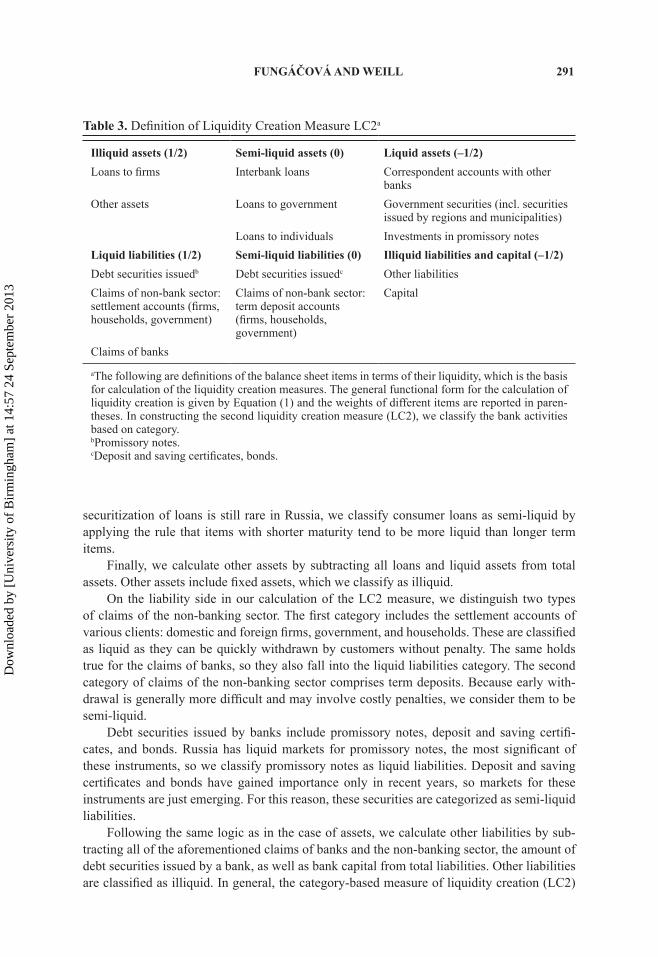
Our second measure of liquidity creation (LC2) is based on category classification of bal-ance sheet items (Table 3). In defining different categories of liquid, semi-liquid, and illiquid assets and liabilities, we follow the classification of Berger and Bouwman (2009) based on the ease, cost, and time necessary for banks to turn their obligations into liquid funds, and the ease, cost, and time customers need to withdraw liquid funds from their bank. We also take country-specific issues into account.
The liquid assets category in liquidity creation measure LC2 consists of (a) correspondent accounts with other banks (i.e. central bank, domestic, and foreign banks) (b) investments in government securities, and (c) investments in promissory notes. Investments in non-govern-ment securities are not included, as their values were quite low, especially in the first half of our observation period, when the selection of instruments was limited and Russia’s capital markets were still quite illiquid.9 Moreover, banks had little incentive to hold these securities; unlike government securities, it was impossible to use them as collateral when borrowing from the CBR.
In classification of loans, we follow the literature and classify corporate loans as illiquid assets, because banks generally lack the option of selling them to meet their liquidity needs. Categories of loans that include consumer loans, loans to government, and interbank loans are classified as semi-liquid assets. Mortgage loans are quite new to Russia; the majority of consumer loans are short-term loans used to buy consumer goods. Thus, even though
9Data on investments in non-government securities became available in 2004. When we recalculate liquidity creation measures using these new data, the trend for these measures does not change and is in line with our main results. The level of liquidity creation, however, decreases slightly, with the difference increasing toward the end of the observation period. On average, the difference between the mean ratios of liquidity creation measures to total assets with and without non-government securities is less than 10 percent. Detailed results for liquidity creation measures adjusted for non-government securities are available on request.
Table 2. Definition of Liquidity Creation Measure LC1a
illiquid assets (1/2) Liquid assets (–1/2)Total loans Correspondent accounts with other banks
Securities investmentsLiquid liabilities (1/2) illiquid liabilities and capital (–1/2)Total deposits Capital
aThe following are definitions of the balance sheet items in terms of their liquidity, which is the basis for calculation of the liquidity creation measures. The general functional form for the calculation of liquidity creation is given by Equation (1) and the weights of different items are reported in paren-theses. LC1 is a gross measure of liquidity creation, based on the rough liquidity characteristics of broad categories of financial terms.
Dow
nloa
ded
by [
Uni
vers
ity o
f B
irm
ingh
am]
at 1
4:57
24
Sept
embe
r 20
13
fUNGÁČOvÁ and WeiLL 291
securitization of loans is still rare in Russia, we classify consumer loans as semi-liquid by applying the rule that items with shorter maturity tend to be more liquid than longer term items.
Finally, we calculate other assets by subtracting all loans and liquid assets from total assets. Other assets include fixed assets, which we classify as illiquid.
On the liability side in our calculation of the LC2 measure, we distinguish two types of claims of the non-banking sector. The first category includes the settlement accounts of various clients: domestic and foreign firms, government, and households. These are classified as liquid as they can be quickly withdrawn by customers without penalty. The same holds true for the claims of banks, so they also fall into the liquid liabilities category. The second category of claims of the non-banking sector comprises term deposits. Because early with-drawal is generally more difficult and may involve costly penalties, we consider them to be semi-liquid.
Debt securities issued by banks include promissory notes, deposit and saving certifi-cates, and bonds. Russia has liquid markets for promissory notes, the most significant of these instruments, so we classify promissory notes as liquid liabilities. Deposit and saving certificates and bonds have gained importance only in recent years, so markets for these instruments are just emerging. For this reason, these securities are categorized as semi-liquid liabilities.
Following the same logic as in the case of assets, we calculate other liabilities by sub-tracting all of the aforementioned claims of banks and the non-banking sector, the amount of debt securities issued by a bank, as well as bank capital from total liabilities. Other liabilities are classified as illiquid. In general, the category-based measure of liquidity creation (LC2)
Table 3. Definition of Liquidity Creation Measure LC2a
illiquid assets (1/2) Semi-liquid assets (0) Liquid assets (–1/2)Loans to firms Interbank loans Correspondent accounts with other
banksOther assets Loans to government Government securities (incl. securities
issued by regions and municipalities)Loans to individuals Investments in promissory notes
Liquid liabilities (1/2) Semi-liquid liabilities (0) illiquid liabilities and capital (–1/2)Debt securities issuedb Debt securities issuedc Other liabilitiesClaims of non-bank sector: settlement accounts (firms, households, government)
Claims of non-bank sector: term deposit accounts (firms, households, government)
Capital
Claims of banks
aThe following are definitions of the balance sheet items in terms of their liquidity, which is the basis for calculation of the liquidity creation measures. The general functional form for the calculation of liquidity creation is given by Equation (1) and the weights of different items are reported in paren-theses. In constructing the second liquidity creation measure (LC2), we classify the bank activities based on category. bPromissory notes.cDeposit and saving certificates, bonds.
Dow
nloa
ded
by [
Uni
vers
ity o
f B
irm
ingh
am]
at 1
4:57
24
Sept
embe
r 20
13

292 EURASIAN GEOGRAPHY AND ECONOMICS
can be expected to be reasonably accurate under the assumption that the categories of assets and liabilities outlined above are good indicators of the liquidity of bank activities.
Careful inspection of the balance sheet information of all the Russian banks in the sample reveals detailed breakdown reporting based on maturity for certain items. This maturity-based information, in turn, helps us define liquidity creation more precisely. Indeed, Berger and Bouwman (2009) preferred maturity-based liquidity creation measures. We thus use maturity information to construct our third liquidity creation measure (LC3). On the asset side, the only available data are for maturity of interbank loans (Table 4). Thus, the classification of assets is similar to what we employ for LC2. However, all interbank loans are not included in the semi-liquid category anymore. Here, the data enable us to distinguish between interbank loans with maturities of less than seven days, between one week and a year, and the remain-der. Loans with maturities of less than seven days are considered liquid assets. Interbank loans with maturities of over a year and nonperforming interbank loans are classified as illiq-uid. All other interbank loans are considered semi-liquid assets.
Classification of liabilities for the LC3 calculation is solely based on maturity. We apply the general principle that items with shorter maturities are more liquid, as they self-liquidate sooner. Based on our data, we distinguish among liabilities with maturities shorter than 90 days, between 90 days and a year, and the rest. Term deposits and debt securities that have maturities shorter than 90 days are classified as liquid liabilities. We also consider current and correspondent accounts as liquid liabilities. Liabilities with maturities between 90 days and a year belong to the semi-liquid category. Liabilities that have maturities over one year, overdue liabilities, and liabilities with uncertain terms to maturity are classified as illiquid. As in the case of LC2, bank capital is treated as illiquid item.
Table 4. Definitions of Liquidity Creation Measure LC3a
illiquid assets (1/2) Semi-liquid assets (0) Liquid assets (–1/2)
Interbank loans (maturity more than one year, non-performing interbank loans)
Interbank loans (maturity more than a week and less than one year)
Interbank loans (maturity less than one week)
Loans to firms Loans to government Correspondent accounts with other banks
Other assets Loans to individuals Government securities (incl. securities issued by regions and municipalities)
Investments in promissory notes
Liquid liabilities (1/2) Semi-liquid liabilities (0) illiquid liabilities and capital (–1/2)
Liabilities with maturity lower than 90 days
Liabilities (term deposits and debt securities) with maturity less than one year
Liabilities (term deposits, debt securities) with maturity more than one year and overdue liabilities and liabili-ties with uncertain term to maturity
Current and corresponding accounts
Capital
aThe following are definitions of the balance sheet items in terms of their liquidity, which is the basis for calculation of the liquidity creation measures. The general functional form for the calculation of liquidity creation is given by Equation (1) and the weights of different items are reported in paren-theses. LC3 is based on category and maturity (information nested in financial-term categories).
Dow
nloa
ded
by [
Uni
vers
ity o
f B
irm
ingh
am]
at 1
4:57
24
Sept
embe
r 20
13

fUNGÁČOvÁ and WeiLL 293
RESULTS
This section is devoted to the presentation of our results. We first display the general results for all banks, then subdivide the data according to bank ownership and bank size, and provide results for the subgroups.
General Results
This section of the paper measures how much liquidity Russian banks created in the observation period and analyze how the process of liquidity creation changed over time. First, we study the overall liquidity creation of the Russian banking industry to assess the impor-tance of liquidity creation to the Russian economy. We then analyze the ratios of liquid-ity creation to total bank assets, which provide complementary information on the liquidity creation behavior of banks. Expansion of overall liquidity creation can be driven solely by financial development, whereas an increase in liquidity creation relative to assets indicates a change in bank behavior. These ratios also allow us to compare liquidity creation behavior of different types of banks and avoid assigning excessive weight to large banks.
Table 5 provides the results of overall liquidity created by banks every year from 1999 to 2009 for all three liquidity creation measures. A brief glance across all three measures shows that liquidity creation skyrocketed during the sample period. From 1999 to 2009, overall liquidity creation in real terms increased 65 times according to LC1, 75 times for LC2, and 32 times for LC3. To be fair, these figures should be framed in the context of Russia’s financial sector development in general, and the rise of the banking system in particular. The ratio of banking sector assets to GDP more than doubled between 1999 and 2009, while the credit-to-GDP ratio increased fourfold during the period.
The expansion slows markedly during the financial crisis, yet our liquidity creation measures still increased during 2008 and 2009, when growth of liquidity creation is only 15 percent for LC1, 20 percent for LC2, and 2 percent for LC3. In contrast, average annual
Table 5. Total Liquidity Creation Measures (in mill. rubles)
Year N of bank-quarter observations LC1 LC2 LC3
1999 3,302 237,056.2 125,907.0 98,415.52000 3,411 465,791.6 273,744.2 234,283.12001 3,498 742,973.2 466,681.9 375,203.42002 3,519 1,175,272.6 773,521.7 536,684.82003 3,626 1,749,039.7 1,231,604.0 722,728.32004 3,649 2,663,384.1 1,739,720.0 840,819.22005 3,675 4,080,252.5 2,502,254.3 1,100,098.72006 3,137 6,169,724.8 3,761,467.9 2,158,610.12007 3,427 9,204,647.0 5,339,588.9 2,680,965.12008 3,396 13,459,841.1 7,899,382.2 3,067,078.62009 3,277 15,487,132.4 9,489,889.7 3,125,000.0
Dow
nloa
ded
by [
Uni
vers
ity o
f B
irm
ingh
am]
at 1
4:57
24
Sept
embe
r 20
13
294 EURASIAN GEOGRAPHY AND ECONOMICS
growth of these measures for the period between 1999 and 2008 was 60 percent for LC1 and LC2, and 50 percent for LC3.
The amount of liquidity created by Russian banks in 2009 was 15.5 trillion rubles ($512 billion) for LC1, 9.5 trillion rubles ($314 billion) for LC2, and 3.2 trillion rubles ($103 bil-lion) for LC3. When we compare these figures as ratios to GDP, these ratios are smaller than those observed for the United States by Berger and Bouwman (2009).10 Thus there is vast room for further growth for Russian banking.
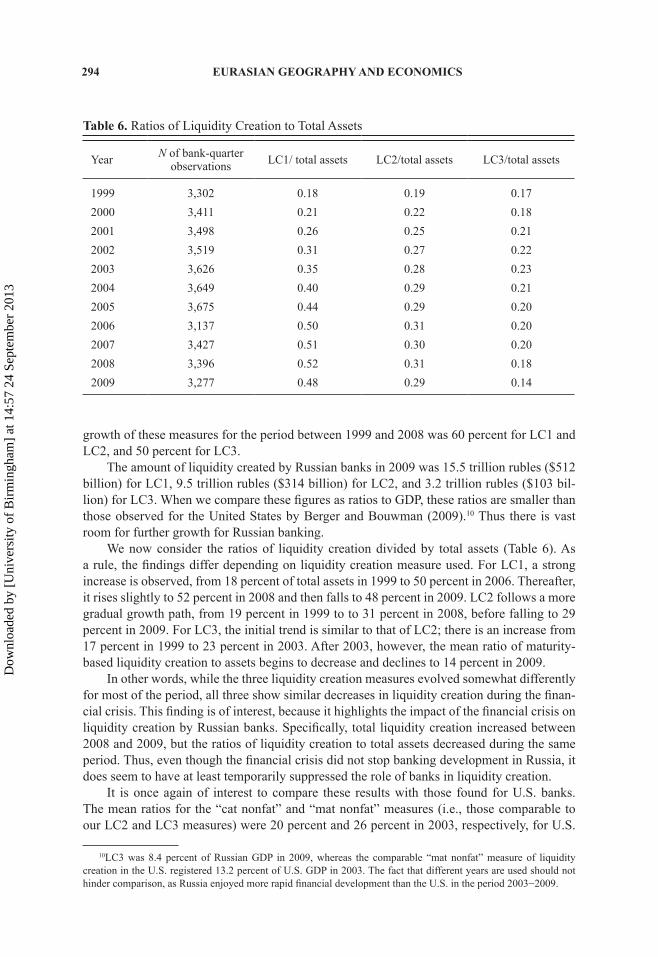
We now consider the ratios of liquidity creation divided by total assets (Table 6). As a rule, the findings differ depending on liquidity creation measure used. For LC1, a strong increase is observed, from 18 percent of total assets in 1999 to 50 percent in 2006. Thereafter, it rises slightly to 52 percent in 2008 and then falls to 48 percent in 2009. LC2 follows a more gradual growth path, from 19 percent in 1999 to to 31 percent in 2008, before falling to 29 percent in 2009. For LC3, the initial trend is similar to that of LC2; there is an increase from 17 percent in 1999 to 23 percent in 2003. After 2003, however, the mean ratio of maturity-based liquidity creation to assets begins to decrease and declines to 14 percent in 2009.
In other words, while the three liquidity creation measures evolved somewhat differently for most of the period, all three show similar decreases in liquidity creation during the finan-cial crisis. This finding is of interest, because it highlights the impact of the financial crisis on liquidity creation by Russian banks. Specifically, total liquidity creation increased between 2008 and 2009, but the ratios of liquidity creation to total assets decreased during the same period. Thus, even though the financial crisis did not stop banking development in Russia, it does seem to have at least temporarily suppressed the role of banks in liquidity creation.
It is once again of interest to compare these results with those found for U.S. banks. The mean ratios for the “cat nonfat” and “mat nonfat” measures (i.e., those comparable to our LC2 and LC3 measures) were 20 percent and 26 percent in 2003, respectively, for U.S.
10LC3 was 8.4 percent of Russian GDP in 2009, whereas the comparable “mat nonfat” measure of liquidity creation in the U.S. registered 13.2 percent of U.S. GDP in 2003. The fact that different years are used should not hinder comparison, as Russia enjoyed more rapid financial development than the U.S. in the period 2003−2009.
Table 6. Ratios of Liquidity Creation to Total Assets
Year N of bank-quarter observations LC1/ total assets LC2/total assets LC3/total assets
1999 3,302 0.18 0.19 0.172000 3,411 0.21 0.22 0.182001 3,498 0.26 0.25 0.212002 3,519 0.31 0.27 0.222003 3,626 0.35 0.28 0.232004 3,649 0.40 0.29 0.212005 3,675 0.44 0.29 0.202006 3,137 0.50 0.31 0.202007 3,427 0.51 0.30 0.202008 3,396 0.52 0.31 0.182009 3,277 0.48 0.29 0.14
Dow
nloa
ded
by [
Uni
vers
ity o
f B
irm
ingh
am]
at 1
4:57
24
Sept
embe
r 20
13
fUNGÁČOvÁ and WeiLL 295
banks (Berger and Bouwman, 2009) and 28 percent and 23 percent for Russia in 2009. As a result, unlike the situation with respect to total liquidity creation, we find no significant gap between the U.S. and Russian banks in terms of the mean ratios of liquidity creation to total bank assets. Although the findings indicate that Russian banks did not create less liquidity relative to their assets, they highlight the low level of total banking assets. This confirms find-ings of previous studies, to the effect that Russia’s banking sector is small relative to the size of its economy (e.g., Barisitz, 2008). In other words, Russian authorities need not focus on increasing liquidity creation so much as promoting conditions that will expand the banking sector as a whole.
Results by Ownership Type
The Russian banking sector consists of state-controlled, private domestic-owned, and private foreign-owned banks. Unlike most transitional countries today, state-controlled banks still play significant role in Russia. As noted above, foreign-owned banks accounted for over 20 percent of the sector’s capital at the end of 2011. This unusual structure of ownership in the banking industry allows us to ask whether the mode of ownership might influence liquidity creation. For example, if different types of bank owners pursue different business strategies in setting interest margins (Fungáčová and Poghosyan, 2011), this might be reflected in their liquidity creation measures.
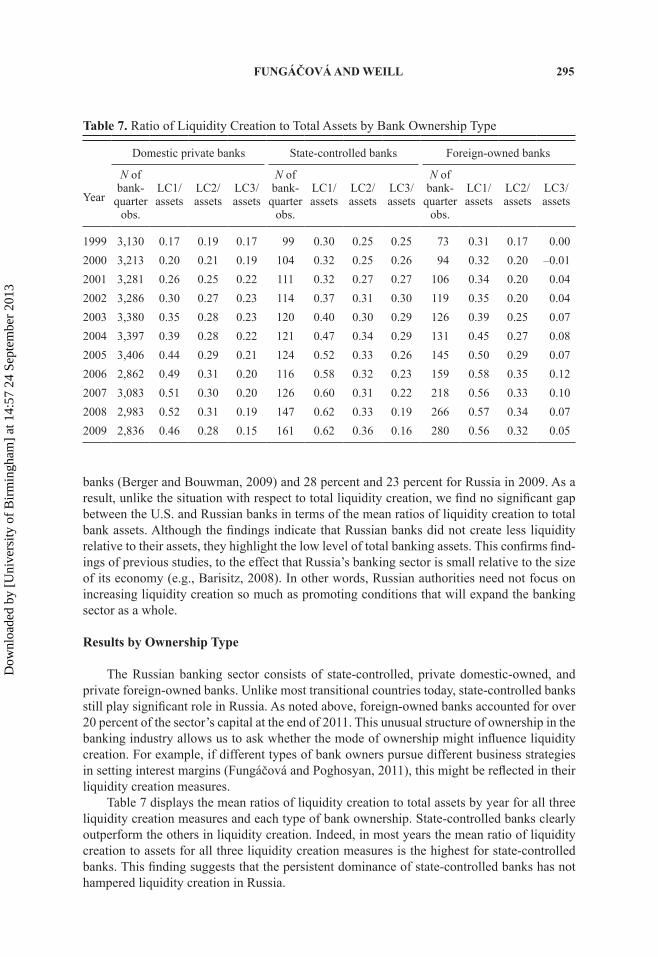
Table 7 displays the mean ratios of liquidity creation to total assets by year for all three liquidity creation measures and each type of bank ownership. State-controlled banks clearly outperform the others in liquidity creation. Indeed, in most years the mean ratio of liquidity creation to assets for all three liquidity creation measures is the highest for state-controlled banks. This finding suggests that the persistent dominance of state-controlled banks has not hampered liquidity creation in Russia.
Table 7. Ratio of Liquidity Creation to Total Assets by Bank Ownership Type
Domestic private banks State-controlled banks Foreign-owned banks
Year
N of bank-
quarter obs.
LC1/ assets
LC2/ assets
LC3/ assets
N of bank-
quarter obs.
LC1/ assets
LC2/ assets
LC3/ assets
N of bank-
quarter obs.
LC1/ assets
LC2/ assets
LC3/ assets
1999 3,130 0.17 0.19 0.17 99 0.30 0.25 0.25 73 0.31 0.17 0.002000 3,213 0.20 0.21 0.19 104 0.32 0.25 0.26 94 0.32 0.20 –0.012001 3,281 0.26 0.25 0.22 111 0.32 0.27 0.27 106 0.34 0.20 0.042002 3,286 0.30 0.27 0.23 114 0.37 0.31 0.30 119 0.35 0.20 0.042003 3,380 0.35 0.28 0.23 120 0.40 0.30 0.29 126 0.39 0.25 0.072004 3,397 0.39 0.28 0.22 121 0.47 0.34 0.29 131 0.45 0.27 0.082005 3,406 0.44 0.29 0.21 124 0.52 0.33 0.26 145 0.50 0.29 0.072006 2,862 0.49 0.31 0.20 116 0.58 0.32 0.23 159 0.58 0.35 0.122007 3,083 0.51 0.30 0.20 126 0.60 0.31 0.22 218 0.56 0.33 0.102008 2,983 0.52 0.31 0.19 147 0.62 0.33 0.19 266 0.57 0.34 0.072009 2,836 0.46 0.28 0.15 161 0.62 0.36 0.16 280 0.56 0.32 0.05
Dow
nloa
ded
by [
Uni
vers
ity o
f B
irm
ingh
am]
at 1
4:57
24
Sept
embe
r 20
13

296 EURASIAN GEOGRAPHY AND ECONOMICS
The ranking of domestic private banks and foreign banks differs with the liquidity creation measure. The mean liquidity creation ratios are generally higher for foreign banks for the LC1 and LC2 measures, whereas the opposite opposing result prevails for LC3 (foreign banks have the lowest ratios of liquidity creation to assets here).
The analysis of the evolution of liquidity creation shows quite similar trends for all types of banks with a notable exception: liquidity creation of state-controlled banks during the crisis. For LC1, a strong expansion between 1999 and 2008 for all ownership types is fol-lowed by a reduction between 2008 and 2009 for domestic private and foreign-owned banks. State-controlled banks exhibited a constant liquidity creation ratio during the last two years of our sample period. The period of liquidity creation expansion under the LC2 and LC3 mea-sures lasts until 2003, and is followed by a stagnation of liquidity creation through 2008 for all ownership types. The end of the sample period is marked by a decrease of mean liquidity creation ratios for private domestic-owned and foreign-owned banks. State-controlled banks experienced a smaller decrease in LC3 than domestic private banks and experienced relative improvement in LC2.
By two liquidity creation measures, state-controlled banks did not decrease liquidity creation during the crisis. This likely reflects the fact that state-controlled banks typically become the main loan-providers during a crisis (Fungáčová et al., 2011) and supports the argument that the presence of state-controlled banks can be beneficial for liquidity creation.
Results by Size
The Russian banking sector consists of about 1,000 banks that range vastly in size. Given that studies on liquidity creation in the U.S. note significant differences in liquidity creation of banks depending on size, it seems prudent to examine whether bank size exerts an influence on liquidity creation in Russia. If size does matter, then we must also ask whether the large number of small banks in Russia restrains the creation of liquidity for the economy.
We consider three size classes of Russian banks based on their ranking by total assets. As noted previously, large banks are defined as Russia’s top 50 banks by total assets, medium-sized banks the next 150 banks, and small banks all others. Table 8 displays the yearly results for each size class, presenting the ratios of the three liquidity creation measures to total assets.
The mean ratios for LC1 and LC2 exhibit a similar pattern for each size class. Large banks are the biggest liquidity creators. The mean ratios for liquidity creation to assets over the period are 55 percent for large banks, 47 percent for medium banks, and 34 percent for small banks using LC1, and 39, 34, and 25 percent, respectively, for LC2. Large banks clearly contribute more to liquidity creation than other banks.
Liquidity creation measured using LC1 rises steadily until the financial crisis hits. This observation holds true for all sizes of banks, but the magnitude of the shock decreases with the size of the bank—i.e. the reduction in the mean ratio of liquidity creation to assets between 2008 and 2009 was 3 percentage points for large banks, 4 percentage points for medium-sized banks, and 5 percentage points for small banks. The second liquidity creation measure exhib-its growth in the first part of our time period, but after 2006 stagnates and similar to LC1 there was a decrease caused by the crisis but only for medium and small banks. Indeed a reduc-tion of 2 points in liquidity creation ratios is observed on average between 2008 and 2009, whereas liquidity creation ratios are constant for large banks.
The findings for LC1 and LC2 require reassessment upon examination of the LC3 measure. Indeed, even the ordering of the size groups changes over time for LC3. The mean
Dow
nloa
ded
by [
Uni
vers
ity o
f B
irm
ingh
am]
at 1
4:57
24
Sept
embe
r 20
13

fUNGÁČOvÁ and WeiLL 297
ratio of LC3 liquidity creation to total assets was growing for all the banks between 1999 and 2003, with large banks exhibiting the highest values of this ratio relative to medium and small banks. Then, between 2004 and 2009, medium banks overtook large banks, and in the last two years included in our sample (2008 and 2009) even small banks attained higher ratios than the large banks. Thus, the evidence in favor of higher liquidity creation of large banks is ambiguous when considering the LC3 measure.
It is of interest to observe that our findings accord with those obtained by Berger and Bouwman (2009) for U.S. banks. They found that liquidity creation increased with bank size using their “cat nonfat” measure (comparable to our LC2), but the results obtained with their “mat nonfat” measure (comparable to our LC3) show a different hierarchy in which more liquidity is created by medium-sized banks.
LC3 shows no improvement in liquidity creation over the period overall. There is a strong increase in the first half of the period and a large reduction in the second half, with the rate of decrease accelerating in 2009. Nevertheless, we can confirm one trend that pertains not just for LC1 and LC2 but also for LC3: small banks exhibit the sharpest decline in their liquidity creation ratio after the financial crisis. The mean ratios of liquidity creation to assets decreased by 3.8 percentage points for large banks, 3 percentage points for medium-sized banks, and 4.1 percentage points for small banks between 2008 and 2009.
Two main conclusions are evident. Large banks (a) are the biggest liquidity creators and (b) show greater resilience in liquidity creation during crises. Both support the view that larger bank size should be promoted by authorities if their objective is to support liquidity creation by banks.
CONCLUSION
Liquidity creation by banks is crucial for any economy, and Russia is no exception. This study considers measures of liquidity creation for Russian banks during the 2000s to shed
Table 8. Ratios of Liquidity Creation to Total Assets by Bank Size
Size rank: Top 50 51–200 201 and smaller
Year LC1/ assets
LC2/ assets
LC3/ assets
LC1/ assets
LC2/ assets
LC3/ assets
LC1/ assets
LC2/ assets
LC3/ assets
1999 0.43 0.35 0.23 0.27 0.23 0.18 0.14 0.16 0.162000 0.42 0.32 0.23 0.30 0.26 0.21 0.18 0.20 0.182001 0.45 0.35 0.25 0.34 0.29 0.23 0.23 0.23 0.212002 0.47 0.38 0.29 0.40 0.33 0.25 0.28 0.25 0.212003 0.49 0.41 0.28 0.44 0.35 0.26 0.32 0.26 0.222004 0.54 0.41 0.24 0.50 0.37 0.26 0.37 0.26 0.202005 0.60 0.40 0.21 0.53 0.37 0.24 0.41 0.26 0.192006 0.63 0.41 0.22 0.59 0.40 0.25 0.47 0.28 0.192007 0.66 0.41 0.20 0.62 0.39 0.22 0.48 0.28 0.192008 0.69 0.41 0.16 0.62 0.39 0.20 0.49 0.28 0.182009 0.66 0.41 0.12 0.58 0.37 0.17 0.44 0.26 0.14
Dow
nloa
ded
by [
Uni
vers
ity o
f B
irm
ingh
am]
at 1
4:57
24
Sept
embe
r 20
13

298 EURASIAN GEOGRAPHY AND ECONOMICS
light on the importance of bank liquidity creation and to analyze how recent financial crises have affected it.
We find that the level of bank liquidity creation is much lower in Russia than in the United States. Indeed, liquidity creation volumes in Russia represent only a fraction of those observed by Berger and Bouwman (2009) in their study of U.S. banking. However, ratios relat-ing liquidity creation to total bank assets are of the same order of magnitude in both Russia and the United States. This finding highlights the fact that the overall low level of financial development in Russia is the cause of low liquidity creation, not the reluctance of Russian banks to perform liquidity-creating functions. Indeed, the rapid increase in liquidity creation during our study period confirms this observation, as liquidity creation has increased in tan-dem with the expansion of the banking sector and its activities. This development, however, was arrested by the global financial crisis, as it reduced liquidity creation of Russian banks (as reflected in a decrease in ratios of liquidity creation to assets). This negative trend might continue given the liquidity crunch Russian banks have been facing due to increased global economic uncertainty (especially in the Eurozone) since autumn 2011. This tightened liquid-ity situation partly reflects changes in Russia’s foreign exchange policy that have contributed to a decrease in excess ruble liquidity in the domestic market, but is also determined by the greater difficulties experienced by Russian banks in accessing funding from international markets. Despite the support provided to banks by the CBR, the current liquidity squeeze could result in reduced liquidity creation by banks in Russia, and bears careful monitoring.
When analyzing the ratios of liquidity creation to assets, we have observed major dif-ferences in liquidity creation across bank ownership types and size classes. State-controlled banks create more liquidity than their foreign and domestic private counterparts, and were also less affected by the financial crisis. In terms of size, large banks contribute the most to liquidity creation. Conversely, the detrimental impacts of the financial crisis were felt more acutely by small banks than large banks. To a certain extent, these results reflect the simple fact that state-controlled banks are on average larger than other banks in Russia.
The normative implications of our findings are that the preservation of state ownership of banks is not detrimental to liquidity creation, and that the consolidation of the Russian bank-ing industry through mergers to increase bank size would likely promote liquidity creation. Future research might include analyses of the relationship between liquidity creation and financial stability or economic growth. Such work would contribute to our understanding of the benefits of liquidity creation.
REfERENCES
Åslund, a., “Exchange Rate Policy and the Central and East European Financial Crisis,” Eurasian Geography and Economics, 52, 3:375–389, 2011.
Barisitz, S., Banking in Central and Eastern Europe 1980–2006. Routledge, London, 2008.Berger, a. and C. Bouwman, “Bank Liquidity Creation,” Review of Financial Studies, 22, 9:3779–
3837, 2009Berger, a., C. Bouwman, T. Kick, and K. Schaeck, (2010). Bank Liquidity Creation and Risk Taking
During Distress. Frankfurt, Germany: Deutsche Bundesbank Discussion Paper 05/2010, 2010.CBR (Central Bank of the Russian Federation), Review of the Banking Sector of the Russian Federa-
tion, 2012 (various issues).darvas, Z., “Exchange Rate Policy and Economic Growth after the Financial Crisis,” Eurasian Geog-
raphy and Economics, 52, 3:390–408, 2011.deep, a. and G. Schaefer, Are Banks Liquidity Transformers? Cambridge, MA: Harvard University,
John F. Kennedy School of Government, Working Paper, 2004.
Dow
nloa
ded
by [
Uni
vers
ity o
f B
irm
ingh
am]
at 1
4:57
24
Sept
embe
r 20
13

fUNGÁČOvÁ and WeiLL 299
Fungáčová, Z., R. Herrala, and L. Weill, The Influence of Bank Ownership on Credit Supply: Evidence from the Recent Financial Crisis. Helsinki, Finland: Bank of Finland, BOFIT Discussion Papers 34/2011, 2011.
Fungáčová, Z. and T. Poghosyan, “Determinants of Bank Interest Margins in Russia: Does Bank Ownership Matter?,” Economic Systems, 35, 4:481–495, 2011.
Fungáčová, Z. and L. Solanko, The Russian Banking Industry after the Financial Crisis—Where to Next? Helsinki, Finland: Bank of Finland, Bank of Finland Bulletin 2/2009, 2009.
Fungáčová, Z., L. Weill, and M. Zhou, Bank Capital, Liquidity Creation and Deposit Insurance. Helsinki, Finland: Bank of Finland, BOFIT Discussion Papers 17/2010, 2010.
Gaddy, C. G. and B. W. ickes, “Russia after the Global Financial Crisis,” Eurasian Geography and Economics, 51, 3:281–311, 2010.
iosebashvili, i., “Russian Banks May See Liquidity Pressure in ‘12—Moody’s,” Wall Street Journal, February 7, 2012 [http://online.wsj.com/article/BT-CO-20120207-709991.html], accessed March 21, 2012.
Karas, a. and K. Schoors, Heracles or Sisyphus? Finding, Cleaning and Reconstructing a Database of Russian Banks. Ghent, Belgium: Ghent University, Faculty of Economics and Business Admin-istration, Working Paper 05/327, 2005.
Karas, a., K. Schoors, and L. Weill, “Are Private Banks More Efficient than Public Banks? Evidence from Russia,” Economics of Transition, 18, 1:209–244, 2010.
Pana, e., J. Park, and T. Query, “The Impact of Bank Mergers on Liquidity Creation,” Journal of Risk Management in Financial Institutions, 4, 1:74–96, 2010.
Rauch, C., S. Steffen, a. Hackethal, and M. Tyrell, Determinants of Bank Liquidity Creation. Work-ing Paper, 2010 [http://ssrn.com/abstract=1343595], last accessed March 29, 2012.
“Russian Banks: Liquidity Problems or Not?,” RT.com, October 13, 2011 [http://rt.com/business/news/russia-banking-liquidity-crisis-793/], accessed March 21, 2012.
Smith, a. and a. Swain, “The Global Economic Crisis, Eastern Europe, and the Former Soviet Union: Models of Development and the Contradictions of Internationalization,” Eurasian Geography and Economics, 51, 1:1–34, 2010.
Vernikov, a., Russian Banking: The State Makes a Comeback. Helsinki, Finland: Bank of Finland, BOFIT Discussion Papers 24/2009, 2009.
Walsh, S., “Moody’s Warns of Eurozone Impact on Russian Banks,” Financial News, October 12, 2011 [http://www.efinancialnewx.com/story/2011-10-12/], accessed March 21, 2012.
World Bank, World Development Indicators 2010. Washington, DC: World Bank, 2010.
Dow
nloa
ded
by [
Uni
vers
ity o
f B
irm
ingh
am]
at 1
4:57
24
Sept
embe
r 20
13