bank handlowy w warszawie s.a. may 13, 2016 1q ... · 1q consolidated financial results . 2...
TRANSCRIPT
1
May 13, 2016
www.citihandlowy.pl
Bank Handlowy w Warszawie S.A.
Bank Handlowy w Warszawie S.A.
1Q consolidated financial results
2
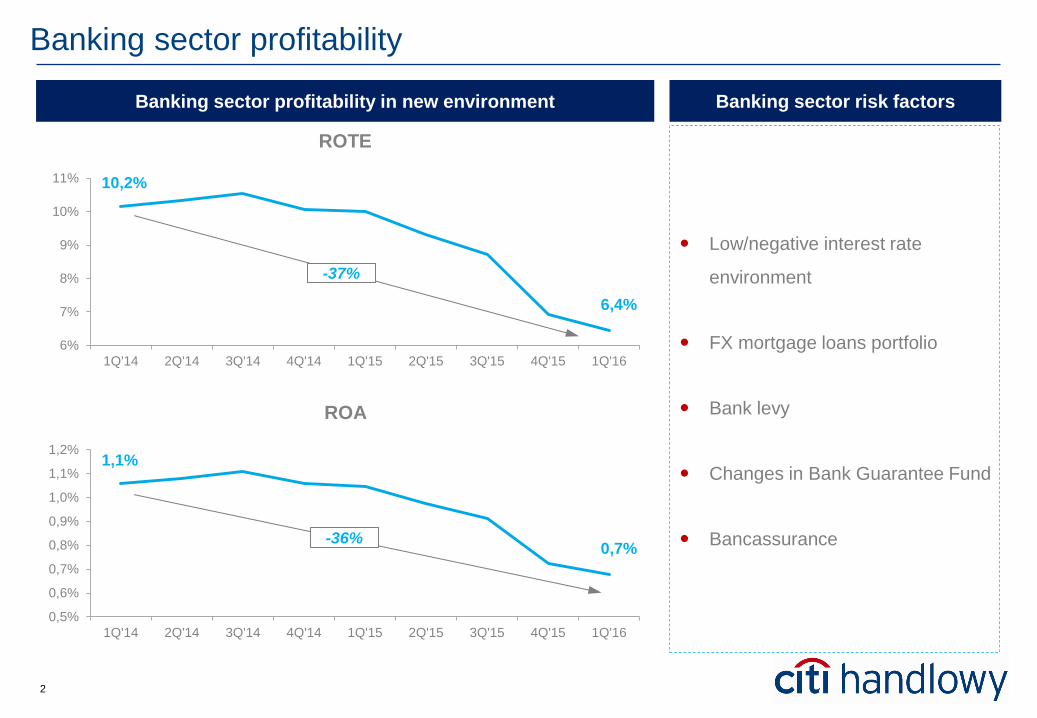
Low/negative interest rate
environment
FX mortgage loans portfolio
Bank levy
Changes in Bank Guarantee Fund
Bancassurance
Banking sector profitability
Banking sector profitability in new environment Banking sector risk factors
10,2%
6,4%
6%
7%
8%
9%
10%
11%
1Q'14 2Q'14 3Q'14 4Q'14 1Q'15 2Q'15 3Q'15 4Q'15 1Q'16
ROTE
-37%
1,1%
0,7%
0,5%
0,6%
0,7%
0,8%
0,9%
1,0%
1,1%
1,2%
1Q'14 2Q'14 3Q'14 4Q'14 1Q'15 2Q'15 3Q'15 4Q'15 1Q'16
ROA
-36%
3
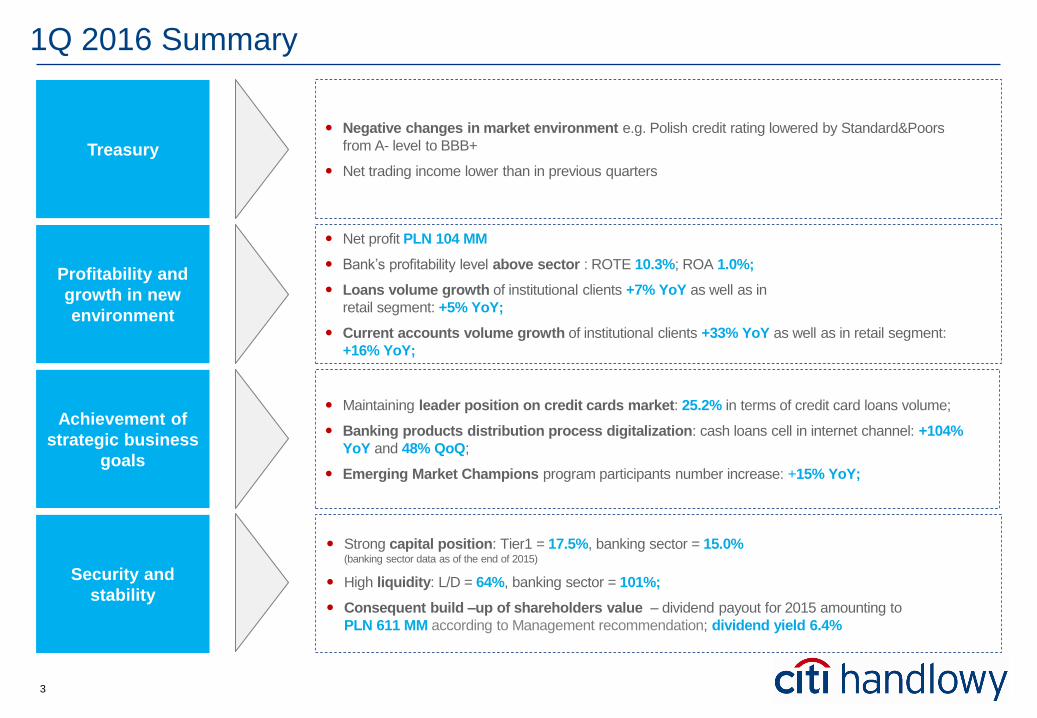
Maintaining leader position on credit cards market: 25.2% in terms of credit card loans volume;
Banking products distribution process digitalization: cash loans cell in internet channel: +104%
YoY and 48% QoQ;
Emerging Market Champions program participants number increase: +15% YoY;
Strong capital position: Tier1 = 17.5%, banking sector = 15.0% (banking sector data as of the end of 2015)
High liquidity: L/D = 64%, banking sector = 101%;
Consequent build –up of shareholders value – dividend payout for 2015 amounting to
PLN 611 MM according to Management recommendation; dividend yield 6.4%
Net profit PLN 104 MM
Bank’s profitability level above sector : ROTE 10.3%; ROA 1.0%;
Loans volume growth of institutional clients +7% YoY as well as in
retail segment: +5% YoY;
Current accounts volume growth of institutional clients +33% YoY as well as in retail segment:
+16% YoY;
1Q 2016 Summary
Profitability and
growth in new
environment
Achievement of
strategic business
goals
Security and
stability
Treasury
Negative changes in market environment e.g. Polish credit rating lowered by Standard&Poors
from A- level to BBB+
Net trading income lower than in previous quarters
4
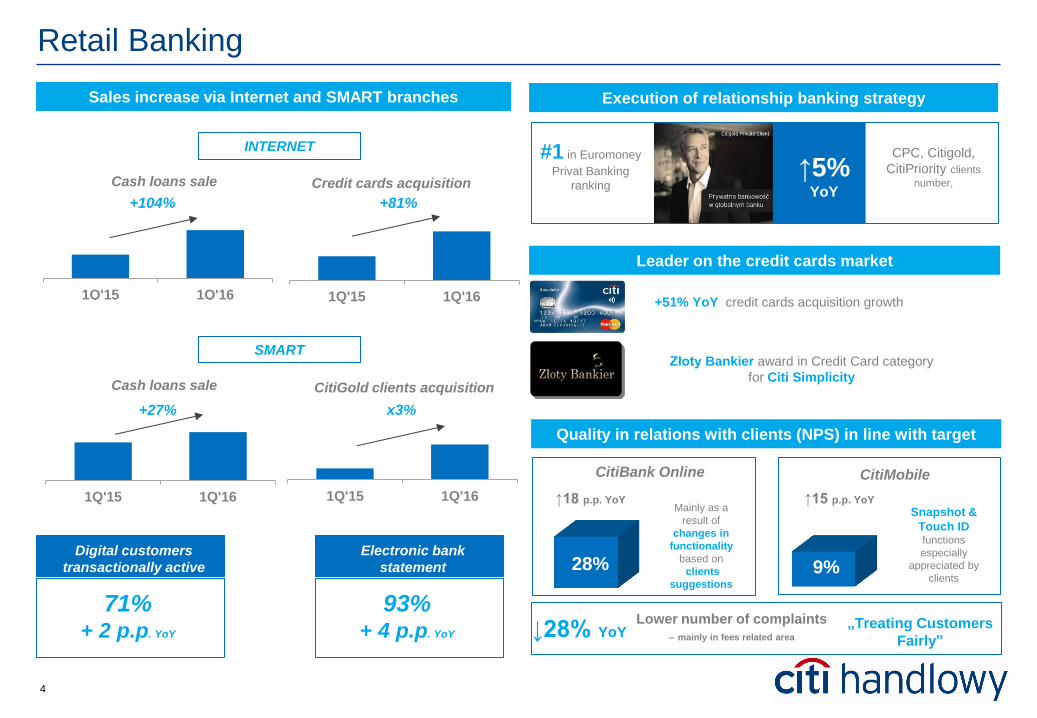
28%
Retail Banking
Quality in relations with clients (NPS) in line with target
1Q'15 1Q'16
Cash loans sale
1Q'15 1Q'16
Credit cards acquisition
+81%
* W stosunku do transakcji
bankowych ogółem
** W stosunku do wszystkich
klientów aktywnie
transakcyjnych
CitiBank Online
9%
↓28% YoY
Digital customers
transactionally active
↑18 p.p. YoY
CitiMobile
↑15 p.p. YoY Mainly as a
result of
changes in
functionality
based on
clients
suggestions
Snapshot &
Touch ID
functions
especially
appreciated by
clients
„Treating Customers
Fairly”
Sales increase via Internet and SMART branches
+104%
1Q'15 1Q'16
CitiGold clients acquisition
x3%
71% + 2 p.p. YoY
Lower number of complaints
– mainly in fees related area
1Q'15 1Q'16
+27%
Cash loans sale
INTERNET
SMART
Electronic bank
statement
93% + 4 p.p. YoY
Execution of relationship banking strategy
Leader on the credit cards market
↑5% YoY
CPC, Citigold,
CitiPriority clients
number,
#1 in Euromoney
Privat Banking
ranking
Złoty Bankier award in Credit Card category
for Citi Simplicity
+51% YoY credit cards acquisition growth
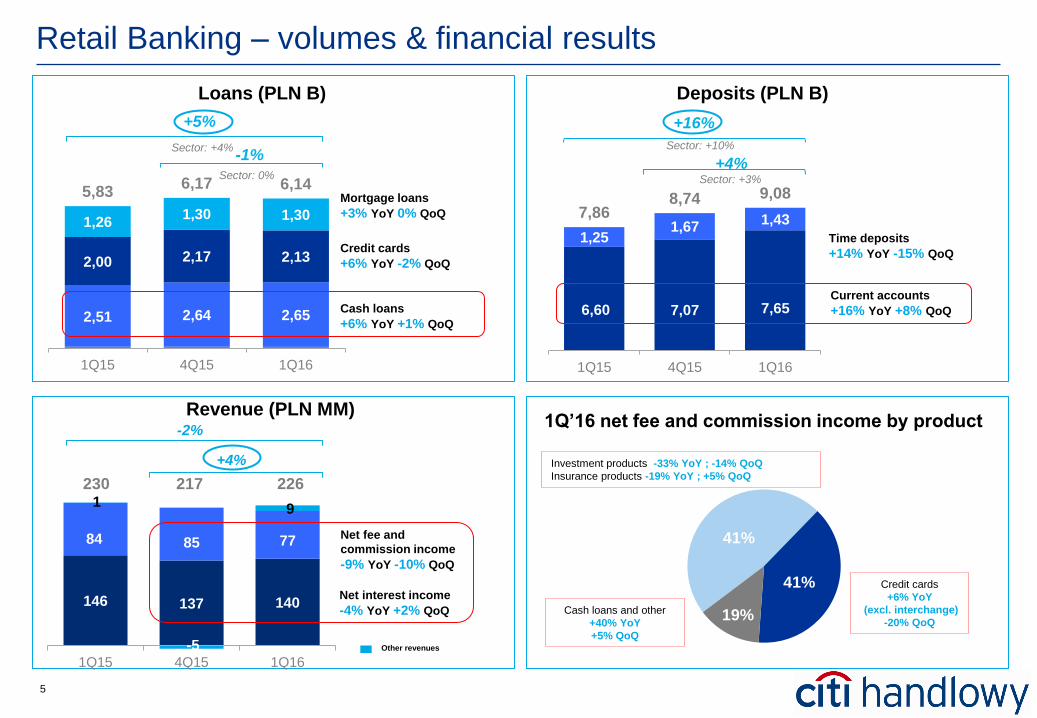
5
2,51 2,64 2,65
2,00 2,17 2,13
1,26 1,30 1,30
5,83 6,17 6,14
1Q15 4Q15 1Q16
+5%
-1%
41%
41%
19%
6,60 7,07 7,65
1,25 1,67
1,43 7,86 8,74 9,08
1Q15 4Q15 1Q16
+16%
+4%
Loans (PLN B)
Retail Banking – volumes & financial results
Revenue (PLN MM)
Current accounts
+16% YoY +8% QoQ
Time deposits
+14% YoY -15% QoQ
Deposits (PLN B)
Cash loans
+6% YoY +1% QoQ
Credit cards
+6% YoY -2% QoQ
Mortgage loans
+3% YoY 0% QoQ
1Q’16 net fee and commission income by product
Cash loans and other
+40% YoY
+5% QoQ
Investment products -33% YoY ; -14% QoQ
Insurance products -19% YoY ; +5% QoQ
Credit cards
+6% YoY
(excl. interchange)
-20% QoQ
+4%
-2%
146 137 140
84 85 77
1
-5
9
1Q15 4Q15 1Q16
Net interest income
-4% YoY +2% QoQ
Net fee and
commission income
-9% YoY -10% QoQ
230 217 226
Other revenues
Sector: +4%
Sector: 0%
Sector: +10%
Sector: +3%
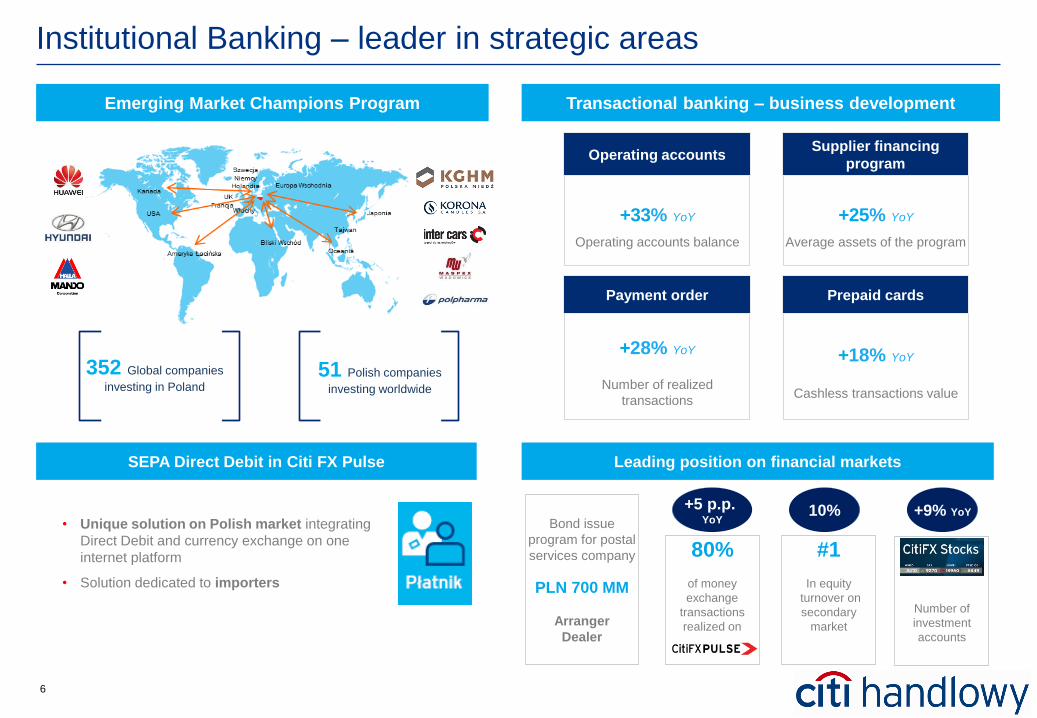
6
80%
of money
exchange
transactions
realized on
Institutional Banking – leader in strategic areas
Emerging Market Champions Program
+28% YoY
Number of realized
transactions
Payment order
Leading position on financial markets
51 Polish companies
investing worldwide
352 Global companies
investing in Poland
SEPA Direct Debit in Citi FX Pulse
• Unique solution on Polish market integrating
Direct Debit and currency exchange on one
internet platform
• Solution dedicated to importers
Transactional banking – business development
+25% YoY
Average assets of the program
Supplier financing
program
+33% YoY
Operating accounts balance
Operating accounts
10%
#1
In equity
turnover on
secondary
market
Number of
investment
accounts
+9% YoY +5 p.p.
YoY Bond issue
program for postal
services company
PLN 700 MM
Arranger
Dealer
+18% YoY
Cashless transactions value
Prepaid cards
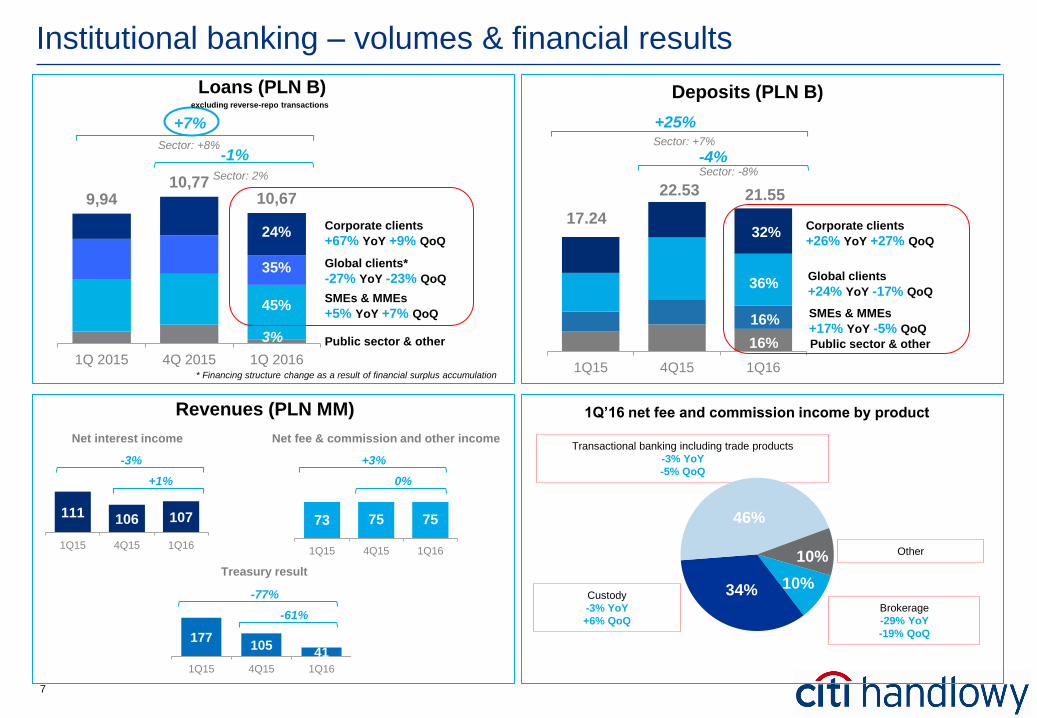
7
18%
16%
42%
24%
1Q15 4Q15 1Q16
9,94 10,77
10,67
1Q 2015 4Q 2015 1Q 2016
+7%
-1%
35%
24%
45%
3%
Sector: +8%
Sector: 2%
Institutional banking – volumes & financial results
111 106 107
1Q15 4Q15 1Q16
Revenues (PLN MM)
SMEs & MMEs
+5% YoY +7% QoQ
Corporate clients
+67% YoY +9% QoQ
Global clients*
-27% YoY -23% QoQ
Loans (PLN B)
Corporate clients
+26% YoY +27% QoQ
Global clients
+24% YoY -17% QoQ
SMEs & MMEs
+17% YoY -5% QoQ
+25%
Deposits (PLN B)
22.53
17.24
Public sector & other
-4%
Public sector & other
21.55
excluding reverse-repo transactions
32%
36%
16%
16%
1Q’16 net fee and commission income by product
Custody
-3% YoY
+6% QoQ
Brokerage
-29% YoY
-19% QoQ
Transactional banking including trade products
-3% YoY
-5% QoQ
10% 34%
46%
10%
73 75 75
1Q15 4Q15 1Q16
177 105
41
1Q15 4Q15 1Q16
Net fee & commission and other income Net interest income
Treasury result
+3%
0%
-3%
+1%
-77%
-61%
Sector: +7%
Sector: -8%
* Financing structure change as a result of financial surplus accumulation
Other
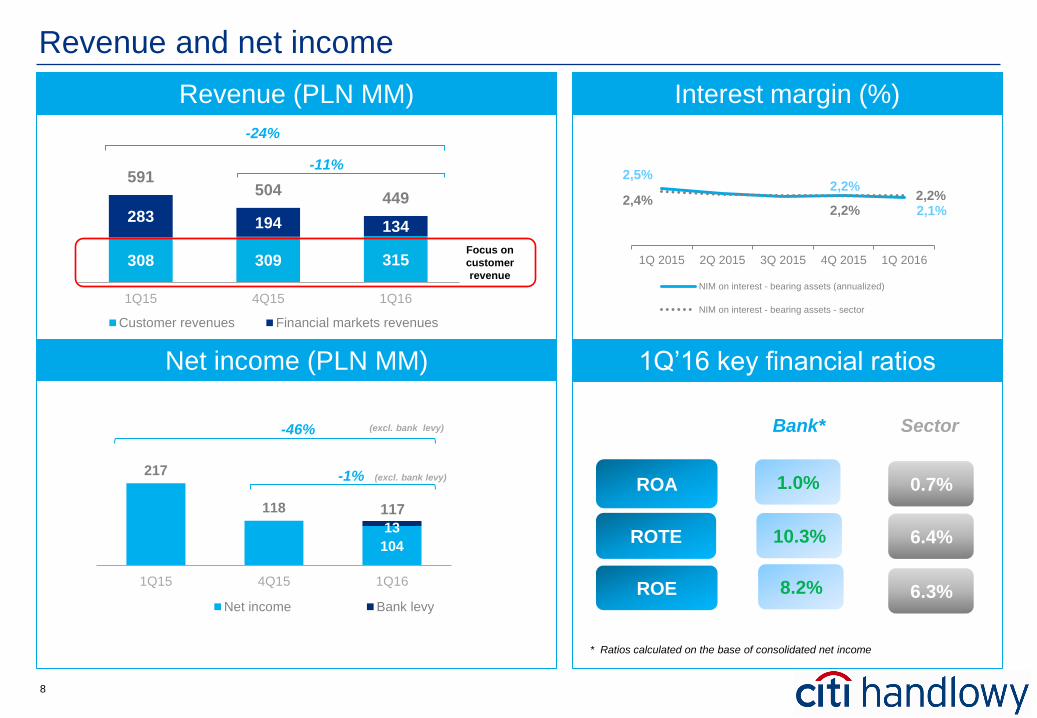
8
217
118
104
13
1Q15 4Q15 1Q16
Net income Bank levy
-1%
-46%
Revenue and net income
Interest margin (%)
ROA
ROE
Bank* Sector
ROTE
0.7%
6.3%
6.4%
1.0%
8.2%
10.3%
* Ratios calculated on the base of consolidated net income
Revenue (PLN MM)
(excl. bank levy)
(excl. bank levy)
Focus on
customer
revenue
1Q’16 key financial ratios Net income (PLN MM)
2,5% 2,2%
2,1% 2,4%
2,2% 2,2%
1Q 2015 2Q 2015 3Q 2015 4Q 2015 1Q 2016
NIM on interest - bearing assets (annualized)
NIM on interest - bearing assets - sector
117
308 309 315
283 194 134
591 504
449
1Q15 4Q15 1Q16
Customer revenues Financial markets revenues
-11%
-24%
9
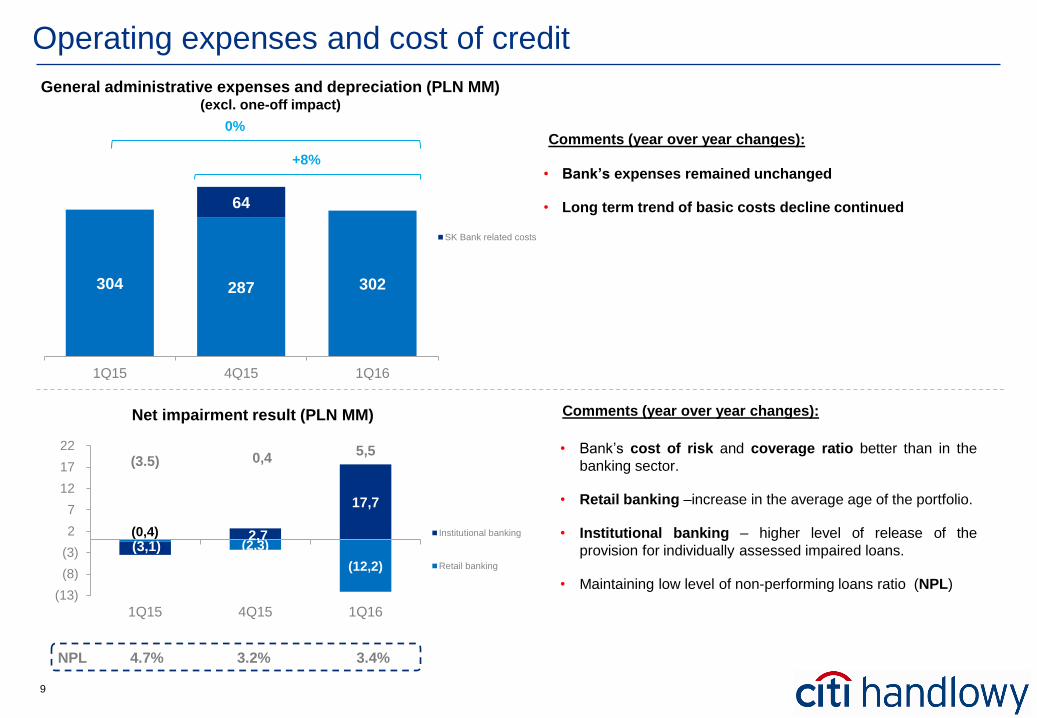
304 287 302
64
1Q15 4Q15 1Q16
SK Bank related costs
0%
+8%
Operating expenses and cost of credit
• Bank’s expenses remained unchanged
• Long term trend of basic costs decline continued
General administrative expenses and depreciation (PLN MM) (excl. one-off impact)
52% 57%
Comments (year over year changes):
59%
Net impairment result (PLN MM)
• Bank’s cost of risk and coverage ratio better than in the
banking sector.
• Retail banking –increase in the average age of the portfolio.
• Institutional banking – higher level of release of the
provision for individually assessed impaired loans.
• Maintaining low level of non-performing loans ratio (NPL)
Comments (year over year changes):
(0,4) (2,3)
(12,2)
(3,1) 2,7
17,7
(3.5) 0,4 5,5
(13)
(8)
(3)
2
7
12
17
22
1Q15 4Q15 1Q16
Institutional banking
Retail banking
NPL 3.4% 3.2% 4.7%
10
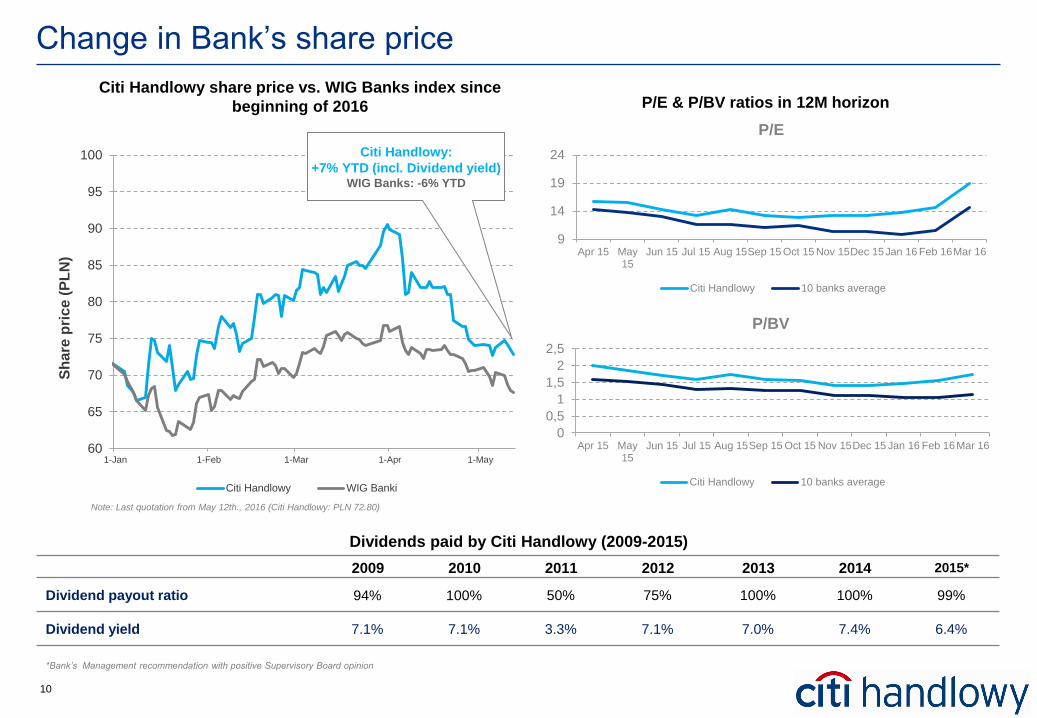
Citi Handlowy share price vs. WIG Banks index since
beginning of 2016
Change in Bank’s share price
2009 2010 2011 2012 2013 2014 2015*
Dividend payout ratio 94% 100% 50% 75% 100% 100% 99%
Dividend yield 7.1% 7.1% 3.3% 7.1% 7.0% 7.4% 6.4%
Dividends paid by Citi Handlowy (2009-2015)
*Bank’s Management recommendation with positive Supervisory Board opinion
P/E & P/BV ratios in 12M horizon
60
65
70
75
80
85
90
95
100
1-Jan 1-Feb 1-Mar 1-Apr 1-May
Sh
are
pri
ce (
PL
N)
Citi Handlowy WIG Banki
Citi Handlowy:
+7% YTD (incl. Dividend yield) WIG Banks: -6% YTD
Note: Last quotation from May 12th., 2016 (Citi Handlowy: PLN 72.80)
9
14
19
24
Apr 15 May15
Jun 15 Jul 15 Aug 15Sep 15 Oct 15 Nov 15Dec 15Jan 16 Feb 16Mar 16
P/E
Citi Handlowy 10 banks average
0
0,5
1
1,5
2
2,5
Apr 15 May15
Jun 15 Jul 15 Aug 15Sep 15 Oct 15 Nov 15Dec 15 Jan 16 Feb 16Mar 16
P/BV
Citi Handlowy 10 banks average

Appendix
12
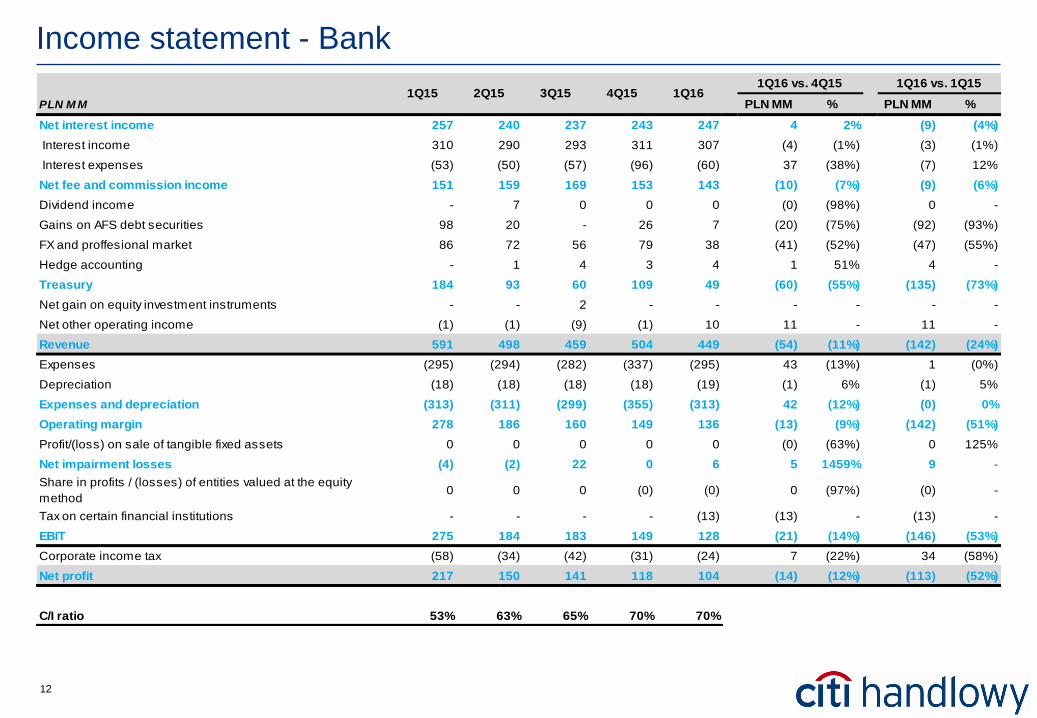
Income statement - Bank
PLN M M PLN MM % PLN MM %
Net interest income 257 240 237 243 247 4 2% (9) (4%)
Interest income 310 290 293 311 307 (4) (1%) (3) (1%)
Interest expenses (53) (50) (57) (96) (60) 37 (38%) (7) 12%
Net fee and commission income 151 159 169 153 143 (10) (7%) (9) (6%)
Dividend income - 7 0 0 0 (0) (98%) 0 -
Gains on AFS debt securities 98 20 - 26 7 (20) (75%) (92) (93%)
FX and proffesional market 86 72 56 79 38 (41) (52%) (47) (55%)
Hedge accounting - 1 4 3 4 1 51% 4 -
Treasury 184 93 60 109 49 (60) (55%) (135) (73%)
Net gain on equity investment instruments - - 2 - - - - - -
Net other operating income (1) (1) (9) (1) 10 11 - 11 -
Revenue 591 498 459 504 449 (54) (11%) (142) (24%)
Expenses (295) (294) (282) (337) (295) 43 (13%) 1 (0%)
Depreciation (18) (18) (18) (18) (19) (1) 6% (1) 5%
Expenses and depreciation (313) (311) (299) (355) (313) 42 (12%) (0) 0%
Operating margin 278 186 160 149 136 (13) (9%) (142) (51%)
Profit/(loss) on sale of tangible fixed assets 0 0 0 0 0 (0) (63%) 0 125%
Net impairment losses (4) (2) 22 0 6 5 1459% 9 -
Share in profits / (losses) of entities valued at the equity
method 0 0 0 (0) (0) 0 (97%) (0) -
Tax on certain financial institutions - - - - (13) (13) - (13) -
EBIT 275 184 183 149 128 (21) (14%) (146) (53%)
Corporate income tax (58) (34) (42) (31) (24) 7 (22%) 34 (58%)
Net profit 217 150 141 118 104 (14) (12%) (113) (52%)
C/I ratio 53% 63% 65% 70% 70%
2Q151Q16 vs. 4Q15 1Q16 vs. 1Q15
3Q15 4Q15 1Q161Q15
13
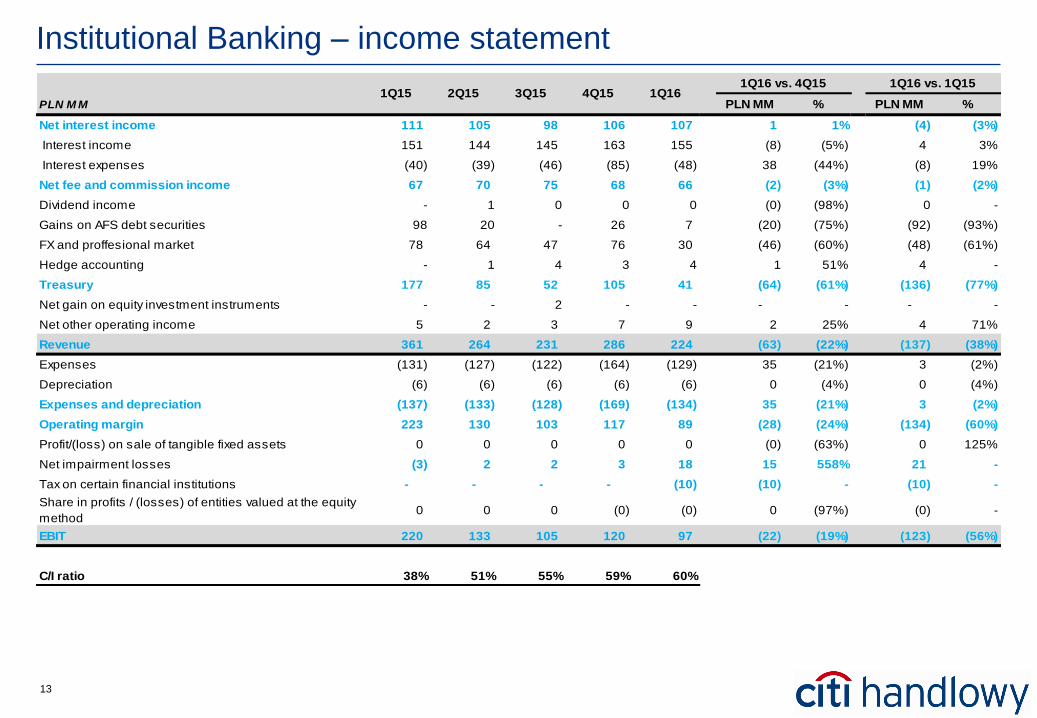
Institutional Banking – income statement
PLN M M PLN MM % PLN MM %
Net interest income 111 105 98 106 107 1 1% (4) (3%)
Interest income 151 144 145 163 155 (8) (5%) 4 3%
Interest expenses (40) (39) (46) (85) (48) 38 (44%) (8) 19%
Net fee and commission income 67 70 75 68 66 (2) (3%) (1) (2%)
Dividend income - 1 0 0 0 (0) (98%) 0 -
Gains on AFS debt securities 98 20 - 26 7 (20) (75%) (92) (93%)
FX and proffesional market 78 64 47 76 30 (46) (60%) (48) (61%)
Hedge accounting - 1 4 3 4 1 51% 4 -
Treasury 177 85 52 105 41 (64) (61%) (136) (77%)
Net gain on equity investment instruments - - 2 - - - - - -
Net other operating income 5 2 3 7 9 2 25% 4 71%
Revenue 361 264 231 286 224 (63) (22%) (137) (38%)
Expenses (131) (127) (122) (164) (129) 35 (21%) 3 (2%)
Depreciation (6) (6) (6) (6) (6) 0 (4%) 0 (4%)
Expenses and depreciation (137) (133) (128) (169) (134) 35 (21%) 3 (2%)
Operating margin 223 130 103 117 89 (28) (24%) (134) (60%)
Profit/(loss) on sale of tangible fixed assets 0 0 0 0 0 (0) (63%) 0 125%
Net impairment losses (3) 2 2 3 18 15 558% 21 -
Tax on certain financial institutions - - - - (10) (10) - (10) -
Share in profits / (losses) of entities valued at the equity
method0 0 0 (0) (0) 0 (97%) (0) -
EBIT 220 133 105 120 97 (22) (19%) (123) (56%)
C/I ratio 38% 51% 55% 59% 60%
1Q162Q151Q16 vs. 1Q151Q16 vs. 4Q15
1Q15 3Q15 4Q15
14
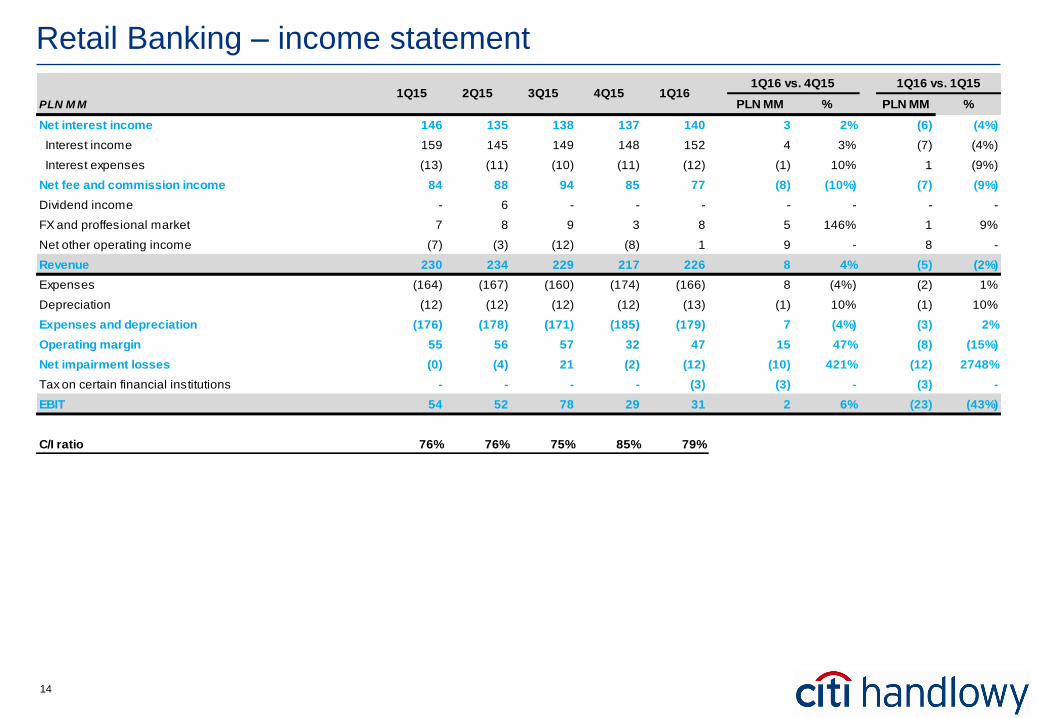
Retail Banking – income statement
PLN M M PLN MM % PLN MM %
Net interest income 146 135 138 137 140 3 2% (6) (4%)
Interest income 159 145 149 148 152 4 3% (7) (4%)
Interest expenses (13) (11) (10) (11) (12) (1) 10% 1 (9%)
Net fee and commission income 84 88 94 85 77 (8) (10%) (7) (9%)
Dividend income - 6 - - - - - - -
FX and proffesional market 7 8 9 3 8 5 146% 1 9%
Net other operating income (7) (3) (12) (8) 1 9 - 8 -
Revenue 230 234 229 217 226 8 4% (5) (2%)
Expenses (164) (167) (160) (174) (166) 8 (4%) (2) 1%
Depreciation (12) (12) (12) (12) (13) (1) 10% (1) 10%
Expenses and depreciation (176) (178) (171) (185) (179) 7 (4%) (3) 2%
Operating margin 55 56 57 32 47 15 47% (8) (15%)
Net impairment losses (0) (4) 21 (2) (12) (10) 421% (12) 2748%
Tax on certain financial institutions - - - - (3) (3) - (3) -
EBIT 54 52 78 29 31 2 6% (23) (43%)
C/I ratio 76% 76% 75% 85% 79%
1Q16 vs. 1Q151Q16 vs. 4Q151Q15 2Q15 3Q15 4Q15 1Q16
15
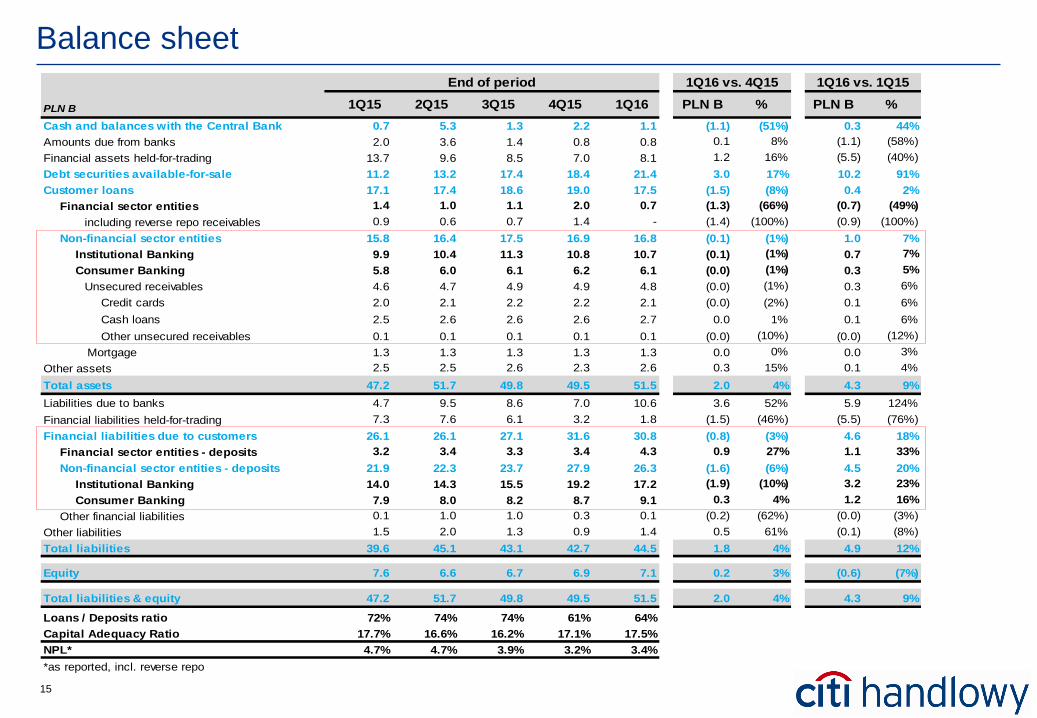
Balance sheet
Cash and balances with the Central Bank 0.7 5.3 1.3 2.2 1.1 (1.1) (51%) 0.3 44%
Amounts due from banks 2.0 3.6 1.4 0.8 0.8 0.1 8% (1.1) (58%)
Financial assets held-for-trading 13.7 9.6 8.5 7.0 8.1 1.2 16% (5.5) (40%)
Debt securities available-for-sale 11.2 13.2 17.4 18.4 21.4 3.0 17% 10.2 91%
Customer loans 17.1 17.4 18.6 19.0 17.5 (1.5) (8%) 0.4 2%
Financial sector entities 1.4 1.0 1.1 2.0 0.7 (1.3) (66%) (0.7) (49%)
including reverse repo receivables 0.9 0.6 0.7 1.4 - (1.4) (100%) (0.9) (100%)
Non-financial sector entities 15.8 16.4 17.5 16.9 16.8 (0.1) (1%) 1.0 7%
Institutional Banking 9.9 10.4 11.3 10.8 10.7 (0.1) (1%) 0.7 7%
Consumer Banking 5.8 6.0 6.1 6.2 6.1 (0.0) (1%) 0.3 5%
Unsecured receivables 4.6 4.7 4.9 4.9 4.8 (0.0) (1%) 0.3 6%
Credit cards 2.0 2.1 2.2 2.2 2.1 (0.0) (2%) 0.1 6%
Cash loans 2.5 2.6 2.6 2.6 2.7 0.0 1% 0.1 6%
Other unsecured receivables 0.1 0.1 0.1 0.1 0.1 (0.0) (10%) (0.0) (12%)
Mortgage 1.3 1.3 1.3 1.3 1.3 0.0 0% 0.0 3%
Other assets 2.5 2.5 2.6 2.3 2.6 0.3 15% 0.1 4%
Total assets 47.2 51.7 49.8 49.5 51.5 2.0 4% 4.3 9%
Liabilities due to banks 4.7 9.5 8.6 7.0 10.6 3.6 52% 5.9 124%
Financial liabilities held-for-trading 7.3 7.6 6.1 3.2 1.8 (1.5) (46%) (5.5) (76%)
Financial liabilities due to customers 26.1 26.1 27.1 31.6 30.8 (0.8) (3%) 4.6 18%
Financial sector entities - deposits 3.2 3.4 3.3 3.4 4.3 0.9 27% 1.1 33%
Non-financial sector entities - deposits 21.9 22.3 23.7 27.9 26.3 (1.6) (6%) 4.5 20%
Institutional Banking 14.0 14.3 15.5 19.2 17.2 (1.9) (10%) 3.2 23%
Consumer Banking 7.9 8.0 8.2 8.7 9.1 0.3 4% 1.2 16%
Other financial liabilities 0.1 1.0 1.0 0.3 0.1 (0.2) (62%) (0.0) (3%)
Other liabilities 1.5 2.0 1.3 0.9 1.4 0.5 61% (0.1) (8%)
Total liabilities 39.6 45.1 43.1 42.7 44.5 1.8 4% 4.9 12%
Equity 7.6 6.6 6.7 6.9 7.1 0.2 3% (0.6) (7%)
Total liabilities & equity 47.2 51.7 49.8 49.5 51.5 2.0 4% 4.3 9%
Loans / Deposits ratio 72% 74% 74% 61% 64%
Capital Adequacy Ratio 17.7% 16.6% 16.2% 17.1% 17.5%
NPL* 4.7% 4.7% 3.9% 3.2% 3.4%
*as reported, incl. reverse repo
1Q16 vs. 1Q15
PLN B %
1Q16 vs. 4Q15
PLN B %1Q15 3Q152Q15 4Q15 1Q16
End of period
PLN B