bang goes the theory teacher's pack -...
TRANSCRIPT
Sampling techniques
Counting cows
Sticky Snails
Badge
47
Sampling techniques
Suitable for: 11–16 years
Curriculum and learning links:Ecological sampling techniques, reliability
Learning objectives:• Describe how to collect data using a quadrat.• Explain why it is important to take repeat readings when collecting scientific data.
© BBC
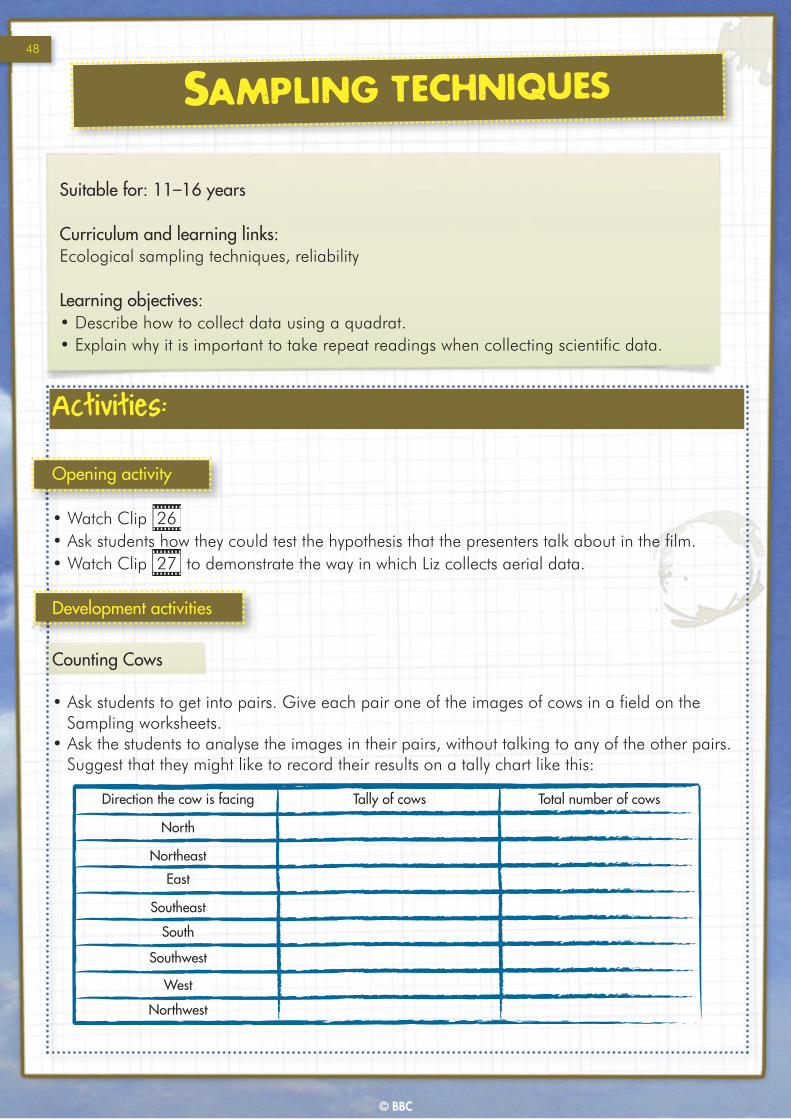
Direction the cow is facing
North
Northeast
East
Tally of cows Total number of cows
Southeast
South
Southwest
West
Northwest
Activities:
Opening activity
• Watch Clip 26• Ask students how they could test the hypothesis that the presenters talk about in the film. • Watch Clip 27 to demonstrate the way in which Liz collects aerial data.
Development activities
Counting Cows
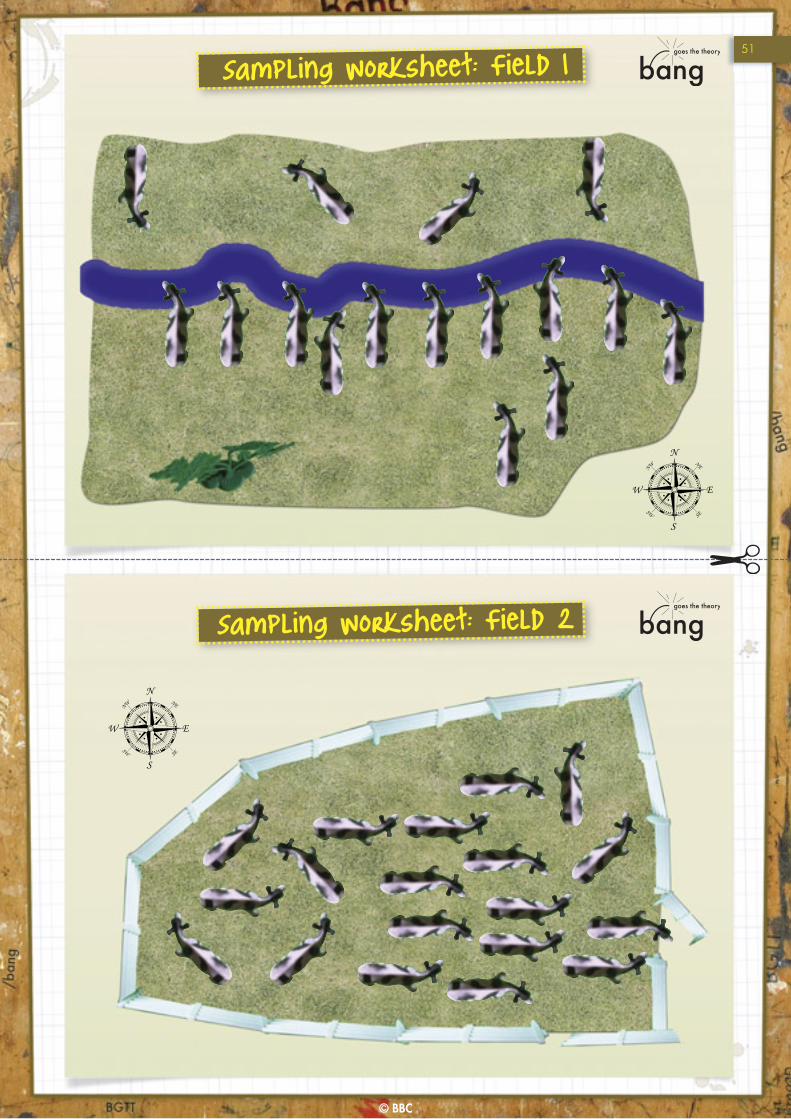
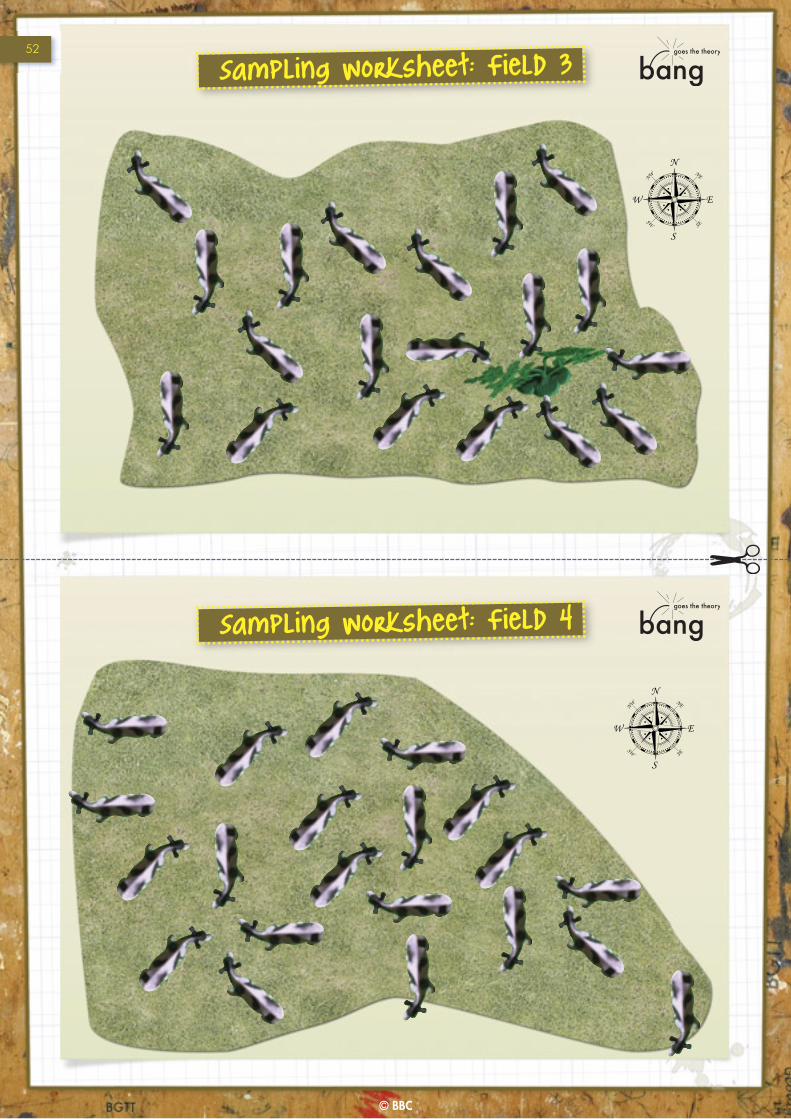
• Ask students to get into pairs. Give each pair one of the images of cows in a field on the Sampling worksheets.
• Ask the students to analyse the images in their pairs, without talking to any of the other pairs. Suggest that they might like to record their results on a tally chart like this:
48

Sampling techniques
Reflect and review
Development activities continued....
• Ask the students to discuss whether the data from their image support the hypothesis or not. Can they suggest any explanations for their data? Please note: some students will have images in which the cows are very much aligned, leading them to make a conclusion which will not be supported when the data are pooled from the whole class.
• Ask students to put their hands up if their image supports the hypothesis. Then pool the data from all of the images by completing one tally chart for the whole class across all of the different fields.
• Conclude that while it is often the case that cows align themselves in a certain direction in a certain field, there is no significant trend from the larger data set. Discuss the importance of using a large data set in scientific investigations to ensure adequate reliability.
• Introduce Clip 28 by asking the students if they want to see what the Bang team found out when they analysed their data.
Quadrats
• Explain how to use quadrats in a random way – for example, students could choose two numbers at random to determine the number of paces that they walk eastwards, then northwards from a pre-determined origin.
• Ask students to use this method to sample a particular plant (e.g. daisy) in a grassed area in the school grounds.
• During the sampling session, ask students to make a note of the unusual (anomalous) samples – for example, quadrats that had no daisies or a very large number of daisies.
• Ask students to estimate population size using the equation: Population size = (average number in one quadrat) x (number of quadrats needed to
cover area of field)
• Return to the idea of sampling data on cows. Ask students to suggest ways in which the investigation could be improved. Discuss whether snapshots really give us a reliable measurement of cow alignment.
• Ask students to think about what other factors they could investigate that might have an effect on cow alignment and then watch Clip 29 which shows what Liz and Jem investigated next.
49
© BBC
Sampling techniques
© BBC
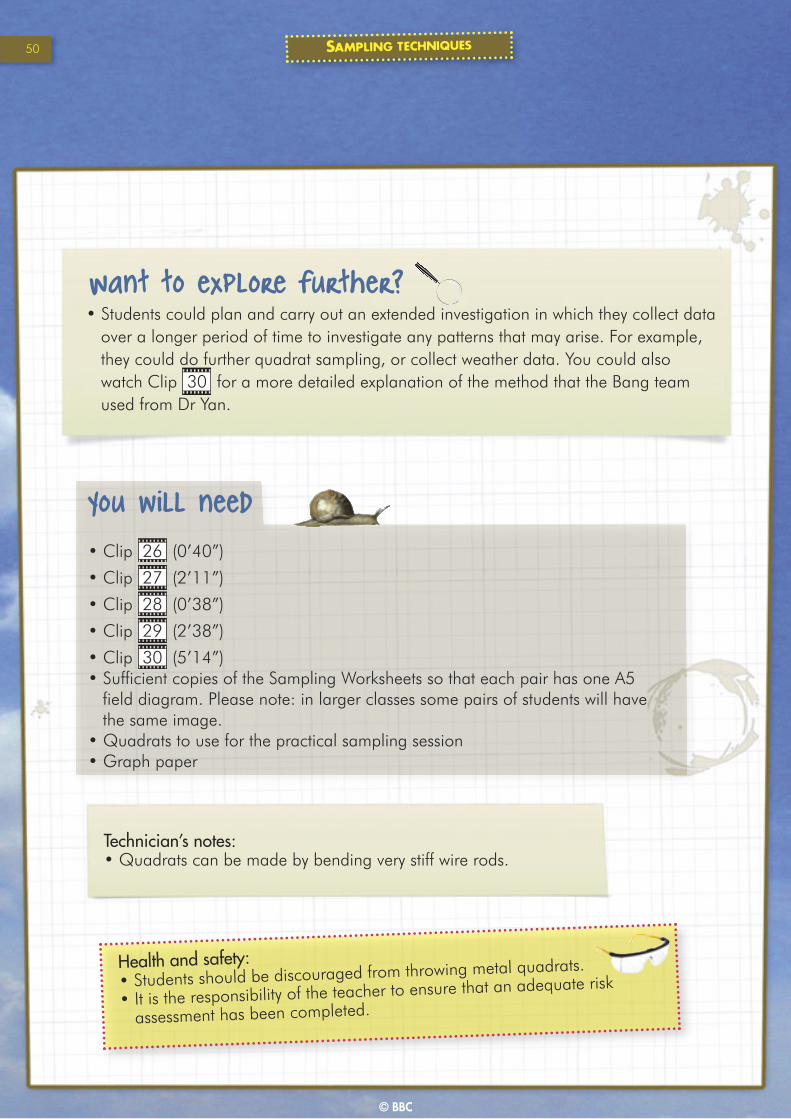
Want to explore further?
Health and safety:• Students should be discouraged from throwing metal quadrats.
• It is the responsibility of the teacher to ensure that an adequate risk
assessment has been completed.
Technician’s notes:• Quadrats can be made by bending very stiff wire rods.
• Students could plan and carry out an extended investigation in which they collect data over a longer period of time to investigate any patterns that may arise. For example, they could do further quadrat sampling, or collect weather data. You could also watch Clip 30 for a more detailed explanation of the method that the Bang team used from Dr Yan.
You will need
• Clip 26 (0’40”)
• Clip 27 (2’11”)
• Clip 28 (0’38”)
• Clip 29 (2’38”)
• Clip 30 (5’14”)• Sufficient copies of the Sampling Worksheets so that each pair has one A5
field diagram. Please note: in larger classes some pairs of students will have the same image.
• Quadrats to use for the practical sampling session• Graph paper
50
© BBC
Sampling Worksheet: Field 1
Sampling Worksheet: Field 2
51
© BBC
Sampling Worksheet: Field 3
Sampling Worksheet: Field 4
52

Sampling Worksheet: Field 5
Sampling Worksheet: Field 6
53
© BBC
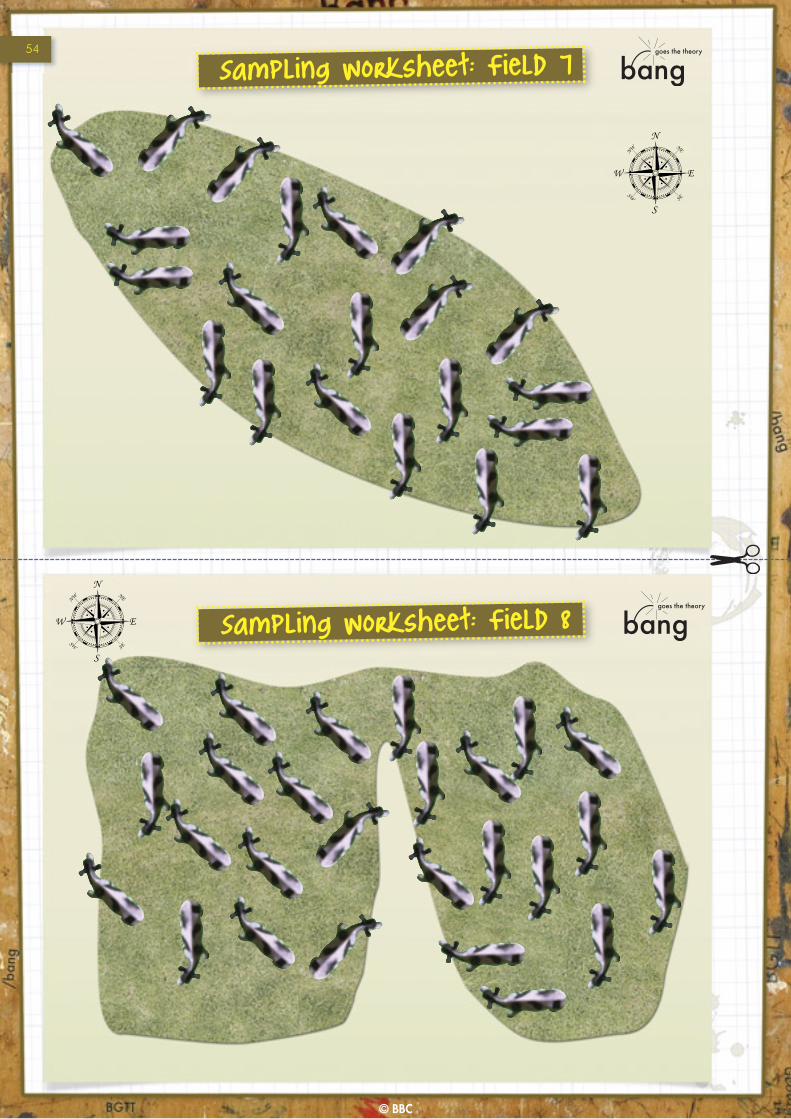
Sampling Worksheet: Field 7
Sampling Worksheet: Field 8
54
© BBC