balanced mix design approach - texas a&m … · balanced mix design approach . robert lee, ......
TRANSCRIPT
BALANCED MIX DESIGN APPROACH Robert Lee, P.E. CST – Flexible Pavements Branch
89th Annual Transportation Short Course

Table of Contents
2
I’m going to share some thoughts with you that you already know
I will tell you that we are not alone in these thoughts
I’ll share a little history with you
I’m going to ask you some questions - I don’t expect you to answer
I’m going to state the obvious
I’ll share some ideas and some examples to go with them
Hopefully we can start to build on these ideas
1
2
3
4
5
6
7
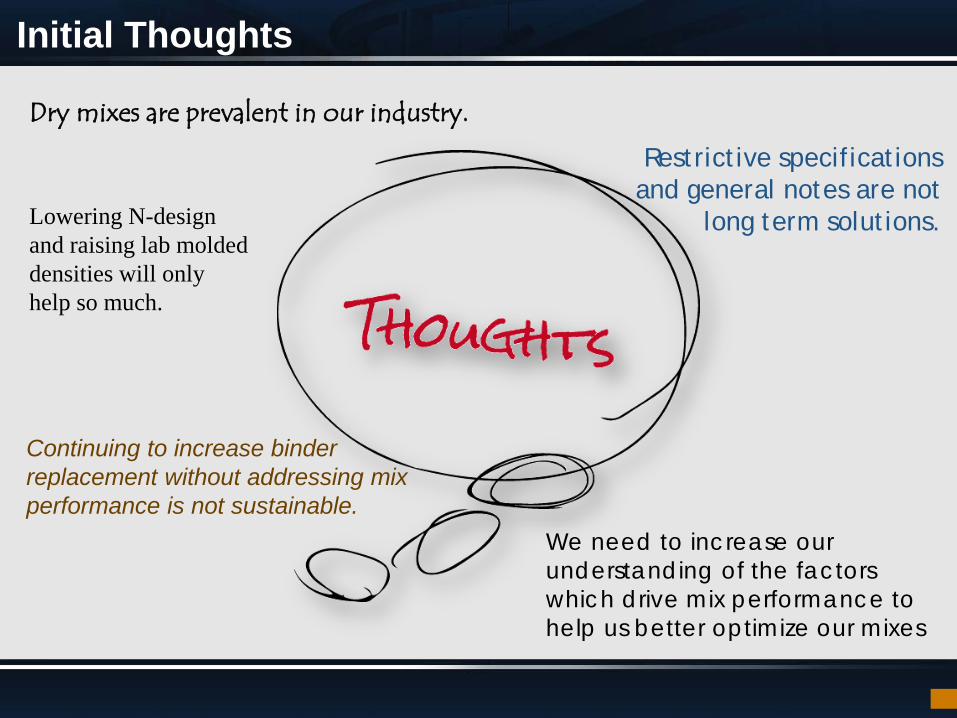
Initial Thoughts
Dry mixes are prevalent in our industry.
Restrictive specifications and general notes are not
long term solutions. Lowering N-design and raising lab molded densities will only help so much.
Continuing to increase binder replacement without addressing mix performance is not sustainable.
We need to increase our understanding of the factors which drive mix performance to help us better optimize our mixes
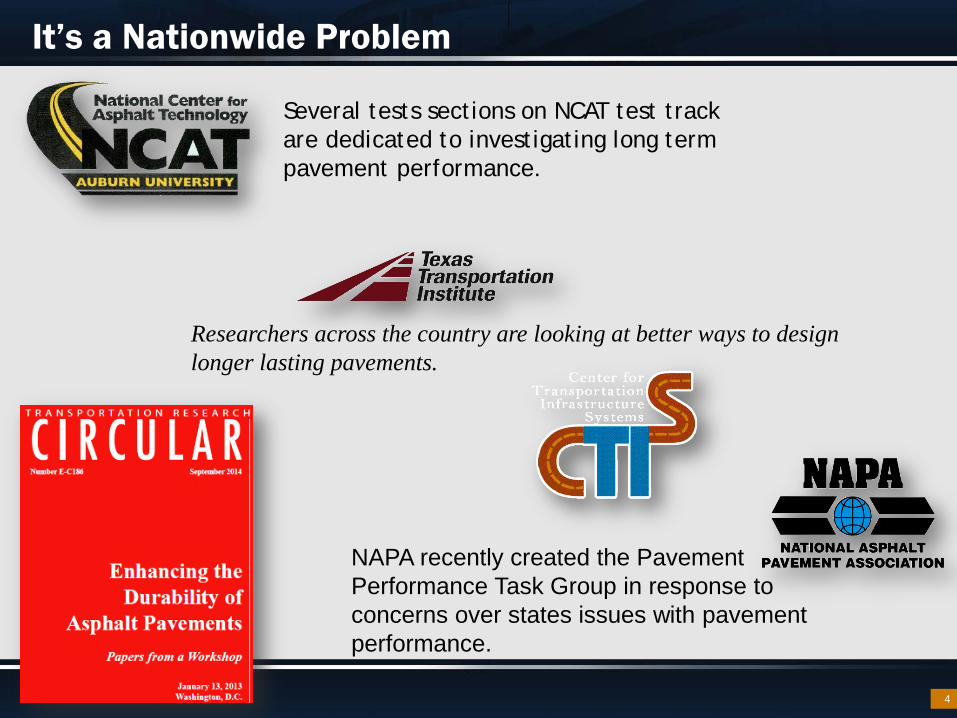
It’s a Nationwide Problem
4
NAPA recently created the Pavement Performance Task Group in response to concerns over states issues with pavement performance.
Several tests sections on NCAT test track are dedicated to investigating long term pavement performance.
Researchers across the country are looking at better ways to design longer lasting pavements.
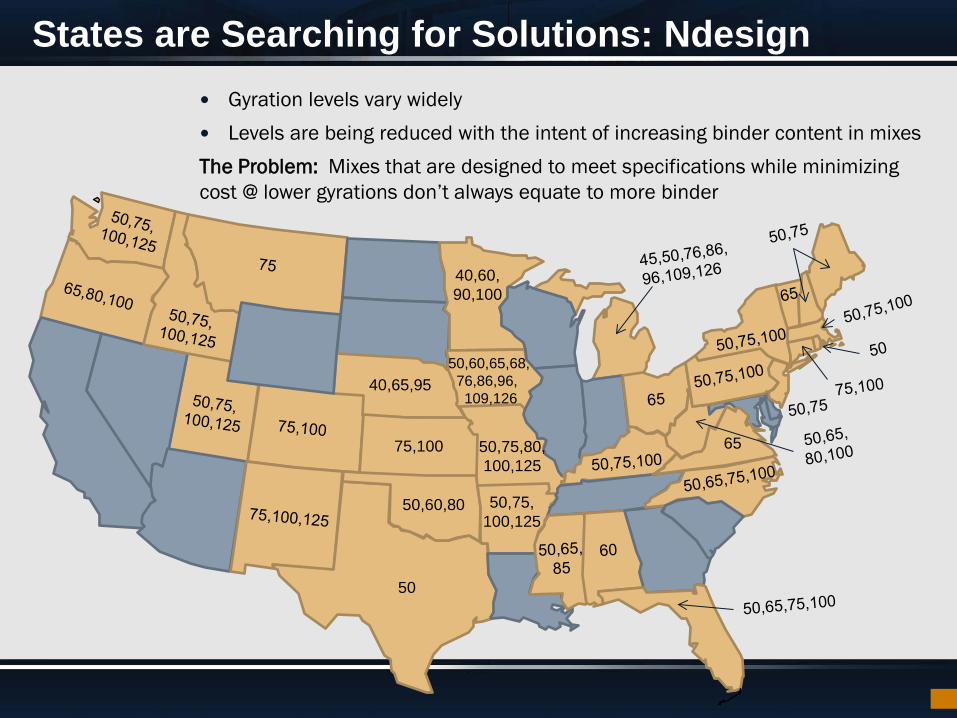
Gyration levels vary widely Levels are being reduced with the intent of increasing binder content in mixes The Problem: Mixes that are designed to meet specifications while minimizing cost @ lower gyrations don’t always equate to more binder
States are Searching for Solutions: Ndesign
50
65 75,100
50,60,80
40,65,95
40,60, 90,100
50,60,65,68, 76,86,96, 109,126
50,75,80, 100,125
50,75, 100,125
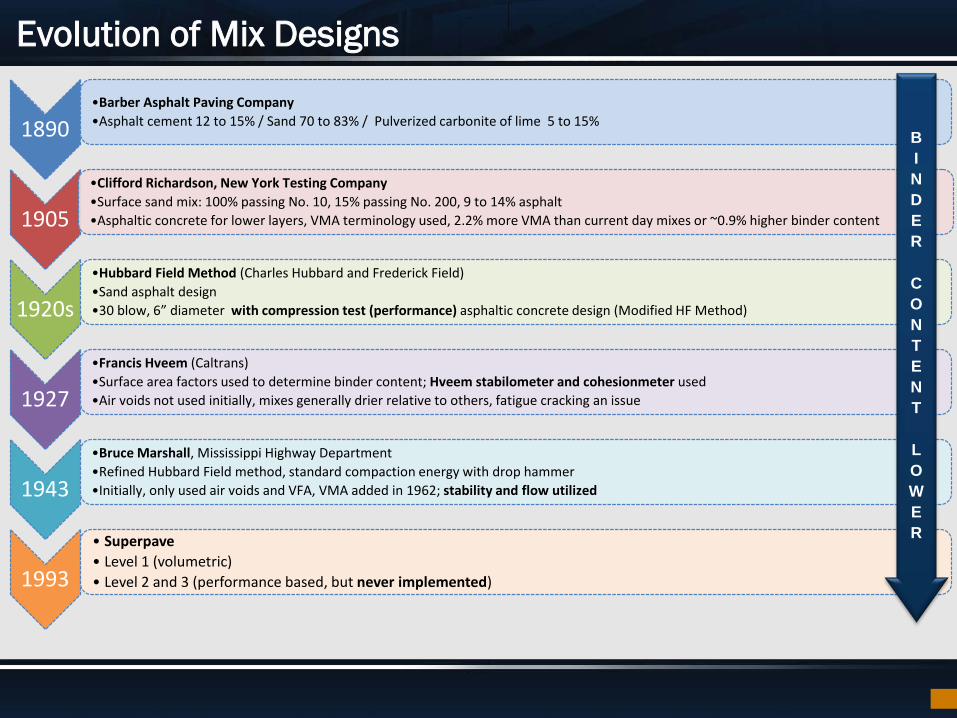
Evolution of Mix Designs
1890 •Barber Asphalt Paving Company •Asphalt cement 12 to 15% / Sand 70 to 83% / Pulverized carbonite of lime 5 to 15%
1905
•Clifford Richardson, New York Testing Company •Surface sand mix: 100% passing No. 10, 15% passing No. 200, 9 to 14% asphalt •Asphaltic concrete for lower layers, VMA terminology used, 2.2% more VMA than current day mixes or ~0.9% higher binder content
1920s
•Hubbard Field Method (Charles Hubbard and Frederick Field) •Sand asphalt design •30 blow, 6” diameter with compression test (performance) asphaltic concrete design (Modified HF Method)
1927
•Francis Hveem (Caltrans) •Surface area factors used to determine binder content; Hveem stabilometer and cohesionmeter used •Air voids not used initially, mixes generally drier relative to others, fatigue cracking an issue
1943
•Bruce Marshall, Mississippi Highway Department •Refined Hubbard Field method, standard compaction energy with drop hammer •Initially, only used air voids and VFA, VMA added in 1962; stability and flow utilized
1993
• Superpave • Level 1 (volumetric) • Level 2 and 3 (performance based, but never implemented)
BINDER CONTENT LOWER
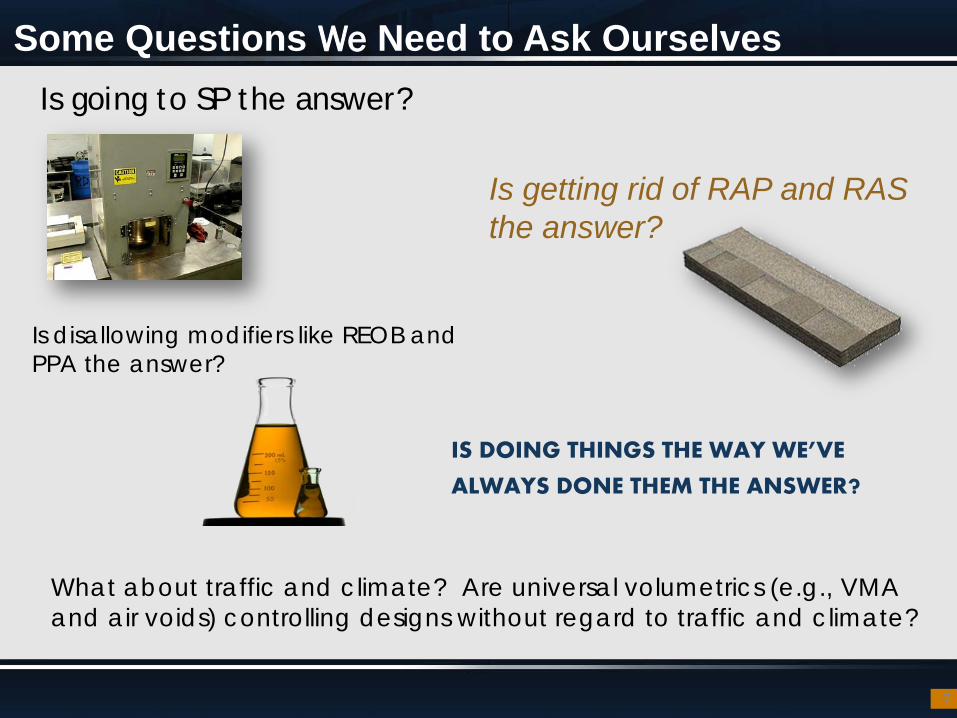
Some Questions We Need to Ask Ourselves
7
What about traffic and climate? Are universal volumetrics (e.g., VMA and air voids) controlling designs without regard to traffic and climate?
Is going to SP the answer?
Is getting rid of RAP and RAS the answer?
Is disallowing modifiers like REOB and PPA the answer?
IS DOING THINGS THE WAY WE’VE
ALWAYS DONE THEM THE ANSWER?
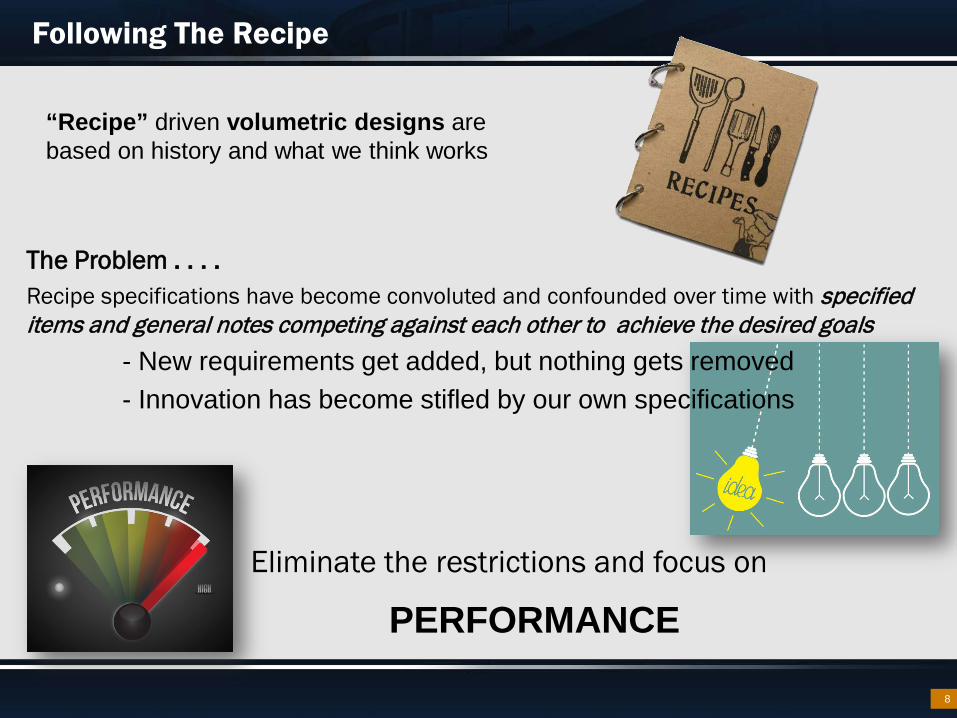
Following The Recipe
8
The Problem . . . . Recipe specifications have become convoluted and confounded over time with specified items and general notes competing against each other to achieve the desired goals
- New requirements get added, but nothing gets removed - Innovation has become stifled by our own specifications
“Recipe” driven volumetric designs are based on history and what we think works
Eliminate the restrictions and focus on
PERFORMANCE
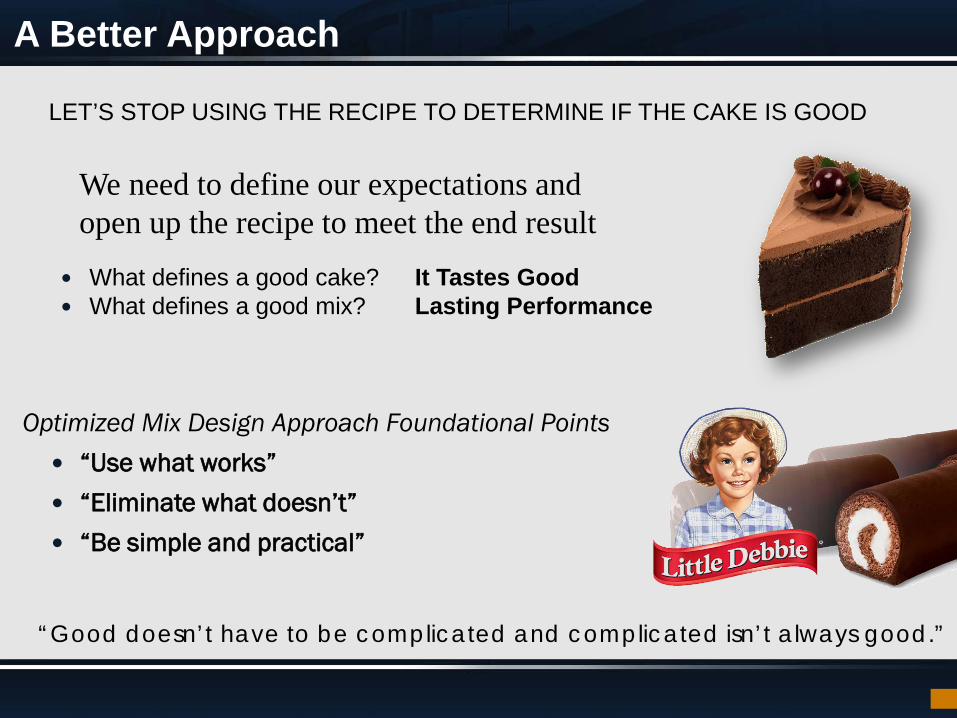
Optimized Mix Design Approach Foundational Points “Use what works” “Eliminate what doesn’t” “Be simple and practical”
A Better Approach
LET’S STOP USING THE RECIPE TO DETERMINE IF THE CAKE IS GOOD
We need to define our expectations and open up the recipe to meet the end result
What defines a good cake? It Tastes Good What defines a good mix? Lasting Performance
“Good doesn’t have to be complicated and complicated isn’t always good.”
What We Need And What They Want
Design For Performance, Not Economics
CONTRACTORS WANT A LEVEL PLAYING FIELD
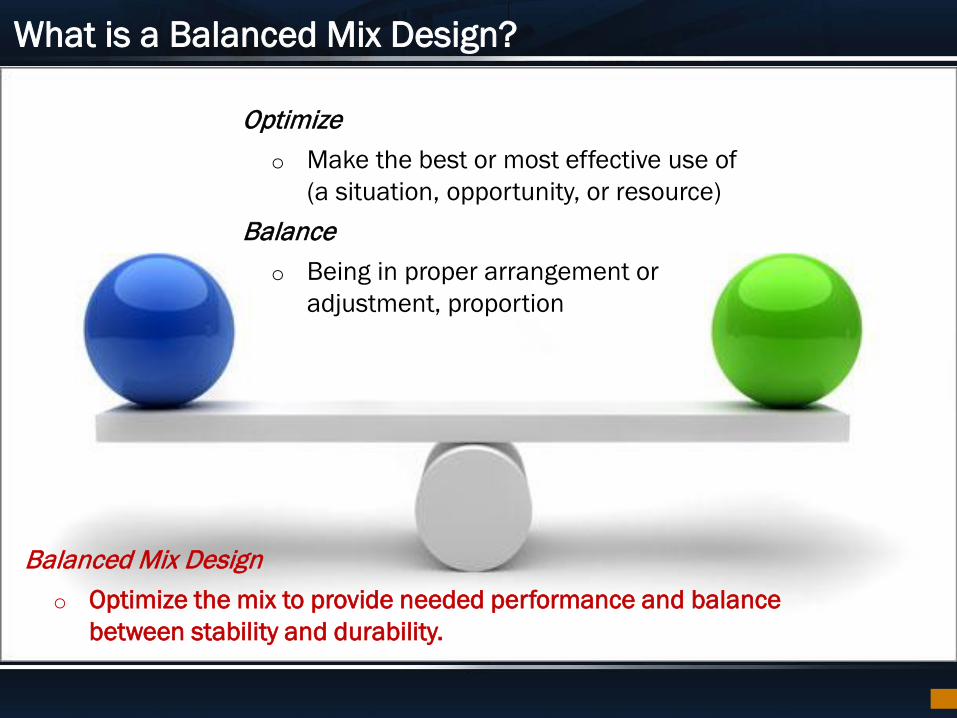
What is a Balanced Mix Design?
Optimize o Make the best or most effective use of
(a situation, opportunity, or resource) Balance
o Being in proper arrangement or adjustment, proportion
Balanced Mix Design o Optimize the mix to provide needed performance and balance
between stability and durability.
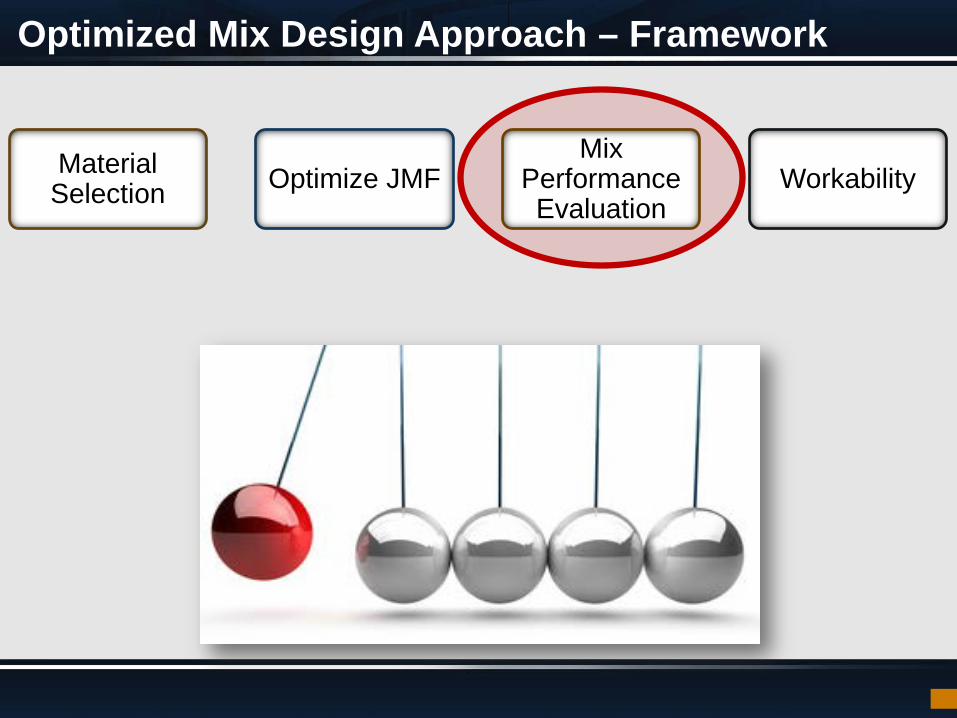
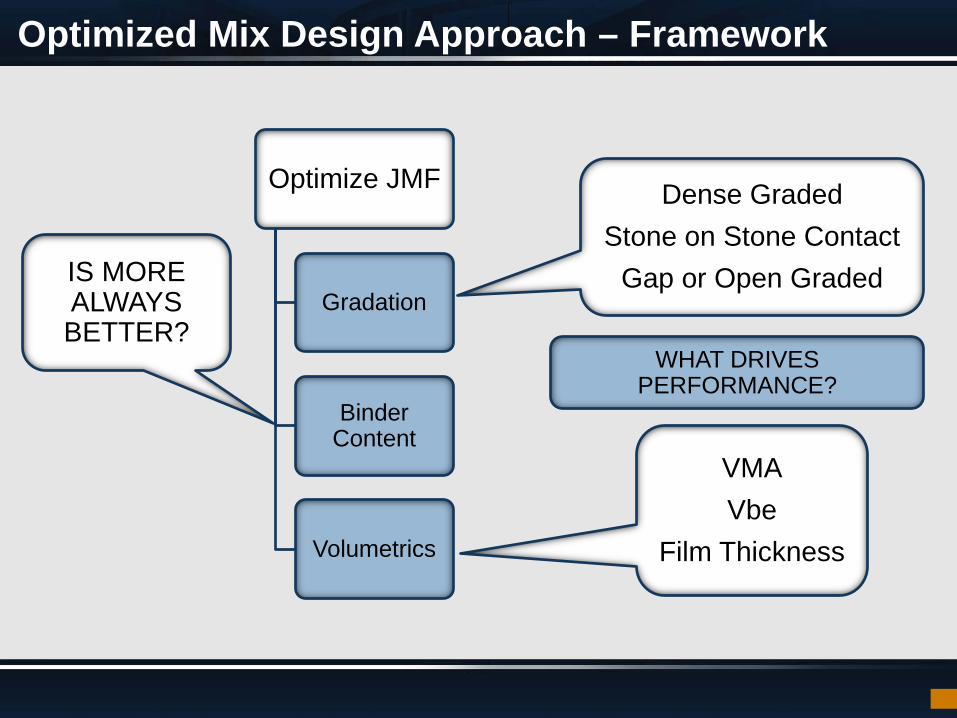
Optimized Mix Design Approach – Framework
Material Selection Optimize JMF
Mix Performance Evaluation
Workability
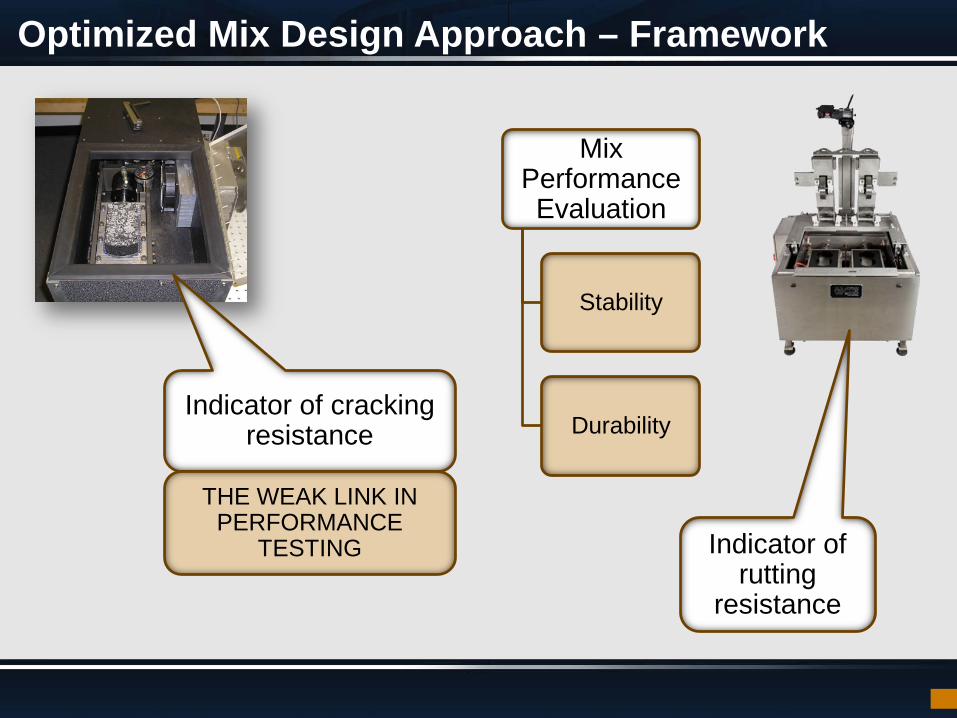
Optimized Mix Design Approach – Framework
Mix Performance Evaluation
Stability
Durability Indicator of cracking
resistance
Indicator of rutting
resistance
THE WEAK LINK IN PERFORMANCE
TESTING
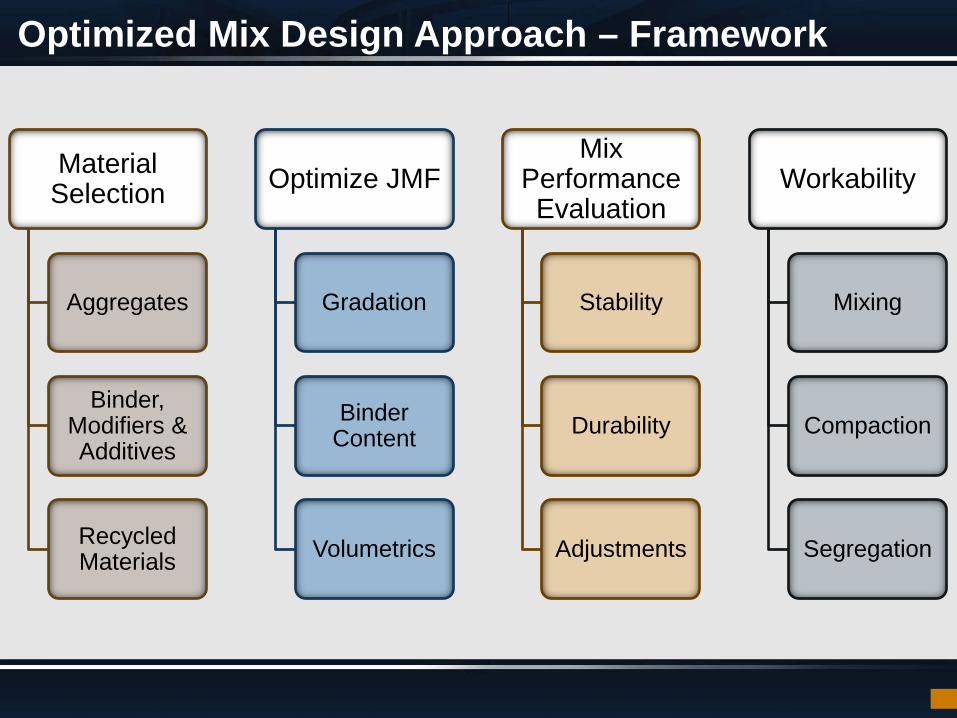
Optimized Mix Design Approach – Framework
Material Selection
Aggregates
Binder, Modifiers & Additives
Recycled Materials
Optimize JMF
Gradation
Binder Content
Volumetrics
Mix Performance Evaluation
Stability
Durability
Adjustments
Workability
Mixing
Compaction
Segregation
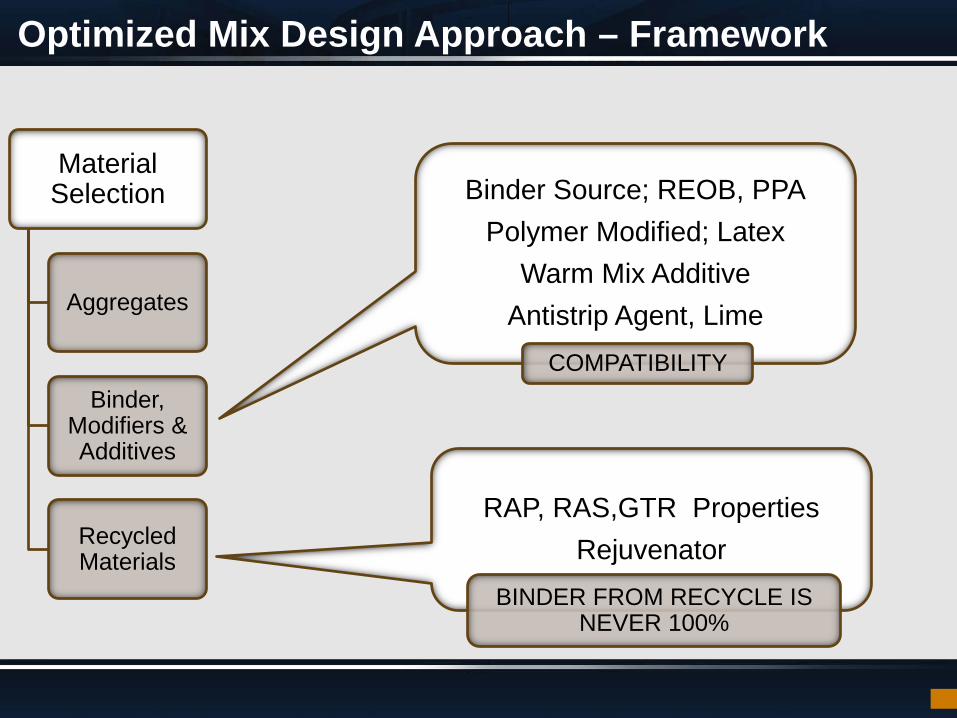
Optimized Mix Design Approach – Framework
Material Selection
Aggregates
Binder, Modifiers & Additives
Recycled Materials
Binder Source; REOB, PPA Polymer Modified; Latex
Warm Mix Additive Antistrip Agent, Lime
RAP, RAS,GTR Properties Rejuvenator
COMPATIBILITY
BINDER FROM RECYCLE IS NEVER 100%
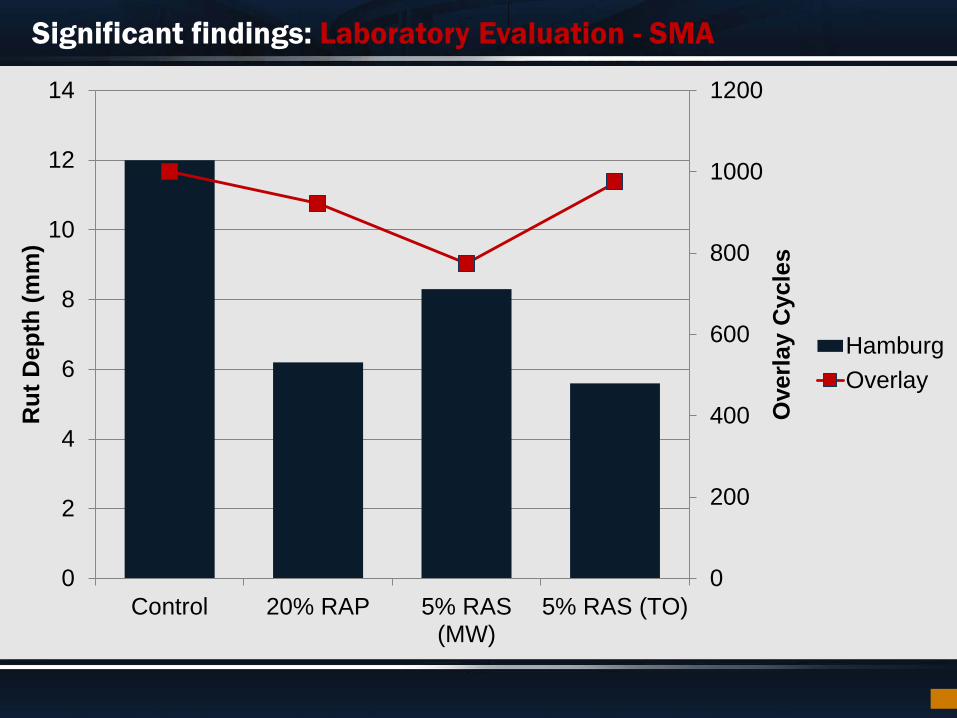
Significant findings: Laboratory Evaluation - SMA
0
200
400
600
800
1000
1200
0
2
4
6
8
10
12
14
Control 20% RAP 5% RAS(MW)
5% RAS (TO)
Ove
rlay
Cyc
les
Rut
Dep
th (m
m)
HamburgOverlay
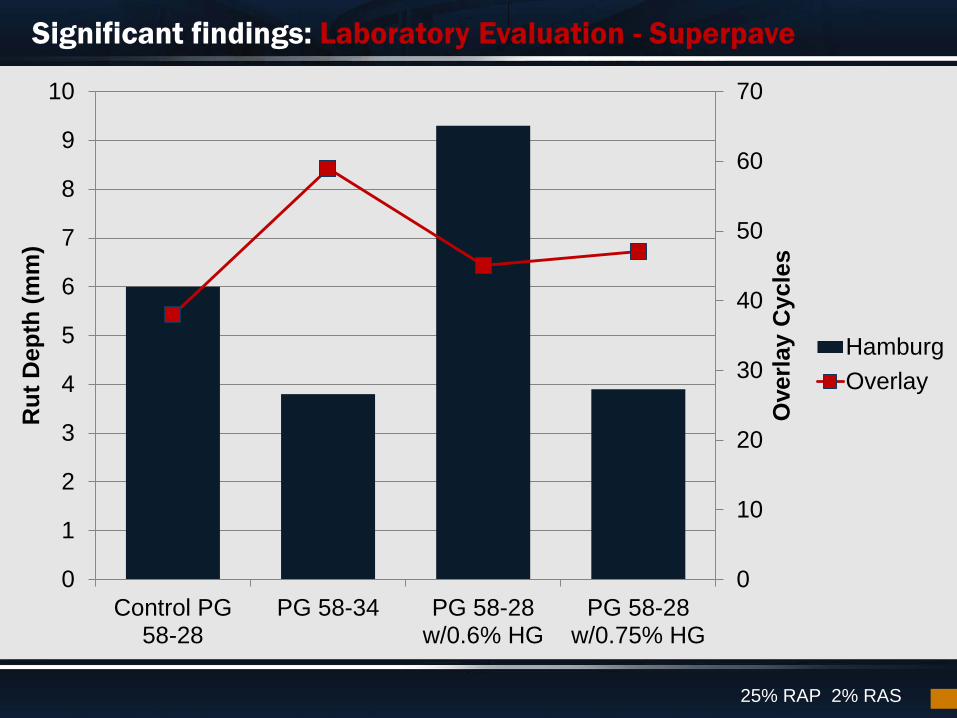
Significant findings: Laboratory Evaluation - Superpave
0
10
20
30
40
50
60
70
0
1
2
3
4
5
6
7
8
9
10
Control PG58-28
PG 58-34 PG 58-28w/0.6% HG
PG 58-28w/0.75% HG
Ove
rlay
Cyc
les
Rut
Dep
th (m
m)
HamburgOverlay
25% RAP 2% RAS
Optimized Mix Design Approach – Framework
Optimize JMF
Gradation
Binder Content
Volumetrics
VMA Vbe
Film Thickness
WHAT DRIVES PERFORMANCE?
Dense Graded Stone on Stone Contact
Gap or Open Graded IS MORE ALWAYS BETTER?
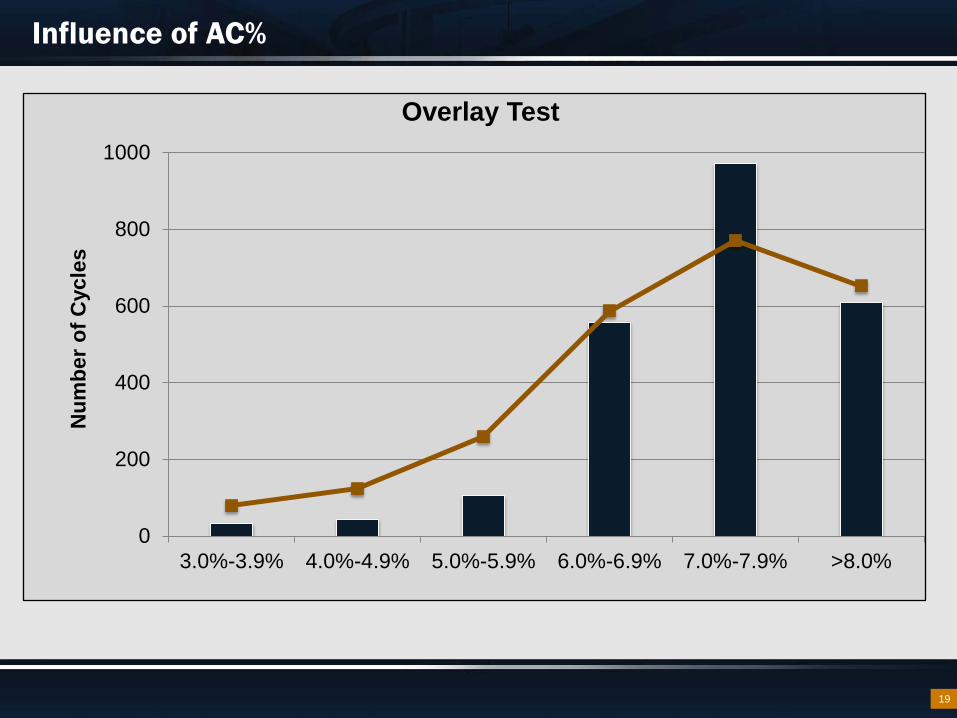
Influence of AC%
0
200
400
600
800
1000
3.0%-3.9% 4.0%-4.9% 5.0%-5.9% 6.0%-6.9% 7.0%-7.9% >8.0%
Num
ber o
f Cyc
les
Overlay Test
19
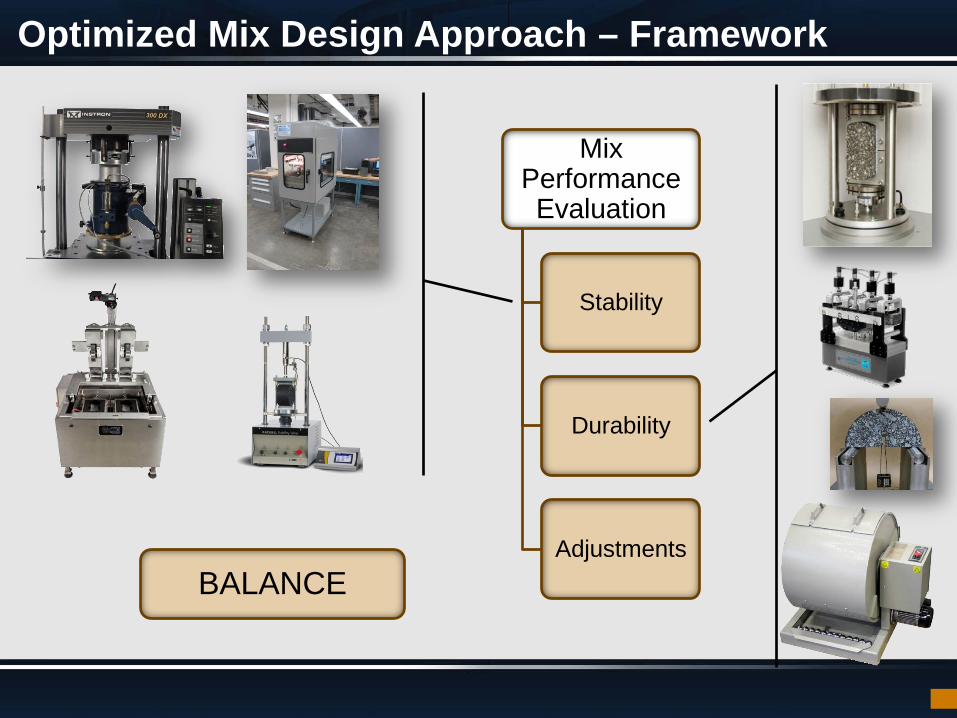
Optimized Mix Design Approach – Framework
Mix Performance Evaluation
Stability
Durability
Adjustments BALANCE
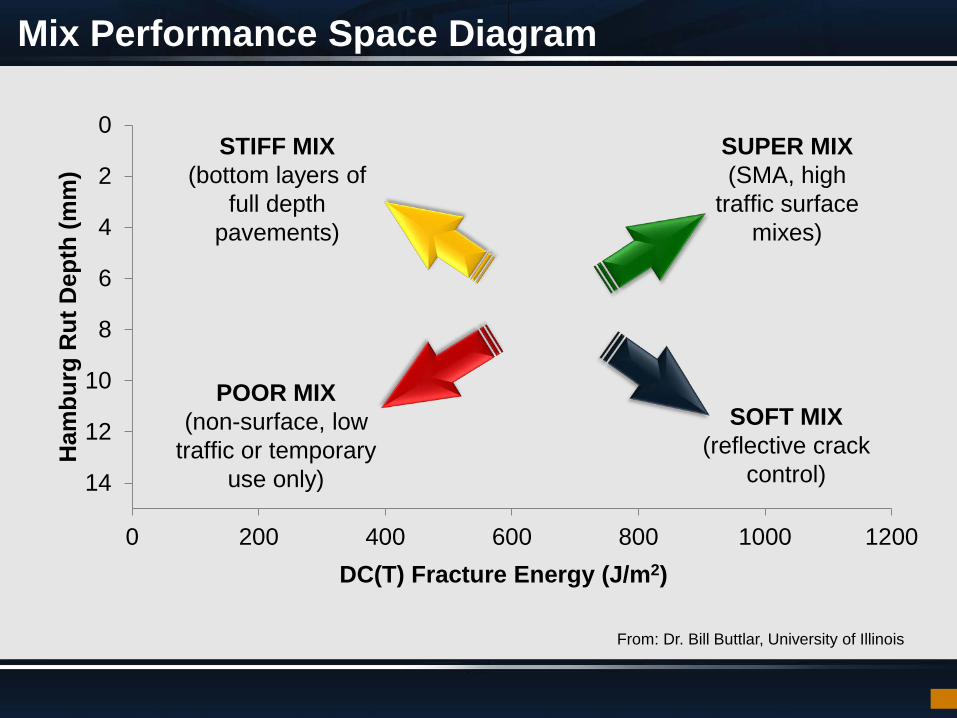
Mix Performance Space Diagram
From: Dr. Bill Buttlar, University of Illinois
0
2
4
6
8
10
12
14
0 200 400 600 800 1000 1200
Ham
burg
Rut
Dep
th (m
m)
DC(T) Fracture Energy (J/m2)
SOFT MIX (reflective crack
control)
SUPER MIX (SMA, high
traffic surface mixes)
POOR MIX (non-surface, low
traffic or temporary use only)
STIFF MIX (bottom layers of
full depth pavements)
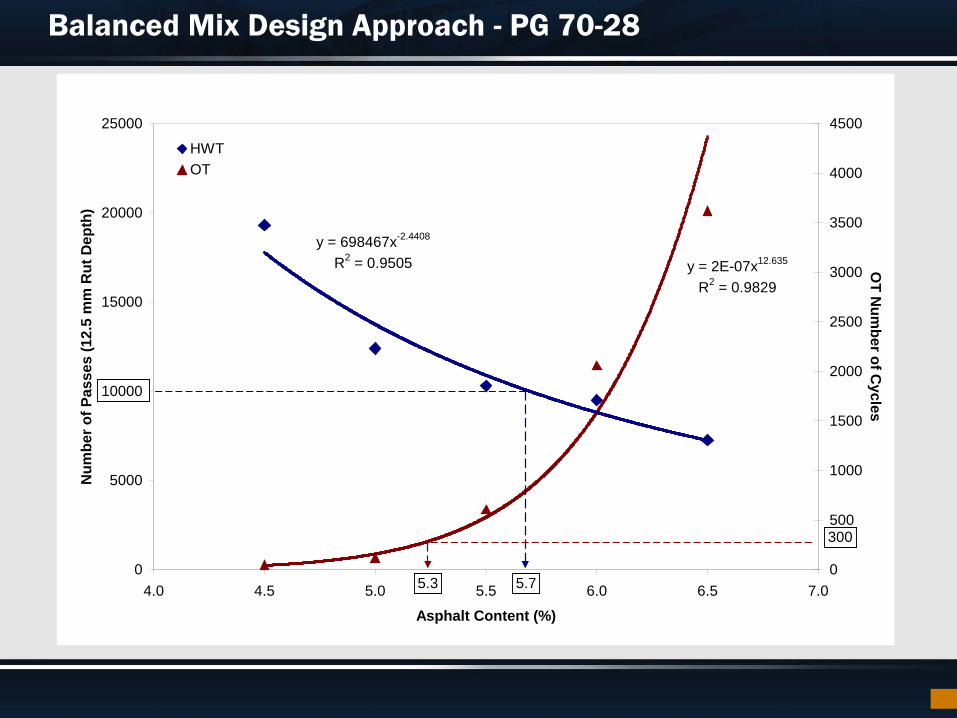
Balanced Mix Design Approach - PG 70-28
y = 2E-07x12.635
R2 = 0.9829
y = 698467x-2.4408
R2 = 0.9505
0
5000
10000
15000
20000
25000
4.0 4.5 5.0 5.5 6.0 6.5 7.0
Asphalt Content (%)
Num
ber o
f Pas
ses
(12.
5 m
m R
ut D
epth
)
0
500
1000
1500
2000
2500
3000
3500
4000
4500
OT N
umber of C
ycles
HWTOT
5.3
300
5.7
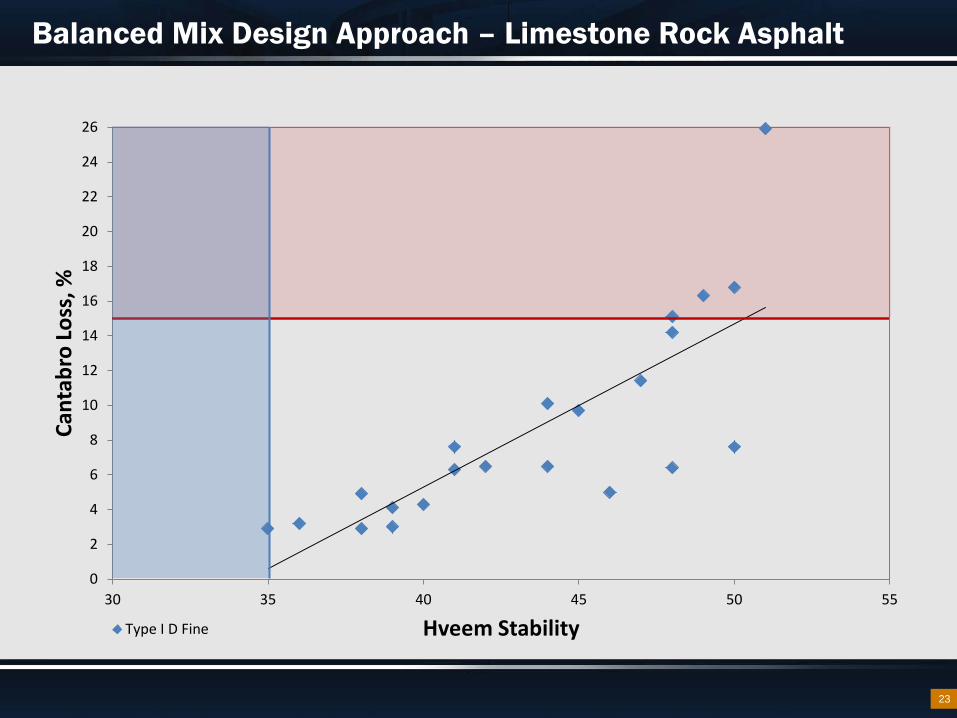
Balanced Mix Design Approach – Limestone Rock Asphalt
23
0
2
4
6
8
10
12
14
16
18
20
22
24
26
30 35 40 45 50 55
Cant
abro
Los
s, %
Hveem Stability Type I D Fine
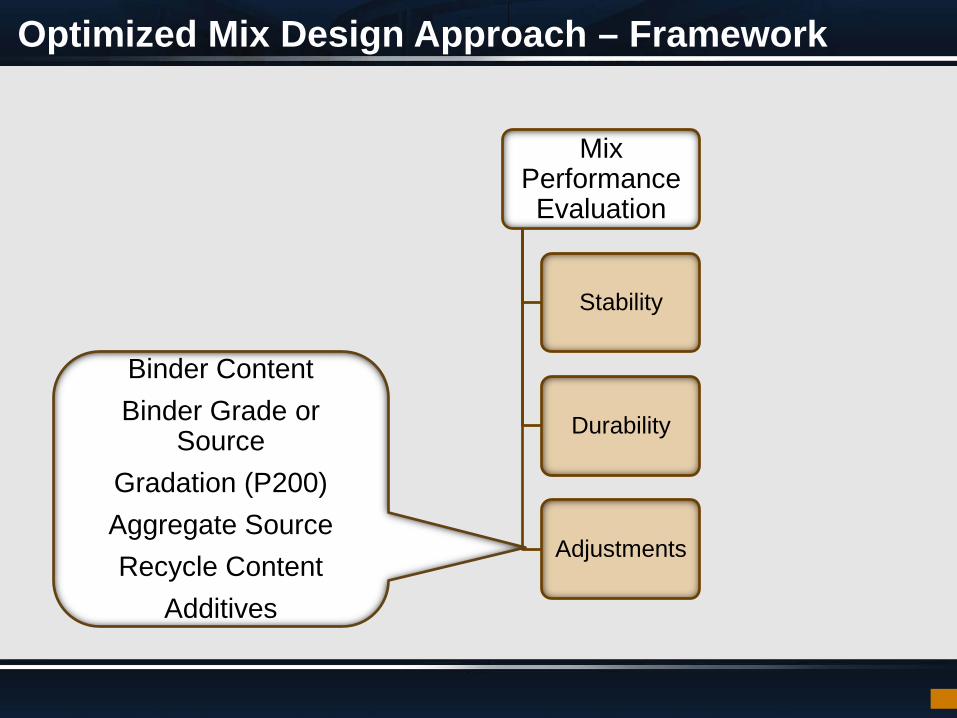
Optimized Mix Design Approach – Framework
Mix Performance Evaluation
Stability
Durability
Adjustments
Binder Content Binder Grade or
Source Gradation (P200) Aggregate Source Recycle Content
Additives
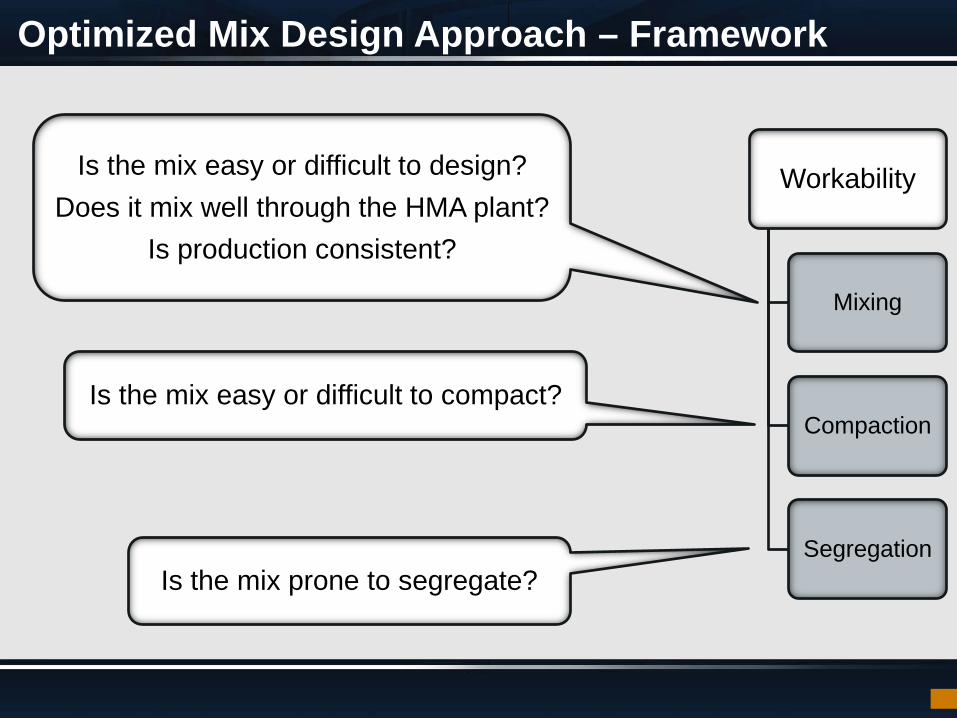
Optimized Mix Design Approach – Framework
Workability
Mixing
Compaction
Segregation
Is the mix easy or difficult to design? Does it mix well through the HMA plant?
Is production consistent?
Is the mix easy or difficult to compact?
Is the mix prone to segregate?
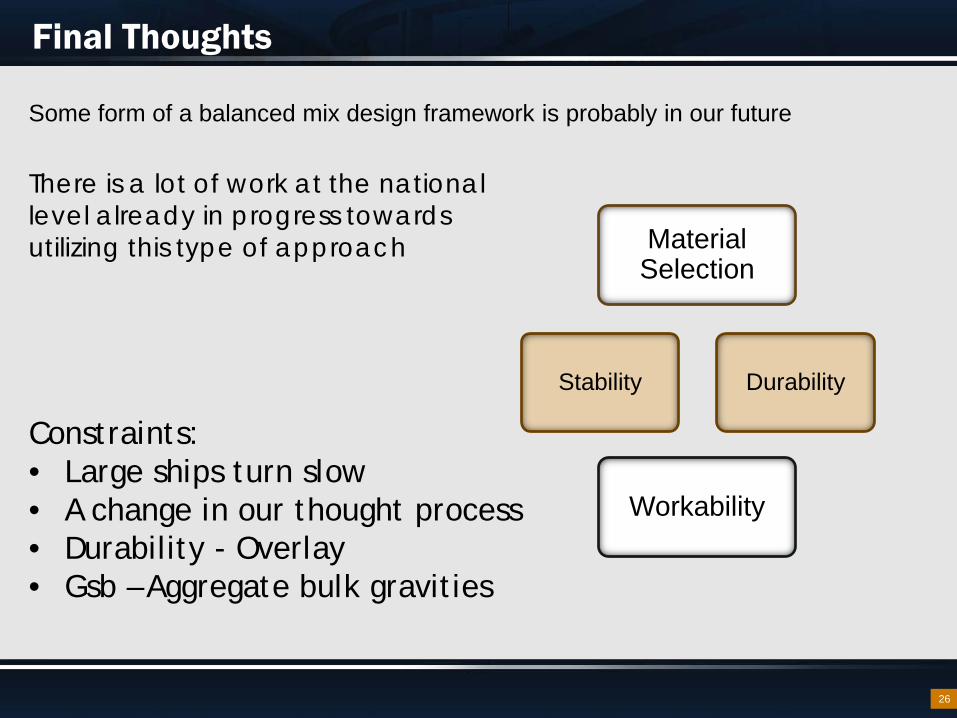
Final Thoughts
26
There is a lot of work at the national level already in progress towards utilizing this type of approach
Some form of a balanced mix design framework is probably in our future
Constraints: • Large ships turn slow • A change in our thought process • Durability - Overlay • Gsb – Aggregate bulk gravities
Stability Durability
Material Selection
Workability

QUESTIONS?