bakery products science and technology (hui/bakery products science and technology) || wheat milling...
TRANSCRIPT

FloursPart 2
Bakery Products Science and Technology, Second Edition. Edited by W. Zhou, Y. H. Hui, I. De Leyn,
M. A. Pagani, C. M. Rosell, J. D. Selman, and N. Therdthai.
© 2014 John Wiley & Sons, Ltd. Published 2014 by John Wiley & Sons, Ltd.
Overview 20
Wheat, a raw material of choice for
bread and bakery products 20
Wheat grain: structure and composition 21
Defining wheat quality: classification
and grading 22
The parameters of wheat quality 23
The concept of quality for the farmer
and during wheat storage 23
The concept of quality at the mill 24
The concept of quality at bakery 25
The concept of quality for consumers 26
The dry milling of wheat 26
Objective 27
Grain storage 28
Grain cleaning 29
Grain conditioning or tempering 29
The milling process 29
Flour characteristics 33
Milling yield and flour refinement 33
Technological properties of flour 33
Nutritional properties of flour 35
Optimization and innovation in
wheat milling 36
Grain storage 36
Grain cleaning 36
Debranning and pearling processes 36
Improvement of flour performance
and exploitation of ancient
milling processes 38
Exploitation of milling by-products 40
Wheat germ 40
Wheat bran 41
Assessing dough rheology for predicting
baking performance 41
Prediction of mixing performance 42
Prediction of proofing performance 43
Prediction of baking performance 45
New instrumental approaches 47
Future trends 47
Acknowledgments 48
References 49
Wheat Milling and Flour Quality EvaluationM. A. Pagani, Alessandra Marti, and Gabriella BottegaDepartment of Food, Environmental and Nutritional Sciences (DeFENS),
Università degli Studi di Milano, Milan, Italy
2
20 CH 2 WHEAT MILLING AND FLOUR QUALITY EVALUATION
OverviewFrom the very beginning, humans realized that
wheat was the most “versatile” of cereals.
Although barley and rye could provide a worka-
ble dough, only wheat could be successfully
transformed into foods that were highly diverse
in their structure and palatability, such as bread,
numerous other baked products, and pasta.
The essential process for obtaining all those
foods is to break and grind wheat kernels and
extract flour, that is, to mill the kernels. Milling, in
fact, makes it possible to separate the main region
of the wheat grain, the starchy endosperm – rich
in technological functional compounds – from
the bran and germ. At the same time, milling
breaks down the endosperm into a product of
fine particle size. When water is added, the huge
surface of the flour particles provides a homoge-
neous, complete, and almost instantaneous
hydration of the protein macromolecules, the
first and essential phenomenon for dough forma-
tion and development.
The milling systems used today in modern
industrial mills are obviously very different from
those used by our ancestors thousands of years
ago in the Middle East (the Fertile Crescent).
Here wild wheat species were present and led to
the spontaneous selection of mutants, which
later evolved into modern domestic wheat
(Brunckhorst 2006). The first attempts at milling
gave flours rich in bran parts that had a low bread-
making quality (low milling processing). This
problem was overcome with the introduction of
new machinery in the 1800 s, some specializing in
grinding grains (roller mill) and others in sifting
the crushed material (sifter and purifier), in suf-
ficient numbers and succession to produce refined
flours (high milling processing) (Madureri 1995).
Since then, white refined flours have provided
breads with higher sensorial properties, especially
for softness, color, and flavor of the crumb.
Today, flour quality is no longer judged by its
extraction flour yield and its degree of refinement.
Other considerations must also taken into account
such as hygiene, health, and safety (absence of chemi-
cal residue and microorganism contamination
responsible for the production of toxins), techno-
logical properties (which may extend over a wide
range according to the end-use of the flour), and
the presence of high levels of nutritional com-
pounds, in which wheat is naturally rich. All this,
of course, without forgetting the economical
aspects of the process. For this reason, the miller,
whose trade until just a few decades ago was
traditionally passed from father to son, must now-
adays not only have considerable specific experi-
ence allowing to choose the best processing
conditions to suit the characteristics and origin of
the grain to be milled, but also have a knowledge
of food science, chemistry, mechanical engineer-
ing, computer science, and economics. In short,
the art of the miller has today become a science.
Wheat, a raw material of choice for bread and bakery productsThe choice of ingredients is of fundamental
importance for obtaining a leavened product
that will satisfy the customer’s expectations.
The property that makes wheat unique is the
ability of its proteins to form viscoelastic dough.
In other words, wheat dough has unique and
particular rheological properties that enable
the mass to be stretched and deformed without
rupturing, as discussed later. At the same time,
the dough is elastic and tenacious, capable of
maintaining its assigned shape even when
subjected to physical stress. After baking, gluten
proteins lose their viscosity, assuring the mainte-
nance of the final shape. The reason for wheat’s
peculiar and versatile behavior is not due to
quantitative differences. In fact, the protein con-
tent of the numerous varieties of wheat is quite
variable, from 9 to 16% of the weight of the entire
grain (Chung and others 2003; Delcour and
Hoseney 2010). This variability practically coin-
cides with that of other cereals.
The technological superiority of wheat is due
to the more complex differences of quality that
can be observed, especially at the protein fraction
WHEAT, A RAW MATERIAL OF CHOICE FOR BREAD AND BAKERY PRODUCTS 21
level, as discussed in detail in Chapter 3. It is the
only cereal to have storage proteins (gliadins
and glutenins, together representing about 80%
of the entire protein content) characterized by a
particular amino acid composition. They are gen-
erally classified according to molecular weight
(MW), solubility, and conformation. The storage
proteins have a high percentage of glutamic acid
(equal to about a third of all the residual amino
acids and present as glutamine) and proline, and
with a small quantity of lysine (Shewry and oth-
ers 2009). Such a composition is responsible not
only for the low biological value, but also for
allowing protein–protein interactions that lead
to the formation of gluten, a three-dimensional
network that is continuous and homogenous
throughout the dough mass.
Wheat grain: structure and composition
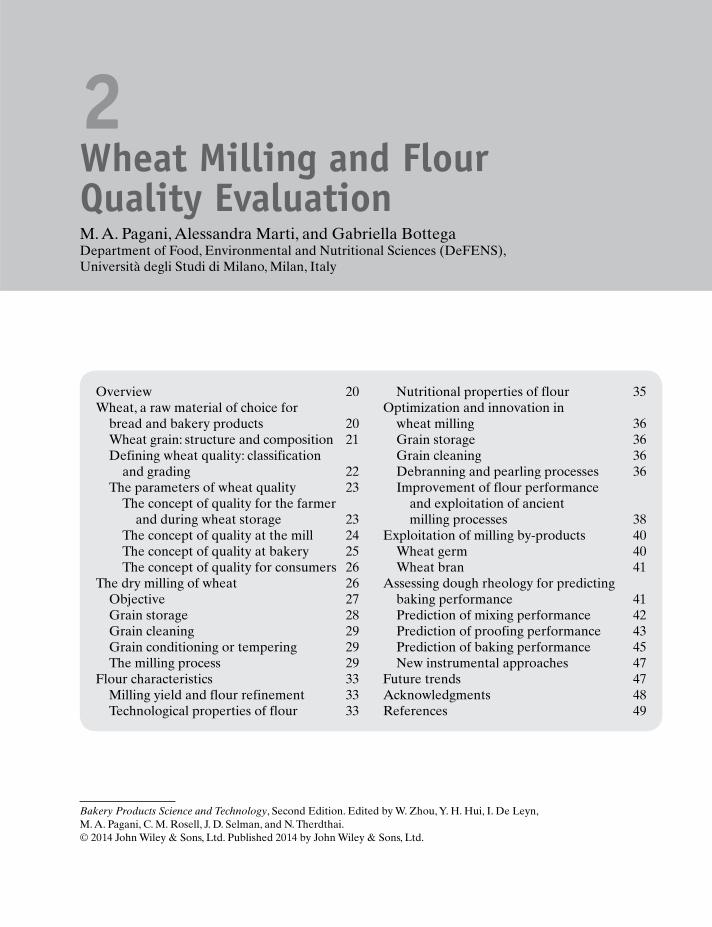
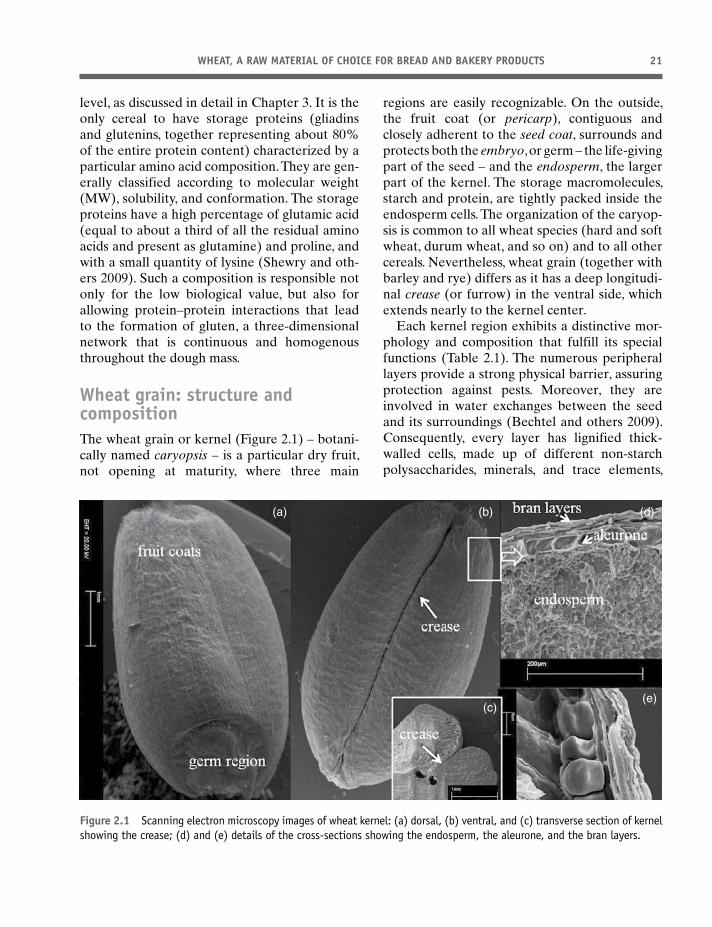
The wheat grain or kernel (Figure 2.1) – botani-
cally named caryopsis – is a particular dry fruit,
not opening at maturity, where three main
regions are easily recognizable. On the outside,
the fruit coat (or pericarp), contiguous and
closely adherent to the seed coat, surrounds and
protects both the embryo, or germ – the life- giving
part of the seed – and the endosperm, the larger
part of the kernel. The storage macromolecules,
starch and protein, are tightly packed inside the
endosperm cells. The organization of the caryop-
sis is common to all wheat species (hard and soft
wheat, durum wheat, and so on) and to all other
cereals. Nevertheless, wheat grain (together with
barley and rye) differs as it has a deep longitudi-
nal crease (or furrow) in the ventral side, which
extends nearly to the kernel center.
Each kernel region exhibits a distinctive mor-
phology and composition that fulfill its special
functions (Table 2.1). The numerous peripheral
layers provide a strong physical barrier, assuring
protection against pests. Moreover, they are
involved in water exchanges between the seed
and its surroundings (Bechtel and others 2009).
Consequently, every layer has lignified thick-
walled cells, made up of different non-starch
polysaccharides, minerals, and trace elements,
(a) (b)
(c)(e)
(d)
Figure 2.1 Scanning electron microscopy images of wheat kernel: (a) dorsal, (b) ventral, and (c) transverse section of kernel
showing the crease; (d) and (e) details of the cross-sections showing the endosperm, the aleurone, and the bran layers.
22 CH 2 WHEAT MILLING AND FLOUR QUALITY EVALUATION
while the cells of contiguous layers are each ori-
ented in orthogonal directions.
The germ consists of two main parts: the
embryonic axis that will give the future plant and
the scutellum, a region with nutritive elements
for the shoot. The germ, therefore, has a high per-
centage of sugars, soluble proteins, fats, vitamins,
and minerals, but no starch or gluten is present.
The third region, the endosperm, represents
about 80% of the whole grain’s weight and also
consists of two parts: the aleurone layer, formed
by cubic cells, and the starchy endosperm
(Figure 2.1). Due to its composition (high protein,
lipid, sugars, and ash content, as well as vitamins
and phytate), the aleurone layer spontaneously
merges with bran during milling. The cells in the
starchy endosperm have varying shapes, sizes,
and wall thickness. In particular, in the more
internal part of endosperm, the cells are thin-
walled, with a higher starch content compared
with the outside region (Bechtel and others
2009). Scientific and technological interest was
mostly focused on the latter until the beginning
of this millennium (Poutanen 2012), because it
was made into flour, the main raw material for
bread and pasta products. As over-consumption
of highly refined and highly caloric foods had
been strongly related to the “metabolic syn-
drome” increase in the western world (Shewry
and others 2012), attention is now increasingly
focused on bran and germ as sources of many
bioactive compounds and phytochemicals. Many
projects and research programs are now dedi-
cated to the possibility of exploiting milling
by-products in both traditional and new foods
(Doblado-Maldonado and others 2012; Delcour
and others 2012).
Defining wheat quality: classification and grading
The different species of wheat (14 species are
grown all around the world) (Wrigley 2009) are clas-
sified according to the number of chromosomes
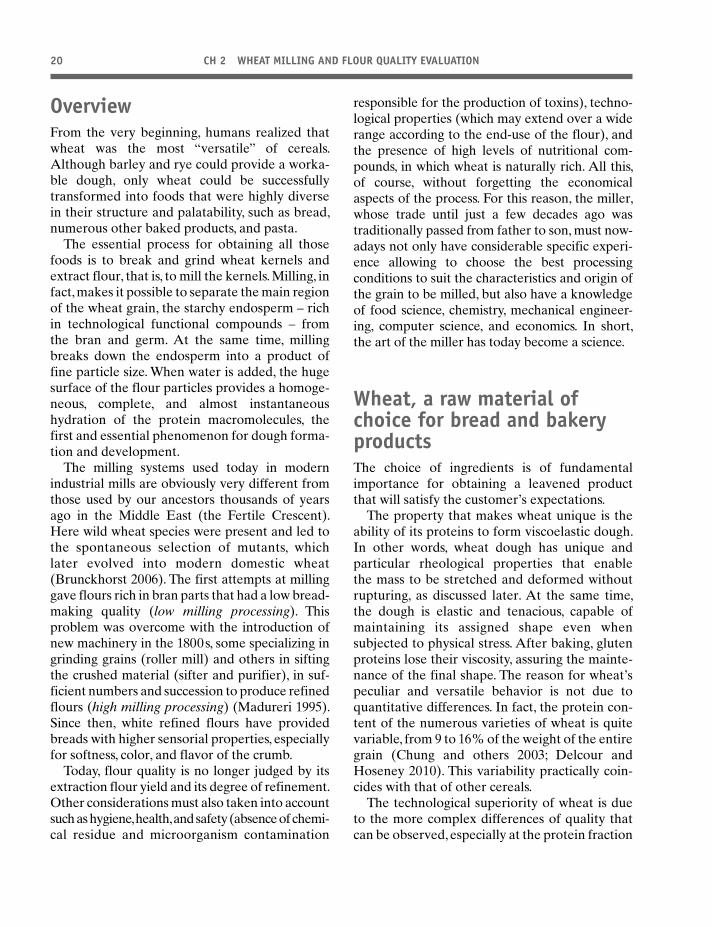
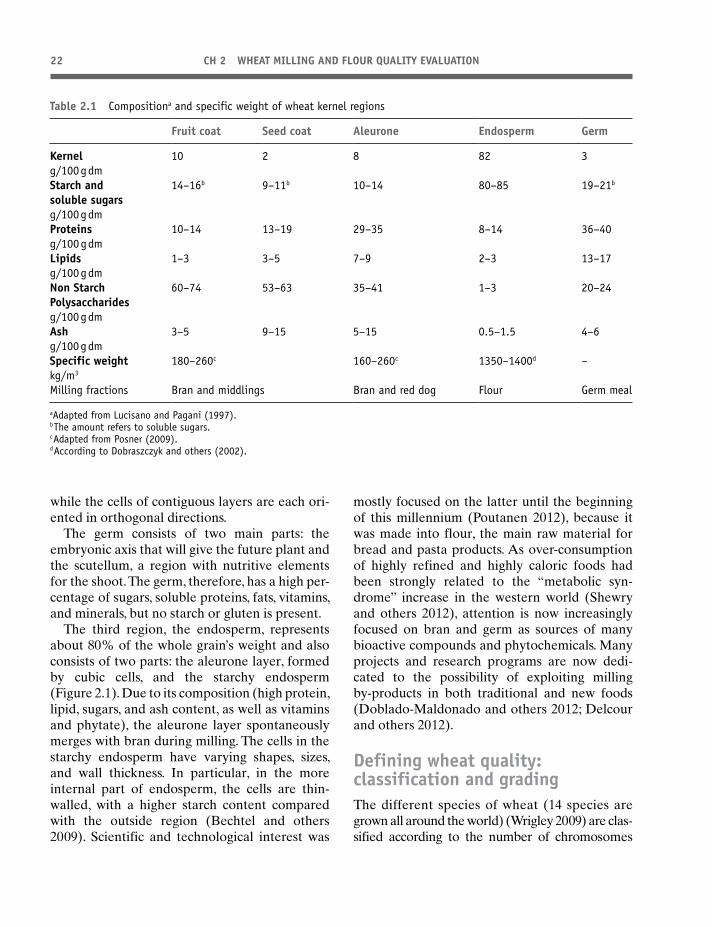
Table 2.1 Compositiona and specific weight of wheat kernel regions
Fruit coat Seed coat Aleurone Endosperm Germ
Kernel
g/100 g dm
10 2 8 82 3
Starch and
soluble sugars
g/100 g dm
14–16b 9–11b 10–14 80–85 19–21b
Proteins
g/100 g dm
10–14 13–19 29–35 8–14 36–40
Lipids
g/100 g dm
1–3 3–5 7–9 2–3 13–17
Non Starch
Polysaccharides
g/100 g dm
60–74 53–63 35–41 1–3 20–24
Ash
g/100 g dm
3–5 9–15 5–15 0.5–1.5 4–6
Specific weight
kg/m3
180–260c 160–260c 1350–1400d –
Milling fractions Bran and middlings Bran and red dog Flour Germ meal
aAdapted from Lucisano and Pagani (1997).b The amount refers to soluble sugars.c Adapted from Posner (2009).d According to Dobraszczyk and others (2002).
WHEAT, A RAW MATERIAL OF CHOICE FOR BREAD AND BAKERY PRODUCTS 23
into diploid wheat (14 chromosomes, e.g., einkorn
wheat), tetraploid wheat (28 chromosomes; e.g.,
durum wheat and emmer wheat) and hexaploid
wheat (42 chromosomes; e.g., common or bread
wheat). Presently, about 30 000 varieties are
known, of which about 1000 are of commercial
interest. In any case, each year a huge number of
new varieties are developed by crossing and
selecting procedures to meet various agronomic,
nutritional, and technological requirements. In
this chapter, we focus on common wheat (Triticum aestivum), as it represents the main species culti-
vated throughout the world and the source of
flour for bread making.
The parameters of wheat quality
Due to their wide variability, trading, and utiliza-
tion, harvested crops are necessarily based on
classification systems, suitable for describing the
“wheat quality” grade of the product. The term
“quality” is often used in a very broad sense to
define the overall potential for wheat to be suc-
cessfully transformed into certain end products.
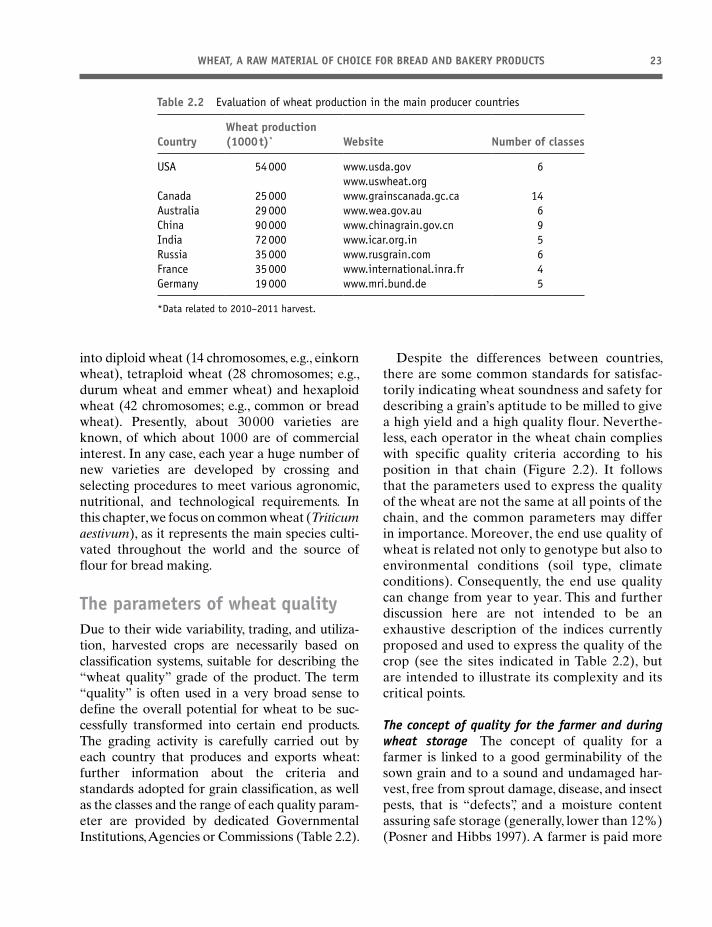
The grading activity is carefully carried out by
each country that produces and exports wheat:
further information about the criteria and
standards adopted for grain classification, as well
as the classes and the range of each quality param-
eter are provided by dedicated Governmental
Institutions, Agencies or Commissions (Table 2.2).
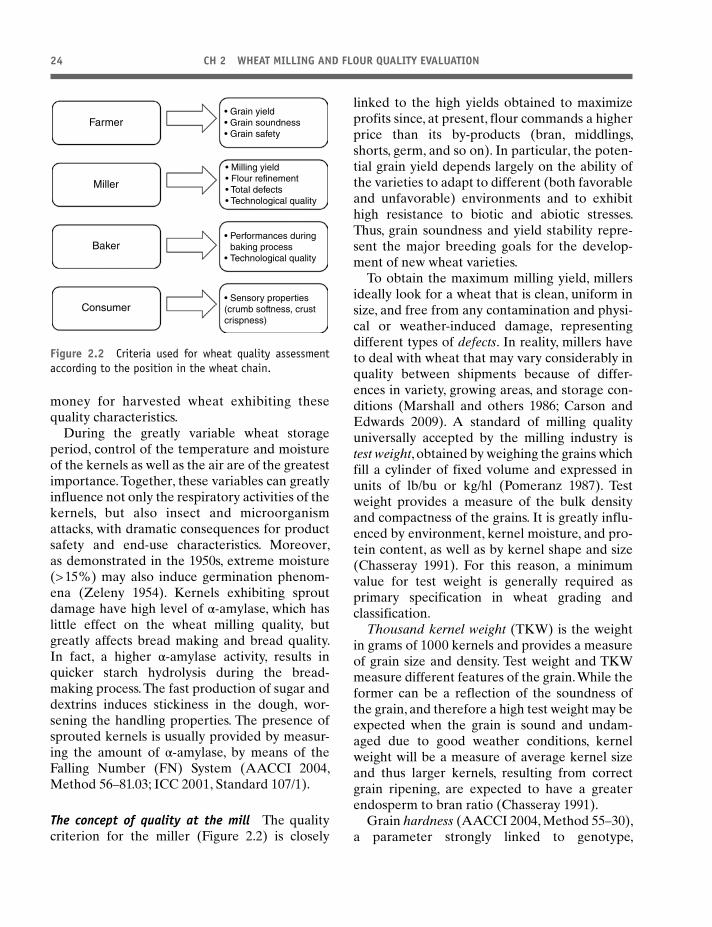
Despite the differences between countries,
there are some common standards for satisfac-
torily indicating wheat soundness and safety for
describing a grain’s aptitude to be milled to give
a high yield and a high quality flour. Neverthe-
less, each operator in the wheat chain complies
with specific quality criteria according to his
position in that chain (Figure 2.2). It follows
that the parameters used to express the quality
of the wheat are not the same at all points of the
chain, and the common parameters may differ
in importance. Moreover, the end use quality of
wheat is related not only to genotype but also to
environmental conditions (soil type, climate
conditions). Consequently, the end use quality
can change from year to year. This and further
discussion here are not intended to be an
exhaustive description of the indices currently
proposed and used to express the quality of the
crop (see the sites indicated in Table 2.2), but
are intended to illustrate its complexity and its
critical points.
The concept of quality for the farmer and during
wheat storage The concept of quality for a
farmer is linked to a good germinability of the
sown grain and to a sound and undamaged har-
vest, free from sprout damage, disease, and insect
pests, that is “defects”, and a moisture content
assuring safe storage (generally, lower than 12%)
(Posner and Hibbs 1997). A farmer is paid more
Table 2.2 Evaluation of wheat production in the main producer countries
Country
Wheat production
(1000 t)* Website Number of classes
USA 54 000 www.usda.gov
www.uswheat.org
6
Canada 25 000 www.grainscanada.gc.ca 14
Australia 29 000 www.wea.gov.au 6
China 90 000 www.chinagrain.gov.cn 9
India 72 000 www.icar.org.in 5
Russia 35 000 www.rusgrain.com 6
France 35 000 www.international.inra.fr 4
Germany 19 000 www.mri.bund.de 5
*Data related to 2010–2011 harvest.
24 CH 2 WHEAT MILLING AND FLOUR QUALITY EVALUATION
money for harvested wheat exhibiting these
quality characteristics.
During the greatly variable wheat storage
period, control of the temperature and moisture
of the kernels as well as the air are of the greatest
importance. Together, these variables can greatly
influence not only the respiratory activities of the
kernels, but also insect and microorganism
attacks, with dramatic consequences for product
safety and end-use characteristics. Moreover,
as demonstrated in the 1950s, extreme moisture
(> 15%) may also induce germination phenom-
ena (Zeleny 1954). Kernels exhibiting sprout
damage have high level of α-amylase, which has
little effect on the wheat milling quality, but
greatly affects bread making and bread quality.
In fact, a higher α-amylase activity, results in
quicker starch hydrolysis during the bread-
making process. The fast production of sugar and
dextrins induces stickiness in the dough, wor-
sening the handling properties. The presence of
sprouted kernels is usually provided by measur-
ing the amount of α-amylase, by means of the
Falling Number (FN) System (AACCI 2004,
Method 56–81.03; ICC 2001, Standard 107/1).
The concept of quality at the mill The quality
criterion for the miller (Figure 2.2) is closely
linked to the high yields obtained to maximize
profits since, at present, flour commands a higher
price than its by-products (bran, middlings,
shorts, germ, and so on). In particular, the poten-
tial grain yield depends largely on the ability of
the varieties to adapt to different (both favorable
and unfavorable) environments and to exhibit
high resistance to biotic and abiotic stresses.
Thus, grain soundness and yield stability repre-
sent the major breeding goals for the develop-
ment of new wheat varieties.
To obtain the maximum milling yield, millers
ideally look for a wheat that is clean, uniform in
size, and free from any contamination and physi-
cal or weather-induced damage, representing
different types of defects. In reality, millers have
to deal with wheat that may vary considerably in
quality between shipments because of differ-
ences in variety, growing areas, and storage con-
ditions (Marshall and others 1986; Carson and
Edwards 2009). A standard of milling quality
universally accepted by the milling industry is
test weight, obtained by weighing the grains which
fill a cylinder of fixed volume and expressed in
units of lb/bu or kg/hl (Pomeranz 1987). Test
weight provides a measure of the bulk density
and compactness of the grains. It is greatly influ-
enced by environment, kernel moisture, and pro-
tein content, as well as by kernel shape and size
(Chasseray 1991). For this reason, a minimum
value for test weight is generally required as
primary specification in wheat grading and
classification.
Thousand kernel weight (TKW) is the weight
in grams of 1000 kernels and provides a measure
of grain size and density. Test weight and TKW
measure different features of the grain. While the
former can be a reflection of the soundness of
the grain, and therefore a high test weight may be
expected when the grain is sound and undam-
aged due to good weather conditions, kernel
weight will be a measure of average kernel size
and thus larger kernels, resulting from correct
grain ripening, are expected to have a greater
endosperm to bran ratio (Chasseray 1991).
Grain hardness (AACCI 2004, Method 55–30),
a parameter strongly linked to genotype,
Farmeret
re
T
(cr
cr
er
C
Figure 2.2 Criteria used for wheat quality assessment
according to the position in the wheat chain.
WHEAT, A RAW MATERIAL OF CHOICE FOR BREAD AND BAKERY PRODUCTS 25
represents another important aspect of quality,
being directly related to the force required and
the energy consumed during grinding and mill-
ing. As it strongly affects grain tempering and
milling performances, hardness represents a
determinant parameter in creating homogeneous
grain batches. Hard kernels are more resistant to
reduction in size than soft kernels and require
more energy to be crushed, but an overlap
between the two classes still remains (Posner
2009). The textural differences between hard and
soft wheat are determined by the presence of
specific low molecular weight (LMW) proteins,
the puroindolines (Morris 2002). The presence of
these LMW proteins, occurring in soft varieties,
promotes a weak adhesion among the starch
granules and the protein matrix, favoring
endosperm breakage (Barlow and others 1973;
Greenwell and Schofield 1986).
Chemical characteristics (moisture, protein,
and ash content) of wheat are not generally
included in grading standards, but they are uni-
versally reputed to greatly influence the tech-
nological quality of wheat. Moisture content (AACCI 2004, Method 44–19; ICC 2001,
Standard 110/1) is very important to millers when
buying grain lots. The percentages of other com-
ponents, such as protein and starch, and test
weight are inversely related to the moisture con-
tent (Troccoli and others 2000). The latter is
therefore used for calculating the price of the
product in the international market. This aspect
has to be considered when comparing lots of
grain from various countries. As already dis-
cussed, moisture, when too high, strongly influ-
ences spoilage and deterioration phenomena
during storage (Bailey 1992). On the other hand,
if the wheat is too dry, the miller would have to
use a two-stage tempering process to prepare the
wheat for milling, thus adding time and expense.
Despite the strategic role assumed for safe stor-
age and its economic and technological implica-
tions, at present there is no moisture level
accepted worldwide as a basis for expressing
quality characteristics (Posner 2009).
The ash content of wheat is the mineral residue
remaining after incineration of the sample
(AACCI 2004, Method 08–12.01; ICC 2001,
Standard 104/1). This parameter is carefully
measured as it can affect milling yield. The inclu-
sion of some milling fractions could give an
excessive ash value in the end flour.
The protein content of wheat can vary consid-
erably from 9 to 16% of the weight of the entire
grain; this variation strongly depends on the
wheat variety, the growing conditions, the soil
fertility, and the fertilizer inputs, particularly
nitrogen (Carson and Edwards 2009). As is well
known, the amount of protein strictly influences
the end use of the flour. Generally, high protein
content is associated with high gluten content
and the ability to form a strong dough–best for
bread making, especially when long leavening
steps are required (Pagani and others 2010). Thus,
the blending of different wheat varieties (often
using imported wheat) allows the miller to create
wheat mixtures with improved end-use function-
ality, and to supply flour types with constant
protein quantity and quality. The protein amount
is determined as nitrogen (with a conversion
factor of N * 5.7) by the Kjeldahl method (AACCI
2004, Method 46–16; ICC 2001, Standard 105/2)
or by the automatic Dumas combustion method
(AACCI 2004, Method 46–30; ICC 2001,
Standard 167).
Millers also have to meet the flour specifica-
tions demanded by their customers. According to
the final destination of the products (industrial,
commercial, or retail), the type of product (fresh
or frozen dough, partially of fully baked, and so
on), the formulation of the product, and the tech-
nological process adopted, the main factors to be
considered are protein content, dough strength,
water absorption, mixing properties, and Falling
Number (Carson and Edwards 2009).
The concept of quality at bakery For the bakery
industry, a superior quality wheat has the techno-
logical capacity to form a cohesive and homoge-
nous dough, as well as the ability to retain the
gases produced during fermentation that are
responsible for the textural and sensorial proper-
ties of bread and baked-products (Figure 2.2).
Thus, the contribution of protein is a determinant
26 CH 2 WHEAT MILLING AND FLOUR QUALITY EVALUATION
for quality. Protein content is a fair indicator for
flour applications (low-protein wheat is used
for pastry, cakes, and cookies, and high-protein
wheat is used for bread and blending purposes)
(Pomeranz 1987; Carson and Edwards 2009), but
the evaluation of protein quality makes it possi-
ble to improve the conditions of the baking pro-
cesses. The numerous rheological approaches
used for this purpose are described here.
The concept of quality for consumers The
high-quality breads and cakes preferred by con-
sumers in North America or in Northern Europe
differ significantly from those preferred by con-
sumers in Mediterranean countries (Carson and
Edwards 2009; see also Chapter 40). Nevertheless,
development in volume – the specific volume
(expressed as the ratio between volume and
weight of bread) – and the distribution of cell size
represent physical characteristics that are univer-
sally used for defining the quality of bread (Pyler
1988). At the macroscopic level, these indices
show the structure of the crumb cell (percentage
of alveoli in the total volume, the distribution of
coarse and fine alveoli, and so on) and, together
with moisture, represent the complex result of
the interaction between the properties of the raw
materials and the conditions applied at each
phase of the bread-making process (Pagani and
others 2010).
The dry milling of wheatAbout 70% of the production of wheat world-
wide is used for food (www.fao.org), mainly in
the bakery industry (both for bread and other
bakery products). It is estimated that approxi-
mately 350 million tons of flour are produced
and transformed into bread and bakery products
each year (De Bry 2006). This use has an essen-
tial preliminary step: the milling process.
The principle on which current industrial
wheat milling is based is quite different from
those principles applied in both the distant and
recent past. The first attempts at flour production
date back to the Neolithic era and consisted of
grinding grains with stones, and later progressing
to mortars and pestles (Webb and Owens 2003).
About 5000 years ago (the Bronze Age), the sad-
dle stone was introduced, as testified in Egyptian
inscriptions and drawings. Milling with millstones
is more recent (even though it dates back to
1000 BC) and continued to be used until around
1850, and is still present in some traditional pro-
cesses. The first mills were powered by hand or
by working animals; watermills and windmills
were not introduced until much later (Madureri
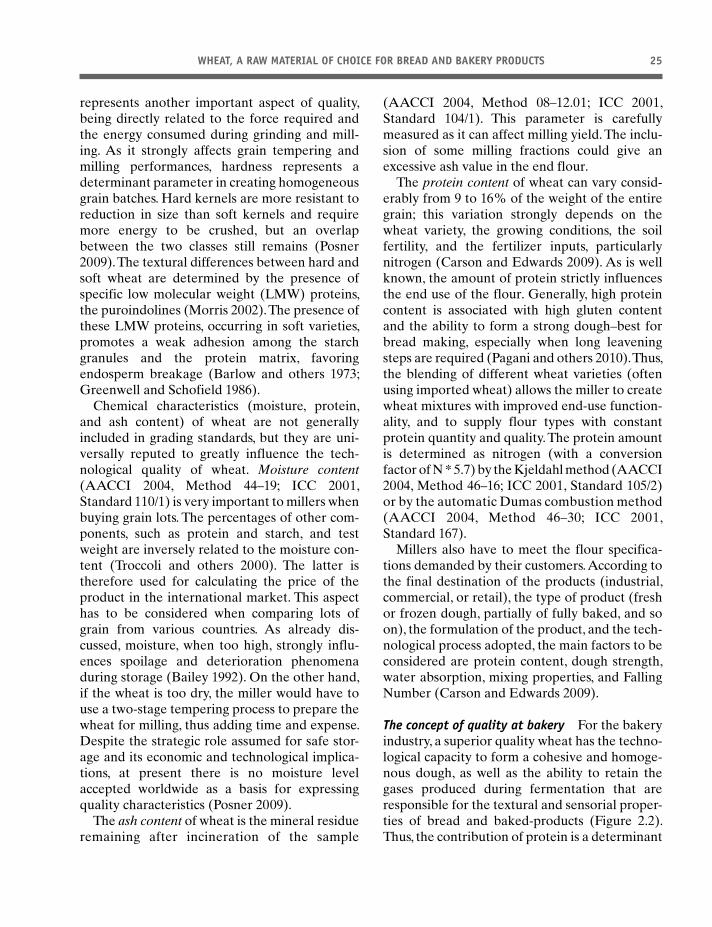
1995). Two overlapping components were pre-
sent in all types of millstones: the stationary base
or bedstone and the mobile runner stone, both
made of very hard stone. As well as taking advan-
tage of the natural roughness of the stone, the
surface of the millstone was worked with chan-
nels and furrows of different shapes (Figure 2.3).
During rotation, the kernel was ground between
the two stones and the ground material collected
at the bottom of the bedstone. Even though the
first attempts at milling (using mortar and pestle
Figure 2.3 Millstone (courtesy of Molino Quaglia S.p.A.).
THE DRY MILLING OF WHEAT 27
and millstones) crushed the grain effectively,
these processes only partially removed the bran
and germ from the endosperm.
The milling process was revolutionized during
the second half of the 19th century with the intro-
duction of cast iron roller mills (Madureri 1995)
and the belief that progressive and delicate
grinding actions, each alternated by sieving and
sifting the ground material, would give a greater
yield and a better separation of the bran
(Dobraszczyk 2001).
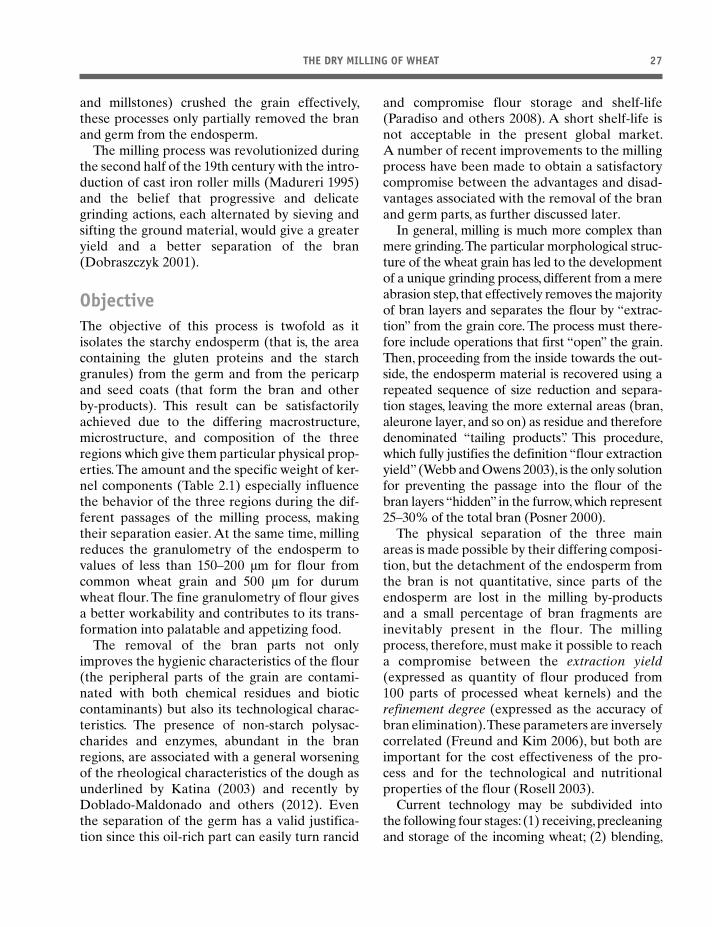
Objective
The objective of this process is twofold as it
isolates the starchy endosperm (that is, the area
containing the gluten proteins and the starch
granules) from the germ and from the pericarp
and seed coats (that form the bran and other
by-products). This result can be satisfactorily
achieved due to the differing macrostructure,
microstructure, and composition of the three
regions which give them particular physical prop-
erties. The amount and the specific weight of ker-
nel components (Table 2.1) especially influence
the behavior of the three regions during the dif-
ferent passages of the milling process, making
their separation easier. At the same time, milling
reduces the granulometry of the endosperm to
values of less than 150–200 μm for flour from
common wheat grain and 500 μm for durum
wheat flour. The fine granulometry of flour gives
a better workability and contributes to its trans-
formation into palatable and appetizing food.
The removal of the bran parts not only
improves the hygienic characteristics of the flour
(the peripheral parts of the grain are contami-
nated with both chemical residues and biotic
contaminants) but also its technological charac-
teristics. The presence of non-starch polysac-
charides and enzymes, abundant in the bran
regi ons, are associated with a general worsening
of the rheological characteristics of the dough as
underlined by Katina (2003) and recently by
Doblado-Maldonado and others (2012). Even
the separation of the germ has a valid justifica-
tion since this oil-rich part can easily turn rancid
and compromise flour storage and shelf-life
(Paradiso and others 2008). A short shelf-life is
not acceptable in the present global market.
A number of recent improvements to the milling
process have been made to obtain a satisfactory
compromise between the advantages and disad-
vantages associated with the removal of the bran
and germ parts, as further discussed later.
In general, milling is much more complex than
mere grinding. The particular morphological struc-
ture of the wheat grain has led to the development
of a unique grinding process, different from a mere
abrasion step, that effectively removes the majority
of bran layers and separates the flour by “extrac-
tion” from the grain core. The process must there-
fore include operations that first “open” the grain.
Then, proceeding from the inside towards the out-
side, the endosperm material is recovered using a
repeated sequence of size reduction and separa-
tion stages, leaving the more external areas (bran,
aleurone layer, and so on) as residue and therefore
denominated “tailing products”. This procedure,
which fully justifies the definition “flour extraction
yield” (Webb and Owens 2003), is the only solution
for preventing the passage into the flour of the
bran layers “hidden” in the furrow, which represent
25–30% of the total bran (Posner 2000).
The physical separation of the three main
areas is made possible by their differing composi-
tion, but the detachment of the endosperm from
the bran is not quantitative, since parts of the
endosperm are lost in the milling by-products
and a small percentage of bran fragments are
inevitably present in the flour. The milling
process, therefore, must make it possible to reach
a compromise between the extraction yield
(expressed as quantity of flour produced from
100 parts of processed wheat kernels) and the
refinement degree (expressed as the accuracy of
bran elimination). These parameters are inversely
correlated (Freund and Kim 2006), but both are
important for the cost effectiveness of the pro-
cess and for the technological and nutritional
properties of the flour (Rosell 2003).
Current technology may be subdivided into
the following four stages: (1) receiving, precleaning
and storage of the incoming wheat; (2) blending,
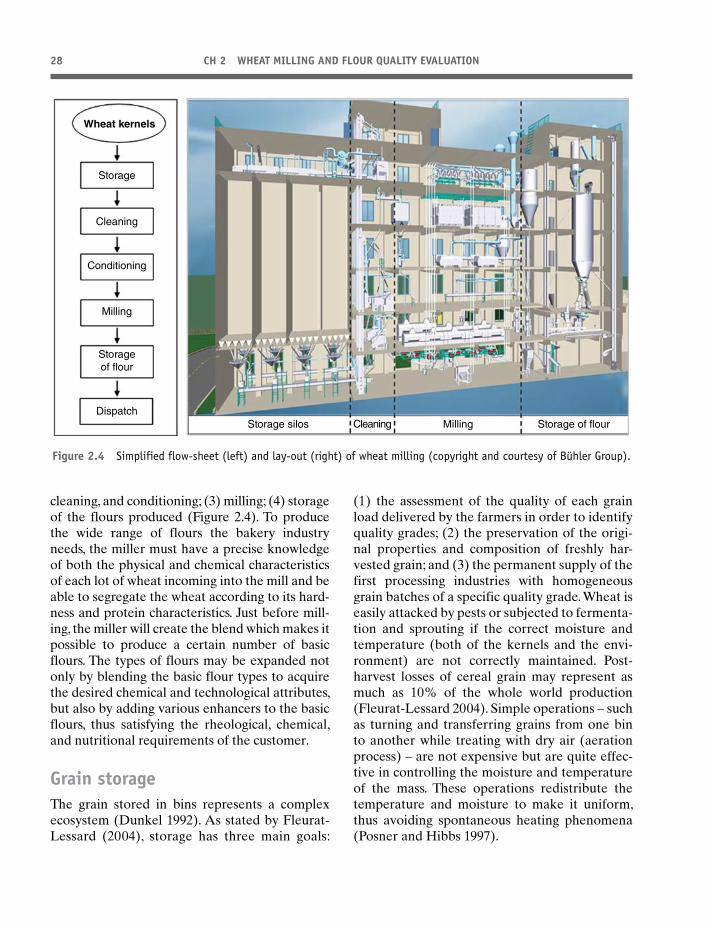
28 CH 2 WHEAT MILLING AND FLOUR QUALITY EVALUATION
cleaning, and conditioning; (3) milling; (4) storage
of the flours produced (Figure 2.4). To produce
the wide range of flours the bakery industry
needs, the miller must have a precise knowledge
of both the physical and chemical characteristics
of each lot of wheat incoming into the mill and be
able to segregate the wheat according to its hard-
ness and protein characteristics. Just before mill-
ing, the miller will create the blend which makes it
possible to produce a certain number of basic
flours. The types of flours may be expanded not
only by blending the basic flour types to acquire
the desired chemical and technological attributes,
but also by adding various enhancers to the basic
flours, thus satisfying the rheological, chemical,
and nutritional requirements of the customer.
Grain storage
The grain stored in bins represents a complex
ecosystem (Dunkel 1992). As stated by Fleurat-
Lessard (2004), storage has three main goals:
(1) the assessment of the quality of each grain
load delivered by the farmers in order to identify
quality grades; (2) the preservation of the origi-
nal properties and composition of freshly har-
vested grain; and (3) the permanent supply of the
first processing industries with homogeneous
grain batches of a specific quality grade. Wheat is
easily attacked by pests or subjected to fermenta-
tion and sprouting if the correct moisture and
temperature (both of the kernels and the envi-
ronment) are not correctly maintained. Post-
harvest losses of cereal grain may represent as
much as 10% of the whole world production
(Fleurat-Lessard 2004). Simple operations – such
as turning and transferring grains from one bin
to another while treating with dry air (aeration
process) – are not expensive but are quite effec-
tive in controlling the moisture and temperature
of the mass. These operations redistribute the
temperature and moisture to make it uniform,
thus avoiding spontaneous heating phenomena
(Posner and Hibbs 1997).
Wheat kernels
Storage
Cleaning
Conditioning
Milling
Storage
of flour
Storage of flour
Dispatch
Storage silos Cleaning Milling
Figure 2.4 Simplified flow-sheet (left) and lay-out (right) of wheat milling (copyright and courtesy of Bühler Group).
THE DRY MILLING OF WHEAT 29
Nowadays, as well as conventional fumigation
processes (regulated by the legislation of each
country but not allowed for organic wheat),
physical treatments are becoming increasingly
preferred as they give similar control of infestants
without leaving chemical residues in the grains
(Fields and White 2002). Both high- and low-
temperature treatments protect grains from
pests, although low temperatures are preferable.
Values below 10 °C induce no modifications and/
or interactions in functional macromolecules but
inhibit activity of insects and fungi (Bailey 1992).
Heating above 40 °C kills insects and promotes
grain drying, but it can also induce internal fissur-
ing and partial protein denaturation (Pomeranz
1992). Another alternative storage practice is
the replacement of air with CO2 or N
2, or their
mixtures, to create a controlled atmosphere with
a low oxygen content (less than 1.5%), appropri-
ate for controlling pest development (Bell and
Armitage 1992).
Grain cleaning
The wheat that arrives at the mill is usually trans-
ported in bulk in trucks, trains or ships and is
unloaded into large hoppers with a grilled opening
to facilitate the elimination of large foreign matter.
This operation is preceded by rapid analytical
inspections of representative samples of the entire
batch to assess compliance with the quality para-
meters established by the company. Preliminary
cleaning operations made before loading the
wheat into the silos of the mill mainly remove
coarse foreign matter and extend storage.
The actual cleaning of the wheat is made
immediately before the milling process in the
“cleaning house”. Differences in the number and
types of cleaning steps can be observed in the
diagram used by each mill. In any case, some
operations are essential. The cleaning system,
therefore, involves a sequence of operations,
each performed by a special machine with the
aim of removing impurities, foreign materials,
and powders. Difference in size, shape, density,
kernel hardness and friability, and composition
with respect to the whole and sound wheat grains
is used to achieve this (Posner and Hibbs 1997;
Posner 2009). Cleaning is often carried out in two
stages, separated by a conditioning step. The sec-
ond phase consists of a friction action carried out
by a scourer to remove the outer pericarp layers,
thus promoting a polishing effect.
Grain conditioning or tempering
The conditioning or tempering stage of the kernels
is decisive for obtaining a good milling result. This
operation covers both the grain humidification
(using a tempering mixer) and the successive rest
period so that a 2–4% increase in water content is
reached. This conditioning reduces the friability
of the bran, which causes it to break off as large
particles, and mellows and makes the starchy
endosperm more fragile, thereby facilitating sepa-
ration between the two regions. The conditioning
time (which varies between 6 and more than
24–36 h) and the quantity of water used – and the
way it is added (1 or 2 tempering steps) – depend
not only on the initial humidity of the material,
but above all on the degree of hardness and vitre-
ousness of the kernels. These parameters relate to
the compactness with which the starch and pro-
teins are organized in the endosperm (Chasseray
1991). After a rest period in the tempering bins,
the caryopses have between 15.5 and 17% humid-
ity, which is the best condition for milling (Posner
and Hibbs 1997).
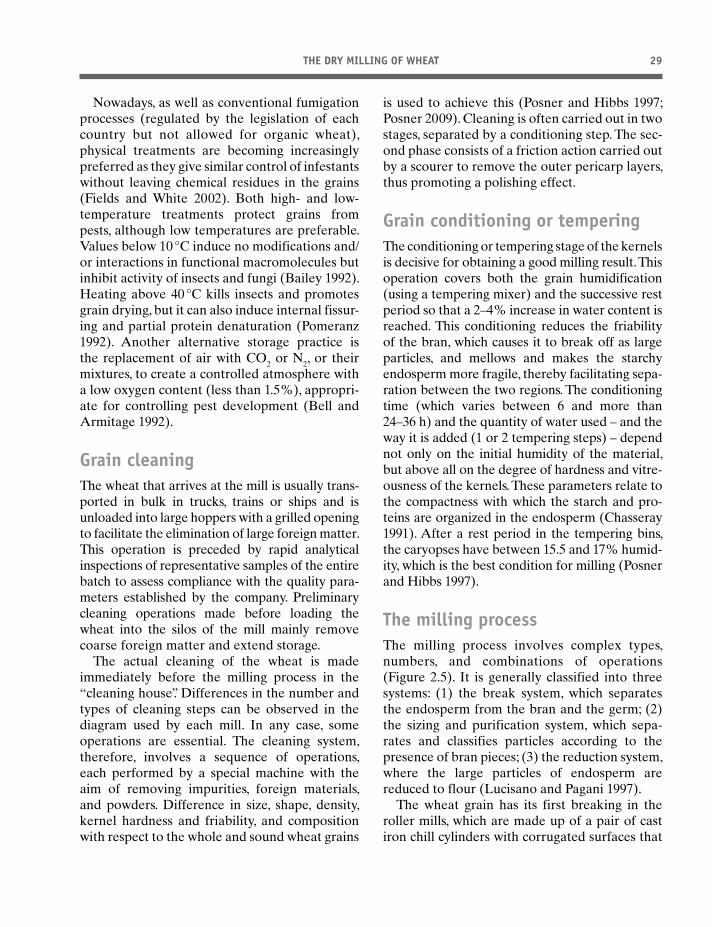
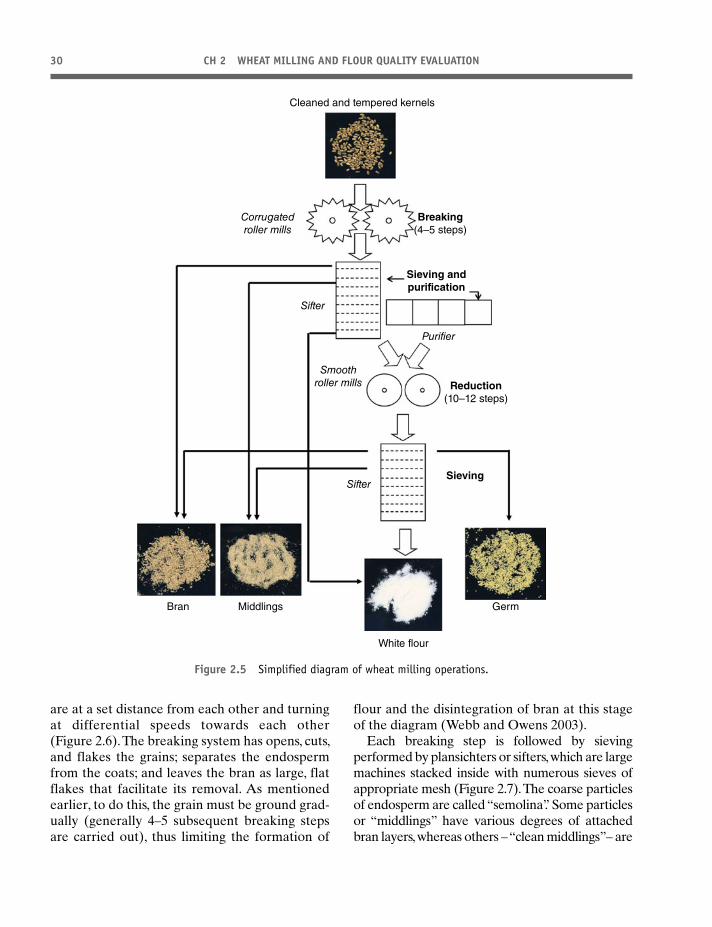
The milling process
The milling process involves complex types,
numbers, and combinations of operations
(Figure 2.5). It is generally classified into three
systems: (1) the break system, which separates
the endosperm from the bran and the germ; (2)
the sizing and purification system, which sepa-
rates and classifies particles according to the
presence of bran pieces; (3) the reduction system,
where the large particles of endosperm are
reduced to flour (Lucisano and Pagani 1997).
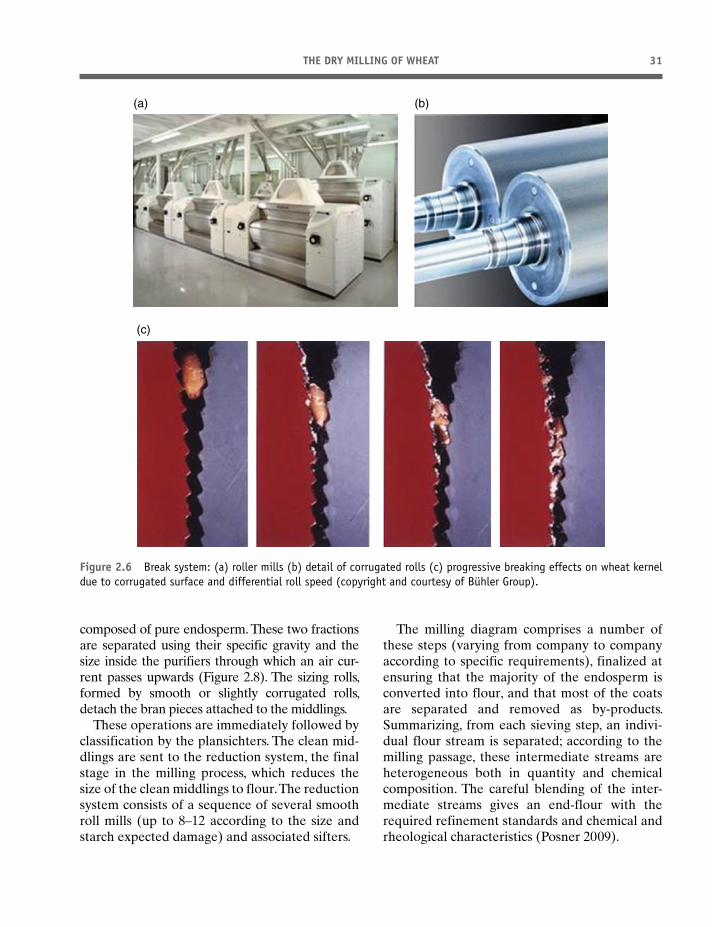
The wheat grain has its first breaking in the
roller mills, which are made up of a pair of cast
iron chill cylinders with corrugated surfaces that
30 CH 2 WHEAT MILLING AND FLOUR QUALITY EVALUATION
are at a set distance from each other and turning
at differential speeds towards each other
(Figure 2.6). The breaking system has opens, cuts,
and flakes the grains; separates the endosperm
from the coats; and leaves the bran as large, flat
flakes that facilitate its removal. As mentioned
earlier, to do this, the grain must be ground grad-
ually (generally 4–5 subsequent breaking steps
are carried out), thus limiting the formation of
flour and the disintegration of bran at this stage
of the diagram (Webb and Owens 2003).
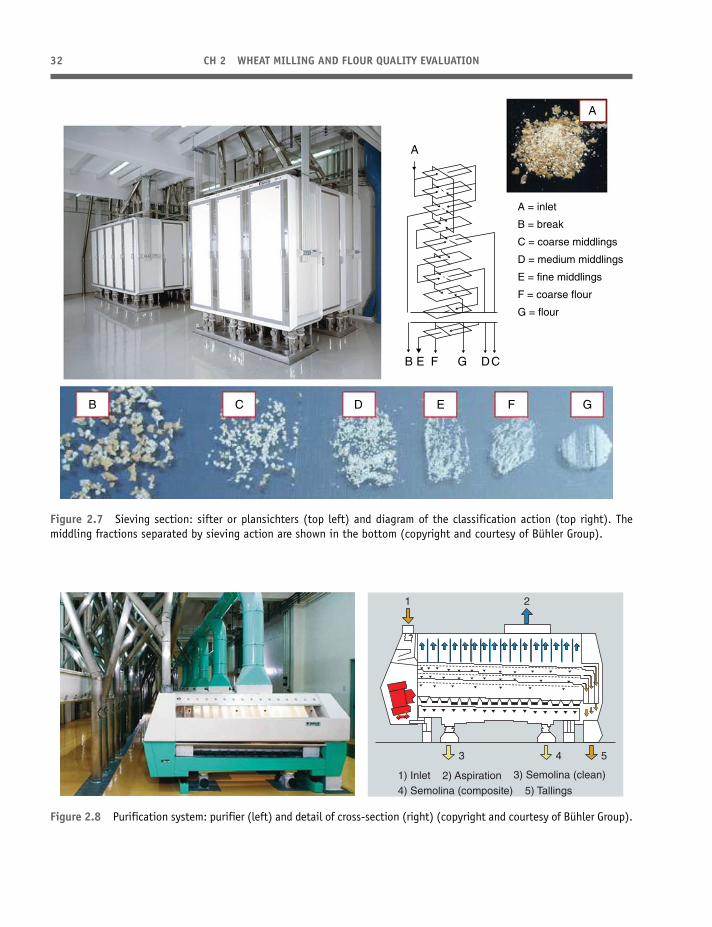
Each breaking step is followed by sieving
performed by plansichters or sifters, which are large
machines stacked inside with numerous sieves of
appropriate mesh (Figure 2.7). The coarse particles
of endosperm are called “semolina”. Some particles
or “middlings” have various degrees of attached
bran layers, whereas others – “clean middlings”– are
Corrugatedroller mills
Sifter
Purifier
Smoothroller mills
Sifter
Bran Middlings
White flour
Germ
Cleaned and tempered kernels
Breaking(4–5 steps)
Reduction(10–12 steps)
Sieving
Sieving andpurification
Figure 2.5 Simplified diagram of wheat milling operations.
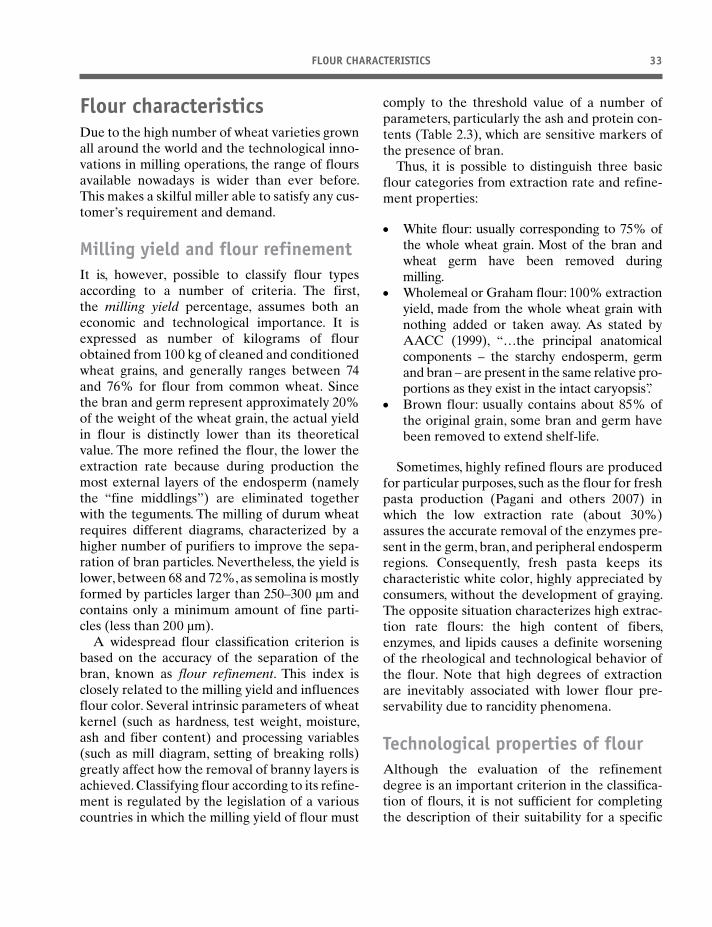
THE DRY MILLING OF WHEAT 31
composed of pure endosperm. These two fractions
are separated using their specific gravity and the
size inside the purifiers through which an air cur-
rent passes upwards (Figure 2.8). The sizing rolls,
formed by smooth or slightly corrugated rolls,
detach the bran pieces attached to the middlings.
These operations are immediately followed by
classification by the plansichters. The clean mid-
dlings are sent to the reduction system, the final
stage in the milling process, which reduces the
size of the clean middlings to flour. The reduction
system consists of a sequence of several smooth
roll mills (up to 8–12 according to the size and
starch expected damage) and associated sifters.
The milling diagram comprises a number of
these steps (varying from company to company
according to specific requirements), finalized at
ensuring that the majority of the endosperm is
converted into flour, and that most of the coats
are separated and removed as by-products.
Summarizing, from each sieving step, an indivi-
dual flour stream is separated; according to the
milling passage, these intermediate streams are
heterogeneous both in quantity and chemical
composition. The careful blending of the inter-
mediate streams gives an end-flour with the
required refinement standards and chemical and
rheological characteristics (Posner 2009).
Figure 2.6 Break system: (a) roller mills (b) detail of corrugated rolls (c) progressive breaking effects on wheat kernel
due to corrugated surface and differential roll speed (copyright and courtesy of Bühler Group).
(a) (b)
(c)
32 CH 2 WHEAT MILLING AND FLOUR QUALITY EVALUATION
A = inlet
B = break
C = coarse middlings
D = medium middlings
E = fine middlings
F = coarse flour
G = flour
B
CB D E F G
A
A
E F G DC
Figure 2.7 Sieving section: sifter or plansichters (top left) and diagram of the classification action (top right). The
middling fractions separated by sieving action are shown in the bottom (copyright and courtesy of Bühler Group).
1) Inlet 2) Aspiration 3) Semolina (clean)
4) Semolina (composite) 5) Tallings
1 2
3 4 5
Figure 2.8 Purification system: purifier (left) and detail of cross-section (right) (copyright and courtesy of Bühler Group).
FLOUR CHARACTERISTICS 33
Flour characteristicsDue to the high number of wheat varieties grown
all around the world and the technological inno-
vations in milling operations, the range of flours
available nowadays is wider than ever before.
This makes a skilful miller able to satisfy any cus-
tomer’s requirement and demand.
Milling yield and flour refinement
It is, however, possible to classify flour types
according to a number of criteria. The first,
the milling yield percentage, assumes both an
economic and technological importance. It is
expressed as number of kilograms of flour
obtained from 100 kg of cleaned and conditioned
wheat grains, and generally ranges between 74
and 76% for flour from common wheat. Since
the bran and germ represent approximately 20%
of the weight of the wheat grain, the actual yield
in flour is distinctly lower than its theoretical
value. The more refined the flour, the lower the
extraction rate because during production the
most external layers of the endosperm (namely
the “fine middlings”) are eliminated together
with the teguments. The milling of durum wheat
requires different diagrams, characterized by a
higher number of purifiers to improve the sepa-
ration of bran particles. Nevertheless, the yield is
lower, between 68 and 72%, as semolina is mostly
formed by particles larger than 250–300 μm and
contains only a minimum amount of fine parti-
cles (less than 200 μm).
A widespread flour classification criterion is
based on the accuracy of the separation of the
bran, known as flour refinement. This index is
closely related to the milling yield and influences
flour color. Several intrinsic parameters of wheat
kernel (such as hardness, test weight, moisture,
ash and fiber content) and processing variables
(such as mill diagram, setting of breaking rolls)
greatly affect how the removal of branny layers is
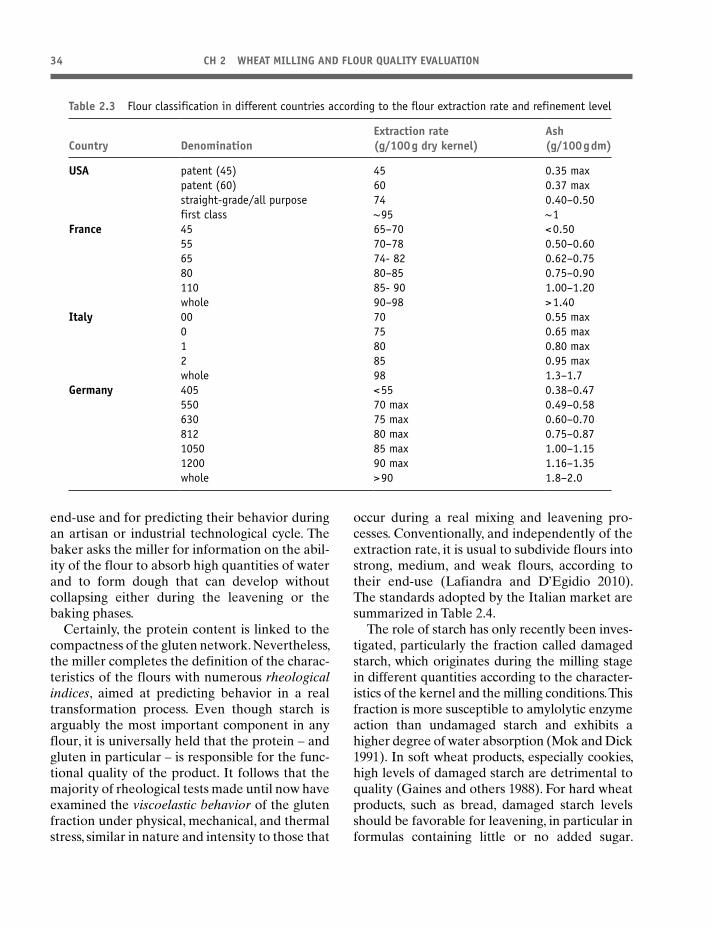
achieved. Classifying flour according to its refine-
ment is regulated by the legislation of a various
countries in which the milling yield of flour must
comply to the threshold value of a number of
parameters, particularly the ash and protein con-
tents (Table 2.3), which are sensitive markers of
the presence of bran.
Thus, it is possible to distinguish three basic
flour categories from extraction rate and refine-
ment properties:
● White flour: usually corresponding to 75% of
the whole wheat grain. Most of the bran and
wheat germ have been removed during
milling. ● Wholemeal or Graham flour: 100% extraction
yield, made from the whole wheat grain with
nothing added or taken away. As stated by
AACC (1999), “…the principal anatomical
components – the starchy endosperm, germ
and bran – are present in the same relative pro-
portions as they exist in the intact caryopsis”. ● Brown flour: usually contains about 85% of
the original grain, some bran and germ have
been removed to extend shelf-life.
Sometimes, highly refined flours are produced
for particular purposes, such as the flour for fresh
pasta production (Pagani and others 2007) in
which the low extraction rate (about 30%)
assures the accurate removal of the enzymes pre-
sent in the germ, bran, and peripheral endosperm
regions. Consequently, fresh pasta keeps its
characteristic white color, highly appreciated by
consumers, without the development of graying.
The opposite situation characterizes high extrac-
tion rate flours: the high content of fibers,
enzymes, and lipids causes a definite worsening
of the rheological and technological behavior of
the flour. Note that high degrees of extraction
are inevitably associated with lower flour pre-
servability due to rancidity phenomena.
Technological properties of flour
Although the evaluation of the refinement
degree is an important criterion in the classifica-
tion of flours, it is not sufficient for completing
the description of their suitability for a specific
34 CH 2 WHEAT MILLING AND FLOUR QUALITY EVALUATION
end-use and for predicting their behavior during
an artisan or industrial technological cycle. The
baker asks the miller for information on the abil-
ity of the flour to absorb high quantities of water
and to form dough that can develop without
collapsing either during the leavening or the
baking phases.
Certainly, the protein content is linked to the
compactness of the gluten network. Nevertheless,
the miller completes the definition of the charac-
teristics of the flours with numerous rheological indices, aimed at predicting behavior in a real
transformation process. Even though starch is
arguably the most important component in any
flour, it is universally held that the protein – and
gluten in particular – is responsible for the func-
tional quality of the product. It follows that the
majority of rheological tests made until now have
examined the viscoelastic behavior of the gluten
fraction under physical, mechanical, and thermal
stress, similar in nature and intensity to those that
occur during a real mixing and leavening pro-
cesses. Conventionally, and independently of the
extraction rate, it is usual to subdivide flours into
strong, medium, and weak flours, according to
their end-use (Lafiandra and D’Egidio 2010).
The standards adopted by the Italian market are
summarized in Table 2.4.
The role of starch has only recently been inves-
tigated, particularly the fraction called damaged
starch, which originates during the milling stage
in different quantities according to the character-
istics of the kernel and the milling conditions. This
fraction is more susceptible to amylolytic enzyme
action than undamaged starch and exhibits a
higher degree of water absorption (Mok and Dick
1991). In soft wheat products, especially cookies,
high levels of damaged starch are detrimental to
quality (Gaines and others 1988). For hard wheat
products, such as bread, damaged starch levels
should be favorable for leavening, in particular in
formulas containing little or no added sugar.
Table 2.3 Flour classification in different countries according to the flour extraction rate and refinement level
Country Denomination
Extraction rate
(g/100 g dry kernel)
Ash
(g/100 g dm)
USA patent (45) 45 0.35 max
patent (60) 60 0.37 max
straight-grade/all purpose 74 0.40–0.50
first class ~ 95 ~ 1
France 45 65–70 < 0.50
55 70–78 0.50–0.60
65 74- 82 0.62–0.75
80 80–85 0.75–0.90
110 85- 90 1.00–1.20
whole 90–98 > 1.40
Italy 00 70 0.55 max
0 75 0.65 max
1 80 0.80 max
2 85 0.95 max
whole 98 1.3–1.7
Germany 405 < 55 0.38–0.47
550 70 max 0.49–0.58
630 75 max 0.60–0.70
812 80 max 0.75–0.87
1050 85 max 1.00–1.15
1200 90 max 1.16–1.35
whole > 90 1.8–2.0
FLOUR CHARACTERISTICS 35
However, high levels of damaged starch nega-
tively affect the dough rheology, causing handling
problems (Bushuk and Scanlon 1993) and wors-
ening baking performance (Cauvain and Young
2006; Barrera and others 2007).
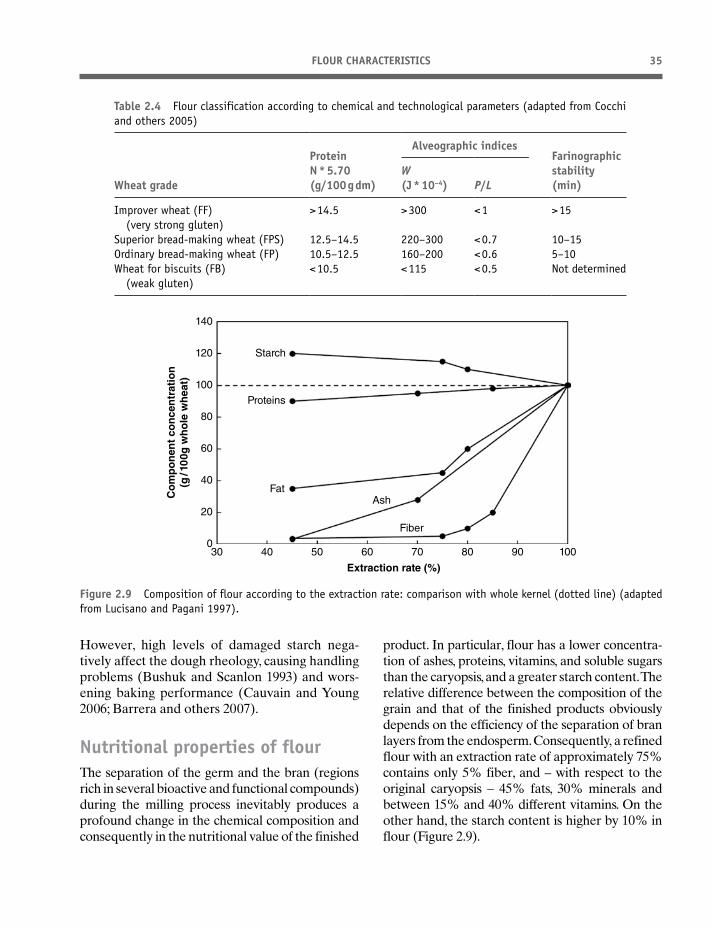
Nutritional properties of flour
The separation of the germ and the bran (regions
rich in several bioactive and functional compounds)
during the milling process inevitably produces a
profound change in the chemical composition and
consequently in the nutritional value of the finished
product. In particular, flour has a lower concentra-
tion of ashes, proteins, vitamins, and soluble sugars
than the caryopsis, and a greater starch content. The
relative difference between the composition of the
grain and that of the finished products obviously
depends on the efficiency of the separation of bran
layers from the endosperm. Consequently, a refined
flour with an extraction rate of approximately 75%
contains only 5% fiber, and – with respect to the
original caryopsis – 45% fats, 30% minerals and
between 15% and 40% different vitamins. On the
other hand, the starch content is higher by 10% in
flour (Figure 2.9).
Table 2.4 Flour classification according to chemical and technological parameters (adapted from Cocchi
and others 2005)
Wheat grade
Protein
N * 5.70
(g/100 g dm)
Alveographic indicesFarinographic
stability
(min)
W
(J * 10–4) P/L
Improver wheat (FF)
(very strong gluten)
> 14.5 > 300 < 1 > 15
Superior bread-making wheat (FPS) 12.5–14.5 220–300 < 0.7 10–15
Ordinary bread-making wheat (FP) 10.5–12.5 160–200 < 0.6 5–10
Wheat for biscuits (FB)
(weak gluten)
< 10.5 < 115 < 0.5 Not determined
30
140
120
100
80
60
40
20
040
Starch
Proteins
Co
mp
on
ent
con
cen
trat
ion
(g/1
00g
wh
ole
wh
eat)
Fat
Fiber
Ash
50 60 70 80 90 100
Extraction rate (%)
Figure 2.9 Composition of flour according to the extraction rate: comparison with whole kernel (dotted line) (adapted
from Lucisano and Pagani 1997).
36 CH 2 WHEAT MILLING AND FLOUR QUALITY EVALUATION
To improve the nutritional and functional
characteristics of flour, under the 6th Frame-
work Food Research Program, the European
Community supported the huge Integrated
Project HEALTHGRAIN on whole grain cere-
als and cereal products (www.healthgrain.eu).
The project, which ended in 2010, intended to
“provide a scientific basis for a new generation
of healthy cereal-based products – beyond whole
grain”. One of the final documents of the
HEALTHGRAIN Project (Delcour and others
2012) gathers and examines the new processing
technologies set up by several research groups
during the project, giving interesting indications
about new milling processes.
Optimization and innovation in wheat millingAt the end of the last century, there was a signifi-
cant inversion of trends in wheat milling. In the
1980s and 1990s, the main objective of this sector
was process cost reduction. The easiest solutions
were those that guaranteed high flour yields with
the lowest number of roll mills, sieving machines,
or purifier machines.
In the past decade, new food safety-related
regulations – for example, Hazard Analysis and
Critical Control Point, traceability, labeling health
claims, and use of genetically modified organisms
(FAO/WHO 1997) – have supported an improve-
ment in process control in the milling and bakery
industries (Werner 2002; Sperber, 2007). More over,
the intense competition between companies, the
new international laws on food safety and trace-
ability (ISO 2005, Standard 22000; ISO 2007,
Standard 22005; ISO 2008, Standard 9001), and
increased consumer discernment have shifted
attention towards technological solutions that
not only consider the production and economic
aspects of the process, but also the quality charac-
teristics of the flour. In particular, the hygienic,
nutritional, and functional (high content of bio-
compounds, soluble fiber, resistant starch) aspects
are monitored as well as the technological perfor-
mance required by the bakery industry.
Grain storage
Ozone (O3) has found use as a fumigant in con-
trolling stored-grain insect pests and microorgan-
isms (Fiwari and others 2010; McDonough and
others 2011). Mendez and others (2003) investi-
gated the effects of ozone exposure on the end-
use properties of different cereals and pulses.
Laboratory-scale treatments at 50 ppm for 30
days did not produce any detrimental effects
either on the milling characteristics of the wheat
or on the baking properties of the corresponding
flour, maintaining the fatty acid and amino acid
composition. Another recent study showed posi-
tive results in a commercial steel grain bin filled
with 13.6 tonnes of hard red winter wheat
(Hardin and others 2010).
Grain cleaning
In most of the milling diagrams, the grain cleaning
operations are performed using a significant
number of machines until all the so-called foreign
matter of different origin, size, and composition
is removed.
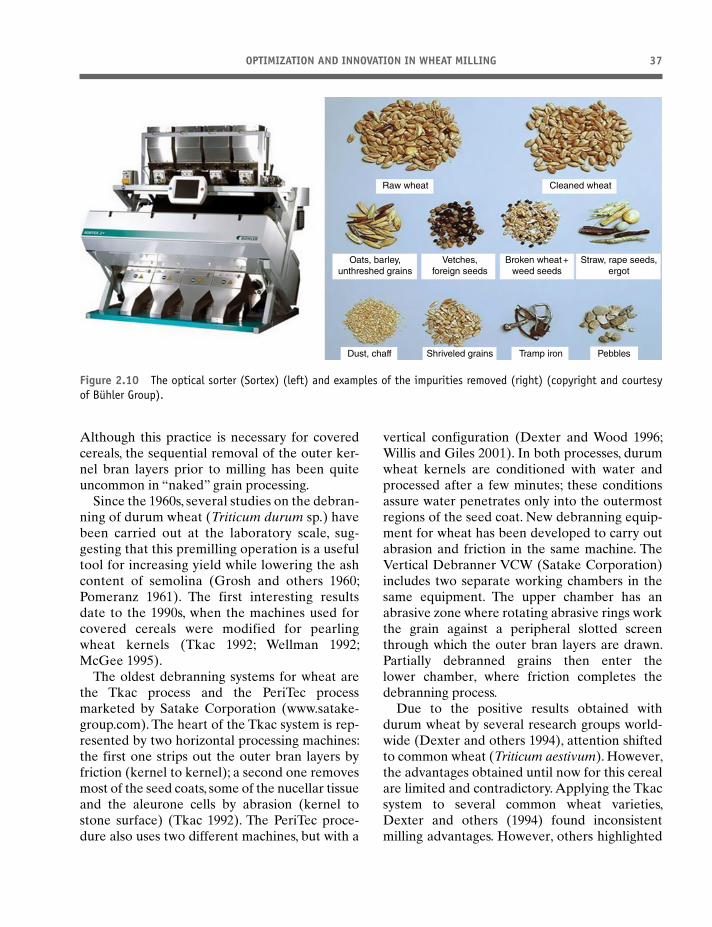
The most recent innovation proposed for this
stage is the substitution of these machines with
an optical sorter (www.buhlergroup.com), a
device which efficiently removes all types of
contaminants and foreign materials in a single
step and which until now has only been used in
rice processing. The product stream is fed into
the sorting machine and different high-resolu-
tion cameras detect and recognize defects on
the basis of color, shape, and other optical prop-
erties. Specific sensors and high-speed ejectors
carry out a precise ejection, enabling high-speed
and accurate separation of contaminants
(Figure 2.10).
Debranning and pearling processes
Debranning technology (also reported as pre-
processing or pearling) has become well estab-
lished in rice milling and barley processing for
removing hulls that have no technological and/or
nutritional interest (Dexter and Wood 1996).
OPTIMIZATION AND INNOVATION IN WHEAT MILLING 37
Although this practice is necessary for covered
cereals, the sequential removal of the outer ker-
nel bran layers prior to milling has been quite
uncommon in “naked” grain processing.
Since the 1960s, several studies on the debran-
ning of durum wheat (Triticum durum sp.) have
been carried out at the laboratory scale, sug-
gesting that this premilling operation is a useful
tool for increasing yield while lowering the ash
content of semolina (Grosh and others 1960;
Pomeranz 1961). The first interesting results
date to the 1990s, when the machines used for
covered cereals were modified for pearling
wheat kernels (Tkac 1992; Wellman 1992;
McGee 1995).
The oldest debranning systems for wheat are
the Tkac process and the PeriTec process
marketed by Satake Corporation (www.satake-
group.com). The heart of the Tkac system is rep-
resented by two horizontal processing machines:
the first one strips out the outer bran layers by
friction (kernel to kernel); a second one removes
most of the seed coats, some of the nucellar tissue
and the aleurone cells by abrasion (kernel to
stone surface) (Tkac 1992). The PeriTec proce-
dure also uses two different machines, but with a
vertical configuration (Dexter and Wood 1996;
Willis and Giles 2001). In both processes, durum
wheat kernels are conditioned with water and
processed after a few minutes; these conditions
assure water penetrates only into the outermost
regions of the seed coat. New debranning equip-
ment for wheat has been developed to carry out
abrasion and friction in the same machine. The
Vertical Debranner VCW (Satake Corporation)
includes two separate working chambers in the
same equipment. The upper chamber has an
abrasive zone where rotating abrasive rings work
the grain against a peripheral slotted screen
through which the outer bran layers are drawn.
Partially debranned grains then enter the
lower chamber, where friction completes the
debranning process.
Due to the positive results obtained with
durum wheat by several research groups world-
wide (Dexter and others 1994), attention shifted
to common wheat (Triticum aestivum). However,
the advantages obtained until now for this cereal
are limited and contradictory. Applying the Tkac
system to several common wheat varieties,
Dexter and others (1994) found inconsistent
milling advantages. However, others highlighted
Raw wheat Cleaned wheat
Oats, barley,
unthreshed grains
Vetches,
foreign seeds
Broken wheat +
weed seeds
Straw, rape seeds,
ergot
PebblesTramp ironShriveled grainsDust, chaff
Figure 2.10 The optical sorter (Sortex) (left) and examples of the impurities removed (right) (copyright and courtesy
of Bühler Group).
38 CH 2 WHEAT MILLING AND FLOUR QUALITY EVALUATION
the decrease in microbial contamination (Laca
and others 2006) and bunt infections (Sekhon
and others 1992). Pearling of common wheat was
also tested on sprouted wheat kernels for reduc-
ing their α-amylase activity, making them suita-
ble for baking processes (Henry and others 1986;
Liu and others 1986; Hareland 2003). These
positive results were generally obtained using a
laboratory-scale machine. Bottega and others
(2009) evaluated the effects of different debran-
ning conditions on several characteristics of com-
mon wheat kernels by using a pilot plant
equipped with innovative abrasive rolls covered
with synthetic diamond powder. The effects of
the abrasive action seemed highly influenced by
the grain pretreatment conditions. The best result
was obtained with a debranning level of 10–12%
and a short prehydration step. Moreover, a brush-
ing passage performed by a conventional scourer
machine was necessary to eliminate some bran
particles raised by the mechanical action and still
present on the kernel surface after debranning
(Figure 2.11).
Taking all this into consideration, at present the
industrial premilling treatment of common wheat
consists of a peeling process carried out with a
machine (such as the DC-Peeler recently pro-
posed by Bühler AG, www.buhlergroup.com; or
the DHA Vertical Debranner from Ocrim S.p.A.,
www.ocrim.it) which promotes a mild removal of
the outermost layer of kernel (maximum 1.5–2 %
of the grain weight) and, at the same time makes
it possible to reduce contamination by 50%.
Improvement of flour performance and exploitation of ancient milling processes
As mentioned earlier, wheat is the only cereal
that can be transformed into an extremely wide
range of products. This natural capacity has been
further improved by selective breeding research
aimed at obtaining varieties able to better satisfy
the requirements for the final use of the flour.
These programs mainly concern both quality and
quantity changes in the seed storage proteins.
Nonetheless, the real performance of wheat dur-
ing the technological process is often different
from expectations since the characteristics of the
raw material are strongly influenced by environ-
mental and agronomic parameters (Wrigley and
Batey 2003; Carson and Edwards 2009). The
practice of improving the working capacity (tech-
nological functionality) of the flours with the
addition of improvers is therefore significantly
widespread. Among the most commonly used
improvers are enzymes (such as amylase, hemi-
cellulase, lipase, protease) and emulsifiers (such
as monoglycerides and diglycerides), that can
increase the dough development, gas retention,
and crumb softness both in fresh bread and dur-
ing storage. Note that many of these improvers
are already naturally present in the wheat grain
but are removed with the by-products (bran and
germ) during milling as they are located mostly
in the external peripheral areas. These, as men-
tioned earlier, are responsible for significant
deterioration of both the rheological and the
hygienic characteristics of the dough, as well as
turning it rancid quickly.
Recently, an Italian milling company (www.
molinoquaglia.com) designed a particular mill-
ing process that uses millstones to obtains a less
refined flour (called “Petra flour”), which is
richer in the external peripheral areas compared
to refined flour obtained from the same grain.
The process involves a preliminary peeling of the
caryopses to lower natural contamination after
a shorter humidification period than that used in
conventional milling processes (this is important
for ensuring that the grain is ground to give a
bran of the correct granulometry). Then the grain
is stone milled, recovering only the granulomet-
ric fraction lower than 200 μm. This material
collects both part of the endosperm and some
bran layers, rich not only in minerals but also in
enzymatic proteins, polar lipids with emulsifying
properties, and fiber, especially soluble fiber
(Table 2.5). The positive effect in bread making
is also clearly shown in the Table 2.5; the greater
quantity of fiber and minerals does not compro-
mise the dough development capacity, and
guarantees an alveolar structure that is similar to
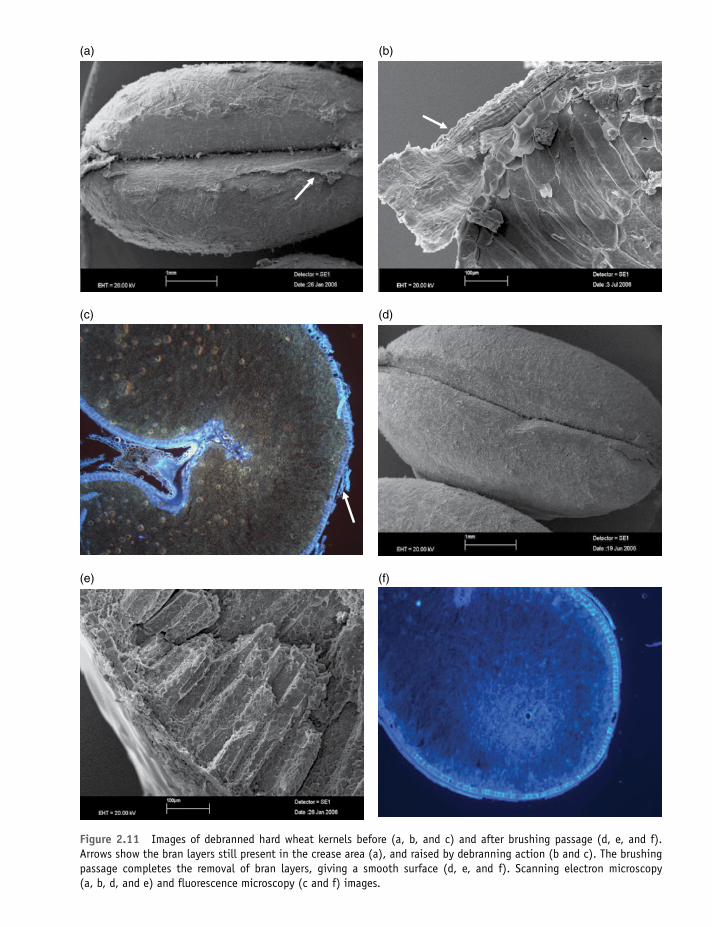
Figure 2.11 Images of debranned hard wheat kernels before (a, b, and c) and after brushing passage (d, e, and f).
Arrows show the bran layers still present in the crease area (a), and raised by debranning action (b and c). The brushing
passage completes the removal of bran layers, giving a smooth surface (d, e, and f). Scanning electron microscopy
(a, b, d, and e) and fluorescence microscopy (c and f) images.
(a) (b)
(c) (d)
(e) (f)
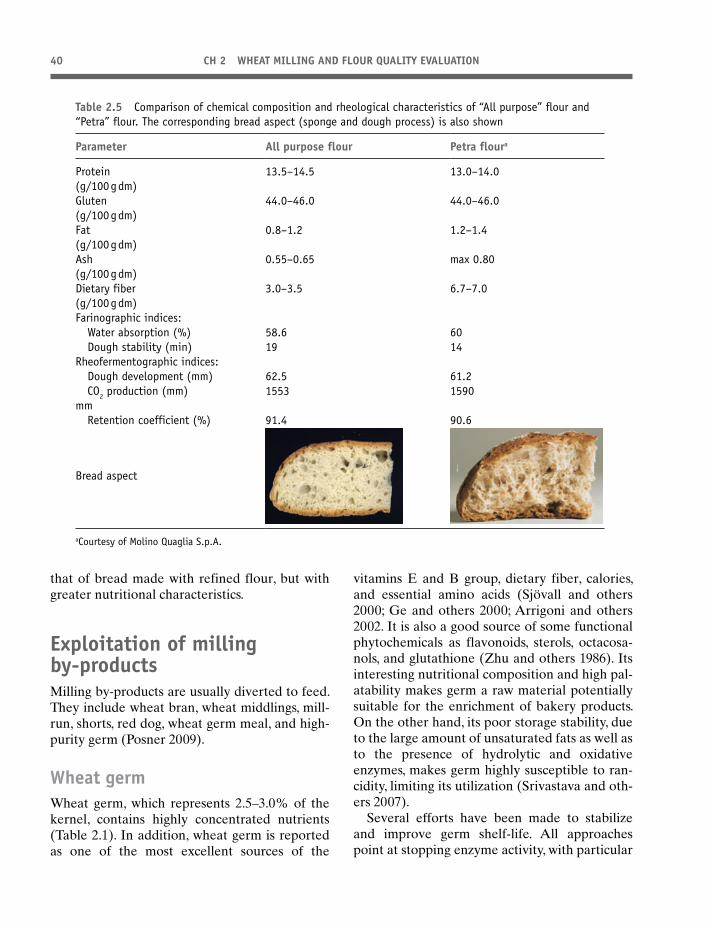
40 CH 2 WHEAT MILLING AND FLOUR QUALITY EVALUATION
that of bread made with refined flour, but with
greater nutritional characteristics.
Exploitation of milling by-productsMilling by-products are usually diverted to feed.
They include wheat bran, wheat middlings, mill-
run, shorts, red dog, wheat germ meal, and high-
purity germ (Posner 2009).
Wheat germ
Wheat germ, which represents 2.5–3.0% of the
kernel, contains highly concentrated nutrients
(Table 2.1). In addition, wheat germ is reported
as one of the most excellent sources of the
vitamins E and B group, dietary fiber, calories,
and essential amino acids (Sjövall and others
2000; Ge and others 2000; Arrigoni and others
2002. It is also a good source of some functional
phytochemicals as flavonoids, sterols, octacosa-
nols, and glutathione (Zhu and others 1986). Its
interesting nutritional composition and high pal-
atability makes germ a raw material potentially
suitable for the enrichment of bakery products.
On the other hand, its poor storage stability, due
to the large amount of unsaturated fats as well as
to the presence of hydrolytic and oxidative
enzymes, makes germ highly susceptible to ran-
cidity, limiting its utilization (Srivastava and oth-
ers 2007).
Several efforts have been made to stabilize
and improve germ shelf-life. All approaches
point at stopping enzyme activity, with particular
Table 2.5 Comparison of chemical composition and rheological characteristics of “All purpose” flour and
“Petra” flour. The corresponding bread aspect (sponge and dough process) is also shown
Parameter All purpose flour Petra floura
Protein
(g/100 g dm)
13.5–14.5 13.0–14.0
Gluten
(g/100 g dm)
44.0–46.0 44.0–46.0
Fat
(g/100 g dm)
0.8–1.2 1.2–1.4
Ash
(g/100 g dm)
0.55–0.65 max 0.80
Dietary fiber
(g/100 g dm)
3.0–3.5 6.7–7.0
Farinographic indices:
Water absorption (%) 58.6 60
Dough stability (min) 19 14
Rheofermentographic indices:
Dough development (mm) 62.5 61.2
CO2 production (mm)
mm
1553 1590
Retention coefficient (%) 91.4 90.6
Bread aspect
aCourtesy of Molino Quaglia S.p.A.
ASSESSING DOUGH RHEOLOGY FOR PREDICTING BAKING PERFORMANCE 41
attention to lipase and lipoxygenase. This can be
achieved directly, using thermal treatments to
eliminate enzyme activity, or indirectly, by creat-
ing adverse conditions for their action (for exam-
ple, by acidification, oxygen elimination, and so
on). Until the 1980s, heat treatments (toasting,
hot air process, and pressure extrusion) were the
only methods for slowing rancidity development
(Haridas Rao and others 1980). More recently,
extrusion cooking and microwave heating have
resulted in rapid and efficacious enzyme inacti-
vation (Matucci and others 2004).
Despite their effectiveness, heat treatments
may be expensive, not resolutive, and negatively
affect the nutritional value of the wheat germ.
Recently, sourdough fermentation has been used
for stabilizing and enhancing some nutritional
properties of wheat germ (Rizzello and others
2010). Due to lactic acid fermentation, lipase
activity of fermented wheat germ was 2.5-fold
lower than that found in the raw germ. Moreover,
this bioprocess increased the content of free
amino acids, total phenols, phytase, and antioxi-
dant activities. The effectiveness of sourdough
fermentation was also confirmed by Bottega and
others (2012). Fermentation, in fact, provided a
sharp inactivation of several enzymatic activities,
accounting for the low hexanal value after germ
storage at 25 °C for 80 days. After storage, the
amount of this volatile aldehyde, commonly
taken as a sensitive marker of lipid oxidation and
food rancidity, was five times higher in raw germ
compared to the fermented and dried germ
(Bottega and others 2012).
Wheat bran
Wheat bran (about 18–20% of the whole grain)
includes all the external layers of kernels, such as
pericarp, seed coats, nucellus, and aleurone cells
(Antoine and others 2004). The presence of bran
negatively affects the loaf volume due to several
mechanisms (Finney and others 1985). Bran par-
ticles disrupt gluten continuity, preventing a reg-
ular 3D expansion of gas cells and favoring their
elongation (Salmenkallio-Marttila and others
2001). The presence of bran also greatly affects
the hydration phenomena of flour (Shogren and
others 1981; Moder and others 1984). Changes in
the functional properties of flour vary with the
particle size of the bran, but studies have led to
contradictory results as both the physical proper-
ties (actual particle size range) and chemical
composition should be taken into account. Bran
may contain only the external coat layers or the
aleurone as well (Lai and others 1989).
In 2001, Salmenkallio-Marttila and others
proposed preprocessing the bran fraction by
fermentation to improve the quality of bran-
enriched bread. Positive effects in bread-making
performances were also observed after enzy-
matic hydrolysis of bran (Marti and others 2014).
The non-starch polysaccharides are broken
down, favoring their solubilization and the
maintenance of rheological performances. Other
bioprocessing techniques, such as enzyme-aided
fermentation, promoted similar results for fiber
solubilization, and improved the bioaccessibility
of phenolic acids with beneficial implications
for anti-inflammatory properties (Anson and
others 2009).
Assessing dough rheology for predicting baking performanceThe actual technological behavior of flour is not
only linked to the protein and gluten content,
but it is also the result of complex interactions
between macromolecules that are responsible
for dough development. Consequently, flour
classification is expressed by several parameters,
usually measured by rheological approaches that
generally provide a quantitative description of
the mechanical properties as well as information
related to the molecular structure and composition
of the material (Dobraszczyk and Morgenstern
2003). Although the rheological properties of
wheat have been investigated since the begin-
ning of the 1900s, they still are considered of
great importance for determining baking quality
(Ktenioudaki and others 2010) and useful tools
for predicting process efficiency (dough yield,
leavening conditions, and so on) and product
42 CH 2 WHEAT MILLING AND FLOUR QUALITY EVALUATION
quality (such as specific volume, textural attrib-
utes) (Osborne and others 2007; Mondal and
Datta 2008).
Wheat rheological properties can be measured
using two main approaches: descriptive or
empirical tests and fundamental measurements
(Dobraszczyk and Morgenstern 2003). In this
chapter, attention is given to empiric rheology,
since it greatly reflects the behavior of raw mate-
rial during processing and provides information
on the quality of the final products. In fact, the
basic principle of many empirical tests is to mimic
each step of the baking process. Therefore, one
possible criterion for classifying the tests is the
processing step they simulate: mixing, proofing,
or baking.
Prediction of mixing performance
During mixing, ingredients are distributed and
blended within the mass. This phase is described
as “dough development”, a term which covers
a number of complex physical and chemical
changes responsible for the formation of glu-
ten, a fascinating phenomenon which requires
both the hydration of the proteins in the flour
and the application of energy during kneading
(Cauvain 2001). To assess the characteristics of
the dough, the baker uses his hands and his
acquired experience to judge the viscosity and
elastic properties of the dough (Weipert 2006).
Starting from this principle, several recording
mixers have been developed to simulate mix-
ing under laboratory conditions. The basic idea
is to follow the formation of the dough. The
torque developed by the mixer is measured
and recorded throughout mixing. Many empiri-
cal tests can be used to predict water absorp-
tion by the dough, dough stiffness, and mixing
requirements, including the flour’s ability to
support overmixing.
The most widely used recoding mixers are the
Farinograph (www.brabender.com) and the
Mixograph (www.national-mfg.com). These two
instruments differ in the shape of the paddles
and, consequently, in the mechanical stress to
which the dough is exposed. Moreover, the dough
is prepared with different amounts of flour and
flour : water ratios (Weipert 2006).
The Farinograph by Brabender GmbH and
Co. KG (Duisburg, Germany) consists of a
dough-mixing chamber attached to a torque
recorder. It measures the resistance of a dough
against sigmoid-shaped mixing paddles turning
at 63 rpm) (D’Appolonia and Kunerth 1984). The
paddles hold a flour–water dough (constant
flour weight: 300, 50, or 10 g of dry flour) to a
prolonged, relatively gentle kneading action,
at a constant temperature (30 °C). The test
(AACCI 2004, Method 54.21; ICC 2001,
Standard 115/1) gives two important physical
properties of flour: (1) the absorption or the
amount of water required for the dough to reach
a definite consistency; (2) a general profile of
the mixing behavior of the dough (Locken and
others 1991).
The first step of the test is the “titration phase”.
A standard weight of flour is placed in the mixing
chamber and water is titrated from a buret into
the flour to produce dough with an optimum
consistency (500 Brabender Unit, BU). In the
new Farinograph-AT, water is added to the flour
by an automatic water dosing system, avoiding
the influence of the operator in this critical step
of the test. Different flours show differences in
water absorption according to their quality.
Despite the role of the flour, note that the “level
of absorption” or “hydration” is greatly affected
by the bread formulation (for example, the pres-
ence or absence of fibers, sugars, salt, fat, and so
on) and the processing conditions. In some pro-
cesses, the level of absorption does not corre-
spond to the optimal quantity as determined by
the Farinograph, but it is mainly related to the
handling characteristics of the dough (Pagani
and others 2010). Stiff doughs with hydration
levels between 40–45% have reduced extensibil-
ity; consequently, the baked goods have a limited
porosity with a very fine alveolar structure. In
contrast, soft doughs have hydration levels higher
than 60% and, consequently, they are difficult to
handle due to their low consistency, which is
responsible for the long and irregular shape and
for the presence of large alveoli in the crumb that
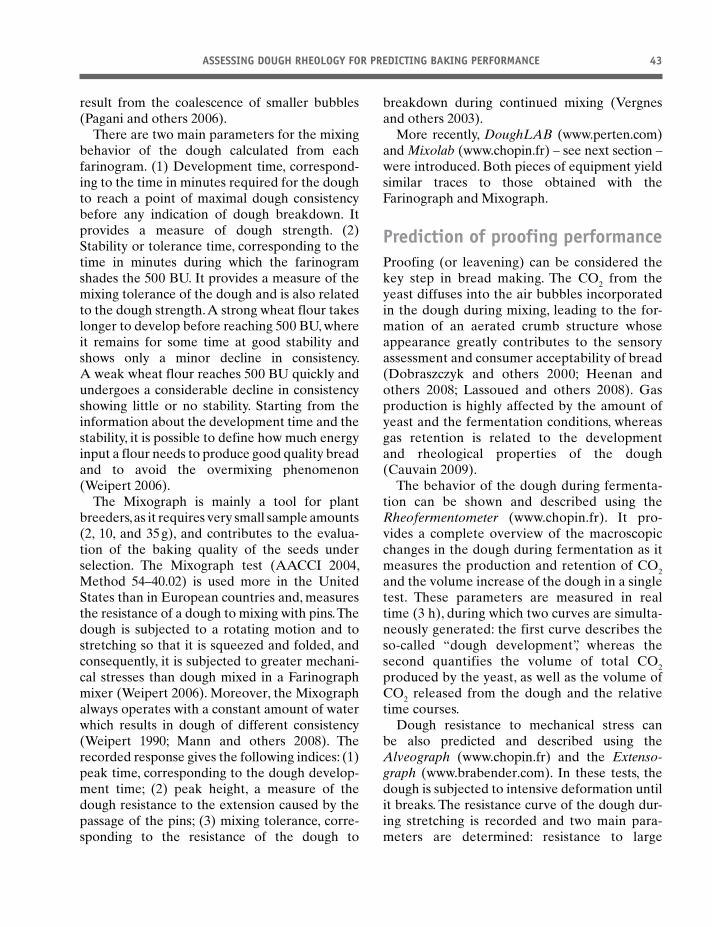
ASSESSING DOUGH RHEOLOGY FOR PREDICTING BAKING PERFORMANCE 43
result from the coalescence of smaller bubbles
(Pagani and others 2006).
There are two main parameters for the mixing
behavior of the dough calculated from each
farinogram. (1) Development time, correspond-
ing to the time in minutes required for the dough
to reach a point of maximal dough consistency
before any indication of dough breakdown. It
provides a measure of dough strength. (2)
Stability or tolerance time, corresponding to the
time in minutes during which the farinogram
shades the 500 BU. It provides a measure of the
mixing tolerance of the dough and is also related
to the dough strength. A strong wheat flour takes
longer to develop before reaching 500 BU, where
it remains for some time at good stability and
shows only a minor decline in consistency.
A weak wheat flour reaches 500 BU quickly and
undergoes a considerable decline in consistency
showing little or no stability. Starting from the
information about the development time and the
stability, it is possible to define how much energy
input a flour needs to produce good quality bread
and to avoid the overmixing phenomenon
(Weipert 2006).
The Mixograph is mainly a tool for plant
breeders, as it requires very small sample amounts
(2, 10, and 35 g), and contributes to the evalua-
tion of the baking quality of the seeds under
selection. The Mixograph test (AACCI 2004,
Method 54–40.02) is used more in the United
States than in European countries and, measures
the resistance of a dough to mixing with pins. The
dough is subjected to a rotating motion and to
stretching so that it is squeezed and folded, and
consequently, it is subjected to greater mechani-
cal stresses than dough mixed in a Farinograph
mixer (Weipert 2006). Moreover, the Mixograph
always operates with a constant amount of water
which results in dough of different consistency
(Weipert 1990; Mann and others 2008). The
recorded response gives the following indices: (1)
peak time, corresponding to the dough develop-
ment time; (2) peak height, a measure of the
dough resistance to the extension caused by the
passage of the pins; (3) mixing tolerance, corre-
sponding to the resistance of the dough to
breakdown during continued mixing (Vergnes
and others 2003).
More recently, DoughLAB (www.perten.com)
and Mixolab (www.chopin.fr) – see next section –
were introduced. Both pieces of equipment yield
similar traces to those obtained with the
Farinograph and Mixograph.
Prediction of proofing performance
Proofing (or leavening) can be considered the
key step in bread making. The CO2 from the
yeast diffuses into the air bubbles incorporated
in the dough during mixing, leading to the for-
mation of an aerated crumb structure whose
appearance greatly contributes to the sensory
assessment and consumer acceptability of bread
(Dobraszczyk and others 2000; Heenan and
others 2008; Lassoued and others 2008). Gas
production is highly affected by the amount of
yeast and the fermentation conditions, whereas
gas retention is related to the development
and rheological properties of the dough
(Cauvain 2009).
The behavior of the dough during fermenta-
tion can be shown and described using the
Rheofermentometer (www.chopin.fr). It pro-
vides a complete overview of the macroscopic
changes in the dough during fermentation as it
measures the production and retention of CO2
and the volume increase of the dough in a single
test. These parameters are measured in real
time (3 h), during which two curves are simulta-
neously generated: the first curve describes the
so-called “dough development”, whereas the
second quantifies the volume of total CO2
produced by the yeast, as well as the volume of
CO2 released from the dough and the relative
time courses.
Dough resistance to mechanical stress can
be also predicted and described using the
Alveograph (www.chopin.fr) and the Extenso-graph (www. brabender.com). In these tests, the
dough is subjected to intensive deformation until
it breaks. The resistance curve of the dough dur-
ing stretching is recorded and two main para-
meters are determined: resistance to large
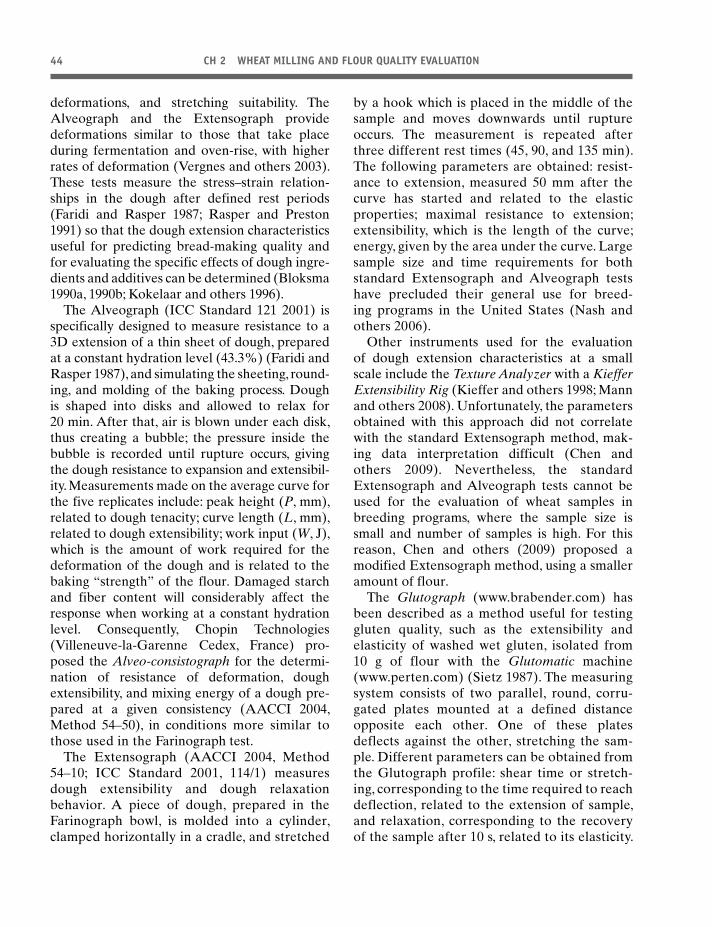
44 CH 2 WHEAT MILLING AND FLOUR QUALITY EVALUATION
deformations, and stretching suitability. The
Alveograph and the Extensograph provide
deformations similar to those that take place
during fermentation and oven-rise, with higher
rates of deformation (Vergnes and others 2003).
These tests measure the stress–strain relation-
ships in the dough after defined rest periods
(Faridi and Rasper 1987; Rasper and Preston
1991) so that the dough extension characteristics
useful for predicting bread-making quality and
for evaluating the specific effects of dough ingre-
dients and additives can be determined (Bloksma
1990a, 1990b; Kokelaar and others 1996).
The Alveograph (ICC Standard 121 2001) is
specifically designed to measure resistance to a
3D extension of a thin sheet of dough, prepared
at a constant hydration level (43.3%) (Faridi and
Rasper 1987), and simulating the sheeting, round-
ing, and molding of the baking process. Dough
is shaped into disks and allowed to relax for
20 min. After that, air is blown under each disk,
thus creating a bubble; the pressure inside the
bubble is recorded until rupture occurs, giving
the dough resistance to expansion and extensibil-
ity. Measure ments made on the average curve for
the five replicates include: peak height (P, mm),
related to dough tenacity; curve length (L, mm),
related to dough extensibility; work input (W, J),
which is the amount of work required for the
deformation of the dough and is related to the
baking “strength” of the flour. Damaged starch
and fiber content will considerably affect the
response when working at a constant hydration
level. Consequently, Chopin Technologies
(Villeneuve-la-Garenne Cedex, France) pro-
posed the Alveo-consistograph for the determi-
nation of resistance of deformation, dough
extensibility, and mixing energy of a dough pre-
pared at a given consistency (AACCI 2004,
Method 54–50), in conditions more similar to
those used in the Farinograph test.
The Extensograph (AACCI 2004, Method
54–10; ICC Standard 2001, 114/1) measures
dough extensibility and dough relaxation
behavior. A piece of dough, prepared in the
Farinograph bowl, is molded into a cylinder,
clamped horizontally in a cradle, and stretched
by a hook which is placed in the middle of the
sample and moves downwards until rupture
occurs. The measurement is repeated after
three different rest times (45, 90, and 135 min).
The following parameters are obtained: resist-
ance to extension, measured 50 mm after the
curve has started and related to the elastic
properties; maximal resistance to extension;
extensibility, which is the length of the curve;
energy, given by the area under the curve. Large
sample size and time requirements for both
standard Extensograph and Alveograph tests
have precluded their general use for breed-
ing programs in the United States (Nash and
others 2006).
Other instruments used for the evaluation
of dough extension characteristics at a small
scale include the Texture Analyzer with a Kieffer Extensibility Rig (Kieffer and others 1998; Mann
and others 2008). Unfortunately, the parameters
obtained with this approach did not correlate
with the standard Extensograph method, mak-
ing data interpretation difficult (Chen and
others 2009). Nevertheless, the standard
Extensograph and Alveograph tests cannot be
used for the evaluation of wheat samples in
breeding programs, where the sample size is
small and number of samples is high. For this
reason, Chen and others (2009) proposed a
modified Extensograph method, using a smaller
amount of flour.
The Glutograph (www.brabender.com) has
been described as a method useful for testing
gluten quality, such as the extensibility and
elasticity of washed wet gluten, isolated from
10 g of flour with the Glutomatic machine
(www.perten.com) (Sietz 1987). The measuring
system consists of two parallel, round, corru-
gated plates mounted at a defined distance
opposite each other. One of these plates
deflects against the other, stretching the sam-
ple. Different parameters can be obtained from
the Glutograph profile: shear time or stretch-
ing, corresponding to the time required to reach
deflection, related to the extension of sample,
and relaxation, corresponding to the recovery
of the sample after 10 s, related to its elasticity.
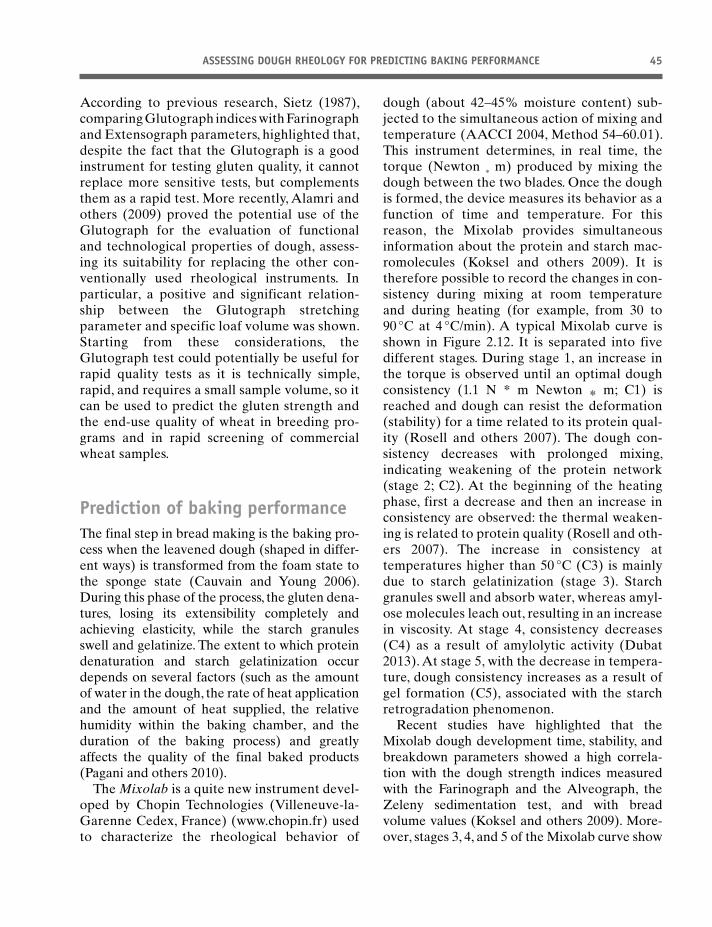
ASSESSING DOUGH RHEOLOGY FOR PREDICTING BAKING PERFORMANCE 45
According to previous research, Sietz (1987),
comparing Glutograph indices with Farinograph
and Extensograph parameters, highlighted that,
despite the fact that the Glutograph is a good
instrument for testing gluten quality, it cannot
replace more sensitive tests, but complements
them as a rapid test. More recently, Alamri and
others (2009) proved the potential use of the
Glutograph for the evaluation of functional
and technological properties of dough, assess-
ing its suitability for replacing the other con-
ventionally used rheological instruments. In
particular, a positive and significant relation-
ship between the Glutograph stretching
parameter and specific loaf volume was shown.
Starting from these considerations, the
Glutograph test could potentially be useful for
rapid quality tests as it is technically simple,
rapid, and requires a small sample volume, so it
can be used to predict the gluten strength and
the end-use quality of wheat in breeding pro-
grams and in rapid screening of commercial
wheat samples.
Prediction of baking performance
The final step in bread making is the baking pro-
cess when the leavened dough (shaped in differ-
ent ways) is transformed from the foam state to
the sponge state (Cauvain and Young 2006).
During this phase of the process, the gluten dena-
tures, losing its extensibility completely and
achieving elasticity, while the starch granules
swell and gelatinize. The extent to which protein
denaturation and starch gelatinization occur
depends on several factors (such as the amount
of water in the dough, the rate of heat application
and the amount of heat supplied, the relative
humidity within the baking chamber, and the
duration of the baking process) and greatly
affects the quality of the final baked products
(Pagani and others 2010).
The Mixolab is a quite new instrument devel-
oped by Chopin Technologies (Villeneuve-la-
Garenne Cedex, France) (www.chopin.fr) used
to characterize the rheological behavior of
dough (about 42–45% moisture content) sub-
jected to the simultaneous action of mixing and
temperature (AACCI 2004, Method 54–60.01).
This instrument determines, in real time, the
torque (Newton * m) produced by mixing the
dough between the two blades. Once the dough
is formed, the device measures its behavior as a
function of time and temperature. For this
reason, the Mixolab provides simultaneous
information about the protein and starch mac-
romolecules (Koksel and others 2009). It is
therefore possible to record the changes in con-
sistency during mixing at room temperature
and during heating (for example, from 30 to
90 °C at 4 °C/min). A typical Mixolab curve is
shown in Figure 2.12. It is separated into five
different stages. During stage 1, an increase in
the torque is observed until an optimal dough
consistency (1.1 N * m Newton * m; C1) is
reached and dough can resist the deformation
(stability) for a time related to its protein qual-
ity (Rosell and others 2007). The dough con-
sistency decreases with prolonged mixing,
indicating weakening of the protein network
(stage 2; C2). At the beginning of the heating
phase, first a decrease and then an increase in
consistency are observed: the thermal weaken-
ing is related to protein quality (Rosell and oth-
ers 2007). The increase in consistency at
temperatures higher than 50 °C (C3) is mainly
due to starch gelatinization (stage 3). Starch
granules swell and absorb water, whereas amyl-
ose molecules leach out, resulting in an increase
in viscosity. At stage 4, consistency decreases
(C4) as a result of amylolytic activity (Dubat
2013). At stage 5, with the decrease in tempera-
ture, dough consistency increases as a result of
gel formation (C5), associated with the starch
retrogradation phenomenon.
Recent studies have highlighted that the
Mixolab dough development time, stability, and
breakdown parameters showed a high correla-
tion with the dough strength indices measured
with the Farinograph and the Alveograph, the
Zeleny sedimentation test, and with bread
volume values (Koksel and others 2009). More-
over, stages 3, 4, and 5 of the Mixolab curve show
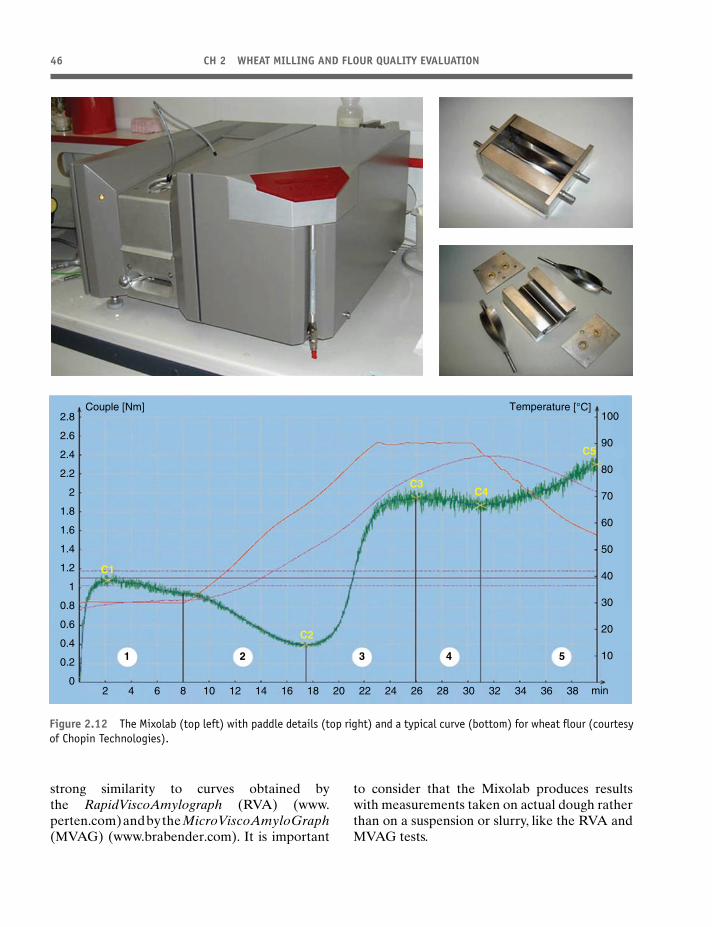
46 CH 2 WHEAT MILLING AND FLOUR QUALITY EVALUATION
strong similarity to curves obtained by
the RapidViscoAmylograph (RVA) (www.
perten.com) and by the Micro ViscoAmyloGraph
(MVAG) (www.brabender.com). It is important
to consider that the Mixolab produces results
with measurements taken on actual dough rather
than on a suspension or slurry, like the RVA and
MVAG tests.
2
2.8Couple [Nm]
2.6
2.4
2.2
2
1.8
1.6
1.4
1.2
1
0.8
0.6
0.4
0.2
0
1 2 3 4 5
C2
C1
C3C4
C5
4 6 8 10 12 14 16 18 20 22 24 26 28 30 32 34 36 38 min
100
90
80
70
60
50
40
30
20
10
Temperature [°C]
Figure 2.12 The Mixolab (top left) with paddle details (top right) and a typical curve (bottom) for wheat flour (courtesy
of Chopin Technologies).
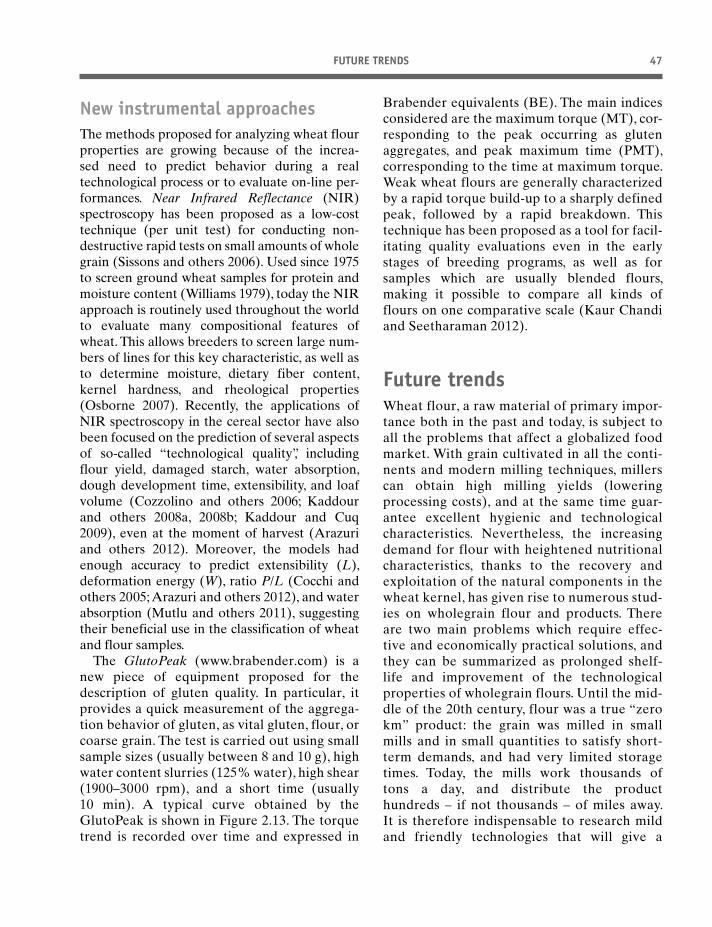
FUTURE TRENDS 47
New instrumental approaches
The methods proposed for analyzing wheat flour
properties are growing because of the increa-
sed need to predict behavior during a real
technological process or to evaluate on-line per-
formances. Near Infrared Reflectance (NIR)
spectroscopy has been proposed as a low-cost
technique (per unit test) for conducting non-
destructive rapid tests on small amounts of whole
grain (Sissons and others 2006). Used since 1975
to screen ground wheat samples for protein and
moisture content (Williams 1979), today the NIR
approach is routinely used throughout the world
to evaluate many compositional features of
wheat. This allows breeders to screen large num-
bers of lines for this key characteristic, as well as
to determine moisture, dietary fiber content,
kernel hardness, and rheological properties
(Osborne 2007). Recently, the applications of
NIR spectroscopy in the cereal sector have also
been focused on the prediction of several aspects
of so-called “technological quality”, including
flour yield, damaged starch, water absorption,
dough development time, extensibility, and loaf
volume (Cozzolino and others 2006; Kaddour
and others 2008a, 2008b; Kaddour and Cuq
2009), even at the moment of harvest (Arazuri
and others 2012). Moreover, the models had
enough accuracy to predict extensibility (L),
deformation energy (W), ratio P/L (Cocchi and
others 2005; Arazuri and others 2012), and water
absorption (Mutlu and others 2011), suggesting
their beneficial use in the classification of wheat
and flour samples.
The GlutoPeak (www.brabender.com) is a
new piece of equipment proposed for the
description of gluten quality. In particular, it
provides a quick measurement of the aggrega-
tion behavior of gluten, as vital gluten, flour, or
coarse grain. The test is carried out using small
sample sizes (usually between 8 and 10 g), high
water content slurries (125% water), high shear
(1900–3000 rpm), and a short time (usually
10 min). A typical curve obtained by the
GlutoPeak is shown in Figure 2.13. The torque
trend is recorded over time and expressed in
Brabender equivalents (BE). The main indices
considered are the maximum torque (MT), cor-
responding to the peak occurring as gluten
aggregates, and peak maximum time (PMT),
corresponding to the time at maximum torque.
Weak wheat flours are generally characterized
by a rapid torque build-up to a sharply defined
peak, followed by a rapid breakdown. This
technique has been proposed as a tool for facil-
itating quality evaluations even in the early
stages of breeding programs, as well as for
samples which are usually blended flours,
making it possible to compare all kinds of
flours on one comparative scale (Kaur Chandi
and Seethara man 2012).
Future trendsWheat flour, a raw material of primary impor-
tance both in the past and today, is subject to
all the problems that affect a globalized food
market. With grain cultivated in all the conti-
nents and modern milling techniques, millers
can obtain high milling yields (lowering
processing costs), and at the same time guar-
antee excellent hygienic and technological
characteristics. Nevertheless, the increasing
demand for flour with heightened nutritional
characteristics, thanks to the recovery and
exploitation of the natural components in the
wheat kernel, has given rise to numerous stud-
ies on wholegrain flour and products. There
are two main problems which require effec-
tive and economically practical solutions, and
they can be summarized as prolonged shelf-
life and improvement of the technological
properties of wholegrain flours. Until the mid-
dle of the 20th century, flour was a true “zero
km” product: the grain was milled in small
mills and in small quantities to satisfy short-
term demands, and had very limited storage
times. Today, the mills work thousands of
tons a day, and distribute the product
hundreds – if not thousands – of miles away.
It is therefore indispensable to research mild
and friendly technologies that will give a
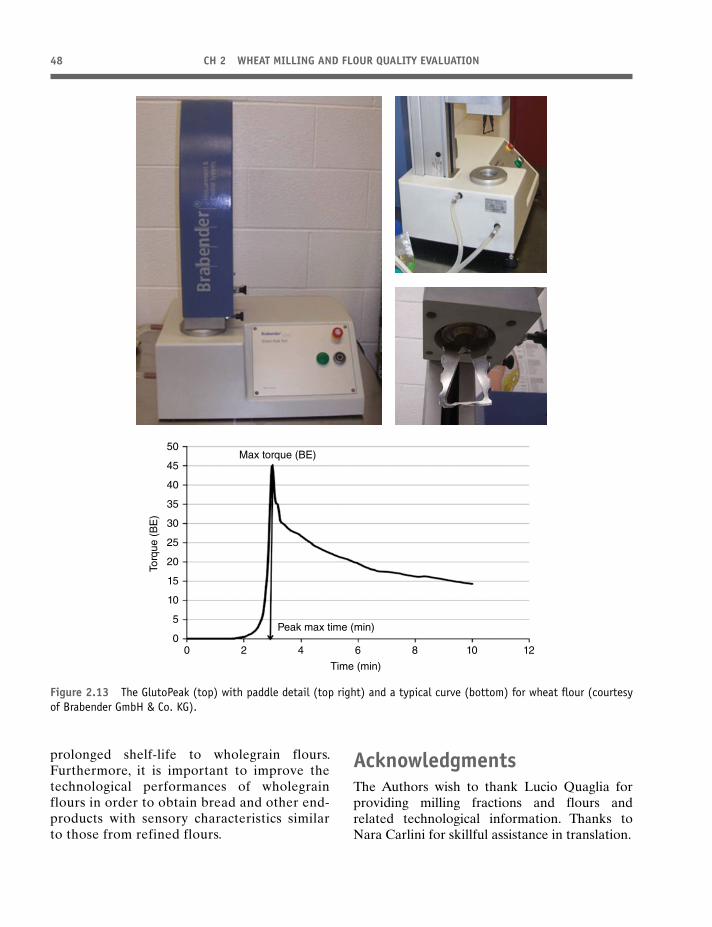
48 CH 2 WHEAT MILLING AND FLOUR QUALITY EVALUATION
prolonged shelf-life to wholegrain flours.
Furthermore, it is important to improve the
technological performances of wholegrain
flours in order to obtain bread and other end-
products with sensory characteristics similar
to those from refined flours.
AcknowledgmentsThe Authors wish to thank Lucio Quaglia for
providing milling fractions and flours and
related technological information. Thanks to
Nara Carlini for skillful assistance in translation.
00
5
50
45
40
35
30
25
20
15
10
2 6
Time (min)
Peak max time (min)
Max torque (BE)
Torq
ue (
BE
)
8 10 124
Figure 2.13 The GlutoPeak (top) with paddle detail (top right) and a typical curve (bottom) for wheat flour (courtesy
of Brabender GmbH & Co. KG).
REFERENCES 49
ReferencesAlamri M, Manthey F, Mergoum M, Elias E, Khan K.
2009. Assessing spring wheat quality using the
glutograph instrument. Cereal Foods World
54:124–31.
AACCI (American Association of Cereal Chemists
International). 1999. Definition of whole grain
[Accessed 2014 Jan 4]. Available from: http://www.
aaccnet.org/initiatives/definitions/Pages/WholeGrain.
aspx. St. Paul, MN: AACC International.
AACCI (American Association of Cereal Chemists
International). 2004. Approved methods. St. Paul,
MN: AACC International.
Anson NM, Selinheimo E, Havenaar R, Aura AM,
Mattila I, Lehtinen P, Bast A, Poutanen K, Haenen
GRMM. 2009. Bioprocessing of wheat bran improves
in vitro bioaccessibility and colonic metabolism of
phenolic compounds. J Agric Food Chem 57: 6148–55.
Antoine, C., Peyron, S., Lullien-Pellerin, V., Abecassis, J.,
Rouau, X. 2004. Wheat bran tissue fractionation
using biochemical markers. J Cereal Sci 39:387–93.
Arazuri S, Arana JI, Arias N, Arregui LM, Gonzalez-
Torralba J, Jaren J. 2012. Rheological parameters
determination using Near Infrared technology in
whole wheat grain. J Food Eng 111:115–21.
Arrigoni E, Jörger F, Kollöffel B, Roulet I, Herensperger
M, Meile, L, Amadò R. 2002. In vitro fermentability
of a commercial wheat germ preparation and its
impact on the growth of bifidobacteria. Food Res
Int 35: 475–81.
Bailey JE. 1992. Whole grain storage. In: Sauer DB,
editor. Storage of cereal grains and their products.
4th ed. St. Paul, MN: AACC International. p 157–82.
Barlow KK, Buttrose M S, Simmonds DH, Vesk M.
1973. The nature of the starch–protein interface in
wheat endosperm. Cereal Chem 50:443–54.
Barrera G N, Pèrez GT, Ribotta PD, Léon AE. 2007.
Influence of damaged starch on cookie and bread-
making quality. Eur Food Res Technol 225:1–7.
Bechtel DB, Abecassis J, Shewry PR, Evers AD. 2009.
Development, structure, and mechanical properties
of the wheat grain. In: Khan K, Shewry PP, editors.
Wheat: Chemistry and technology. 4th ed. St. Paul,
MN: AACC International. p 51–95.
Bell CH, Armitage DM. 1992. Alternative storage
practices. In: Sauer DB, editor. Storage of cereal
grains and their products. 4th ed. St. Paul, MN:
AACC International. p 249–311.
Bloksma AH. 1990a. Rheology of the breadmaking
process. Cereal Foods World 35:228–36, 959–60.
Bloksma AH. 1990b. Dough structure, dough rheology,
and baking quality. Cereal Foods World 35:237–55, 960.
Bottega G, Caramanico R, Lucisano M, Mariotti M,
Franzetti L, Pagani MA. 2009. The debranning of
common wheat (Triticum aestivum L.) with innova-
tive abrasive rolls. J Food Eng 94:75–82.
Bottega G, Marti A, Limbo S, Quaglia L, Pagani MA.
2012. Wheat germ stabilisation: heat treatment
or sourdough fermentation? An industrial case. In:
Proceeding of the V International Symposium on
Sourdough – Cereal Fermentation for Future Foods.
10–12 October 2012, Helsinki, Finland.
Brunckhorst, K. (2006) Wheat: more than just a plant.
Wheat history. In: Popper L, Schafer W, Freund W,
editors. Future of flour: a compendium of flour
improvement. Bergem, Germany: Agrimedia.
p 1–10.
Bushuk W, Scanlon, M. 1993. Wheat and wheat flour.
In: Kamel B, Stauffer C, editors. Advances in baking
technology. London: Chapman & Hall. p 1–19.
Carson GR, Edwards NM. 2009. Criteria of wheat and
flour quality. In: Khan K, Shewry PP, editors. Wheat:
Chemistry and technology. 4th ed. St. Paul, MN:
AACC International. p 97–118.
Cauvain SP. 2001. Breadmaking. In: Owens G, editor.
Cereals processing technology. Cambridge, UK:
Woodhead. p 204–30.
Cauvain SP, Young LS. 2006. The Chorleywood Bread
Process. Cambridge, UK: Woodhead.
Cauvain SP. 2009. The relevance of testing to the
manufacture of bread and fermented products. In:
Cauvain S, Young L, editors. The ICC handbook of
cereals, flour, dough and product testing. Methods
and applications. Lancaster, PA: DEStech Publica-
tions. p 125–55.
Chasseray P. 1991. Caractéristiques physiques des
grains et de leurs derives. In: Godon B, Willm C,
editors. Les industries de première transformation
des cereals. Paris: Technique et documentation
Lavoisier. p 105–76.
Chen RY, Seabourn BW, Xie F, Herald TJ. 2009. A
modified extensograph method for evaluating
dough properties of hard wheat breeding lines.
Cereal Chem 86:582–589.
Chung OK, Park SH, Tilley M, Lookhart GL. 2003.
Improving wheat quality. In: Cauvain SP, editor.
Bread making. Improving quality. Cambridge, UK:
Woodhead. p 536–61.
Cocchi M, Corbellini M, Foca G, Lucisano M, Pagani
MA, Tassia L, Ulrici A. 2005. Classification of
bread wheat flours in different quality categories
50 CH 2 WHEAT MILLING AND FLOUR QUALITY EVALUATION
by a wavelet-based feature selection/classification
algorithm on NIR spectra. Anal Chim Acta
544:100–7.
Cozzolino D, Delucchi I, Kholi M, Vázquez D. 2006.
Use of near infrared reflectance spectroscopy to
evaluate quality characteristics in whole-wheat
grain. Agric Tec 66:370–5.
D’Appolonia BL, Kunerth WH, editors. 1984. The
Farinograph handbook. 3rd ed. St. Paul, MN: AACC
International.
De Bry L. 2006. Wheat flour of the third millennium.
In: Hui Y H, editor. Bakery products: Science and
Technology. Oxford: Blackwell. p 87–96.
Delcour JA, Hoseney RC, editors. 2010. Principle of
cereal science and technology. 3rd ed. St. Paul, MN:
AACC International.
Delcour JA, Rouau X, Courtin CM, Poutanen K,
Ranieri R. 2012. Technologies for enhanced exploi-
tation of the health-promoting potential of cereals.
Trends Food Sci Technol 25:78–86.
Dexter J E, Martin D G, Sadaranganey GT, Michaelides J,
Mathieson N, Tkac JJ, Marchylo BA. 1994.
Preprocessing: effects on durum wheat milling and
spaghetti-making quality. Cereal Chem 71:10–16.
Dexter JE, Wood PJ. 1996. Recent applications of
debranning of wheat before milling. Trends Food Sci
Technol 71:35–41.
Doblado-Maldonado AF, Pike OA, Sweley JC, Rose,
DJ. 2012. Key issues and challanges in whole wheat
flour milling and storage. J Cereal Sci. DOI:10.1016/j.
jcs.2012.02.015.
Dobraszczyk BJ, Campbell GM, Gan Z. 2000. Bread: a
unique food. In: Dobraszczyk BJ, Dendy DAV,
editors. Cereals and cereal products: technology and
chemistry. Gaithersburg, MD: Aspen. p 182–232.
Dobraszczyk BJ. 2001. Wheat and flour. In:
Dobraszczyk BJ, Dendy DAV, editors. Cereals and
cereal products: technology and chemistry.
Gaithersburg, MD: Aspen. p 100–39.
Dobraszczyk BJ, Whitworth MB, Vincent JFV, Khan A.
2002. Single kernel wheat hardness and fracture in
wheat endosperm. J Cereal Sci 35:245–63.
Dobraszczyk BJ, Morgenstern MP. 2003. Rheology and
the breadmaking process. J Cereal Sci 38:229–45.
Dubat, A. 2013. The Mixolab. In: Mixolab. A new
approach to rheology. Dubat A, Rossel CM,
Gallagher E, editors. St Paul, MN: AACC. p 3–13.
Dunkel FV. 1992. The stored grain ecosystem: a global
perspective. J Stored Prod Res 28:73–87.
FAO/WHO. 1997. Hazard Analysis and Critical Control
Point (HACCP) system and guidelines for its applica-
tion. In: Joint FAO/WHO food standards programme.
Codex Alimentarius Commission, editors. Codex
Alimentarius. Food Hygiene. Basic Texts. 2nd ed.
Food and Agricultural Organization of the United
Nations World Health Organization. p 33–44.
Faridi HA, Rasper VF, editors. 1987. The Alveograph
handbook. St. Paul, MN: AACC International.
Fields PG, White NDG. 2002. Alternatives to methyl
bromide treatments for stored product and quaran-
tine insects. Annu Rev Entomol 47:331–59.
Finney PL, Henry S, Jeffers H. 1985. Effect of wheat
variety, flour grinding, and egg yolk on whole wheat
bread quality. Cereal Chem 62:170–3.
Fiwari BK, Brennan CS, Curran T, Gallagher E,
Cullend PJ, O’Donella CP. 2010. Application of
ozone in grain processing. J Cereal Sci 51:248–55.
Fleurat-Lessard F. 2004. Physico-chemical treatment.
In: Wrigley C, Corke H, Walker C, editors.
Encyclopedia of grain science. London: Academic
Press. p 254–63.
Freund W, Kin MY. 2006. Determining the baking
quality of wheat and rye flour In: Popper L,
Schafer W, Freund W, editors. Future of flour: a com-
pendium of flour improvement. Bergem, Germany:
Agrimedia. p 101–16.
Gaines C, Donelson J, Finney J. 1988. Effects of damaged
starch, chlorine gas, flour particle size, and dough hold-
ing time and temperature on cookie dough handling
properties and cookie size. Cereal Chem 65:384–9.
Ge Y, Sun A, Ni Y, Cai, T. 2000. Some nutritional and
functional properties of defatted wheat germ
protein. J Agric Food Chem 48:6215–18.
Greenwell P, Schofield JD. 1986. A starch granule pro-
tein associated with endosperm softness in wheat.
Cereal Chem 63:379–80.
Grosh GM, Shelleberg JA, Farrel EP. 1960. Milling
properties of wheat in relation to scouring and
impaction. Cereal Chem 37:593–602.
Hardin JA, Jones CL, Bonjour EL, Noyes RT, Beeby
RL, Eltiste DA, Decker S. 2010. Ozone fumigation of
stored grain; closed-loop recirculation and the rate of
ozone consumption. J Stored Prod Res 46:149–54.
Hareland GA. 2003. Effects of pearling on falling
number and alpha-amylase activity of preharvest
sprouted spring wheat. Cereal Chem 80:232–7.
Haridas Rao P, Kumar GV, Ranga Rao GCP, Shurpalekar
SR. 1980. Studies on stabilisation of wheat germ.
Lebensmittel-Wissenschaft und - Technologie 13,
302–307.
Heenan SP, Dufour J, Hamid N, Harvey W, Delahunty
CM. 2008. The sensory quality of fresh bread:
descriptive attributes and consumer perceptions.
Food Res Int 41:989–97.
Henry RJ, Martin DJ, Blakeney AB. 1986. Reduction
of the alpha-amylase content of sprouted wheat by
pearling and milling. J Cereal Sci 5:155–66.
ICC. 2001. Standards methods of the ICC. Detmold,
Germany: International Association for Cereal
Science and Technology.
ISO. 2005. ISO Standards 22000. Food safety manage-
ment systems – Requirements for any organization
in the food chain. Geneva: International Organ-
ization for Standardization.
ISO. 2007. ISO Standards 22005. Traceability in the
feed and food chain – General principles and basic
requirements for system design and implemen-
tation. Geneva: International Organization for
Standardization.
ISO. 2008. ISO Standards 9001. Quality management
systems – Requirements. Geneva: International
Organization for Standardization.
Kaddour AA, Barron C, Robert P, Cuq B. 2008a.
Physico-chemical description of bread dough mix-
ing using two-dimensional near-infrared correlation
spectroscopy and moving-window two-dimensional
correlation spectroscopy. J Cereal Sci 48:10–19.
Kaddour AA, Morel MH., Cuq B. 2008b. Description
of batter mixing using near infrared spectroscopy.
J Cereal Sci 48:698–708.
Kaddour AA, Cuq B. 2009. In line monitoring of wet
agglomeration of wheat flour using near infrared
spectroscopy. Powder Technol 190:10–18.
Katina K. 2003. High-fibre baking. In: Cauvain SP, edi-
tor. Bread making. Improving quality. Cambridge,
UK: CRC–Woodhead. p 487–99.
Kaur Chandi G, Seetharaman K. 2012. Optimization
of gluten peak tester: a statistical approach. J Food
Qual 35:69–75.
Kieffer R, Wieser H, Henderson MH, Graveland A.
1998. Correlations of the breadmaking performance
of wheat flour with rheological measurements on a
micro-scale. J Cereal Sci 27:53–60.
Kokelaar JJ, Van Vliet T, Prins A. 1996. Strain harden-
ing properties and extensibility of flour and gluten
doughs in relation to breadmaking performance.
J Cereal Sci 24:199–214.
Koksel H, Kahraman K, Sanal T, Ozay DS, Dubat A.
2009. Potential utilization of Mixolab for quality
evaluation of bread wheat genotypes. Cereal Chem
86:522–6.
Ktenioudaki A, Butler F, Gallagher E. 2010.
Rheological properties and baking quality of wheat
varieties from various geographical regions. J Cereal
Sci 51:402–8.
Laca A, Mousia Z, Dıaz M, Webb C, Pandiella SS.
2006. Distribution of microbial contamination
within cereal grains. J Food Eng 72:332–8.
Lafiandra D, D’Egidio MG. 2010. Chimica e attitudine
tecnologica delle materie prime. In: Gobbetti M,
Corsetti A, editors. Biotecnologia dei prodotti
lievitati da forno. Milan: Casa Editrice Ambrosiana.
p 17–37.
Lai CS, Hoseney RC, Davis AB. 1989. Effects of wheat
bran in breadmaking. Cereal Chem 66:217–19.
Lassoued N, Delarue J, Launay B, Michon C. 2008.
Baked product texture: correlations between instru-
mental and sensory characterization using flash
profile. J Cereal Sci 48:133–43.
Liu R, Liang Z, Posner ES, Ponte JG. 1986. A tech-
nique to improve functionality of flour from
sprouted wheat. Cereal Foods World 31:471–6.
Locken L, Loska S, Shuey W, editors. 1991. The
Farinograph handbook. St. Paul, MN: AACC
International.
Lucisano M, Pagani MA. 1997. Cereali e derivati. In:
Daghetta A, editor. Gli alimenti: Aspetti tecnologici
e nutrizionali. Milan: Istituto Danone. p 7–67.
Madureri E, editor. 1995. Storia della macinazione dei
cereali. Tecnologia della macinazione. Pinerolo,
Italy: Chiriotti Editori.
Mann G, Diffey S, Allen H, Pumpa J, Nath Z, Morell
MK, Cullis B, Smith A. 2008. Comparison of small-
scale and large-scale mixing characteristics: correla-
tions between small-scale and large-scale mixing
and extensional characteristics of wheat flour dough.
J Cereal Sci 47:90–100.
Marshall, D.R, Mares, D.J, Moss, H.J., Ellison, F.W.
1986. Effect of grain shape and size on milling yields
in wheat. II. Experimental studies. Aust J Agric Res
37:331–42.
Marti A, Bottega G, Casiraghi MC, Faoro F, Iametti S,
Pagani MA. 2014. Dietary fibre enzymatic treat-
ment: a way to improve the rheological properties of
high-fibre enriched dough. Int J Food Sci Technol
49:305–307.
Matucci A, Veneri G, Dalla Pellegrina C, Zoccatelli G,
Vincenzi S, Chignola R, Peruffo ADB, Rizzi C.
2004. Temperature-dependent decay of wheat germ
agglutinin activity and its implications for food
processing and analysis. Food Control 15:391–5.
McDonough MX, Campabadal CA, Masona LJ, Maier
DE, Denvir A, Woloshuk E. 2011. Ozone application
in a modified screw conveyor to treat grain for insect
REFERENCES 51
52 CH 2 WHEAT MILLING AND FLOUR QUALITY EVALUATION
pests, fungal contaminants, and mycotoxins. J Stored
Prod Res 47:249–54.
McGee BC. 1995. The Peritec process and its applica-
tion to durum wheat milling. Assoc Operat Millers
Bull. March:6521–8.
Mendez F, Maier D, Mason L, Woloshuk C. 2003.
Penetration of ozone into columns of stored grains
and effects on chemical composition and processing
performance. J Stored Prod Res 39:33–44.
Moder GJ, Finney KF, Bruinsma BL, Ponte JG, Bolte LC.
1984. Bread-making potential of straight-grade and
whole-wheat flours of triumph and eagle-plainsman V
gard red winter wheats. Cereal Chem 61:269–73.
Mok C, Dick JW. 1991. Response of starch of different
wheat classes to ball milling 1. Cereal Chem
69:409–12.
Mondal, A, Datta AK. 2008. Bread baking – a review.
J Food Eng 86:465–74.
Morris CF. 2002. Puroindolines: the molecular genetic
basis of wheat grain hardness. Plant Mol Biol
48:633–47.
Mutlu AC, Boyaci IH, Genis HE, Ozturk R, Basaran-
Akgul N, Sanal T, Evlice AK. 2011. Prediction of
wheat quality parameters using near-infrared spec-
troscopy and artificial neural networks. Eur Food
Res Technol 233:267–74.
Nash D, Lanning SP, Fox P, Martin JM, Blake NK,
Souza E, Graybosch RA, Giroux MJ, Talbert LE.
2006. Relationship of dough extensibility to dough
strength in a spring wheat cross. Cereal Chem
83:255–8.
Osborne BG, Henry RJ, Southan MD. 2007. Assessment
of commercial milling potential of hard wheat by
measurement of the rheological properties of whole
grain. J Cereal Sci 45:122–7.
Pagani MA, Lucisano M, Mariotti M. 2006. Italian
bakety. In: Hui YH, editor. Bakery products: Science
and technology. Oxford: Blackwell. p 527–60.
Pagani MA, Lucisano M, Mariotti M. 2007. Traditional
Italian products from wheat and other starchy flours.
In: Hui YH, editor. Handbook of food products
manufacturing. p 328–88. Hoboken, NJ: John Wiley &
Sons, Inc.
Pagani MA, Mariotti M, Bottega G. 2010. Tecnologia
dei prodotti lievitati d forno. In: Gobbetti M, Corsetti A,
editors. Biotecnologia dei prodotti lievitati da forno.
Milan: Casa Editrice Ambrosiana. p 39–69.
Paradiso VM, Summo C, Trani A, Caponio F. 2008.
An effort to improve the shelf-life of breakfast
cereals using natural mixed tocopherols. J Cereal Sci
47:322–30.
Pomeranz, Y. 1961. The problem involved in “peeling”
of wheat kernels. Cereal Sci Today 6:76–9.
Pomeranz Y, editor. 1987. Modern cereal science and
technology. Weinheim, Germany: VHC.
Pomeranz Y. 1992. Biochemical, functional, and nutri-
tive changes during storage. In: Sauer DB, editor.
Storage of cereal grains and their products. 4th ed.
St. Paul, MN: AACC International. p 55–141.
Posner ES, Hibbs AN, editors. 1997. Wheat flour
milling. St. Paul, MN: AACC International.
Posner ES. 2000. Wheat. In: Kulp K, Ponte JG, editors.
Handbook of cereal science and technology,
revised and expanded. 2nd ed. New York, NY:
Marcell Dekker. p 1–29.
Posner ES. 2009. Wheat flour milling. In: Khan K,
Shewry PR, editors. Wheat. Chemistry and techno-
logy. 4th ed. St. Paul, MN: AACC International. p
119–52.
Poutanen K. 2012. Past and future of cereal grains as
food for health. Trends Food Sci Technol 25:58–62.
Pyler EJ. 1988. Fundamental of baking technology. In:
Pyler EJ, editor. Baking Science and Technology.
Part three, Vol. II. Merriam, USA: Sosland.
Rasper F, Preston KR, editors. 1991. Applications of
the Extensigraph handbook., St. Paul, MN: AACC
International.
Rizzello CG, Nionelli L, Coda R, De Angelis M,
Gobbetti M. 2010. Effect of sourdough fermentation
on stabilisation, and chemical and nutritional char-
acteristics of wheat germ. Food Chem 119:1079–89.
Rosell CM. 2003. The nutritional enhancement of
wheat flour. In: Cauvain SP, editor. Bread making.
Improving quality. p 253–70. Cambridge, UK:
CRC–Woodhead.
Rosell CM, Collar C, Haros M. 2007. Assessment of
hydrocolloid effects on the thermo-mechanical
properties of wheat using the Mixolab. Food
Hydrocoll 21:452–62.
Salmenkallio-Marttila M, Katina K, Autio K. 2001.
Effects of bran fermentation on quality and micro-
structure of high-fibre wheat bread. Cereal Chem
78:429–35.
Sekhon KS, Singh N, Singh RP. 1992. Studies of the
improvement of quality of wheat infected with
Karnal bunt. I. Milling, rheological and baking
properties. Cereal Chem 69:50–4.
Shewry PR, D’Ovidio R, Lafiandra D, Jenkins JA,
Clare Mills EN, Békés F. 2009. Wheat grain proteins.
In: Khan K, Shewry PP, editors. Wheat: Chemistry
and technology. 4th ed. St. Paul, MN: AACC
International. p 223–98.
Shewry PR, Charmet G, Branlard G, Lafiandra D,
Gergely S, Salgó A, Saulnier L, Beo Z, Clare Mills
EN, Ward JL. 2012. Developing new types of wheat
with enhanced health benefits. Trends Food Sci
Technol 25:70–7.
Shogren MD, Pomeranz Y, Finney KF. 1981.
Counteracting the deleterious effects of fiber in
breadmaking. Cereal Chem 58:142–4.
Sietz W. 1987. A new method to test gluten quality. In:
Munk L, editor. Cereal science and Technology.
Proceeding of the 23rd Nordic cereal congress.
Copenhagen, Denmark: Danish Cereal Society.
p 305–26.
Sissons M, Osborne B, Sissons S. 2006. Application of
near infrared reflectance spectroscopy to a durum
wheat breeding programme. J Near Infrared
Spectrosc 14:17–25.
Sjövall O, Virtalaine T, Lapveteläinen A, Kallio H.
2000. Development of rancidity in wheat germ
analyzed by headspace gas chromatography and
sensory analysis. J Agric Food Chem 48:3522–7.
Sperber WH. 2007. Role of microbiological guidelines
in the production and commercial use of milled
cereal grains: a practical approach for the 21st
century. J Food Protect 70:1041–53.
Srivastava AK, Sudha ML, Baskaran V, Leelavathi K.
2007. Studies on heat stabilized wheat germ and its
influence on rheological characteristics of dough.
Eur Food Res Technol 224:365–72.
Tkac JJ. 1992. Process for removing bran layers from
wheat kernels. US Patent 5,082,680.
Troccoli A, Borrelli GM, De Vita P, Fares C, Di Fonzo N.
2000. Durum wheat quality: a multidisciplinary con-
cept. J Cereal Sci 32:99–113.
Vergnes B, Della Valle G, Colonna P. 2003. Rheological
properties of biopolymers and applications to cereal
processing. In: Kaletung G, Breslauer KJ, editors.
Characterization of cereals and flours properties,
analysis, and applications. New York, NY: Marcell
Dekker. p 209–65.
Webb C, Owens GW. 2003. Milling and flour quality. In:
Cauvain SP, editor. Bread making. Improving quality.
Cambridge, UK: CRC–Woodhead. p 200–19.
Weipert D. 1990. The benefits of basic rheometry in
studying dough rheology. Cereal Chem 67:311–17.
Weipert D. 2006. Fundamentals of rheology and spec-
trometry. Rheology. In: Popper L, Schafer W, Freund W,
editors. Future of flour: a compendium of flour improve-
ment. Bergem, Germany: Agrimedia. p 117–45.
Wellman W. 1992. Wheat milling process. US Patent 5,
089, 282.
Werner, A. 2002. Traceability of raw material in baker-
ies. Getr Mehl Brot 56:358–60.
Williams PC. 1979. Screening wheat for protein and
hardness by near infrared spectroscopy. Cereal
Chem 56:169–72.
Willis M, Giles J. 2001. The application of a debranning
process to durum wheat milling. In: Kill RC, Tumbull
K, editors. Pasta and Semolina Technology. Oxford:
Blackwell Science. p 64–85.
Wrigley C, Batey I. 2003. Assessing grain quality. In:
Cauvain SP, editor. Bread making. Improving
quality. 1st ed. Cambridge, UK: Woodhead.
p 71–96.
Wrigley CW. 2009. Wheat: a unique grain in the world.
In: Khan K, Shewry PP, editors. Wheat: Chemistry
and technology. 4th ed. St. Paul, MN: AACC
International. p 1–17.
Zeleny L. 1954. Chemical, physical, and nutritive
changes during storage. In: Anderson JA, Alcock
AW, editors. Storage of cereal grains and their
products. St. Paul, MN: AACC International.
p 46–76.
Zhu KX, Zhou HM, Qian HF. 1986. Protein extracted
from defatted wheat germ: nutritional and structural
properties. Cereal Chem 83:69–75.
Websites (31 July 2012):
www.brabender.com
www.buhlergroup.com
www.chinagrain.gov.cn
www.chopin.fr
www.fao.org
www.grainscanada.gc.ca
www.healthgrain.eu
www.icar.org.in
www.international.inra.fr
www.molinoquaglia.com
www.mri.bund.d
www.national-mfg.com
www.ocrim.it
www.perten.com
www.rusgrain.com
www.satake-group.com
www.usda.gov
www.uswheat.org
www.wea.gov.au
REFERENCES 53