backwardness and economic development in nineteenth ... · backwardness and economic development in...
TRANSCRIPT
Backwardness and Economic Development in Nineteenth Century Russia
by
Robert C.Allen (University of Oxford)
Ekaterina Khaustova (Russian State Social University)
Incomplete draft
2
Nineteenth century Russia exhibited contradictory features in its economic
and social development. Gerschenkron placed it at the ‘backward’ end of his
European continuum since it was mainly an agricultural economy dominated by
small scale peasant cultivators and handicraft fabricators. Income was low,
serfdom was abolished only in 1861, the state was an autocracy. And yet, the
economy–especially in comparison to India, China, the middle east or north
Africa–showed signs of progress. There was a big industrial sector with large
scale, capital intensive factories. Incomes were rising, a massive rail network was
built, and the state used high tariffs to push industry forward. 1917, of course, saw
the communist revolution that contemporaries imagined could only happen in an
advanced economy. How did progress and retrogression fit together in late
imperial Russia?
We can sharpen the question by posing it in terms of world system theory.
Wallerstein divided the world into three categories–the core (the rich, highly
developed economies that dominated the world economy), the periphery (the poor,
low productivity economies that exported primary products and imported
manufactures) and the semi-periphery composed of countries showing aspects of
both development and underdevelopment. Russia in the nineteenth century was
semi-peripheral. This theory has been criticized for the vagueness of its definitions
and the lack of a quantitative base. We shall address these objections by
presenting several quantitative indicators that show Russia’s intermediate status
and a theoretical analysis that ties them together.
The hard question is: how can we explain why Russia was in this position.
Wallerstein argued that a question like this can be answered only by considering it
in terms of the global economy. He was criticized by Brenner for underplaying the
importance of domestic factors, in particular, the class structure. We argue that it
is necessary to consider both the world system and domestic factors in explaining
the economic history of Russia. Two features of the world system were crucial in
understanding Russian development. First, steamships and railways cut shipping
3
costs and produced a tightly integrated economy in which the principle of
comparative advantage came forcefully into play. Second, new technology was
invented in rich countries–Britain during the industrial revolution and later also the
USA and western Europe. They invented technologies which suited their
circumstances, and these included relatively high wages and cheap energy costs.
While these were the technologies that poor countries needed to develop, they were
not always profitable to adopt there since wages were much lower and energy costs
higher than in the rich countries, so old fashioned hand technology was often still
the cheapest way to produce. Under these circumstances, the rise in manufacturing
productivity in the rich countries (the core) de-industrialized the poor countries,
turning them into primary product exports (the periphery).
If globalization and technical change were the only developments affecting
Russia, the country would have joined the periphery like India, China, and Egypt.
Domestic factors were important in making Russia ‘semi-peripheral.’ An important
one was agricultural organization, a theme often emphasized by Brenner. Serfdom
up to 1861 and the repartitional commune that generally replaced it were rural
agrarian institutions that profoundly affected Russian industrial development.
They did not appear out of the blue, however. Serfdom can be seen as the result of
the small size of the Russian population in relation to the great expanse of
cultivable land. For the aristocracy to collect rents from its tenants, they had to be
prevented from wandering off into unoccupied country out of the lords’ reach, and
the autocratic state bound them in place (Domar). A vast country also influenced
industrial development directly by presenting industry with boundless mineral and
forest resources to exploit. Finally, state policy played a role in influencing
Russian development by promoting railways, which brought virgin land into the
ambit of commercial agriculture, and tariffs, which aimed to promote industry even
as the country’s comparative advantage was shifting away from it. We will show
how these factors interacted to produce a ‘semi-peripheral’ economic structure in
nineteenth century Russia.
4
History needs a methodology and ours is wage and price history. This
approach has been used previously to explain why the industrial revolution
occurred in Britain in the eighteenth century (Allen) and to analyze how and why
the development of the American economy in the nineteenth century differed from
that of Britain, on the one hand, and Egypt and India, on the other (Allen 2014).
We will extend those comparisons to include Russia. We will be measuring and
comparing the prices of labour, capital, and natural resource products over the
nineteenth century in these five countries to measure the degree of development
and to test hypotheses about the sources of industrial growth and the incentives to
adopt advanced technology. Finally, we shall analyze serfdom and the
repartitional commune theoretically to show that they would be expected to have
produced the wage and price patterns we observe and the dualistic economic
structure of nineteenth century Russia, i.e. its semi-peripheralization.
To do these comparisons, it was necessary to develop a new data base of
Russian wages and prices. Data were collected for two major cities–Moscow and
St Petersburg–as well as Kursk, a provincial capital whose experience shows the
generality of the trends we observe in the big cities. Data were collected from.
These data allow us to assess the strengths and weaknesses of Russian
industry vis-a-vis its foreign competitors and thus to gauge its development
prospects. Were Russian firms in a position to export manufactures? Could they
hold their own against imports from the West? The competitiveness of Russian
industry depended on the prices of inputs as well as on the efficiency of
production. We will compare the prices of labour, capital, and natural resource
products like energy, metals, and timber in Russia to the corresponding prices in
other countries. Could Russian industry have developed by exploiting either cheap
natural resources or cheap labour?
5
Integration of the Russian economy
We compare ‘Russia’ to other countries, but we do not have data from all
regions of Russia. Were wages and prices across Russia sufficiently uniform for
these comparisons to have general validity? Integrated markets would produce
uniformity if transport costs were sufficiently low. How integrated were Russian
markets in the nineteenth century?
This question has been investigated mostly completely for grain markets.
Kovelchenko, Metzer studied the impact of railways built in the second half of the
nineteenth century on the integration of grain markets. He concluded that railways
led to the creation of a national market and slashed price differences across
regions. By the end of our period, there were undoubtedly integrated national
markets for wheat and rye with uniform prices across the country. Earlier in the
nineteenth century, grain markets were less integrated.
Our concern, however, is with industrial and mineral products. For them,
integration may have come earlier since the ratio of transport cost to price was
lower. Thus, Kelly (1976) found that the prices of kerosene and heating oil
converged within Russia as the railway network expanded. We can make a modest
contribution to this discussion by comparing prices in Moscow with those in
Kursk. While this involves only two cities, they are about 500 kilometers apart
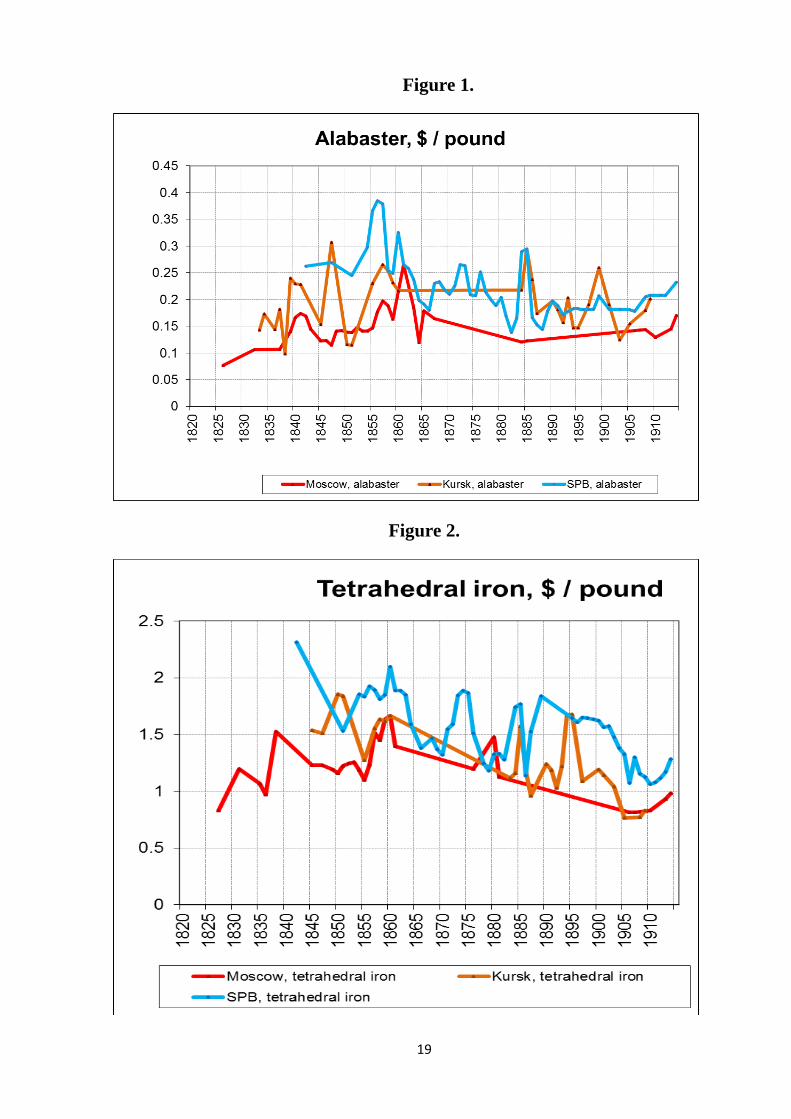
and spanned an important industrial region. Figures 1-3 plot prices of two kinds of
iron as well as alabaster in the two cities. The data are not continuous enough for
regression analysis but the data for the two cities overlap, thus exhibiting price
uniformity.
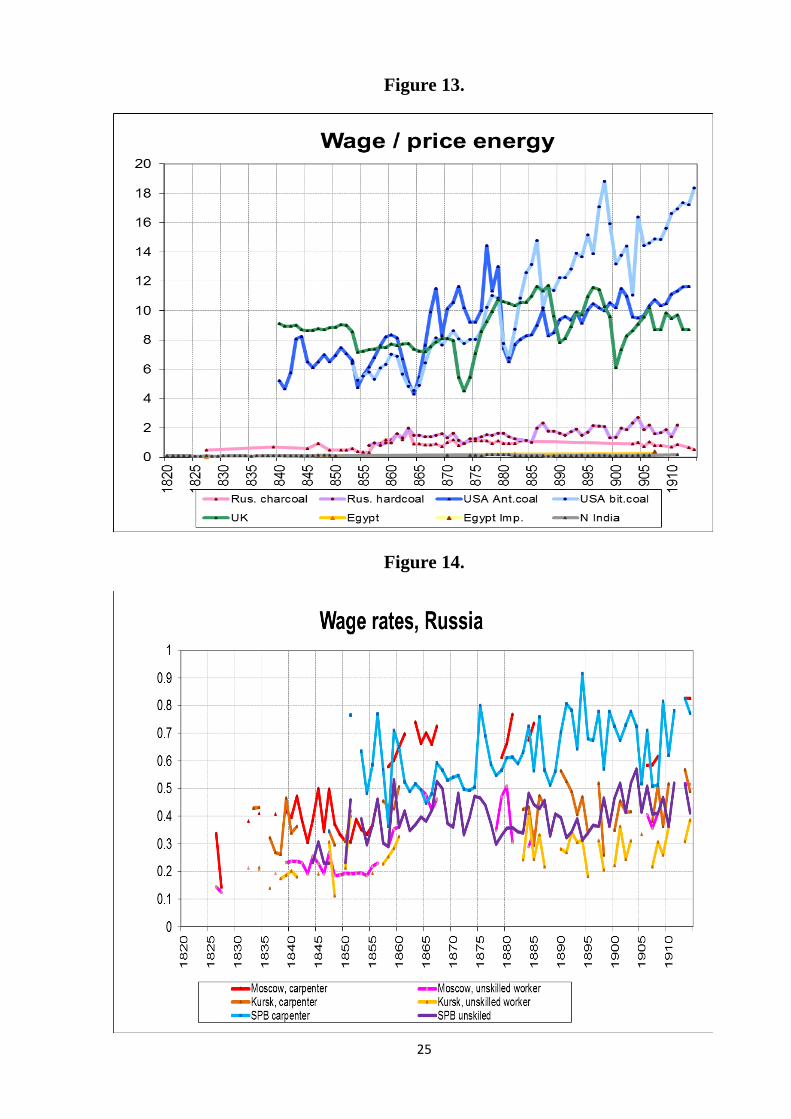
The labour market is equally important in our comparisons. Some studies of
labour market integration have already been made. Leonard, Granville, and
Borodkin (2008) found that the market for unskilled labour in Moscow was
integrated with agricultural labour markets in its vicinity. Our concern is more
with urban wages, however. Figure 14 show the wages of carpenters and building
labourers in Moscow, St. Petersburg, and Kursk. It is reassuring that wages were

6
similar in Moscow and St. Petersburg as they were major industrial centres.
Wages in Kursk followed a similar pattern but were somewhat lower. This is not
surprising as Kursk was a much smaller place. In our international comparisons,
we shall rely on Moscow and St. Petersburg wages as these cities were centers of
industry.
Russia in global perspective: Natural resources
Russians have frequently compared their country to the United States. Both
countries were large and richly endowed with natural resources. From the
seventeenth to the nineteenth centuries, they were both frontier economies where
settlement was pushed into more and more remote areas as transportation
improvements opened up regions for agriculture, mining, and forestry. Population
expanded rapidly to settle the frontier. Did these similarities in geography and
demography lead to similar development outcomes?
Historians have claimed wondrous consequences from the American
frontier. The first relates to the labour market and wages. H.J. Habakkuk argued
that the chance to homestead a farm on the frontier raised the wage of unskilled
labour in eastern cities and led to labour augmenting technical change. Most
people living in eastern cities came from Europe, however, and the marginal
migrant was British or Irish, so that the wage on the east coast of the United States
was determined in London and Manchester rather than in North Dakota (Allen
2014). In Russia, people left the central provinces of the country to settle on
southern steppes or east of the Urals, so wages were determined in the
overpopulated farming regions. The situation, in other words, looks more like that
of South America, where the Malthusian demography of the native population kept
wages low, than like North America (Allen, Murphy, Schneider).
The second relates to politics. Frederick Jackson Turner famously argued
that the frontier experience was the basis of American democracy. The Latin
American frontier did not have the same effect nor did the Russian frontier. It is
7
more likely that the Russian frontier led to serfdom than to freedom, as the state
attached farmers to the soil so they could be forced to pay rent and work for their
lords rather than slip away from their control into empty spaces (Domar). The
American South is a closer parallel to Russia than the American North.
The third relates to natural resources and industrialization. The USA did
have an abundance of natural resources once the transportation infrastructure was
in place that allowed their profitable exploitation. As Wright has shown, the
natural resource intensity of American manufactures was very high in the late
nineteenth and twentieth centuries. Whether resources really promoted American
manufacturing, however, is an open question. The problem was that the American
economy was closely integrated with the British, so the prices of most products
exported by the USA were very close to British prices. In cases like iron, where
the USA imposed a high tariff on imports, American prices were higher than
British prices. Russia was like America in having abundant natural resources. Did
it face the same obstacles in reaping rewards in industrial development?
The answer is yes since the same factors affected resource prices in Russia
as in the USA. The first was globalization. The steam ship slashed ocean freight
rates, and the railway lowered inland shipping costs. Figure 4 illustrates the impact
of cheaper ocean freights on the price of wheat in Odessa in Russia, Alexandria in
Egypt, Cawnpore in India as well as on the average British import price and the
USA export price. The British import price was the highest, and wheat was
exported from the other locations to satisfy the British demand for food. In the
early nineteenth century, the British price was several times the price in Russia,
India or Egypt. The difference indicates shipping costs. By the 1850s the
American and Russian prices had converged to each other. Along with the Indian
and Egyptian prices, they converged to the British price by the end of the
nineteenth century as technological progress in shipping reduced ocean transport
costs almost to zero. The biggest gainers were British consumers who saw the
price of their carbohydrate staple cut in half. Prices in Odessa, Alexandria, and
Cawnpore were moderately higher after 1900 than they had been in the 1840s, and
8
that rise gave impetus to settling the frontier. Prices on the frontier probably rose
even more as railways cut inland shipping costs. These patterns were repeated for
many other commodities.
A second feature of the nineteenth century that affected the link between
Russia’s resource ‘abundance,’ and the price of resource products was commercial
policy. Russia, like many countries, used tariffs and import bans to promote
industrial development. While globalization tended to equate prices across the
globe, tariffs had the opposite effect–they counteracted globalization and
reintroduced price differentials. The United States, for instance, used tariffs to
promote the expansion of its iron industry (an industry for which it had abundant
supplies of coal and ore). As a result, iron prices in the Untied States greatly
exceeded prices in other countries and were far higher than they would have been
in the absence of the tariff. Iron and steel fabricating industries like automobiles
reaped no reward from the abundant supplies of iron ore and metallurgical coal.
Did the Russian tariff have the same effect?
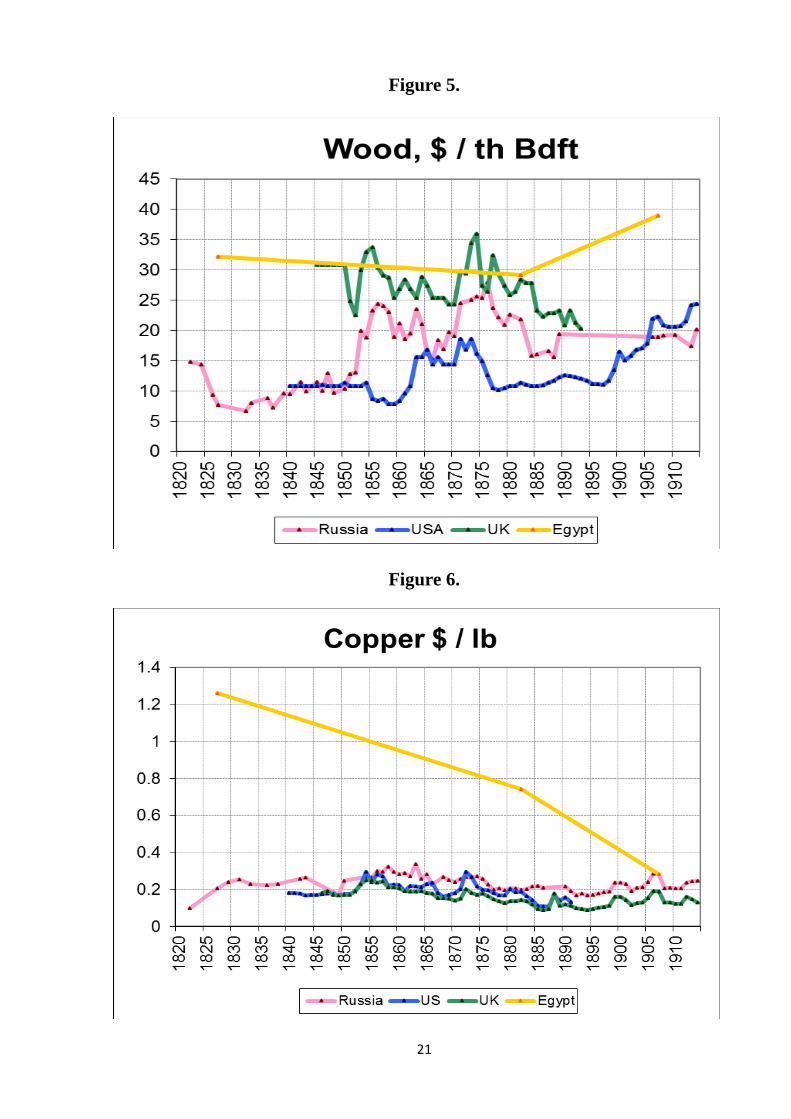
We study the prices of five commodities that are also building blocks in our
later comparisons. The only product for which Russia had low prices was lumber.
Figure 5 shows the price (in US dollars per thousand board-feet) of soft wood
construction lumber in Russia, the UK, USA, and Egypt. Russia and the USA both
had vast forests of pine, spruce, and fir, and those resources did translate into low
prices in industrial districts (Buffalo in the case of the USA and Riga in the case of
Russia). The UK and Egypt lack such resources and imported timber. The price
was similar in both countries and twice the price in Russia and the USA. The low
prices in the latter two countries benefitted wood fabricating industries and capital
investment generally by lowering the cost of erecting buildings.
Russia was not so fortunate with respect to other resource products. Copper
was more expensive in Russia than in the USA or Britain (Figure 6). The figure
shows Egyptian copper to have been much more expensive than elsewhere, but it
may be that the Egyptian price is for copper artifacts rather than ingots as in the
9
other countries. Copper was heavily protected in Russia, and that may explain its
high price.
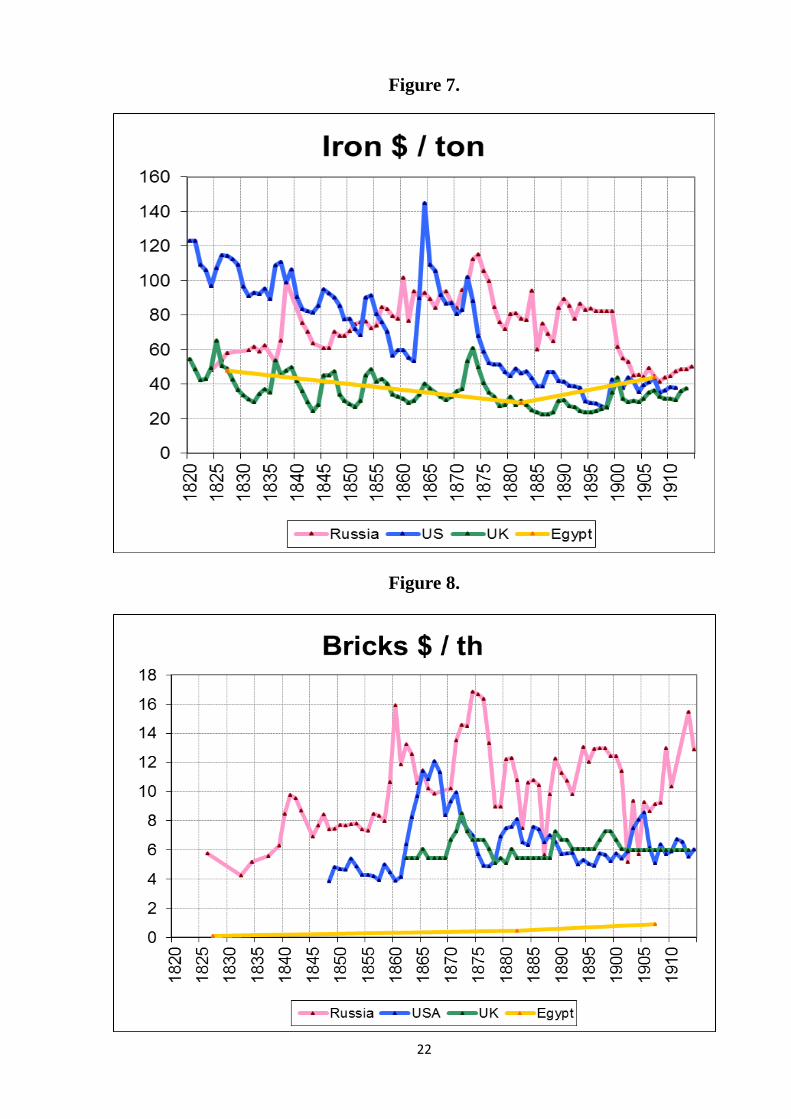
Iron provides an interesting parallel with the USA. Britain and Egypt had
the lowest prices. Britain was an exporter, and Egypt had only a nominal tariff, so
international trade equalized prices in the two countries. The USA imposed high
tariffs on iron and steel products, as did Russia, and prices in both countries were
twice British prices in the first half of the nineteenth century (Figure 7). American
prices began to decline in the late nineteenth century and converged to the British
level after 1900. Convergence was the result of conflicting trends. Productivity
growth and the exploitation of Mesabi ore and Connellsville coke cut US costs far
below British costs, but the US Steel merger meant that prices did not drop as
much as costs. Steel producers reaped the benefits of high productivity and cheap
resources by keeping prices at British levels (Allen 2014). Prices declined later
and more modestly in Russia than they had in the USA and remained substantially
above those in the UK and USA. High prices were only possible with high tariff
protection. While the iron and steel industry benefitted, the development of metal
using industries was held back.
Figure 8 shows the price of bricks in the USA, UK, Egypt, and Russia.
Bricks were not traded internationally, so one would expect the price to reflect
local conditions. Thus, prices were lowest in Egypt in view of the low wage, and
prices were higher and similar in the USA and UK since wages were higher.
Bricks were most expensive in Russia, and it is not immediately clear why since
wages were much lower than in the advanced countries of the West.
Energy was a fundamental input in most industrial processes. Human effort,
animal traction, and wind were of declining importance in the nineteenth century.
Energy in the form of heat was required for many metallurgical and other
processes. Motive power was derived from falling water and from burning fuels in
steam engines. Water power was important in the early industrialization of the
United States and Great Britain. It was also used in Russia. We cannot compare
the cost of water power in these countries. In all locations where water power was
10
availability, its supply was limited, and so its cost rose as the number of water
wheels and turbines was increased. Eventually, the cost matched the cost of power
from wood or coal. These were backstop technologies that supplied energy (in the
case of coal) at roughly constant cost over a broad range of output. We can
measure the cost of energy from wood or coal in many countries and, thus,
compare the long run supply price of energy from the backstop technology.
In the middle ages, wood, in the form of charcoal or firewood, was the
principal source of heat energy. Britain was the first country to engineer a shift
from wood to coal. This transition, which took place between the sixteenth and the
eighteenth centuries, required inventing a host of new technologies ranging from a
new style house to reverberatory furnaces. This new technology was necessary
since the sulphur in most coal required new designs for its isolation and
elimination. The shift from wood to coal was governed by the relative prices of
energy of the two fuels. In Britain, once the price of energy from wood fuel rose to
twice the level of the price from coal, it became profitable to invent new
technologies that used coal. The shift from wood to coal in the United States did
not require such a large price differential since British technology could be used,
thus avoiding the costs of R&D, and since the coal found on the east coast of the
USA was anthracite, which was a cleaner fuel than the bituminous coal that was
generally available. In Philadelphia, it was not until the 1830s, soon after the
opening of the Schulkyll canal that connected the coal fields to the city, that the
price of energy from coal dropped below the price from wood. In Boston the
transition only occurred in the 1870s. The corresponding transition occurred at
about the same time in Russia. We can follow the prices of charcoal and
bituminous coal in Kursk over the nineteenth century, and we know that the price
of coal, at any rate, was the same at Kursk as in major cities. Early in the century,
charcoal was the cheaper source of energy. From 1840 to 1875 the two fuels were
equally expensive, and from then on burning coal was the least expensive.
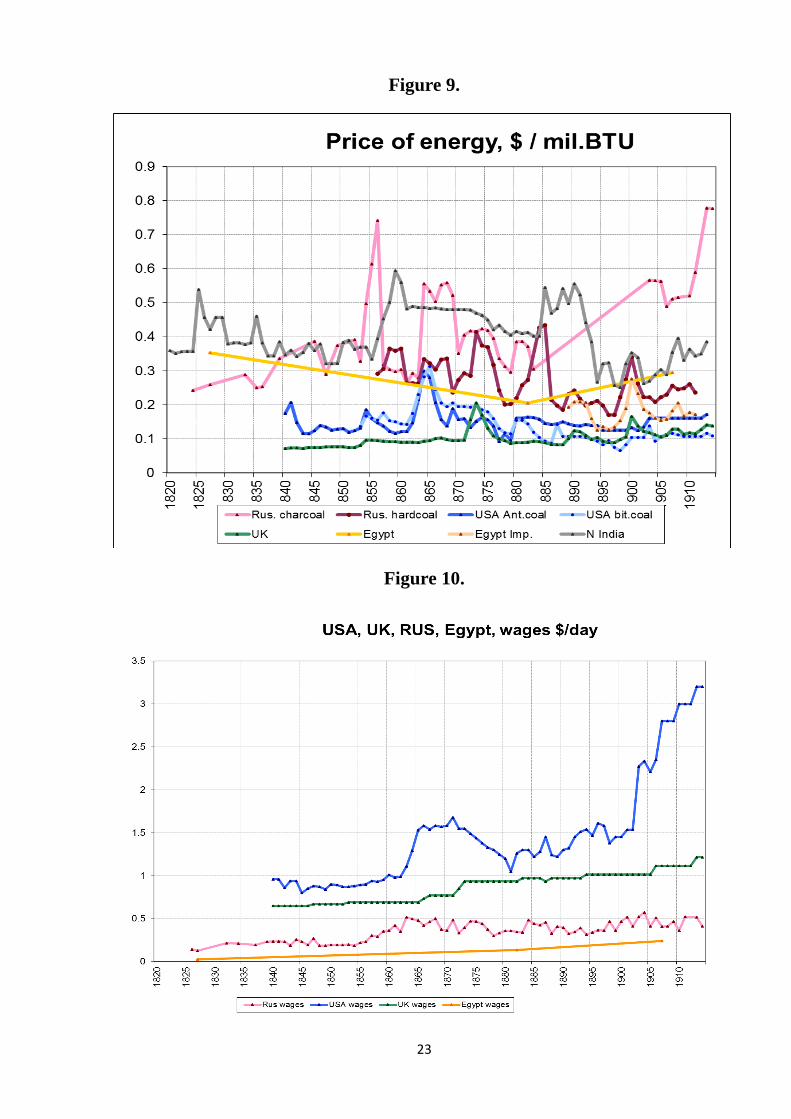
While the transition from charcoal to coal cut energy costs in Russia, the
country was remarkable for the high cost of energy throughout the nineteenth
11
century. Figure 9 compares energy prices across countries. The UK had the
cheapest energy until the late nineteenth century. Anthracite coal on the east coast
of the US was significantly more expensive. The development of cheap
bituminous coal in the USA produced very similar energy prices in the 1890s.
Throughout this period, energy was much more expensive elsewhere. In the late
nineteenth century, coal in Alexandria, which was largely imported from Britain,
was double the British price. Charcoal in Cairo, whose price is not shown, was
even more expensive since it was brought by camel from the Sinai. Energy from
wood in India was twice the cost of energy from coal in Alexandria. What is most
striking is that energy in Russia, initially from charcoal and later from coal, was as
expensive as energy from wood in India. The competitive position of Russian
industry in general was shackled by the high cost of energy.
This survey of natural resource product prices has shown that the only
commodity that was cheaper in Russia than in other places was timber. Everything
else was at least as expensive in Russia. Why was this so? One reason was policy.
In order to promote the growth of coal mining and metal smelting, the Russian
government either prohibited imports altogether or subjected them to very high
tariffs. The protected industries benefitted but the industries that processed their
products suffered.
Underlying this policy stance, however, was a more fundamental problem.
As the industrial revolution unfolded in Britain, her comparative advantage in
manufacturing continuously increased. By the same token, the comparative
advantage of other countries shifted to agriculture. The new technology of the
Industrial Revolution was tailored to Britain’s high wage economy and so was not
readily transferable to low wage competitors. In the case of India, for instance, the
result was the conversion of the country from one of the world’s largest
manufacturing nations to a so-called underdeveloped country that specialized in
agriculture and imported its manufactured goods. This was not the traditional
economic structure of India, but the result of the labour saving bias of the new
British technology and the drop in world shipping costs that integrated markets and
12
gave the principle of comparative advantage a central role in determining
economic structure. The USA avoided this fate since it was always a high wage
country, so British technology always paid there–once the tariff allowed industry
to exist at all. Russia had lower wages than the USA and so advanced technology
was less appropriate to its circumstances. The scope for profitably adopting capital
intensive technology, however, was broader than in India or Egypt since the
peculiar Russian agrarian institutions produced higher wages in the industrial
sector. Serfdom and the repartitional commune meant that Russia was a semi-
peripheral rather than a peripheral player in the global system.
Russia in global perspective: wages
Cheap natural resources did not provide Russia with a competitive advantage
in industrial development. Perhaps, as a poor country, Russia could advance on
the basis of low wage labour? The study of the labour market is also important for
the light it throws on living standards during the nineteenth century. Maddison’s
per capital GDP estimates are usually used for this purpose, but they are unreliable
indicators of incomes two hundred years ago since they are backward
extrapolations of 1990 aggregates expressed in 1990 prices. When nineteenth GDP
comparisons are made using nineteenth century prices, country rankings change
dramatically (Prados). Also GDP per head ignores distributional issues. Both
problems can be avoided using real wages.
Figure 10 shows the history of the nominal wage of labourers across the
nineteenth century. The wages of skilled craftsmen tell a similar story, for skill
differentials were similar in all of these countries. Philadelphia had the highest
wages throughout the century, followed closely by Lancashire. Other leading
cities in these countries had similar wage levels. India had the lowest wages, and
Egyptian wages were not much higher. Wages in Moscow and St. Petersburg were
higher than in Egypt and India but still considerably below wages in the West. Low
13
wages would seem to have given Russian firms a competitive advantage, unless, of
course, the low wage simply indicated poor quality workers.
How did Russian wages translate into living standards? To find out we must
compare them to the cost of living. Price indices can be tailored to the
circumstances of particular countries, but in this case we use a broadly comparable
index for all five countries to produce as much consistency in the results as
possible. Our consumer price index is based on the basket of goods shown in
Table 1. It is intended to supply 2100 kcals per person per day, which equals the
US Department of Agriculture food security line and exceeds FAO food security
lines. 2100 is an average across the population and so is consistent with adult
males receiving3600 calories, which they need to work, while young children, who
need less, receive less. The budget contains modest quantities of non-food items as
well as a 5% allowance for rent. The budget is intended to be a minimal standard
of living.
Russia in global perspective: capital
Capital is the third factor of production that we consider. To gauge capital
using costs, we compare the rental price of capital across countries and over time.
The rental price is the original acquisition cost of a standardized piece of capital
multiplied by the sum of the interest rate and the depreciation rate. Our
calculations use interest rates on government debt, although these probably
understate the opportunity cost of business capital. We set depreciation at 5%,
which is perhaps too high but compensates for the understatement of interest rates.
Since we do not have the acquisition cost of a standard piece of capital for all of
these countries, we compute a proxy for it. Our proxy is the geometric average of
a building labourer’s wage rate and a simple average of the prices of construction
lumber, bricks, bar iron, and copper. The wage rate and the prices of the four
materials are all converted to US dollars and standardized by dividing all values by
the average wage and prices prevailing in the USA in the 1850s.
14
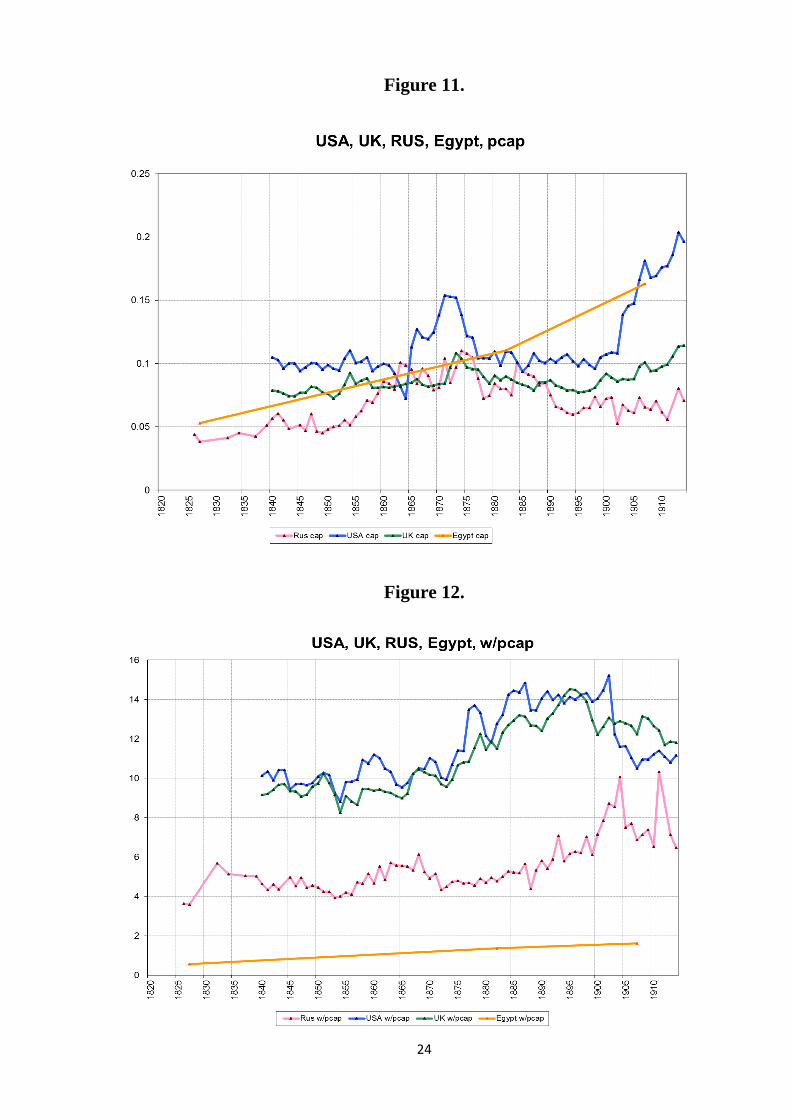
Figure 11 shows the price of capital services across countries and over time.
What is most surprising about the figure is how similar the values are. Poor
countries did not have a high user cost of capital. There was very little difference
between Russia and Britain, for instance, in this regard. The reason is clear from
the details of the calculation. On the one hand, Russia had higher iron, copper, and
brick prices than Britain (only timber was cheaper in Russia), so that average price
of materials was higher in Russia. On the other hand, building wage rates were
lower in Russia. Taking the geometric average of these components produced
rough equality in the two countries. With similar interest rates, the price of capital
services was similar.
Relative factor prices and the incentives to mechanize production
Factor prices have an important bearing on the evolution of industrial
technology by leading firms to chose one technique of production over another.
Economic growth requires a continuous rise in output per worker, and that is
effected by firms’ using more capital and energy per worker. Their choice of
technique in this regard is determined by the wage rate relative to the price of
capital services and relative to energy. How did the incentives faced by Russian
firms compare to those in the rich countries and the poor countries during the
nineteenth century?
Figure 12 shows the wage rate relative to the price of capital services.
Russia occupied an intermediate position between Egypt, on the one hand, and
Britain and the USA, on the other. We do not have complete data for India, but
conditions there were similar to those in Egypt.
Figure 12 implies that Russian industry should have been more capital
intensive than Egyptian or Indian industry but less capital intensive than USA or
British industry. This subject warrants much more research, but the available
evidence points in this direction. In the nineteenth century, most cotton was woven
by hand in India and Egypt. In contrast, the power loom was extensively
15
employed in Russia. Fully automatic looms like those coming into use in the USA
in the late nineteenth century were not used in Russia, however. In this important
industry, Russian occupied the intermediate position in capital intensity that Figure
12 would imply.
While Russian firms had stronger incentives to use machinery than their
counterparts in Egypt or India, the same cannot be said for energy intensity.
Figure 13 shows the wage rate relative to the price of energy in the five countries.
Egypt and India had the lowest wage rates relative to energy prices, and the USA
and Britain had the highest. The Russian ratio was slightly higher than that in
Egypt and India but very much lower than the ratio in the USA or Britain.
Russia’s relatively high wage (compared to India and Egypt) was offset by the very
high prices of charcoal and coal in Russian cities. These high prices reduced the
incentive of Russian firms to use steam technology and raised costs considerably in
energy intensive industries like iron and steel production.
The labour market and Russian serfdom
Our investigations have shown that wages in Russia were at an intermediate
position on the global ladder–below wages in the USA and Britain but above those
in India and Egypt. These wages are for urban workers, and they had important
implications for the choice of technique in industrial production. How can we
explain this intermediate position? It is puzzling given the high fertility
demographic regime that prevailed in Russia. The population was growing
rapidly, crude birthrates were on the order of 50 per thousand, and the total fertility
rate was in excess of seven children per woman. These values indicate the absence
of much fertility restraint and a demographic system like that of the Indian
subcontinent. Why were real wages not equally depressed?
Russian cities grew by attracting labour from the countryside. The terms on which
the countryside released labour to the cities determined urban wages. Russia had
unusual rural institutions–serfdom was widespread until the 1860s and
16
subsequently much of the rural sector was organized as repartitional communes. A
long standing puzzle in Russian history is how, and to what degree, these
institutions affected economic growth. Until recently, the standard view, among
non-Marxists at least, was that serfdom and the mir insulated peasants from the
market and preserved traditional, if inefficient, practices. Lenin and some later
Soviet scholars disputed this, arguing that capitalism was subverting the peasant
commune. This critique has gained currency from recent scholars who have shown
that Russian peasants throughout the nineteenth century were engaged in a variety
of market transactions. However, a panoply of laws constrained this behaviour, so
the possibility that the mir and serfdom influenced the course of Russian
development remains a possibility to be analyzed.
Conclusion
In this paper, we have highlighted the importance of four factors that governed the
evolution of the Russian economy in the nineteenth century–geography,
demography, rural institutions, and state poverty.
Geography includes the vast size of the country, the mineral and forestry
resources, and the huge amounts of agricultural land that were in use and unused
but capable of development.
Demography refers to the small size of the population in 1800 in comparison
to the country’s agricultural land. The high land-labour ratio meant that Russia’s
comparative advantage lay in agriculture. Demography also refers to the positive
check Malthusian regime that generated high fertility and population growth even
with very low incomes. This demographic regime meant that Russia would be a
low wage country. In this respect, Russia was like India and Egypt.
State policy includes the creation of a railway network that continuously
expanded the area that could be profitably cultivated. As a result the population
could continue to grow. The continuous expansion of agricultural exports meant
17
that the exchange would not fall enough to make manufacturing profitable: the
extensive farmland, in other words, meant that Russia’s comparative advantage lay
in agriculture. Again, Egypt and India were similarly placed.
A second policy response was high tariffs to encourage manufacturing, and
they raised the prices of most resource products and manufactured goods
substantially above world levels. The production of iron may been encouraged, but
firms that fabricated iron were disadvantaged. Egypt tried even more draconian
investment policies in the early nineteenth century under the rule of Mohammed
Ali, but these policies were eliminated by the imperialist powers. Imperialism also
prevented India from using tariffs to promote industry. Egypt and India lacked the
industrial development realized in Russia.
Russia’s peculiar agrarian institutions also played a role in shaping that
development. Serfdom was rooted in geography since the nobility could collect
rents from the peasants only if they were prevented from relocating to vacant land
out of reach of the lords. Serfdom and the reparatitional commune that generally
replaced it reduced the supply of labour to industry. As a result, urban real wages
were considerably higher than wages in India and Egypt. Further effects included
the expansion of handicraft production in the villages, and, at the same time,
incentives to make industry more capital intensive and thus more ‘advanced’.
Economic dualism was pronounced in Russia due to rural institutions that were
responses to the country’s geography, an enduring determinant of Russian history.

18
Table 1.
Subsistence Basket
Flour kg 195
Beans/peas kg 20
Meat kg 5
Butter kg 3
Soap kg 1.3
Cloth metres 3
Candles kg 1.3
Lamp litres 1.3
Fuel Mill BTU 2
Calories/day 2103
19
Figure 1.
Figure 2.

20
Figure 3.
Figure 4.
The price of wheat around the world
21
Figure 5.
Figure 6.
22
Figure 7.
Figure 8.
23
Figure 9.
Figure 10.
24
Figure 11.
Figure 12.
25
Figure 13.
Figure 14.
26
References
Brenner, Robert (1977). “The Origins of Capitalist Underdevelopment: A Critique
of Neo-Smithian Marxism,” New Left Review, I/104, July-August.
Borodkin, Leonid, Granville, Brigitte, and Leonard, Carol Scott (2008). “The
rural/urban wage gap in the industrialisation of Russia, 1884–1910,” European
Review of Economic History, Vol.12, pp. 67–95.
Barry K. Goodwin and Thomas J. Grennes (1998). “ Tsarist Russia and the World
Wheat Market,” Explorations in Economic History, Vol. 35, pp. 405–430.
Kelley, William J. (1976). “Railroad Development and Market Integration in
Tsarist Russia: Evidence on Oil Products and Grain,” The Journal of Economic
History, Vol. 36, pp. 908-916 .
Metzer, Jacob (1974), “Railroad Development and Market Integration: The Case of
Tsarist Russia,” The Journal of Economic History, Vol. 34, pp. 529-550.
Prados, Leandro