backgrounder - cloud object storage | store &...
TRANSCRIPT

BACKGROUNDER
Key Points
Medicare’s Rising Costs—and the Urgent Need for ReformRobert E. Moffit, PhD, and Alyene Senger
No. 2779 | March 22, 2013
■■ Medicare’s rising costs are unsustainable and have put the program’s future in jeopardy. The Hospital Insurance Trust Fund is projected to be insolvent by 2024, and Medicare has a total long-term unfunded benefit obligation of $37 trillion. ■■ The program’s fee-for-service payment structure, in which doc-tors and hospitals receive a fixed payment for each service, encour-ages an increase in the volume of services, which results in excessive spending. The current payment system also does not ensure qual-ity, which also generates additional and unnecessary medical costs.■■ The PPACA doubles down on Medicare’s existing flawed pay-ment and pricing policies. ■■ In order to avoid steep tax increas-es, increasingly painful Medicare benefit cuts, or both, traditional Medicare must undergo major structural reform. Congress and the Administration should under-take short-term reforms that will contain costs, while transitioning to a more effective program based on competition that will drive inno-vation, control costs, and provide high-quality health care to a rap-idly growing Medicare population.
Abstract The quickly rising costs of Medicare are a burden on all Americans. The traditional program’s fee-for-service payment system, in which doctors and hospitals receive a fixed payment for each procedure and service, encourages an increase in the volume of services requested, which encourages excessive spending. The system also does not ensure quality, which contributes to unnecessary costs and higher spending as well. Medicare is a huge entitlement program, and its reform must be undertaken carefully. Congress and the Administration should undertake short-term reforms of traditional Medicare that will contain costs, while transitioning, prudently but quickly, to a more effective system that will not only control costs over the long term, but will also provide high-quality health care to a rapidly growing Medicare population.
The rising cost of Medicare is placing an increasing burden on current and future taxpayers, as well as exacerbating the poor financial condition of
a program on which america’s seniors depend in their retirement. The tradi-tional program’s fee-for-service payment system, in which doctors and hos-pitals are paid a fixed price for each and every procedure or service that they perform, encourages an increase in the volume of services provided, which drives excessive spending. The system also does not ensure that quality care is delivered, which contributes to unnecessary costs and higher spending as well. Today, roughly three of four Medicare patients are enrolled in the tra-ditional Medicare program.1
Price Controls. Traditional Medicare relies on conventional methods of “cost control”—ratcheting down reimbursements for doctors and hospitals and tightening the program’s price controls on payments for their services.
This paper, in its entirety, can be found at http://report.heritage.org/bg2779Produced by the Center for Health Policy StudiesThe Heritage Foundation214 Massachusetts Avenue, NEWashington, DC 20002(202) 546-4400 | heritage.org
Nothing written here is to be construed as necessarily reflecting the views of The Heritage Foundation or as an attempt to aid or hinder the passage of any bill before Congress.

2
BACKGROUNDER | NO. 2779March 22, 2013
But these methods do not, in fact, control program costs. They mostly shift those costs to seniors in the form of reduced access to care, while also shifting the costs of Medicare’s below-market payment rates to younger working americans who make up for these Medicare provider losses through higher pre-miums in their own private health insurance.
Huge Future Costs. The misnamed Patient Protection and affordable care act (PPaca) large-ly doubles down on this conventional “cost control” strategy. But even with the act’s projected Medicare payment reductions, the program will continue to drive higher spending, and thus directly contribute to the nation’s fiscal crisis. Given both the sheer size of Medicare spending and the future projections, congress cannot even begin to address america’s crushing debt without slowing its growth. right now, much of Medicare debt is not included in conven-tional debt projections on the nation’s books, and is instead counted as the program’s long-term unfund-ed liability, the cost of benefits that are not financed by dedicated revenues. That liability is much greater than the formal estimate of the national debt, and amounts to $37 trillion.2 Taxpayers are expected to pick up that enormous tab.
Political rhetoric aside, there is simply no plau-sible way that the Obama administration and its allies in congress can or will be able to maintain Medicare “as we know it.” The President’s health care law has already amended the Medicare stat-ute copiously, and set in motion massive payment cuts and new rules governing doctors, hospitals, insurance plans, and other providers. But these big Medicare payment cuts are illusory as a guide to the future of Medicare, for neither the Medicare Trustees nor the Medicare Office of the actuary has affirmed that payment reductions of such a mag-nitude will be sustainable, especially since they will reduce access to care for millions of seniors.3
Medicare spending, then, will be much higher than the projections based on current law.
A Better Policy. To solve Medicare’s cost problem, congress and the administration should embark on both short-term and long-term reforms. In the near term, congress and the President should: enact a modest and temporary Part a premium to cover the cash deficits in the Federal hospital Insurance (hI) Trust Fund; gradually raise beneficiaries’ Part B and D premiums by 10 percent over the next five years; expand “means testing” provisions of current law; require an estimated 9 percent of the Medicare population to pay a larger share of their Medicare costs; and add a 10 percent copayment to Medicare home health care—which currently has no co-pay-ment at all, despite its rapid growth.
For the long term, congress and the President should adopt a defined-contribution (“premium support”) system of financing. Modeled after the best features of Medicare Part D and the Federal Employees health Benefits Program (FEhBP), such a model would inject intense competition into the program that would align incentives of beneficia-ries and patients and plans and providers, root out costly inefficiencies and waste, and slow the growth in Medicare spending—which would benefit both enrollees and the taxpayers.
Today’s and Tomorrow’s Financial Imbalance
Medicare, already accounting for about 15 per-cent of federal spending, is the fastest-growing program in the federal budget. In 2012, Medicare’s aggregate spending reached $557 billion, and it is expected to nearly double in just 10 years, reaching over a trillion dollars by 2023.4 Medicare spending accounted for 3.67 percent of the entire economy, measured as gross domestic product (GDP), in 2011. It will be an estimated 5.8 percent of GDP in 2030,
1. Slightly more than one-quarter of all Medicare patients are enrolled in Medicare Part C, known as Medicare Advantage.
2. The alternative scenario, based on more realistic assumptions. Suzanne Codespote, “Medicare Unfunded Obligations for 2012 Trustees Report,” Centers for Medicare and Medicaid Services, Office of the Actuary, letter to the Senate Budget Committee, April 23, 2012.
3. Centers for Medicare and Medicaid Services, 2012 Annual Report of the Boards of Trustees of the Federal Hospital Insurance and Federal Supplemental Medical Insurance Trust Funds, April 23, 2012, p. 21. http://www.cms.gov/Research-Statistics-Data-and-Systems/Statistics-Trends-and-Reports/ReportsTrustFunds/Downloads/TR2012.pdf (accessed March 14, 2013), and Richard S. Foster, Chief Actuary, “Estimated Financial Effects of the ‘Patient Protection and Affordable Care Act,’ as Amended,” April 22, 2010, p. 10, http://www.cms.gov/Research-Statistics-Data-and-Systems/Research/ActuarialStudies/Downloads/PPACA_2010-04-22.pdf (accessed March 14, 2013).
4. Congressional Budget Office, “Medicare–February 2013 Baseline,” February 5, 2013, http://www.cbo.gov/publication/43894 (accessed March 14, 2013).

3
BACKGROUNDER | NO. 2779March 22, 2013
5. Congressional Budget Office, The 2012 Long-Term Budget Outlook, June 2012, p. 58, http://www.cbo.gov/sites/default/files/cbofiles/attachments/06-05-Long-Term_Budget_Outlook_2.pdf (accessed March 14, 2013), and Centers for Medicare and Medicaid Services, Office of the Actuary, “Projected Medicare Expenditures Under Illustrative Scenarios with Alternative Payment Updates to Medicare Providers,” May 18, 2012, p. 19, http://www.cms.gov/research-statistics-data-and-systems/statistics-trends-and-reports/reportstrustfunds/downloads/2012tralternativescenario.pdf (accessed March 14, 2013).
6. Centers for Medicare and Medicaid Services, 2012 Annual Report of the Boards of Trustees of the Federal Hospital Insurance and Federal Supplemental Medical Insurance Trust Funds, p. 28.
7. Taxable payroll is, as defined by the Medicare trustees, “[a] weighted average of taxable wages and taxable self-employment income. When multiplied by the combined employee employer tax rate, it yields the total amount of taxes incurred by employees, employers, and the self-employed for work during the period.”
according to the Medicare actuary’s full alternative scenario, which uses the most realistic assumptions. By 2080, under the same assumptions, Medicare spending will account for 9.97 percent of the entire economy.5
Short-Term Financial Inadequacy. Medicare’s financial health is often measured by the balance of the hI trust fund, which is funded by the Medicare payroll tax and pays for Medicare Part a benefits. Many americans, fixated by media reports focused on the precarious solvency of the hI trust fund, should not be misled. Medicare’s financial prob-lems go far beyond the periodic threats of trust fund insolvency in just one part of the program.
Nonetheless, the balance of the hI trust fund is a telling “marker” of Medicare’s financial health. On that measure, the hI trust fund has not met the trustees’ formal test of short-range financial ade-quacy since 2003. Indeed, the Medicare hospitaliza-tion trust fund has been threatened with insolvency repeatedly since the inception of the program, but the gravity of the problem has steadily increased. In 1995, outlays for the trust fund exceeded receipts for the first time in 25 years. Since 2008, the trust fund has been running cash deficits and is projected to be exhausted by 2024.
The hI trust fund, unlike Medicare Part B that pays for physicians’ services, does not have an auto-matic draw on the federal Treasury to cover short-falls. (Part B, in other words, never faces “insolven-cy”; it simply takes a progressively larger share of americans’ income through rising income taxes and business taxes.) To the extent that hI funds are not available, Part a benefits cannot be financed. as the Medicare trustees explain: “If assets were exhaust-ed, Medicare could pay health plans and providers only to the extent allowed by ongoing tax revenues—and these revenues would be inadequate to fully cover costs. Beneficiary access to health care servic-es would rapidly be curtailed.”6
Today, hI spending alone amounts to 3.8 percent of america’s taxable payroll.7 Under the Medicare actuary’s alternative scenario, Part a “costs would
0%
2%
4%
6%
8%
10%
12%
14%
2011 2015 2020 2030 20402025 2035 2045 2050
Medicare
All Other Non-Interest Spending
Social Security
Medicaid, Obamacare Subsidies
CHART 1
Source: Congressional Budget O�ce, “2011 Long-Term Budget Outlook,” http://www.cbo.gov/sites/default/files/cbofiles/attachments/ 06-21-Long-Term_Budget_Outlook.pdf (accessed March 15, 2013).
Entitlement spending is the main cause of long-term runaway federal deficits. Medicare is the fastest- growing program due to retiring baby boomers and rising health care costs.
PERCENTAGE OF GDP
Medicare Spending: Fastest-Growing Part of Federal Budget
heritage.orgB 2779

4
BACKGROUNDER | NO. 2779March 22, 2013
8. Centers for Medicare and Medicaid Services, “Projected Medicare Expenditures,” p. 15.
9. The PPACA raises the HI payroll tax from 2.9 percent to 3.8 percent on individuals earning $200,000 and above annually and couples earning $250,000 and above.
10. Said the President: “The U.S. government is not going to be able to afford Medicare and Medicaid on its current trajectory…. The notion that somehow we can just keep on doing what we’re doing, and that’s OK, that’s just not true.” See “Obama’s Reputation on Medicare Is Unsustainable,” The Washington Examiner, April 14, 2011, http:/washingtonexaminer.com/article/112902 (accessed March 15, 2013).
11. Codespote, “Medicare Unfunded Obligations for 2012 Trustees Report.”
12. Centers for Medicare and Medicaid Services, 2012 Annual Report of the Boards of Trustees of the Federal Hospital Insurance and Federal Supplemental Medical Insurance Trust Funds, p. 43.
continue increasing as a percentage of taxable pay-roll throughout the long-range period, reaching 9.9 percent in 2085.”8
Without serious structural reform, there are two broad options for congress and the administration to prevent the hI program from spending more than it takes in: (1) increase the payroll tax even more, which the Obama administration has already done to some extent through enactment of the PPaca9 or (2) cut tens of billions of dollars for seniors’ Part a benefits and services, which the Obama administration has also already initiated through enactment of the PPaca. Neither of these options, merely variations on the status quo, is sound public policy. Moreover, President Obama himself, more than one year after the enactment of the PPaca, implicitly acknowledged that the new law is an insufficient remedy to save the Medicare program for future generations.10
Long-term Financial Inadequacy. as noted, the Medicare Office of the actuary estimates that, under the most realistic scenario, Medicare has an unfunded obligation of $37 trillion over the next 75 years.11 Simply put, Washington has promised $37 trillion worth of benefits to future seniors, but that money is not currently available and would have to be raised to pay for those promised benefits.
The sheer size of Medicare’s unfunded obliga-tion illustrates the massive financial burden facing ordinary working americans, particularly younger working families who are struggling to pay their mortgages, educate their children, fund their own health insurance, and pay the current level of feder-al, state, and local taxes. again, without comprehen-sive Medicare reform, taxes will have to increase, benefits will have to decrease, or some combination of the two—until $37 trillion in revenues or savings has been accumulated to bring Medicare into long-term financial balance. Given the large amount of
press ink that is being spilled on the ongoing debate over how to cope with the existing national debt of over $16 trillion and growing—an amount slight-ly larger than the entire american economy—the enormity of Medicare’s unfunded liability is thrown into sharp and stunning relief.
along with Part a spending projected to account for nearly 10 percent of all taxable payroll by 2085, spending for Parts B and D is also expected to increase, consuming a larger share of general rev-enue. The trustees project:
Should such taxes in the future maintain their historical average level of the last 50 years rela-tive to the national economy, then, based on the intermediate projections, SMI [Parts B and D] general revenue financing in 2086 would repre-sent about 26 percent of total income taxes under current law and substantially more than that if congress were to modify the physician payment system and the productivity adjustments to non-physician price updates.12
as a matter of law, congress recognizes that the continual draw down of general taxpayer rev-enues to cover Medicare’s growing expenses is a fis-cal danger signal and enacted a Medicare funding
“warning.” In the Medicare Modernization act of 2003, congress specified that if general revenues account for 45 percent of total Medicare funding, the Medicare trustees are to issue an official warn-ing to that effect, and the President must submit remedial legislation to address the problem within 15 days of his budget submission to congress. For its part, congress is legally required to consider this remedial legislation expeditiously. Over the period 2007 to 2011, the Medicare trustees have issued these official warnings but, as the trustees themselves have reported, “elected officials have
5
BACKGROUNDER | NO. 2779March 22, 2013
not enacted legislation responding to these fund-ing warnings.”13
Factors that Drive Up Medicare CostsSince the enactment of Medicare in 1965, govern-
ment actuaries have historically underestimated the true cost of Medicare. Outside of calculating on the basis of hard data, such as the age of those eligible or the size of enrollment, forecasting in Medicare (and health care in general) is inherently difficult. Projections can be wide off the mark because of the complex interplay of various mostly unpredictable factors, such as the impact of new medical tech-nologies, the behavioral response of beneficiaries to benefit additions or payment changes, the level of participation or non-participation among Medicare doctors and hospitals, and the political willing-ness of congress to take difficult steps to restrain Medicare spending. While predictability is difficult, there are a set of cost drivers that will inexorably raise Medicare costs and federal spending.
Demographics. The tidal wave of baby boom-ers is already crashing into the program, ratchet-ing up the heavy pressure that is now driving higher Medicare spending. There are roughly 77 million baby boomers—who will be eligible for Medicare at the rate of 10,000 per day over the next 19 years.14 Enrollment will grow, from 50.7 million beneficia-ries in 2012 to over 81 million beneficiaries in 2030.15
Over the next 25 years, it is the aging popula-tion that will propel most of Medicare’s increased spending. Under the most realistic scenario, the congressional Budget Office estimates that the
aging population is responsible for 52 percent of Medicare’s rapid spending increase.16
This demographic pressure alone, therefore, will impose much heavier costs on taxpayers. These costs are also aggravated by the demographic shift of the country—the rapid aging of the population and the relative decline in the number of younger workers supporting Medicare beneficiaries. In 1966, there were 4.5 workers per beneficiary. In 2012, the number had declined to 3.3 workers, and the ratio is expected to decline further to 2.3 workers per ben-eficiary by 2030.17 Meanwhile, not only the sheer size but the greater longevity of the american senior population will increase significantly.18 Whatever else happens with the Medicare program, increased aging and greater longevity guarantee higher tax-payer costs.
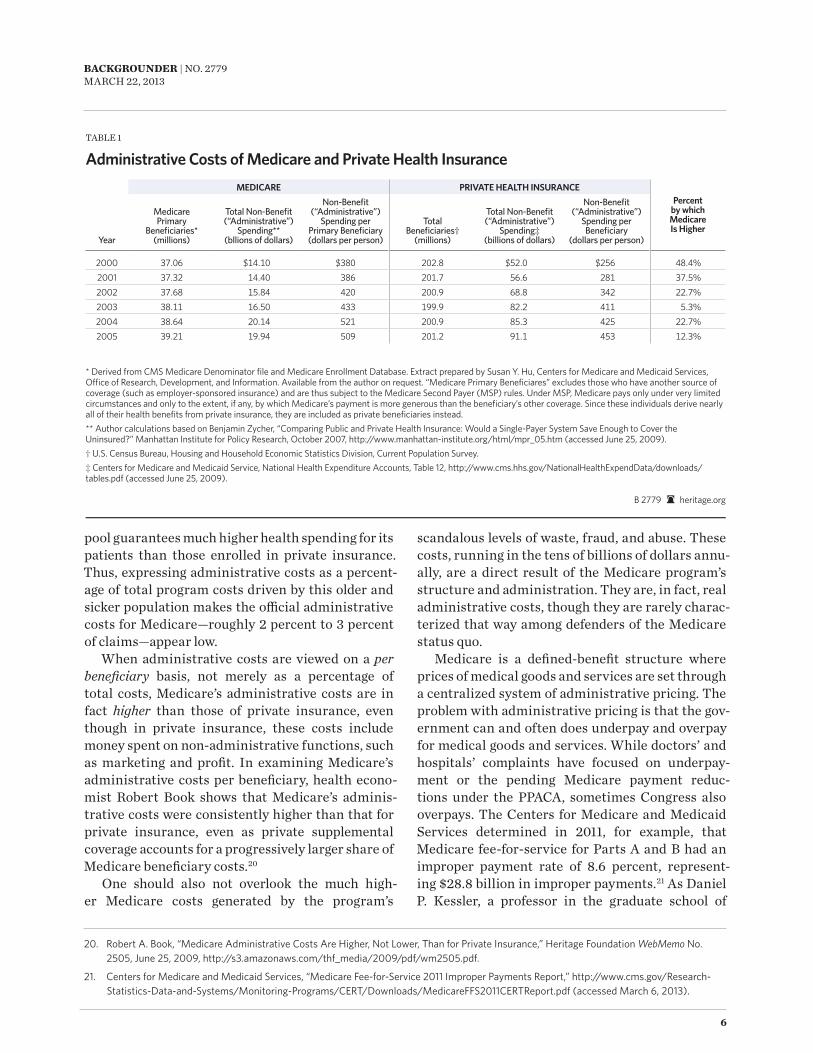
True Administrative Costs. It is conventional-ly assumed that Medicare is more efficient than pri-vate insurance because it has lower administrative costs.19 at first glance, it would certainly appear that way, when comparing benefit and administrative payments. But, upon closer examination, this claim is misleading, and the public-private comparisons made on its behalf are often inappropriate.
Medicare patients comprise not only an aged insurance pool, they are also far more likely to be suffering from chronic medical conditions and are more physically disabled than the general work-ing population that is covered by private insurance. Moreover, Medicare is the primary coverage for a special class of patients suffering from end-stage renal disease. altogether, the profile of the Medicare
13. Ibid., p. 211.
14. D’Vera Cohn and Paul Taylor, “Baby Boomers Approach 65—Glumly,” Pew Research Social and Demographic Trends, December 20, 2010, http://www.pewsocialtrends.org/2010/12/20/baby-boomers-approach-65-glumly/ (accessed March 15, 2013).
15. Centers for Medicare and Medicaid Services, 2012 Annual Report of the Boards of Trustees of the Federal Hospital Insurance and Federal Supplemental Medical Insurance Trust Funds, p. 209.
16. Congressional Budget Office, The 2012,Long-Term Budget Outlook, June 2012, p. 14.
17. Centers for Medicare and Medicaid Services, 2012 Annual Report of the Boards of Trustees of the Federal Hospital Insurance and Federal Supplemental Medical Insurance Trust Funds.
18. Robert E. Moffit and Alyene Senger, “Medicare’s Demographic Challenge—and the Urgent Need for Reform,” Heritage Foundation Backgrounder No. 2778, forthcoming.
19. During the October 3, 2012, presidential debate, in response to Governor Mitt Romney’s support for premium support in Medicare, President Obama said that “every study has shown that Medicare has lower administrative costs than private insurance does.… And private insurers have to make a profit.... And so you’ve got higher administrative costs, plus profit on top of that.” See “Transcript of Wednesday’s Presidential Debate,” CNN, October 4, 2012, http://www.cnn.com/2012/10/03/politics/debate-transcript/index.html (accessed March 15, 2013), and Jacob S. Hacker, “The Case for Public Plan Choice in National Health Reform,” Institute for America’s Future (undated), p. 6, http://institute.ourfuture.org/files/Jacob_Hacker_Public_Plan_Choice.pdf (accessed March 15, 2013).
6
BACKGROUNDER | NO. 2779March 22, 2013
pool guarantees much higher health spending for its patients than those enrolled in private insurance. Thus, expressing administrative costs as a percent-age of total program costs driven by this older and sicker population makes the official administrative costs for Medicare—roughly 2 percent to 3 percent of claims—appear low.
When administrative costs are viewed on a per beneficiary basis, not merely as a percentage of total costs, Medicare’s administrative costs are in fact higher than those of private insurance, even though in private insurance, these costs include money spent on non-administrative functions, such as marketing and profit. In examining Medicare’s administrative costs per beneficiary, health econo-mist robert Book shows that Medicare’s adminis-trative costs were consistently higher than that for private insurance, even as private supplemental coverage accounts for a progressively larger share of Medicare beneficiary costs.20
One should also not overlook the much high-er Medicare costs generated by the program’s
scandalous levels of waste, fraud, and abuse. These costs, running in the tens of billions of dollars annu-ally, are a direct result of the Medicare program’s structure and administration. They are, in fact, real administrative costs, though they are rarely charac-terized that way among defenders of the Medicare status quo.
Medicare is a defined-benefit structure where prices of medical goods and services are set through a centralized system of administrative pricing. The problem with administrative pricing is that the gov-ernment can and often does underpay and overpay for medical goods and services. While doctors’ and hospitals’ complaints have focused on underpay-ment or the pending Medicare payment reduc-tions under the PPaca, sometimes congress also overpays. The centers for Medicare and Medicaid Services determined in 2011, for example, that Medicare fee-for-service for Parts a and B had an improper payment rate of 8.6 percent, represent-ing $28.8 billion in improper payments.21 as Daniel P. Kessler, a professor in the graduate school of
20. Robert A. Book, “Medicare Administrative Costs Are Higher, Not Lower, Than for Private Insurance,” Heritage Foundation WebMemo No. 2505, June 25, 2009, http://s3.amazonaws.com/thf_media/2009/pdf/wm2505.pdf.
21. Centers for Medicare and Medicaid Services, “Medicare Fee-for-Service 2011 Improper Payments Report,” http://www.cms.gov/Research-Statistics-Data-and-Systems/Monitoring-Programs/CERT/Downloads/MedicareFFS2011CERTReport.pdf (accessed March 6, 2013).
MEDICARE PRIVATE HEALTH INSURANCEPercent
by which Medicare Is Higher
Year
Medicare Primary
Benefi ciaries*(millions)
Total Non-Benefi t (“Administrative”)
Spending**(bllions of dollars)
Non-Benefi t (“Administrative”)
Spending per Primary Benefi ciary(dollars per person)
Total Benefi ciaries†
(millions)
Total Non-Benefi t (“Administrative”)
Spending‡(billions of dollars)
Non-Benefi t (“Administrative”)
Spending per Benefi ciary
(dollars per person)
2000 37.06 $14.10 $380 202.8 $52.0 $256 48.4%2001 37.32 14.40 386 201.7 56.6 281 37.5%2002 37.68 15.84 420 200.9 68.8 342 22.7%2003 38.11 16.50 433 199.9 82.2 411 5.3%2004 38.64 20.14 521 200.9 85.3 425 22.7%2005 39.21 19.94 509 201.2 91.1 453 12.3%
TaBLE 1
Administrative Costs of Medicare and Private Health Insurance
B 2779 heritage.org
* Derived from CMS Medicare Denominator fi le and Medicare Enrollment Database. Extract prepared by Susan Y. Hu, Centers for Medicare and Medicaid Services, Offi ce of Research, Development, and Information. Available from the author on request. “Medicare Primary Benefi ciares” excludes those who have another source of coverage (such as employer-sponsored insurance) and are thus subject to the Medicare Second Payer (MSP) rules. Under MSP, Medicare pays only under very limited circumstances and only to the extent, if any, by which Medicare’s payment is more generous than the benefi ciary’s other coverage. Since these individuals derive nearly all of their health benefi ts from private insurance, they are included as private benefi ciaries instead.** Author calculations based on Benjamin Zycher, “Comparing Public and Private Health Insurance: Would a Single-Payer System Save Enough to Cover the Uninsured?” Manhattan Institute for Policy Research, October 2007, http://www.manhattan-institute.org/html/mpr_05.htm (accessed June 25, 2009).† U.S. Census Bureau, Housing and Household Economic Statistics Division, Current Population Survey.‡ Centers for Medicare and Medicaid Service, National Health Expenditure Accounts, Table 12, http://www.cms.hhs.gov/NationalHealthExpendData/downloads/tables.pdf (accessed June 25, 2009).

7
BACKGROUNDER | NO. 2779March 22, 2013
business at Stanford University, notes, “Many of Medicare’s administrative prices exceed market prices for the same goods and services, leading pro-viders to furnish more of these ‘profitable’ services than beneficiaries need. This system may be good for the providers, but it is harmful to patients: In addition to causing wasteful spending, unnecessary procedures increase the risk of medical errors.”22
congress also routinely intervenes in this pro-cess at the behest of powerful special interests, driv-ing up program costs even more. as Kessler remarks, congress “has the final authority over the many complex formulas that determine the administra-tive prices that Medicare pays for everything from days in intensive care to MrI scans, home health visits, and wheelchairs. One need not be a political science professor to see that this offers congress plentiful opportunities to dole out benefits to well organized constituencies.”23
The current financing structure thus entrenches a politicized system where the political incentives, in Kessler’s words, “all point to waste.” Special inter-ests benefit at the expense of taxpayers and benefi-ciaries. This is a politically driven cost and it is inte-gral to the structure of the program.
Fraud is another fruit of the internal failure of Medicare’s administration and structure. The pro-gram’s complex administrative payment system, combined with relatively rapid payment of large-ly unexamined claims, is an invitation to dishon-est providers to game the system to secure higher and unjustified reimbursements at the expense of the taxpayer.24 That cost, running tens of billions of dollars annually, should properly be catego-rized as a contributor to Medicare’s administra-tive costs, which it is not. One finds no comparable
administrative failure in private health insurance, however, where the economic incentives to root out fraud, secure cost savings, and protect the firms’ market share are intense.25
Finally, one should also incorporate the admin-istrative costs that are shifted to doctors, hospitals, clinics, and skilled nursing facilities in comply-ing with Medicare rules, regulations, and related paperwork. These are transactional costs shifted to Medicare providers. While they do not appear on the Medicare budget, and there are few indepen-dent studies of this phenomenon, these compliance costs—in lost time, energy, and paperwork—are like-wise substantial.26
Medicare Shortfalls: More Taxpayer Costs. Seniors have paid for Medicare throughout their working lives—in the form of their federal payroll taxes and through their federal income taxes. But Medicare is a pay-as-you-go financing system. That means that today’s workers pay for today’s seniors, just as seniors working yesterday paid for those who were retired and collecting Medicare benefits. Medicare is certainly not anything like a private-sector trust fund or savings arrangement where incoming revenues are set aside in an account for a senior’s expenditures on future benefits. Overall, in any given year, through a combination of payroll and income taxes, taxpayers finance almost $9 of every $10 spent on the Medicare program.
contrary to an erroneous and widespread belief among many seniors that their Medicare is fully paid for, and even though they have paid into the program throughout their working lives, they have not, in fact, fully paid for their Medicare benefits. Most seniors actually receive far more in benefits than they contributed through payroll taxes while in
22. Daniel P. Kessler, “Real Medicare Reform,” National Affairs, No. 13 (Fall 2012), p. 87.
23. Ibid., pp. 80–81.
24. Rita E. Numeroff and Michael N. Abrams, Healthcare at a Turning Point: A Roadmap for Change (Boca Raton: CRC Press, 2013), p. 16.
25. “Privately administered health plans can (and do) offer to share gains from controlling fraud and abuse with the vast majority of legitimate providers, thereby weakening their incentive to oppose anti-fraud measures. Similarly, beneficiaries in traditional Medicare have no reason to demand tighter oversight because any gains accrue entirely to the program without the beneficiaries even knowing about them.” Kessler,
“Real Medicare Reform,” p. 89.
26. One of the few independent analyses on this subject, a PricewaterhouseCoopers study of hospital costs of compliance with Medicare rules, showed that for every hour of patient care in an American hospital, hospital personnel spend roughly one hour in completing Medicare paperwork. See Michael O’D. Moore, “AMA Study Shows Paperwork Snarls Up Medicare Services,” Bangor Daily News, May 2, 2001, http://archive.bangordailynews.com/2001/05/02/ama-study-shows-paperwork-snarls-up-medicare-services/ (accessed March 18, 2013).

8
BACKGROUNDER | NO. 2779March 22, 2013
the workforce. research shows,27 for example, that a single male who retired at 65 in 2011 and earned the average wage ($43,500 in 2011 dollars) would have paid $60,000 in Medicare taxes but received $170,000 in benefits—a difference of $110,000. a one-earner couple, who retired in 2011 and earned the average wage would have also paid $60,000 in Medicare taxes but received total benefits worth $357,000—a difference of $297,000. This imbalance contributes to the hospital Insurance Trust Fund’s projected financial insufficiency.
In Medicare Part a, the annual cash deficits of the hI trust fund will ultimately have to be picked up by taxpayers, otherwise Part a benefits, as noted, will not be funded to the full extent promised to Medicare beneficiaries. In Washington, there is no shortage of proposed new federal taxes on business-es and workers designed to close this gap.28 a better
alternative is a modest and steadily declining addi-tional Part a premium.
In Medicare Parts B and D, taxpayers already fund 75 percent of the standard total premium costs, a sharp departure from the original Medicare law, which in 1966 required taxpayers to finance 50 percent of Part B program costs. Note that in 1966, seniors were generally far less affluent, and far more likely to live in poverty, than they are today.
With enactment of the Medicare Modernization act of 2003, congress required higher-income Medicare recipients to pay more than the standard 25 percent for their Part B benefits,29 with different income-based payments ranging from 35 percent to 80 percent of the total premium cost. The Patient Protection and affordable care act of 2010 applied this income test to Part D premiums. While about 5 percent of the Medicare population pays these
27. C. Eugene Steuerle and Richard B. Fisher, “How Lifetime Benefits and Contributions Point the Way Toward Reforming Our Senior Entitlement Programs,” National Institute for Health Care Management Foundation, August 2011, http://nihcm.org/images/stories/EV-Steuerle-Rennane-FINAL.pdf (accessed March 15, 2013), and C. Eugene Steuerle and Stephanie Rennane, “Social Security and Medicare Taxes and Benefits Over a Lifetime,” Urban Institute, June 2011, http://www.urban.org/UploadedPDF/social-security-medicare-benefits-over-lifetime.pdf (accessed March 18, 2013).
28. The most common proposal is simply to increase the current 2.9 percent Medicare payroll tax, for example, to 3.9 percent. Beyond that, there are proposals to increase federal taxes on alcohol and tobacco, sugary drinks, and another tax on employer-based health insurance. See The Henry J. Kaiser Family Foundation, “Policy Options to Sustain Medicare for the Future,” Medicare Policy (January 2013), pp. 28–32.
29. This reduction of taxpayer subsidies for Part B applies to individuals with annual incomes in excess of $85,000 and couples with incomes in excess of $170,000. The PPACA froze income thresholds between 2011 and 2019, at which point they will again be indexed to inflation.
0%
10%
20%
30%
40%
General Revenues
Current Workers’ Payroll Tax
Contributions
All Other Drawing Down Medicare HI Trust Fund
Medicare Beneficiary Premiums
8%3%$42.5 billion
$19.2 billion
41%
36%
12%
$223.3 billion
$195.6 billion
$68.5 billion
CHART 2
FUNDING SOURCES FOR $549.1 BILLION SPENT ON MEDICARE IN 2011Medicare Benefits Are Paid by Working AmericansApproximately 88 percent of seniors’ Medicare benefits are funded by taxpayers. Medicare Part A is mandatory coverage funded by the payroll tax. But Medicare Parts B and D, which cover outpatient services and prescription drugs, respectively, are voluntary and funded primarily by general revenue.
Source: Centers for Medicare and Medicaid Services, 2012 Annual Report of the Boards of Trustees of the Federal Hospital Insurance and Federal Supplementary Medical Insurance Trust Funds, April 23, 2012, p. 10, Table II.B1, http://www.cms.gov/ Research-Statistics-Data-and-Systems/Statistics-Trends-and-Reports/ReportsTrustFunds/ Downloads/TR2012.pdf (accessed March 15, 2013).
heritage.orgB 2779

9
BACKGROUNDER | NO. 2779March 22, 2013
income-related premiums, there is no evidence that these wealthy recipients are withdrawing from the program.30 congress should further reduce taxpay-er subsidies for a larger number of wealthy Medicare recipients.
Medicare “Cost Control”currently, there are a variety of cost-control
strategies that are routinely used in Medicare to control costs; all of them are flawed.
Administrative Pricing and Controls. Medicare payment for services in Parts a and B are governed by complex formulas and price caps. In other words, Medicare pays doctors and hospitals and other medical professionals a fixed fee for spe-cific procedures and services. These are administra-tive payments, a set of payments disconnected from the market conditions of supply and demand for medical goods and services, and these payments are capped. as Michael Porter of the harvard Business School, and Elizabeth Teisberg of the University of
Virginia, argue, this system delivers neither value for Medicare dollars nor economic efficiency:
The top down prices in the current system are not well calibrated with value…. Some are too high (so every hospital wants to provide those services), and others are too low to be attractive to providers. In the current system, there is also no incentive for an excellent provider to offer the well reimbursed services at lower rates. The methodology for top-down price setting can be improved, but never perfected. administered prices will never really work.31
When medical professionals are overpaid, obvi-ously taxpayers lose. When medical professionals are underpaid, they ramp up the volume of services to claw back the revenue that they would otherwise lose.32 Taxpayers lose again. For example, between 1997 and 2001, Medicare physician fees increased by just 3.4 percent, but physician expenditures per
30. The Henry J. Kaiser Family Foundation, “Policy Options to Sustain Medicare for the Future,” p. 24.
31. Michael Porter and Elizabeth Teisberg, Redefining Health Care: Creating Value Based Competition on Results (Boston: Harvard Business School Press, 2006), p. 371.
32. Congressional efforts at Medicare volume control are an epic in the annals of government failure. In the Omnibus Reconciliation Act of 1989, when Congress established the new Medicare physician fee schedule, it included a volume performance standard (VPS) that would reduce physician reimbursement if the target was exceeded. In the Balanced Budget Act of 1997, Congress repealed the VPS and replaced it with the sustainable growth rate (SGR) formula, yet another attempt at curbing the volume of physician services. It is laughably unworkable.
$0
$100,000
$200,000
$300,000
$400,000
CHART 3
FIGURES ARE FOR BENEFICIARIES WHO RETIRE AT 65 IN 2011 AND EARNED THE AVERAGE WAGE
Seniors Receive More Medicare Benefits than They Pay ForMany believe that seniors pay for their own Medicare benefits, but in fact, current workers finance current enrollee benefits. In addition, most Medicare beneficiaries end up receiving more than what they paid in to the system.
Source: C. Eugene Steuerle and Richard B. Fisher, “How Lifetime Benefits and Contributions Point the Way Toward Reforming Our Senior Entitlement Programs,” National Institute for Health Care Management Foundation, August 2011, http://nihcm.org/images/stories/EV- Steuerle-Rennane-FINAL.pdf (accessed March 15, 2013).
heritage.orgB 2779
Paid by Beneficiary
DIFFERENCE
Total Benefits Received
One-Earner Couple
Two-Earner Couple
Single FemaleSingle Male
$357,000 $357,000
$188,000$170,000
$60,000$119,000
$60,000$60,000
$297,000$238,000
$128,000$110,000

10
BACKGROUNDER | NO. 2779March 22, 2013
beneficiary increased by 7.4 percent.33 When medi-cal professionals are underpaid, they also shift costs of providing the Medicare services to private health insurance. Taxpayers, as young working families, lose yet again by paying proportionately higher health insurance premiums. With Medicare’s price-control strategy costs are not controlled, they are shifted.
Sequestration and Medicare. The recent sequestration, an idea that originated in the Obama White house34 and was mandated by the Budget control act of 2011, included an automatic 2 per-cent reduction in payment rates to Medicare provid-ers. The payment reductions total $100 billion from 2013 to 2022.35 Even so, Medicare spending will only be temporarily slowed. The 2013 budget sequestra-tion does nothing to alter the pernicious political incentives that currently prevail in Medicare, and which fuel increased costs at the expense of the ben-eficiaries, and higher spending at the expense of the taxpayers. It is also worth noting that the sequester cuts pale in comparison to the affordable care act’s combination of Medicare payment reductions and scheduled Medicare tax increases.
The Patient Protection and Affordable Care Act (PPACA). The PPaca includes two major pro-visions that are designed to improve Medicare’s financial condition. Yet, they merely double down on the continuation of conventional Medicare pay-ment policy, which makes the program’s problems even worse, while the deceptive budget gimmicks embedded in the law only contribute to the popular
confusion about the true state of Medicare’s finan-cial condition.
First, the law cuts Medicare spending by $716 bil-lion from 2013 to 2022.36 The bulk of these “savings” are in the form of payment reductions. They most-ly hit Medicare Part a providers, such as hospitals, skilled nursing facilities, home health agencies, and hospices, and Medicare advantage plans. These are very large payment reductions, far more extensive than anything congress has attempted in the past.37
Second, the PPaca raises the Medicare hI pay-roll tax on high-income earners (individuals earning $200,000 and above and couples earning $250,000 and above) from 2.9 percent to 3.8 percent and extends the 3.8 percent tax to investment income, capital gains, and in certain cases the proceeds from sale of a home. Together, these tax increases amount to $318 billion from 2013 to 2022.38
On the surface, the Part a spending reductions and increased hI tax revenues should increase the balance of the hI trust fund in comparison to what it would have been before the PPaca was enacted. The Medicare trustees estimate that, together, these provisions extend the life of the Medicare trust fund by eight years, pushing the exhaustion date to 2024. The spokesmen for the Obama administration and its allies in congress often make this point repeat-edly in the ongoing public debate on Medicare.
however, there is a catch. The spending reduc-tions and new revenue were double counted; both being used to “pay for” the PPaca’s new spending provisions and shoring up Medicare’s finances. But
33. Dennis Cortese, Natalie Landman, and Robert Smoldt, “A Roadmap to Medicare Sustainability,” a paper prepared by analysts from Arizona State University and the Healthcare Transformation Institute, February 2013, p. 60.
34. Bob Woodward, “Obama’s Sequester Deal-Changer,” The Washington Post, February 22, 2013, http://www.washingtonpost.com/opinions/bob-woodward-obamas-sequester-deal-changer/2013/02/22/c0b65b5e-7ce1-11e2-9a75-dab0201670da_story.html (accessed March 15, 2013).
35. Congressional Budget Office, “Medicare–February 2013 Baseline.”
36. See Douglas W. Elmendorf, Congressional Budget Office, letter to Speaker John Boehner (R–OH), U.S. House of Representatives, July 24, 2012, pp. 13–14, http://www.cbo.gov/sites/default/files/cbofiles/attachments/43471-hr6079.pdf (accessed March 15, 2013). The letter estimates the cost of repealing the PPACA, which would increase Medicare spending due to the absence of the PPACA’s Medicare cuts. If the PPACA were repealed, the CBO states, “[w]ithin Medicare, net increases in spending for the services covered by Part A (Hospital Insurance) and Part B (Medical Insurance) would total $517 billion and $247 billion, respectively. Those increases would be partially offset by a $48 billion reduction in net spending for Part D.”
37. In terms of Medicare payment cuts, historically the only measure that comes close to the Patient Protection and Affordable Care Act of 2010 is the Balanced Budget Act of 1997. That law also temporarily extended the life of the HI trust fund. But the payment cuts to hospitals, home health agencies, nursing homes, and managed care plans set off an explosion of protests from providers and the public. In 1999, Congress responded by enacting the Medicare, Medicaid and SCHIP Balanced Budget Refinement Act of 1999, rolling back many of the Medicare reimbursement cuts and restrictions.
38. Douglas W. Elmendorf, Congressional Budget Office, letter to Speaker John Boehner, U.S. House of Representatives, July 24, 2012, Table 2.

11
BACKGROUNDER | NO. 2779March 22, 2013
if the “savings” pay for new spending, they cannot simultaneously improve the trust fund balance. In 2010, in their initial report on the Medicare pro-visions of the PPaca, analysts at the nonparti-san congressional research Service (crS) flatly declared: “reductions in Medicare expenditures can be used to extend the solvency of the hI trust fund or used to offset the costs associated with expansion of health insurance coverage; using both account-ing methods at the same time would result in double counting a large share of those savings.”39 addressing the same issue, the congressional Budget Office (cBO) reported, “Unified budget accounting shows that the majority of the hI trust fund savings under PPaca would be used to pay for other spending and therefore would not enhance the ability of the govern-ment to pay for future Medicare benefits.”40
apart from spurious claims to the contrary, these payment cuts do not specifically target waste, fraud, and abuse within Medicare. They are most-ly across-the-board, formula-based reductions in Medicare reimbursement rates aimed at medical institutions and professionals. Notwithstanding
the silly political propaganda that these cuts will only affect “providers” and not beneficiaries, cut-ting payments for Medicare services will directly affect the patients who depend on those services. Seniors’ access to care will be inhibited because cut-ting reimbursement rates is not the same as lower-ing the cost of care. It is simply squeezing providers and asking them to do more with less—which will cause them, once again, to shift their costs to non-Medicare patients, cut back on their Medicare prac-tice, or, in some cases, simply go out of the Medicare business. as the Medicare trustees report states,
absent other changes, the lower Medicare pay-ment rates would result in negative total facility margins for an estimated 15 percent of hospitals, skilled nursing facilities, and home health agen-cies by 2019, and this percentage would reach roughly 25 percent in 2030 and 40 percent by 2050.… Providers could not sustain continu-ing negative margins and would have to with-draw from serving Medicare beneficiaries or (if total facility margins remained positive) shift
39. Patricia A. Davis et al., “Medicare Provisions in PPACA (PL 111-148),” Congressional Research Service, Report for Congress, April 21, 2010, p. 14.
40. Douglas W. Elmendorf, Director, Congressional Budget Office, letter to the Honorable Jeff Sessions (R–AL), U.S. Senate, January 22, 2010, p. 3. (Emphasis added.)
CHART 4
CUTS IN MEDICARE DUE TO OBAMACARE, 2013–2022Obamacare Raids Medicare to Pay for Other New ProgramsProjected Medicare savings from Obamacare don’t improve the program. Instead, they pay for other new programs created under the law that aren‘t even for seniors. By slashing reimbursement rates instead of introducing real reform, the health law jeopardizes seniors’ access to providers.
* Disproportionate Share Hospital: payments to hospitals that serve a large number of low-income patients.
Sources: Douglas W. Elmendorf, Director, Congressional Budget O�ce, letter to Speaker John Boehner, U.S. House of Representatives, July 24, 2012, pp. 13–14, http://www.cbo.gov/sites/default/ files/cbofiles/attachments/43471-hr6079.pdf (accessed March 15, 2013), and Douglas W. Elmendorf, Director, Congressional Budget O�ce, letter to the Honorable Je� Sessions, U.S. Senate, January 22, 2010, p. 3.
heritage.orgB 2779
$0 $50 $100 $150 $200 $250
Hospital services
Payment rates in Medicare Advantage
DSH* payments and other Medicare
provisions
Home health services
Skilled nursing services
All other services
Hospice services
billion
$260 billion
$156 billion
$145 billion
$66 billion
$39 billion
$33 billion
$17 billion
Total Medicare cuts due to Obamacare:
$716 billion

12
BACKGROUNDER | NO. 2779March 22, 2013
substantial portions of Medicare costs to their non-Medicare, non-Medicaid payers. Under such circumstances, lawmakers would probably over-ride the productivity adjustments, much as they have done to prevent reductions in physician payment rates.41
Once again, each round of Medicare cost shift-ing to non-Medicare patients routinely shows up in higher insurance premium costs for younger work-ers and their families, who are already paying the bulk of Medicare bills through their taxes. The level of Medicare cost shifting and the impact on private health insurance will vary from year to year, but these additional costs are in the tens of billions of dollars annually.42
In sum, today Medicare imposes financial obliga-tions on most taxpayers in three ways: (1) through their payroll taxes, (2) through their general reve-nue subsidies of Part B and Part D, and (3) through higher premium costs in their own private cover-age to offset Medicare payment policies. For upper-income americans, the new Medicare tax of 3.8 per-cent on their “unearned” income, such as stocks and bonds, is earmarked for funding the provisions of the PPaca, not Medicare.43
IPAB and Spending Caps. congress, as part of the PPaca, also created the Independent Payment advisory Board (IPaB), a body composed of 15 mem-bers appointed by the President and confirmed by
the Senate.44 Beginning on January 15, 2014, IPaB will make its first recommendations to cut the per capita growth rate in Medicare spending. If IPaB fails to act, the Secretary of health and human Services must make the recommendations on her own and implement them unilaterally.45 Medicare per capita spending growth is initially to be based on a blend of inflation and economic growth. Beginning in 2018, it is to track growth in the general economy as measured by the gross domestic product (GDP) plus 1 percent.46 If spending exceeds its target, IPaB must make “detailed and specific” recommenda-tions to keep spending at the target levels.47 The new law then requires IPaB to submit its recommenda-tions to both the President and congress.
IPaB’s automatic cuts can only be offset by congress, but congress must, by law, propose equiv-alent savings. however, this approach will likely be unsuccessful at restraining Medicare spending.48 While IPaB is not allowed to recommend structur-al changes, raise revenues, or increase beneficiary premiums, congress could, of course, do so, with or without the threats of “sequester-style” payment cuts cooked up by IPaB.
IPaB’s recommendations are confined to Medicare pay cuts for providers, and to the adminis-trative costs and profits of Medicare advantage and Medicare drug plans. If IPaB achieves its spending targets, Medicare providers will likely try to make up their losses by shifting more costs to enrollees
41. Centers for Medicare and Medicaid Services, 2012 Annual Report of the Boards of Trustees of the Federal Hospital Insurance and Federal Supplemental Medical Insurance Trust Funds, p. 223.
42. In 2008, Milliman, Inc., a nationally prominent actuarial firm, estimated that the annual cost shift from Medicare and Medicaid to private health insurers amounted to almost $89 billion. See Will Fox and John Pickering, “Hospital and Physician Cost Shift: Payment Level Comparison of Medicare, Medicaid, and Commercial Payers,” Milliman, Inc., December 2008, p. 2. Milliman based its estimates on 2006 data for hospitals and 2007 data for physicians (the most recent data available at the time of the study).
43. As Medicare Trustee Charles Blahous explains, “Though termed an ‘Unearned Income Medicare Contribution’ (UIMC) under the law, this revenue would not come from Medicare’s traditional contribution base and it would not be allocated to a Medicare Trust Fund.” Charles Blahous, “The Fiscal Consequences of the Affordable Care Act,” Mercatus Center at George Mason University, April 10, 2012, p. 49, http://mercatus.org/sites/default/files/publication/The-Fiscal-Consequences-of-the-Affordable-Care-Act_1.pdf (accessed March 15, 2013).
44. The Patient Protection and Affordable Care Act, Section 3403.
45. Ibid.
46. Like the SGR formula for updating physician Medicare payments, these spending targets do not in any way reflect the conditions of supply and demand in the existing medical markets.
47. IPAB must make recommendations such that the Medicare spending reductions are the lesser of (1) the amount by which the growth rate exceeds the target or (2) a more modest percentage growth in Medicare spending, initially ranging from 0.5 percent to 1.5 percent from 2015 to 2018.
48. “This provision enables Congress to, for example, replace the changes recommended by the board with lawmakers’ own reimbursement-rate cuts—which can then be undone by subsequent legislation—and still satisfy the health care law’s requirements.” Kessler, “Real Medicare Reform,” p. 83.

13
BACKGROUNDER | NO. 2779March 22, 2013
in private insurance, widening the gap between pri-vate payment and Medicare even more. This could stimulate less Medicare participation among doc-tors and other medical professionals, creating even greater access problems for seniors.49
The White house is undaunted by these pros-pects. In fact, in his 2013 budget, the President pro-posed an even tougher Medicare spending cap: a tar-get of GDP plus 0.5 percent.
It is most likely that IPaB will reproduce the political dynamics that drive Medicare physician payment updates. The SGr scheme was designed to keep Medicare physician spending from grow-ing faster than the general economy by automati-cally reducing doctors’ payments, but since 2003, congress has routinely blocked these automatic cuts; and because these temporary “doc fixes” have had a cumulative budgetary effect, the cBO has pro-jected larger future payment reductions and higher taxpayer costs to “fix” them.50 Despite the flaws of the Medicare payment system, congress has yet to repeal the SGr, but continues to block its implemen-tation. It is hard to imagine that congress would behave differently faced with an even broader set of Medicare payment cuts that must, by law, be recom-mended by IPaB.
A Consensus. The concept of a Medicare budget enjoys a broad intellectual and political consensus. The issue with IPaB is not the concept of a Medicare budget, but how to implement it and how to index the growth in future Medicare spending. The general approach of capping the growth of Medicare spend-ing to the growth in the economy, as measured by GDP, has been endorsed by representative Paul ryan (r–WI), chairman of the house Budget committee, and alice rivlin, a senior fellow at the Brookings Institution and former director of the cBO.
another approach to capping Medicare spend-ing is to index spending growth to inflation, as mea-sured by the consumer Price Index (cPI). In the
1990s, tying health care spending growth to price increases was a widely applauded goal of public policy, since health care spending has historically grown at roughly twice the rate of inflation. The notion of indexing health care spending to the medi-cal cPI instead, is, in effect, a surrender to medi-cal inflation; the point of such a cap is, after all, to slow, not merely accommodate, medical inflation. For example, when President Bill clinton unveiled his health Security act in 1993, his objective was to bring the total level of health care spending growth, including Medicare, into line with the cPI. In other words, President clinton proposed a “global bud-get” encompassing both public and private health care spending. Operationally, clinton’s proposed National health Board would have overseen a grad-ual tightening of the budget target to the cPI plus 1 percent in 1997, and the cPI in 1999 and thereafter.51
In the first iteration of his Medicare reform pro-posal, chairman ryan adopted the cPI as his tar-get. The heritage Foundation also proposed, among other changes, a Medicare spending cap based on inflation, using the cPI plus 1 percent. With the advantage of hindsight, one can see now that over the past 10 years the heritage proposal would have con-tributed to a serious reduction in Medicare spending growth, but would also have been significantly more generous in its impact on seniors—more so than either the PPaca or President Obama’s Medicare spending cap in his 2013 budget proposal.52
There is a fundamental difference in the goal and function of a Medicare budget in the Medicare com-petitive pricing proposals, such as those offered by ryan, rivlin, or heritage, and the administrative pricing system and budget enforcement of IPaB. In the competitive pricing approach, such as “premium support” (defined-contribution) financing, the cap plays the role of a budget fallback in the event that competition fails to bring the growth of Medicare spending to the budget target. as a mechanism
49. For a further discussion on IPAB and its consequences, see Robert E. Moffit, “Obamacare and the Independent Payment Advisory Board: Falling Short of Real Medicare Reform,” Heritage Foundation WebMemo No. 3102, January 18, 2011, http://www.heritage.org/research/reports/2011/01/obamacare-and-the-independent-payment-advisory-board-falling-short-of-real-medicare-reform.
50. Douglas W. Elmendorf, Congressional Budget Office, Letter to Hon. John Spratt (D–SC), Chairman of the House Budget Committee, March 27, 2009, http://www.cbo.gov/ftpdocs/100xx/doc10052/03-27-SGR.pdf (accessed March 15, 2013).
51. Health Security Act, Title VI, Subtitle A, Section 6001(a)(3).
52. Robert E. Moffit, “Premium Support: Medicare’s Future and Its Critics,” Heritage Foundation Lecture No. 1212, August 7, 2012, http://www.heritage.org/research/lecture/2012/08/premium-support-medicares-future-and-its-critics. Past performance, of course, is no predictor of the future.

14
BACKGROUNDER | NO. 2779March 22, 2013
for spending control, the former is a bottom-up approach based on the powerful market pressure of consumer choice, the latter is a top-down approach based on administrative fiat and price controls. as heritage Foundation Distinguished Fellow Stuart Butler explains, premium support
starts with the desired budget and then distrib-utes that budget to beneficiaries. So it has 2 cru-cial features. First, it controls Medicare total spending directly, not indirectly like payment controls. Thus, if the government doesn’t flinch, by definition it will constrain spending to the desired budget. and second, it places the deci-sion-making power of the budget into the hands of beneficiaries. Seniors ultimately get to decide which plans or providers will get their money and how much, as opposed to an IPaB determin-ing what their providers will be paid.53
In addition to acting as a budget fallback, the cap also allows the cBO to score a proposal based on competition. The cBO, admittedly,54 does not yet have the institutional capacity to score the cost sav-ings of market competition in health care effectively.
Short-Term and Long-Term Reforms Medicare is a huge entitlement program, and its
reform must, of necessity, be undertaken carefully. congress and the administration do not have time to waste, and should immediately undertake short-term reforms of the traditional Medicare program that can contain costs, while transitioning, as pru-dently but as quickly as possible, to a more effective program that will not only control costs over the long term, but will also provide high-quality health care to a rapidly rising Medicare population.
Short-Term Reforms. compatible with the goal of comprehensive Medicare reform, congress should take four initial steps to place Medicare on a more secure financial footing:55
1. Eliminate the HI trust fund deficits over the next few years by creating a temporary Medicare Part A premium. This premium would be modest, and would be phased out as the hI cash flow deficit is reduced and eliminated.
2. Gradually raise the beneficiary’s contribu-tion to Medicare Part B and Part D premi-ums from 25 percent of program costs to 35 percent. This could be done gradually over 5 years, at the rate of two percentage points a year. (The original Medicare premium for beneficia-ries was 50 percent of Part B total premium costs in 1966, not 25 percent.)
3. Tighten the current income thresholds, index them to inflation, and completely phase out taxpayer subsidies for the wealthiest retir-ees, roughly 3 percent of the total Medicare population.
4. Add a 10 percent co-payment for the total cost of each Medicare home health visit.
Long-Term Reform. Medicare costs must be contained by injecting economic efficiency into the program, realigning the economic incentives of those who demand medical goods and services and those who provide them. real market competition, compelling plans and providers to compete directly for the dollars of millions of americans, would be far superior at achieving that task than the crude impo-sition of price controls, or even complex manipu-lations of administrative payment to induce com-pliance with Medicare’s latest guidelines for care delivery.
This realignment would require a transition of Medicare from a centralized fee-for-service pro-gram into a defined-contribution (“premium sup-port”) program of financing. among the many proponents of such an approach, The heritage Foundation has developed the components of such
53. Stuart M. Butler, “The Debate Over How to Rein in Medicare Costs,” The JAMA Forum, April 13, 2012, http://newsatjama.jama.com/2012/04/13/jama-forum-the-debate-over-how-to-rein-in-medicare-costs/ (accessed March 15, 2013).
54. Douglas W. Elmendorf, “CBO’s 2011 Long-Term Budget Outlook,” testimony before Committee on the Budget, U.S. House of Representatives, June 23, 2011, http://budget.house.gov/uploadedfiles/623elmendorftestimony.pdf (accessed March 15, 2013).
55. For a more extensive discussion of each one of these recommendations, accompanied by budget estimates, see Robert E. Moffit, “The First Stage of Medicare Reform: Fixing the Current Program,” Heritage Foundation Backgrounder No. 2611, October 17, 2011, http://www.heritage.org/research/reports/2011/10/the-first-stage-of-medicare-reform-fixing-the-current-program.
15
BACKGROUNDER | NO. 2779March 22, 2013
a reform in considerable detail.56 among the range of analysts and organizations supporting such a reform, there are differences, but the core ingredi-ents are generally the same: Government payment to competing health plans (including traditional Medicare) would be calculated on market-based bids to provide Medicare benefits, and beneficiaries would choose the plan that best meets their personal needs. If they enroll in a more expensive plan, they pay a higher premium; if they enroll in a less expen-sive plan, they keep the difference as personal sav-ings. Intense market competition among plans and providers, driven by personal choice, would not only secure better value for Medicare dollars but would also restrain costs and thus slow the growth in Medicare spending.
Part D Performance. Since the 1960s, policy-makers have had broad experience with how such programs work in controlling costs, notably the Federal Employees health Benefits Program.57 But Medicare Part D also uses defined-contribution financing and delivers a broad range of drug benefits through competing private plans.
Part D’s overall costs have defied expectations. The program’s total costs from 2006 to 2011 were 48 percent lower than the Medicare trustees’ origi-nal projections for the same time period.58 recently, the cBO reduced its estimates for Medicare spend-ing from 2013 to 2022. compared to the cBO’s 2012 Medicare projections, the 2013 projections are reduced by $152.4 billion over the 10-year period. Part D spending is now projected to be $102.7 bil-lion less, Part B spending is projected to be $75.8 billion less, and Part a spending is now projected
to be $26.1 billion higher than estimated in 2012. In other words, the reduction in Part D spending is the largest contributor to the cBO’s downward revision in its updated forecast, accounting for over 67 per-cent of the projected savings.59 Such a strong perfor-mance holds promise for substantial savings if such market competition were unleashed throughout the entire Medicare program.
A Brighter Path. In 1999, the honorable David Walker, former comptroller General of the United States, testified before the Senate Finance committee on the gravity of the financial chal-lenges facing the Medicare program: “The current Medicare program is both economically and fis-cally unsustainable. This is not a new message—the Medicare Trustees noted in the early 1990s that the program is unsustainable in its current form. They also noted the need for dramatic and fundamental reform of the program to assure its solvency.60
Walker’s words of warning have even greater urgency today. america’s political leaders can con-tinue to ignore them—once again—as they have since the 1990s. But they can only do so with the full knowledge that they are deliberately risking, as the President himself conceded, the viability of the pro-gram for future retirees. and, they are consigning their fellow citizens to a darker fiscal and economic future. It’s time to choose a brighter path.
—Robert E. Moffit, PhD, is Senior Fellow in the Center for Policy Innovation at The Heritage Foundation. Alyene Senger is a Research Assistant in the Center for Health Policy Studies at The Heritage Foundation.
56. Robert E. Moffit, “The Second Stage of Medicare Reform: Moving to a Premium Support Program,” Heritage Foundation Backgrounder No. 2626, November 28, 2011, http://report.heritage.org/bg2626.
57. For an overview of cost-control successes in defined-contribution health programs, see Robert E. Moffit, “Expanding Choice through Defined Contributions: Overcoming a Non-Participatory Health Care Economy,” Journal of Law, Medicine and Ethics (Fall 2012), pp. 558–573.
58. Centers for Medicare and Medicaid Services, 2004 Annual Report of the Boards of Trustees of the Federal Hospital Insurance and Federal Supplementary Medical Insurance Trust Funds, March 23, 2004, Table II.C18, http://www.cms.gov/Research-Statistics-Data-and-Systems/Statistics-Trends-and-Reports/ReportsTrustFunds/Downloads/tr2004.pdf (accessed March 15, 2013), and Centers for Medicare and Medicaid Services, 2012 Annual Report of the Boards of Trustees of the Federal Hospital Insurance and Federal Supplementary Medical Insurance Trust Funds, Table III.D3.
59. Congressional Budget Office, “Medicare–February 2013 Baseline,” and CBO, “March 2012 Medicare Baseline,” March 13, 2012, http://www.cbo.gov/sites/default/files/cbofiles/attachments/43060_Medicare.pdf (accessed March 15, 2013). The savings were calculated as benefit spending minus premiums paid, including payments by states for Part D, from 2013 to 2022, comparing 2012 projections to 2013 projections.
60. David M. Walker, “Medicare and Budget Surpluses: GAO’s Perspective on the President’s Proposal,” statement before the Committee on Finance, U.S. Senate, 106th Congress, 1st Session, March 10, 1999, p. 2, http://www.gpo.gov/fdsys/pkg/GAOREPORTS-T-AIMD-HEHS-99-113/html/GAOREPORTS-T-AIMD-HEHS-99-113.htm (accessed March 15, 2013).