baccalaureate follow-up study: employment and … baccalaureate follow-up... · baccalaureate...
TRANSCRIPT
Baccalaureate Follow-Up Study: Employment and Education Outcomes
One, Five, and Ten Years After Graduation
January 2018

BOARD of GOVERNORS State University System of Florida 1
EXECUTIVE SUMMARY
Students, parents, educators, and policy-makers need information regarding the employment and education outcomes of bachelor’s degree recipients over time. This report - Baccalaureate Follow-Up Study: Employment and Education Outcomes One, Five, and Ten Years After Graduation - is the fourth report on outcomes for the State University System (SUS) of Florida. What makes this report different from the first three reports is the extended horizon over which outcomes are assessed. Previous studies only looked at outcomes one year after the completion of a baccalaureate degree. This report looks one, five, and ten years beyond completion. To assess employment and education outcomes over time, this study utilized records from various graduating classes. Due to the limited availability of historical employment data, it was not possible to track outcomes over time for the same group of graduates (see Appendix A). However, the same objective can be achieved by analyzing the outcomes of graduates from different graduating classes. Therefore, Year 1 outcomes are reported for the classes of 2012, 2013, 2014, and 2015. Year 5 outcomes are reported for the classes of 2008, 2009, and 2010. Year 10 outcomes are reported for the Class of 2005. Records for 423,699 graduates were available to match with national and state employment and education databases. The major national employment databases that were used in this study included data from up to 41 states, the District of Columbia, Puerto Rico, and federal employment data from the United States Office of Personnel Management (OPM). The national education database included records for approximately 3,700 colleges and universities nationwide. The matches yielded employment and/or educational outcomes for 353,940 graduates – or 84% of graduates with records available for matching. The graduates for whom outcomes were known are referred to as “graduates in the study.” The status of the remaining 16% of graduates (n=69,759) is “unknown,” particularly since the employment databases do not include individuals who are self-employed, who work for organizations that do not participate in the unemployment insurance programs, or who are otherwise gainfully employed. See Appendix A for additional details regarding the data sources. Records for the 353,940 graduates with known outcomes were used to answer the following five research questions.
1. DO GRADUATES GET JOBS?
Yes, the majority of graduates in the study worked one, five, and ten years after completing a baccalaureate degree at a state university. In Year 1, just over 90% of graduates worked after completing a baccalaureate degree. In Year 5, approximately
BOARD of GOVERNORS State University System of Florida 2
93% of graduates worked. In Year 10, the percentage of graduates found working increased to 97%.
2. DO GRADUATES EARN ADDITIONAL CREDENTIALS?
Yes, SUS graduates go on to earn additional credentials after completing a baccalaureate degree. By the fifth year after graduation, 30% of graduates in the study had earned at least one additional credential. By the tenth year following the completion of a baccalaureate degree, 44% of graduates had completed at least one additional credential.
3. DO GRADUATES PURSUE FURTHER EDUCATION?
The answer to this question is also yes, particularly in the first and fifth years after completing a baccalaureate degree. During the first year following graduation, just over 30% of graduates in the study pursued additional education. In the fifth year after graduation, 22% of graduates were pursuing additional education. By the tenth year following the completion of a baccalaureate degree only 11% of graduates were pursuing additional education.
4. DO GRADUATES WORK WHILE PURSUING ADDITIONAL EDUCATION?
SUS graduates also worked while pursuing additional education, particularly during the first and fifth years following the completion of a baccalaureate degree. Over time, the proportion working while enrolled declined. In Year 1, nearly 25% of graduates in the study worked while pursuing additional education. In Year 5, approximately 15% worked while enrolled. By Year 10, only 8% of graduates worked while enrolled.
5. WHAT ARE THE SALARIES OF GRADUATES OVER TIME?
The starting salaries for recent graduates were strong and salaries increased substantially over time. The median annual wage for graduates in the first year following graduation was $36,600. The median in Year 5 was $47,500 for working graduates without an additional credential and $52,800 for working graduates with an additional credential. The median annual wage in Year 10 was $59,300 for working graduates without an additional credential and $67,500 for working graduates with an additional credential. The Year 10 median annual wage for working graduates without an additional credential represents a 62% increase over the Year 1 median. The Year 10 median annual wage for working graduates with an additional credential represents an 84% increase over the Year 1 median. While the median annual wages increased over time for working graduates in all fields of study, the increases were not equal across all fields of study.

BOARD of GOVERNORS State University System of Florida 3
Table of Contents
Introduction 5
Do Graduates Get Jobs? 10
Do Graduates Earn Additional Credentials? 13
Do Graduates Pursue Further Education? 15
Do Graduates Work While Pursuing Additional Education? 17
What Are the Salaries of Graduates Over Time? 19
Conclusion 27
Appendix A: Technical Notes 28
Appendix B: Supplemental Data Tables 37
Appendix C: Variations in Annual Wages 49
List of Figures
Figure 1. Percent of Graduates Found by Outcome Year 8
Figure 2. Median Annual Wages for Baccalaureate Graduates Employed 20
Full-Time One, Five, and Ten Years After Graduation
BOARD of GOVERNORS State University System of Florida 4
List of Tables
Table 1. Total Number of Graduates, All Outcome Years Combined, 7
by Fields of Study
Table 2. Number and Percent of Baccalaureate Graduates Who Worked, 11
All Outcome Years, by Fields of Study
Table 3. Number and Percent of Baccalaureate Graduates Who Worked 12
Full-Time, All Outcome Years, by Fields of Study
Table 4. Number and Percent of Baccalaureate Graduates Who Earned 14
Additional Credentials, Years 5 and 10, by Fields of Study
Table 5. Number and Percent of Baccalaureate Graduates Enrolled 16
in Further Education, All Outcome Years, by Fields of Study
Table 6. Number and Percent of Baccalaureate Graduates Who Worked 18
While Enrolled in Further Education, All Outcome Years, by Fields of Study
Table 7. Median Annual Wages for Baccalaureate Graduates Employed 21
Full-Time, One Year After Graduation, by Fields of Study
(Classes of 2012, 2013, 2014 and 2015 Combined)
Table 8. Median Annual Wages for Baccalaureate Graduates Employed 22
Full-Time Without an Additional Credential, Five and Ten Years After
After Graduation, by Fields of Study
Table 9. Median Annual Wages for Baccalaureate Graduates Employed 24
Full-Time With an Additional Credential, Five and Ten Years After
After Graduation, by Fields of Study
Table 10. Difference Between Median Annual Wages for Baccalaureate Graduates 26
Employed Full-Time With and Without an Additional Credential, Five and
Ten Years After Graduation, by Fields of Study
BOARD of GOVERNORS State University System of Florida 5
INTRODUCTION
This report presents the results of the Baccalaureate Follow-up Study: Employment and Education Outcomes One, Five, and Ten Years After Graduation. This is the fourth report on the employment and education outcomes of baccalaureate graduates of the State University System (SUS) published by the Board of Governors. The first three reports reported employment and education outcomes for baccalaureate graduates one year after graduation for the classes of 2012, 2014, and 2015. This study was expanded to look at employment and education outcomes not only one year after graduation, but also five and ten years after graduation. All of the baccalaureate follow-up studies were
designed to complement existing reports of the Board of Governors and to inform the
Board’s efforts to meet the goals and objectives of the Board’s 2025 System Strategic Plan. Each baccalaureate study was enhanced to provide better and more comprehensive information about the educational and employment outcomes of graduates. As a result, the outcomes in this report may not be directly comparable to the outcomes reported in the three previous studies. The major improvements to each study are described in Appendix A. This new study was designed to better understand the employment and education outcomes of graduates over time. To this end, this study was designed to answer the following five research questions one, five, and ten years after graduation.
1) Do graduates get jobs? 2) Do graduates earn additional credentials? 3) Do graduates pursue further education? 4) Do graduates work while pursuing additional education? 5) What are the salaries of graduates over time?
The answers to these five research questions provide critical information to students, parents, educators, and policy-makers about the experiences of graduates after completing a baccalaureate degree from the SUS.
Graduates in the Study To assess employment and education outcomes over time, this study utilized records for graduates from various graduating classes. Due to the limited availability of historical employment data, it was not possible to track outcomes over time for the same group of graduates. However, the same objective can be achieved by analyzing the outcomes of graduates from different graduating classes. Therefore, Year 1 outcomes are reported for the classes of 2012, 2013, 2014, and 2015. Year 5 outcomes are reported for the classes of 2008, 2009, and 2010. Year 10 outcomes are reported for the Class of 2005. Data for all classes included baccalaureate degree recipients from 11 of
BOARD of GOVERNORS State University System of Florida 6
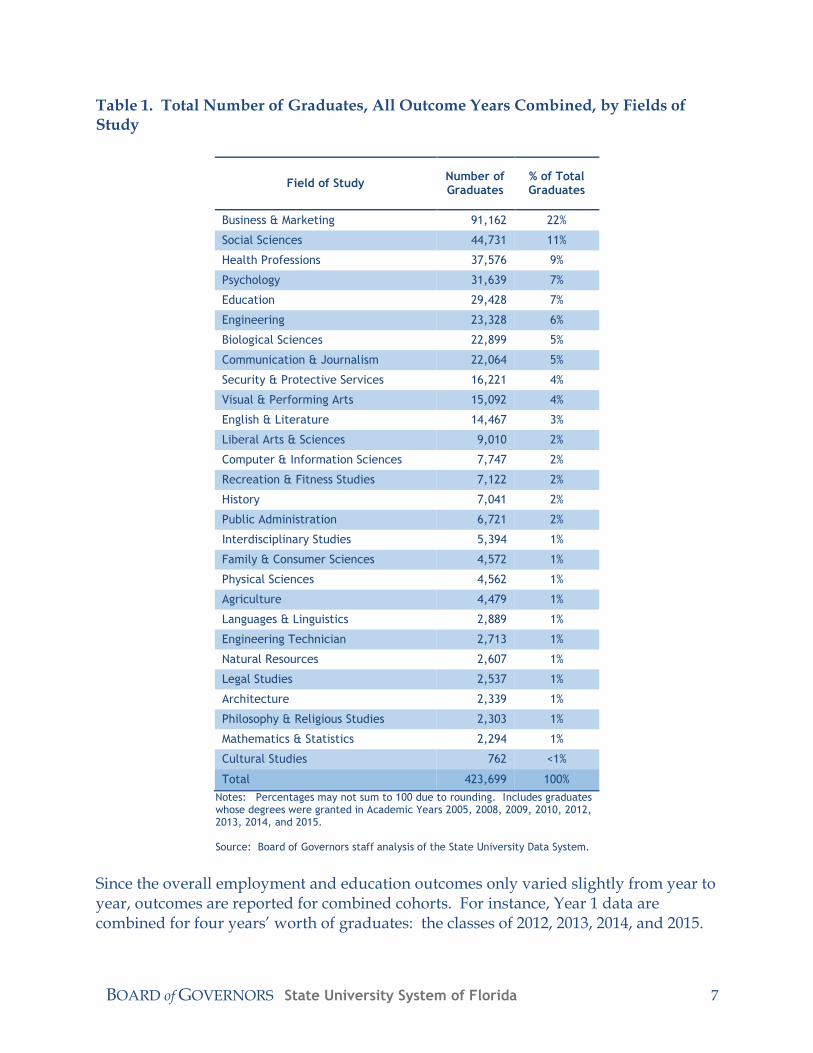
the 12 SUS institutions. Florida Polytechnic University’s first students enrolled in Fall 2014 and did not graduate in time to be included in this study. The SUS institutions award degrees in 28 fields of study, based on the two-digit Classification of Instructional Program (CIP) category associated with the degrees awarded. The majority of the degrees awarded to graduates in this study were in the following fields: Biological Sciences, Business & Marketing, Communication & Journalism, Education, Engineering, English & Literature, Health Professions, Psychology, Security & Protective Services, Social Sciences, and Visual & Performing Arts. These eleven fields represent 82% of the graduates whose records were used for this study. Table 1 below provides the total numbers of degrees awarded by field of study for the eight graduating classes.
BOARD of GOVERNORS State University System of Florida 7
Table 1. Total Number of Graduates, All Outcome Years Combined, by Fields of Study
Field of Study Number of Graduates
% of Total Graduates
Business & Marketing 91,162 22%
Social Sciences 44,731 11%
Health Professions 37,576 9%
Psychology 31,639 7%
Education 29,428 7%
Engineering 23,328 6%
Biological Sciences 22,899 5%
Communication & Journalism 22,064 5%
Security & Protective Services 16,221 4%
Visual & Performing Arts 15,092 4%
English & Literature 14,467 3%
Liberal Arts & Sciences 9,010 2%
Computer & Information Sciences 7,747 2%
Recreation & Fitness Studies 7,122 2%
History 7,041 2%
Public Administration 6,721 2%
Interdisciplinary Studies 5,394 1%
Family & Consumer Sciences 4,572 1%
Physical Sciences 4,562 1%
Agriculture 4,479 1%
Languages & Linguistics 2,889 1%
Engineering Technician 2,713 1%
Natural Resources 2,607 1%
Legal Studies 2,537 1%
Architecture 2,339 1%
Philosophy & Religious Studies 2,303 1%
Mathematics & Statistics 2,294 1%
Cultural Studies 762 <1%
Total 423,699 100%
Notes: Percentages may not sum to 100 due to rounding. Includes graduates whose degrees were granted in Academic Years 2005, 2008, 2009, 2010, 2012, 2013, 2014, and 2015. Source: Board of Governors staff analysis of the State University Data System.
Since the overall employment and education outcomes only varied slightly from year to year, outcomes are reported for combined cohorts. For instance, Year 1 data are combined for four years’ worth of graduates: the classes of 2012, 2013, 2014, and 2015.
BOARD of GOVERNORS State University System of Florida 8
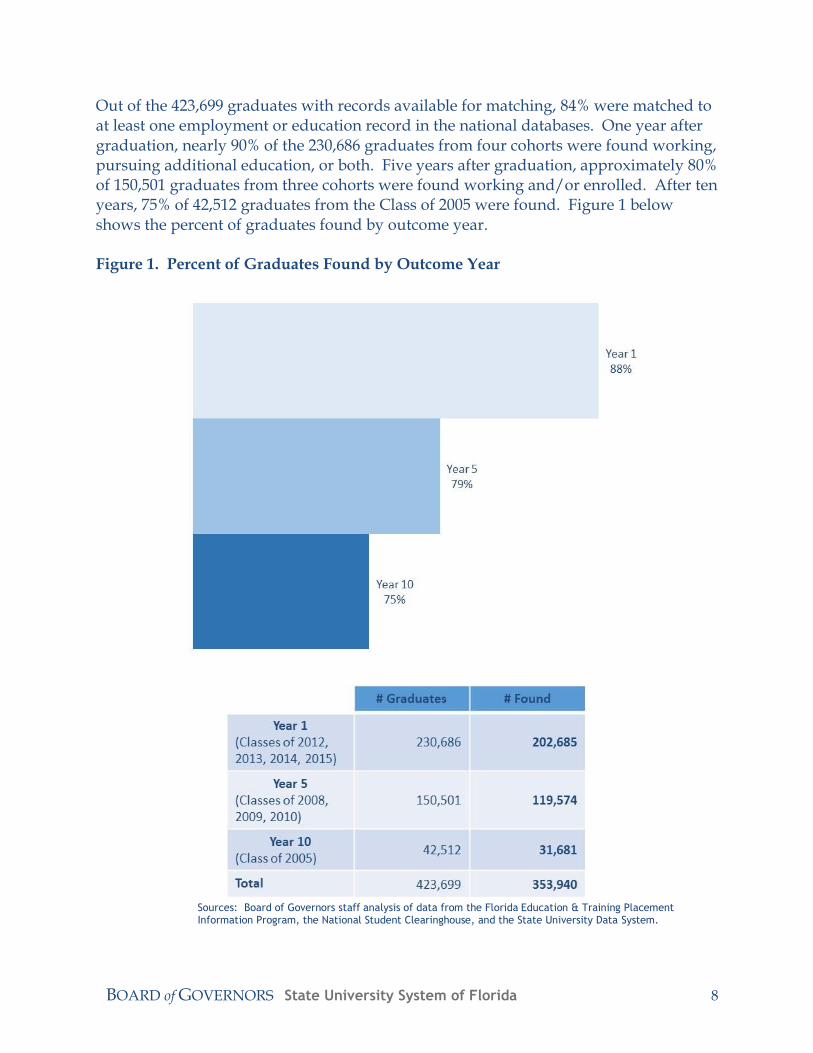
Out of the 423,699 graduates with records available for matching, 84% were matched to at least one employment or education record in the national databases. One year after graduation, nearly 90% of the 230,686 graduates from four cohorts were found working, pursuing additional education, or both. Five years after graduation, approximately 80% of 150,501 graduates from three cohorts were found working and/or enrolled. After ten years, 75% of 42,512 graduates from the Class of 2005 were found. Figure 1 below shows the percent of graduates found by outcome year. Figure 1. Percent of Graduates Found by Outcome Year
Sources: Board of Governors staff analysis of data from the Florida Education & Training Placement Information Program, the National Student Clearinghouse, and the State University Data System.
BOARD of GOVERNORS State University System of Florida 9
The numbers and percentages of graduates who worked and/or pursued additional education (i.e., graduates found) for each outcome year are available in Tables A, B, C, and D in Appendix B. Data for the number and percent of graduates found for individual graduating classes are provided in Tables E, F, and G of Appendix B. Outcomes for the remaining 69,759 graduates (16%) were not available from the existing databases, although some graduates were likely employed in jobs not captured in the data. It is likely that some graduates were employed in states that did not submit data to the national database. For instance, the primary national employment database included data for up to 41 states, the District of Columbia, and Puerto Rico.1 It is also important to note that state and national employment databases do not include people who are self-employed, who work for organizations that do not participate in the unemployment insurance programs, and who have other types of employment described in more detail in Appendix A. Since the purpose of this study was to report outcomes for baccalaureate degree recipients, the remaining sections of the report will focus on the 353,940 graduates whose outcomes are known. Additional details regarding limitations of the employment and education data sources are available in Appendix A. Throughout the remainder of this report, the term “graduates in the study” refers to the graduates from the various cohorts who worked and/or pursued additional education (i.e., who were found in the employment and/or education data sources).
1 While the state of Georgia is participating in WRIS 2, as described in Appendix A, employment data was only available for matching to records from the Class of 2015 for Year 1 of the outcome years.
BOARD of GOVERNORS State University System of Florida 10
DO GRADUATES GET JOBS?
Yes – the majority of graduates in the study worked one, five, and ten years after completing a baccalaureate degree. In Year 1, just over 90% of graduates found were working. By Year 5, approximately 93% of graduates worked and in Year 10, the percentage of graduates found working was 97%. By field of study, there is some variability in the percentage of graduates working during the first and fifth years following graduation. Overall, between 71% and 98% graduates worked one and five years after graduation. However, by the tenth year following graduation, between 90% and 99% of graduates worked across all fields. The number and percent of graduates in the study who worked one, five, and ten years after graduation are provided by field of study in Table 2 below.
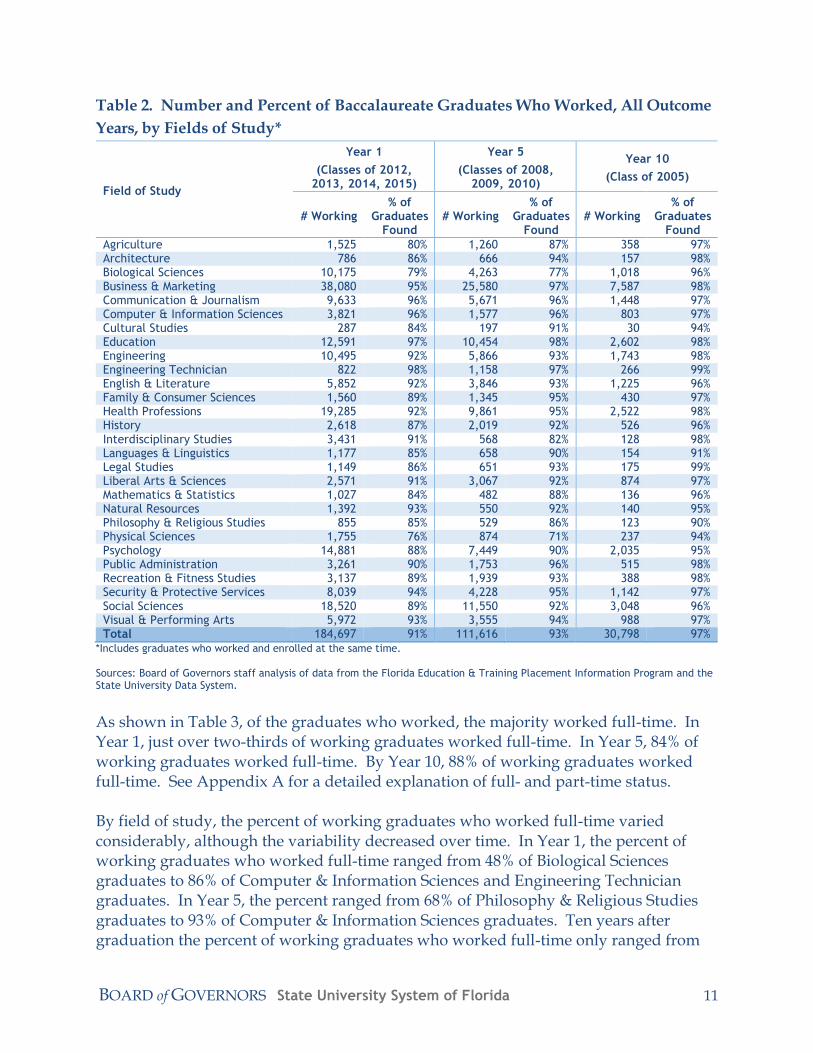
BOARD of GOVERNORS State University System of Florida 11
Table 2. Number and Percent of Baccalaureate Graduates Who Worked, All Outcome
Years, by Fields of Study*
Field of Study
Year 1
(Classes of 2012, 2013, 2014, 2015)
Year 5
(Classes of 2008, 2009, 2010)
Year 10
(Class of 2005)
# Working % of
Graduates Found
# Working % of
Graduates Found
# Working % of
Graduates Found
Agriculture 1,525 80% 1,260 87% 358 97% Architecture 786 86% 666 94% 157 98% Biological Sciences 10,175 79% 4,263 77% 1,018 96% Business & Marketing 38,080 95% 25,580 97% 7,587 98% Communication & Journalism 9,633 96% 5,671 96% 1,448 97% Computer & Information Sciences 3,821 96% 1,577 96% 803 97% Cultural Studies 287 84% 197 91% 30 94% Education 12,591 97% 10,454 98% 2,602 98% Engineering 10,495 92% 5,866 93% 1,743 98% Engineering Technician 822 98% 1,158 97% 266 99% English & Literature 5,852 92% 3,846 93% 1,225 96% Family & Consumer Sciences 1,560 89% 1,345 95% 430 97% Health Professions 19,285 92% 9,861 95% 2,522 98% History 2,618 87% 2,019 92% 526 96% Interdisciplinary Studies 3,431 91% 568 82% 128 98% Languages & Linguistics 1,177 85% 658 90% 154 91% Legal Studies 1,149 86% 651 93% 175 99% Liberal Arts & Sciences 2,571 91% 3,067 92% 874 97% Mathematics & Statistics 1,027 84% 482 88% 136 96% Natural Resources 1,392 93% 550 92% 140 95% Philosophy & Religious Studies 855 85% 529 86% 123 90% Physical Sciences 1,755 76% 874 71% 237 94% Psychology 14,881 88% 7,449 90% 2,035 95% Public Administration 3,261 90% 1,753 96% 515 98% Recreation & Fitness Studies 3,137 89% 1,939 93% 388 98% Security & Protective Services 8,039 94% 4,228 95% 1,142 97% Social Sciences 18,520 89% 11,550 92% 3,048 96% Visual & Performing Arts 5,972 93% 3,555 94% 988 97% Total 184,697 91% 111,616 93% 30,798 97%
*Includes graduates who worked and enrolled at the same time. Sources: Board of Governors staff analysis of data from the Florida Education & Training Placement Information Program and the State University Data System.
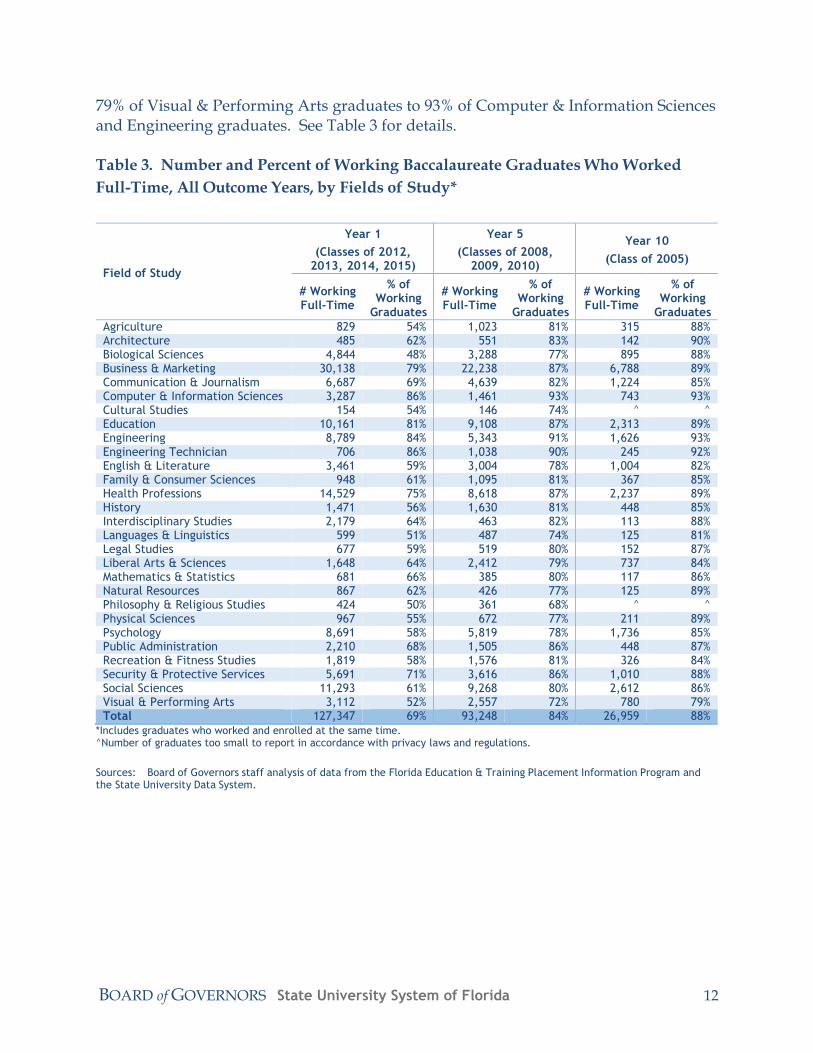
As shown in Table 3, of the graduates who worked, the majority worked full-time. In Year 1, just over two-thirds of working graduates worked full-time. In Year 5, 84% of working graduates worked full-time. By Year 10, 88% of working graduates worked full-time. See Appendix A for a detailed explanation of full- and part-time status. By field of study, the percent of working graduates who worked full-time varied considerably, although the variability decreased over time. In Year 1, the percent of working graduates who worked full-time ranged from 48% of Biological Sciences graduates to 86% of Computer & Information Sciences and Engineering Technician graduates. In Year 5, the percent ranged from 68% of Philosophy & Religious Studies graduates to 93% of Computer & Information Sciences graduates. Ten years after graduation the percent of working graduates who worked full-time only ranged from
BOARD of GOVERNORS State University System of Florida 12
79% of Visual & Performing Arts graduates to 93% of Computer & Information Sciences and Engineering graduates. See Table 3 for details. Table 3. Number and Percent of Working Baccalaureate Graduates Who Worked
Full-Time, All Outcome Years, by Fields of Study*
Field of Study
Year 1
(Classes of 2012, 2013, 2014, 2015)
Year 5
(Classes of 2008, 2009, 2010)
Year 10
(Class of 2005)
# Working Full-Time
% of Working
Graduates
# Working Full-Time
% of Working
Graduates
# Working Full-Time
% of Working
Graduates
Agriculture 829 54% 1,023 81% 315 88% Architecture 485 62% 551 83% 142 90% Biological Sciences 4,844 48% 3,288 77% 895 88% Business & Marketing 30,138 79% 22,238 87% 6,788 89% Communication & Journalism 6,687 69% 4,639 82% 1,224 85% Computer & Information Sciences 3,287 86% 1,461 93% 743 93% Cultural Studies 154 54% 146 74% ^ ^ Education 10,161 81% 9,108 87% 2,313 89% Engineering 8,789 84% 5,343 91% 1,626 93% Engineering Technician 706 86% 1,038 90% 245 92% English & Literature 3,461 59% 3,004 78% 1,004 82% Family & Consumer Sciences 948 61% 1,095 81% 367 85% Health Professions 14,529 75% 8,618 87% 2,237 89% History 1,471 56% 1,630 81% 448 85% Interdisciplinary Studies 2,179 64% 463 82% 113 88% Languages & Linguistics 599 51% 487 74% 125 81% Legal Studies 677 59% 519 80% 152 87% Liberal Arts & Sciences 1,648 64% 2,412 79% 737 84% Mathematics & Statistics 681 66% 385 80% 117 86% Natural Resources 867 62% 426 77% 125 89% Philosophy & Religious Studies 424 50% 361 68% ^ ^ Physical Sciences 967 55% 672 77% 211 89% Psychology 8,691 58% 5,819 78% 1,736 85% Public Administration 2,210 68% 1,505 86% 448 87% Recreation & Fitness Studies 1,819 58% 1,576 81% 326 84% Security & Protective Services 5,691 71% 3,616 86% 1,010 88% Social Sciences 11,293 61% 9,268 80% 2,612 86% Visual & Performing Arts 3,112 52% 2,557 72% 780 79% Total 127,347 69% 93,248 84% 26,959 88%
*Includes graduates who worked and enrolled at the same time. ^Number of graduates too small to report in accordance with privacy laws and regulations.
Sources: Board of Governors staff analysis of data from the Florida Education & Training Placement Information Program and the State University Data System.
BOARD of GOVERNORS State University System of Florida 13
DO GRADUATES EARN ADDITIONAL CREDENTIALS?
After earning a baccalaureate degree, SUS graduates do continue their education and
earn additional credentials. By the fifth year after graduation, 30% of graduates in the
study had earned at least one additional credential. By the tenth year following the
completion of a baccalaureate degree, 44% of graduates had completed at least one
additional credential.
As shown in Table 4, the proportion of graduates who earned additional credentials
varied widely by field of study. In Year 5, only 15% of Engineering Technician
graduates had earned at least one additional credential while 56% of Architecture
graduates had earned at least one additional credential. In Year 10, only 30% of
Security & Protective Services graduates had earned at least one additional credential
while 69% of Public Administration and Mathematics & Statistics graduates had earned
at least one additional credential.
BOARD of GOVERNORS State University System of Florida 14
Table 4. Number and Percent of Baccalaureate Graduates Who Earned Additional
Credentials, Years 5 and 10, by Fields of Study
Field of Study
Year 5
(Classes of 2008, 2009, 2010)
Year 10
(Class of 2005)
# with Credential
# Graduates
Found % of
Found # with
Credential
# Graduates
Found % of
Found
Agriculture 731 1,444 51% 224 368 61% Architecture 398 711 56% 104 160 65% Biological Sciences 2,306 5,535 42% 704 1,065 66% Business & Marketing 6,230 26,432 24% 2,669 7,707 35% Communication & Journalism 1,146 5,910 19% 464 1,489 31% Computer & Information Sciences 298 1,635 18% 262 828 32% Cultural Studies 64 216 30% ^ ^ ^ Education 2,376 10,684 22% 1,105 2,657 42% Engineering 2,068 6,299 33% 824 1,783 46% Engineering Technician 184 1,195 15% ^ ^ ^ English & Literature 1,188 4,131 29% 514 1,272 40% Family & Consumer Sciences 369 1,416 26% 208 442 47% Health Professions 3,909 10,419 38% 1,317 2,578 51% History 814 2,205 37% 282 550 51% Interdisciplinary Studies 333 694 48% 71 131 54% Languages & Linguistics 256 729 35% 93 170 55% Legal Studies 275 698 39% 79 176 45% Liberal Arts & Sciences 764 3,344 23% 323 901 36% Mathematics & Statistics 235 548 43% 97 141 69% Natural Resources 155 599 26% ^ ^ ^ Philosophy & Religious Studies 238 612 39% 70 137 51% Physical Sciences 575 1,226 47% 169 252 67% Psychology 3,339 8,231 41% 1,267 2,133 59% Public Administration 962 1,818 53% 364 528 69% Recreation & Fitness Studies 719 2,080 35% 176 394 45% Security & Protective Services 954 4,434 22% 355 1,179 30% Social Sciences 4,362 12,543 35% 1,603 3,175 50% Visual & Performing Arts 867 3,786 23% 324 1,016 32% Total 36,115 119,574 30% 13,782 31,681 44%
*Includes graduates who worked and enrolled at the same time. ^Number of graduates too small to report in accordance with privacy laws and regulations.
Sources: Board of Governors staff analysis of data from the Florida Education & Training Placement Information Program and the State University Data System.
BOARD of GOVERNORS State University System of Florida 15
DO GRADUATES PURSUE FURTHER EDUCATION?
SUS graduates pursued additional education, primarily during the first and fifth years following the completion of a baccalaureate degree.2,3 During the first year following graduation, just over 30% of graduates in the study pursued additional education. Nearly three out of four enrolled graduates also worked at the same time. By the fifth year, 22% of graduates pursued additional education with approximately two out of every three enrolled graduates also working while enrolled. However, only 11% of graduates pursued additional education during the tenth year following the completion of a baccalaureate degree – and nearly three out of four of these enrolled graduates worked while enrolled. The reduction in the percent of graduates enrolled is to be expected as graduates cease enrolling once additional credential(s) have been completed. The graduates who worked while enrolled are described in more detail in the next section. As shown in Table 5 below, there was considerable variation in the proportion of graduates in the study who pursued additional education across the 28 fields of study for all outcome years. In Year 1, the proportion ranged from 13% of Engineering Technician graduates to 57% of Biological Sciences graduates. In Year 5, the proportion ranged from 12% of Engineering Technician graduates to 50% of Physical Sciences graduates. By Year 10, there was less variability but lower proportions of graduates enrolled. The proportions of graduates who pursued additional education in Year 10 ranged from less than 1% of Cultural Studies and Interdisciplinary Studies graduates to 25% of Languages & Linguistics graduates.
2 There are several limitations associated with the enrollment data. For instance, it is impossible to determine how many enrolled in graduate programs, a second baccalaureate program, a certificate program, or just a few courses. The data also does not specify whether individuals are enrolled on a full- or part-time basis. Refer to Appendix A for more information about the limitations of the national education database. 3 The numbers of graduates enrolled reported in this section also include graduates who earned an additional credential in Year 5 or Year 10.
BOARD of GOVERNORS State University System of Florida 16
Table 5. Number and Percent of Baccalaureate Graduates Enrolled in Further Education, All Outcome Years, by Fields of Study*
Field of Study
Year 1
(Classes of 2012, 2013, 2014, 2015)
Year 5
(Classes of 2008, 2009, 2010)~
Year 10
(Class of 2005)**
# Enrolled % of
Graduates Found
# Enrolled % of
Graduates Found
# Enrolled % of
Graduates Found
Agriculture 965 51% 468 32% ^ ^ Architecture 438 48% 106 15% ^ ^ Biological Sciences 7,385 57% 2,382 43% 137 13% Business & Marketing 9,283 23% 3,578 14% 494 6% Communication & Journalism 1,565 16% 876 15% 136 9% Computer & Information Sciences 701 18% 213 13% 72 9% Cultural Studies 145 43% 64 30% ^ ^ Education 2,838 22% 1,709 16% 291 11% Engineering 2,950 26% 1,279 20% 144 8% Engineering Technician 106 13% 139 12% 25 9% English & Literature 1,840 29% 968 23% 187 15% Family & Consumer Sciences 689 39% 284 20% 59 13% Health Professions 7,857 37% 2,641 25% 328 13% History 1,157 39% 565 26% 74 13% Interdisciplinary Studies 1,282 34% 249 36% ^ ^ Languages & Linguistics 587 43% 234 32% 42 25% Legal Studies 586 44% 146 21% ^ ^ Liberal Arts & Sciences 863 30% 811 24% 103 11% Mathematics & Statistics 529 43% 183 33% ^ ^ Natural Resources 432 29% 181 30% ^ ^ Philosophy & Religious Studies 428 42% 206 34% ^ ^ Physical Sciences 1,231 53% 611 50% 43 17% Psychology 7,616 45% 2,569 31% 343 16% Public Administration 1,953 54% 328 18% 60 11% Recreation & Fitness Studies 1,504 43% 446 21% ^ ^ Security & Protective Services 2,908 34% 878 20% 151 13% Social Sciences 7,834 38% 3,002 24% 436 14% Visual & Performing Arts 1,400 22% 648 17% 94 9% Total 67,072 33% 25,764 22% 3,403 11%
*Includes graduates who worked and enrolled at the same time. ~Includes graduates who also earned an additional credential in Year 5. **Includes graduates who also earned an additional credential in Year 10. ^Number of graduates too small to report in accordance with privacy laws and regulations.
Sources: Board of Governors staff analysis of data from the National Student Clearinghouse and the State University Data System.
BOARD of GOVERNORS State University System of Florida 17
DO GRADUATES WORK WHILE PURSUING ADDITIONAL
EDUCATION?
SUS graduates worked while pursuing additional education, particularly during the first and fifth years following the completion of a baccalaureate degree. Over time, the proportion working while enrolled declined. In Year 1, nearly 25% of graduates worked while pursuing additional education. In Year 5, approximately 15% worked while enrolled. By Year 10, only 8% worked while enrolled. This is consistent with the increase in employment as graduates achieve educational goals. As shown in Table 6, there was considerable variation in the proportion of graduates in the study who pursued additional education across the 28 fields of study and in all years following graduation. In Year 1, the proportion ranged from 11% of Engineering Technician graduates to 44% of Public Administration graduates. In Year 5, the proportion ranged from 9% of Biological Sciences, Computer & Information Sciences, and Engineering Technician graduates to 22% of Languages & Linguistics, Natural Resources, and Psychology graduates. By Year 10, there was somewhat less variability in the proportions of graduates who worked while pursuing additional education. The proportion of graduates who worked while enrolled in Year 10 ranged from less than 1% of Architecture, Cultural Studies, and Interdisciplinary Studies graduates to 15% of Languages & Linguistics graduates.
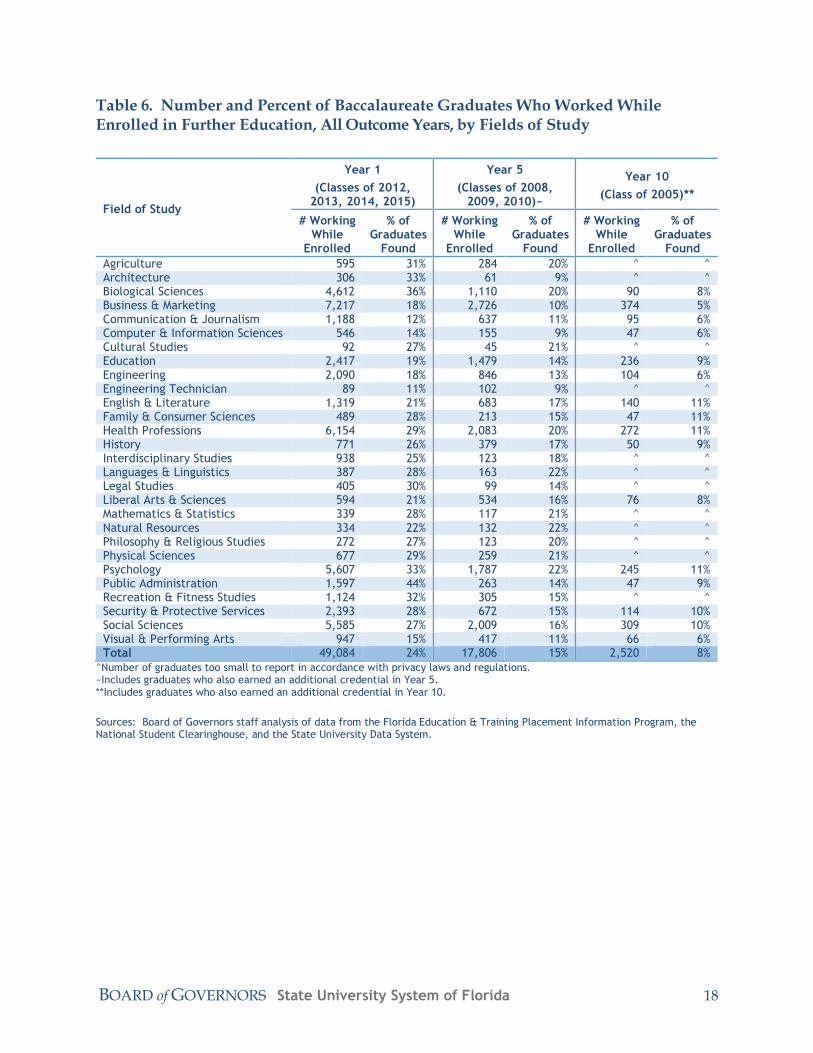
BOARD of GOVERNORS State University System of Florida 18
Table 6. Number and Percent of Baccalaureate Graduates Who Worked While Enrolled in Further Education, All Outcome Years, by Fields of Study
Field of Study
Year 1
(Classes of 2012, 2013, 2014, 2015)
Year 5
(Classes of 2008, 2009, 2010)~
Year 10
(Class of 2005)**
# Working While
Enrolled
% of Graduates
Found
# Working While
Enrolled
% of Graduates
Found
# Working While
Enrolled
% of Graduates
Found
Agriculture 595 31% 284 20% ^ ^ Architecture 306 33% 61 9% ^ ^ Biological Sciences 4,612 36% 1,110 20% 90 8% Business & Marketing 7,217 18% 2,726 10% 374 5% Communication & Journalism 1,188 12% 637 11% 95 6% Computer & Information Sciences 546 14% 155 9% 47 6% Cultural Studies 92 27% 45 21% ^ ^ Education 2,417 19% 1,479 14% 236 9% Engineering 2,090 18% 846 13% 104 6% Engineering Technician 89 11% 102 9% ^ ^ English & Literature 1,319 21% 683 17% 140 11% Family & Consumer Sciences 489 28% 213 15% 47 11% Health Professions 6,154 29% 2,083 20% 272 11% History 771 26% 379 17% 50 9% Interdisciplinary Studies 938 25% 123 18% ^ ^ Languages & Linguistics 387 28% 163 22% ^ ^ Legal Studies 405 30% 99 14% ^ ^ Liberal Arts & Sciences 594 21% 534 16% 76 8% Mathematics & Statistics 339 28% 117 21% ^ ^ Natural Resources 334 22% 132 22% ^ ^ Philosophy & Religious Studies 272 27% 123 20% ^ ^ Physical Sciences 677 29% 259 21% ^ ^ Psychology 5,607 33% 1,787 22% 245 11% Public Administration 1,597 44% 263 14% 47 9% Recreation & Fitness Studies 1,124 32% 305 15% ^ ^ Security & Protective Services 2,393 28% 672 15% 114 10% Social Sciences 5,585 27% 2,009 16% 309 10% Visual & Performing Arts 947 15% 417 11% 66 6% Total 49,084 24% 17,806 15% 2,520 8%
^Number of graduates too small to report in accordance with privacy laws and regulations. ~Includes graduates who also earned an additional credential in Year 5. **Includes graduates who also earned an additional credential in Year 10.
Sources: Board of Governors staff analysis of data from the Florida Education & Training Placement Information Program, the National Student Clearinghouse, and the State University Data System.
BOARD of GOVERNORS State University System of Florida 19
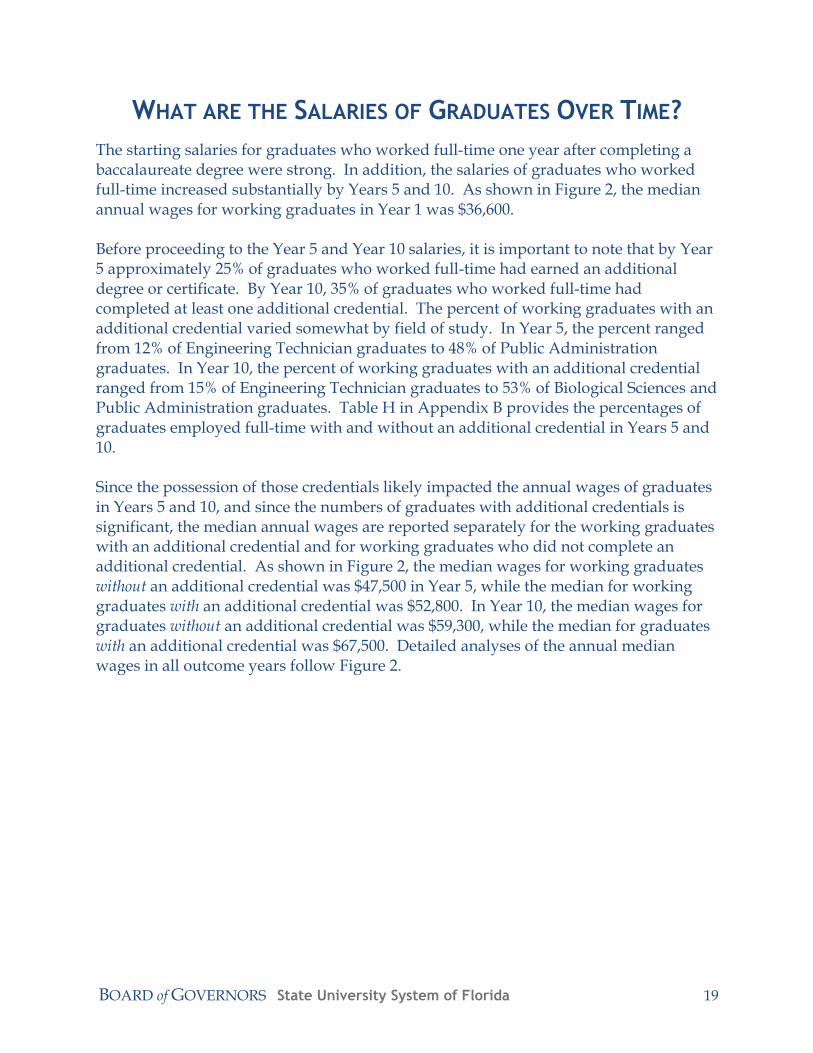
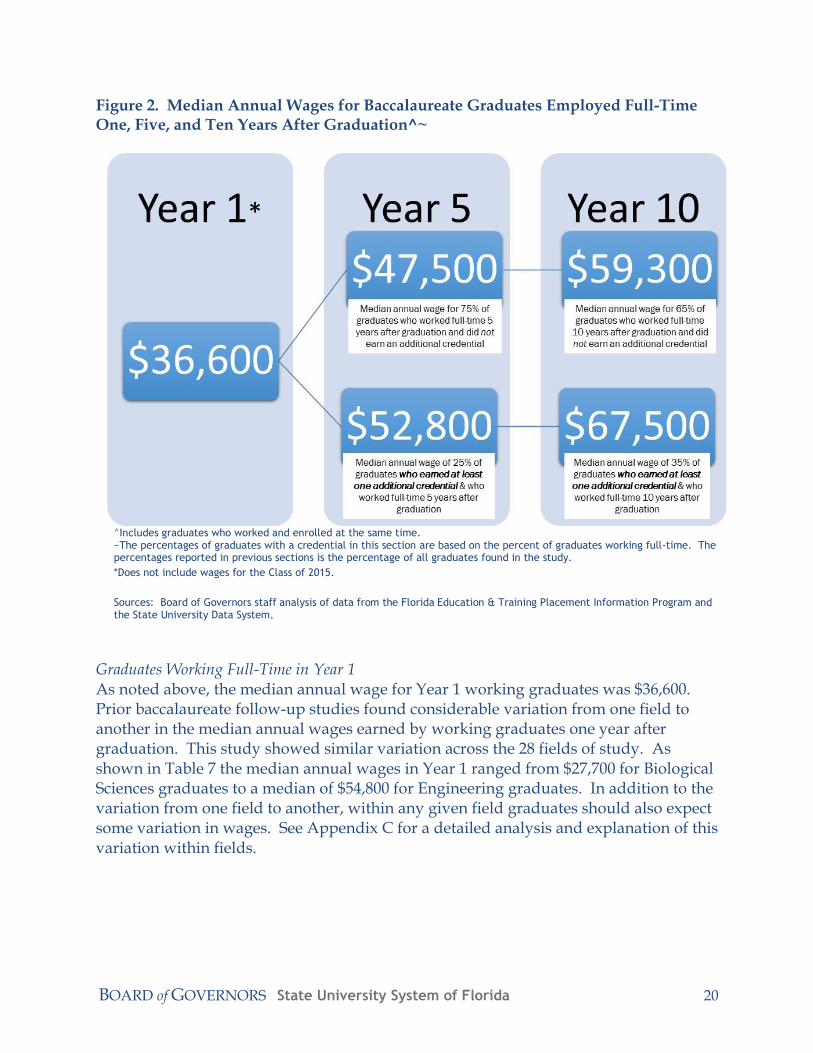
WHAT ARE THE SALARIES OF GRADUATES OVER TIME?
The starting salaries for graduates who worked full-time one year after completing a baccalaureate degree were strong. In addition, the salaries of graduates who worked full-time increased substantially by Years 5 and 10. As shown in Figure 2, the median annual wages for working graduates in Year 1 was $36,600. Before proceeding to the Year 5 and Year 10 salaries, it is important to note that by Year 5 approximately 25% of graduates who worked full-time had earned an additional degree or certificate. By Year 10, 35% of graduates who worked full-time had completed at least one additional credential. The percent of working graduates with an additional credential varied somewhat by field of study. In Year 5, the percent ranged from 12% of Engineering Technician graduates to 48% of Public Administration graduates. In Year 10, the percent of working graduates with an additional credential ranged from 15% of Engineering Technician graduates to 53% of Biological Sciences and Public Administration graduates. Table H in Appendix B provides the percentages of graduates employed full-time with and without an additional credential in Years 5 and 10. Since the possession of those credentials likely impacted the annual wages of graduates in Years 5 and 10, and since the numbers of graduates with additional credentials is significant, the median annual wages are reported separately for the working graduates with an additional credential and for working graduates who did not complete an additional credential. As shown in Figure 2, the median wages for working graduates without an additional credential was $47,500 in Year 5, while the median for working graduates with an additional credential was $52,800. In Year 10, the median wages for graduates without an additional credential was $59,300, while the median for graduates with an additional credential was $67,500. Detailed analyses of the annual median wages in all outcome years follow Figure 2.
BOARD of GOVERNORS State University System of Florida 20
Figure 2. Median Annual Wages for Baccalaureate Graduates Employed Full-Time One, Five, and Ten Years After Graduation^~
^Includes graduates who worked and enrolled at the same time. ~The percentages of graduates with a credential in this section are based on the percent of graduates working full-time. The percentages reported in previous sections is the percentage of all graduates found in the study.
*Does not include wages for the Class of 2015.
Sources: Board of Governors staff analysis of data from the Florida Education & Training Placement Information Program and the State University Data System.
Graduates Working Full-Time in Year 1 As noted above, the median annual wage for Year 1 working graduates was $36,600. Prior baccalaureate follow-up studies found considerable variation from one field to another in the median annual wages earned by working graduates one year after graduation. This study showed similar variation across the 28 fields of study. As shown in Table 7 the median annual wages in Year 1 ranged from $27,700 for Biological Sciences graduates to a median of $54,800 for Engineering graduates. In addition to the variation from one field to another, within any given field graduates should also expect some variation in wages. See Appendix C for a detailed analysis and explanation of this variation within fields.
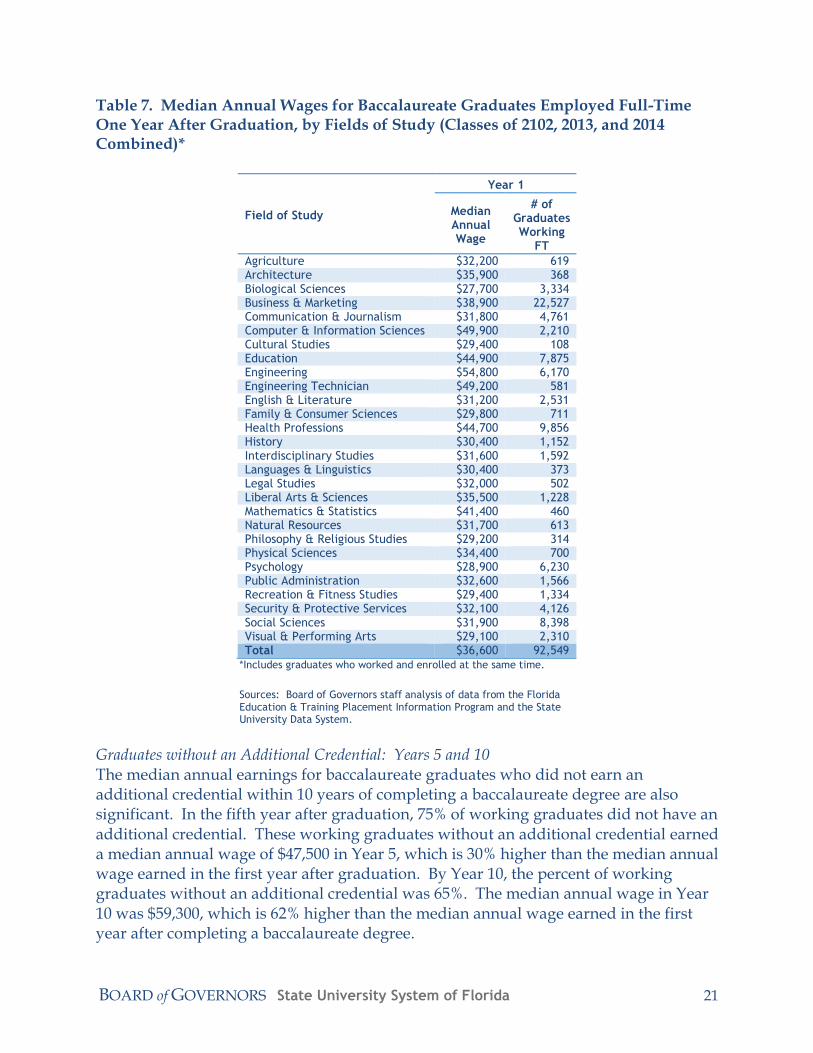
BOARD of GOVERNORS State University System of Florida 21
Table 7. Median Annual Wages for Baccalaureate Graduates Employed Full-Time One Year After Graduation, by Fields of Study (Classes of 2102, 2013, and 2014 Combined)*
Field of Study
Year 1
Median Annual Wage
# of Graduates Working
FT
Agriculture $32,200 619 Architecture $35,900 368 Biological Sciences $27,700 3,334 Business & Marketing $38,900 22,527 Communication & Journalism $31,800 4,761 Computer & Information Sciences $49,900 2,210 Cultural Studies $29,400 108 Education $44,900 7,875 Engineering $54,800 6,170 Engineering Technician $49,200 581 English & Literature $31,200 2,531 Family & Consumer Sciences $29,800 711 Health Professions $44,700 9,856 History $30,400 1,152 Interdisciplinary Studies $31,600 1,592 Languages & Linguistics $30,400 373 Legal Studies $32,000 502 Liberal Arts & Sciences $35,500 1,228 Mathematics & Statistics $41,400 460 Natural Resources $31,700 613 Philosophy & Religious Studies $29,200 314 Physical Sciences $34,400 700 Psychology $28,900 6,230 Public Administration $32,600 1,566 Recreation & Fitness Studies $29,400 1,334 Security & Protective Services $32,100 4,126 Social Sciences $31,900 8,398 Visual & Performing Arts $29,100 2,310 Total $36,600 92,549
*Includes graduates who worked and enrolled at the same time.
Sources: Board of Governors staff analysis of data from the Florida Education & Training Placement Information Program and the State University Data System.
Graduates without an Additional Credential: Years 5 and 10 The median annual earnings for baccalaureate graduates who did not earn an additional credential within 10 years of completing a baccalaureate degree are also significant. In the fifth year after graduation, 75% of working graduates did not have an additional credential. These working graduates without an additional credential earned a median annual wage of $47,500 in Year 5, which is 30% higher than the median annual wage earned in the first year after graduation. By Year 10, the percent of working graduates without an additional credential was 65%. The median annual wage in Year 10 was $59,300, which is 62% higher than the median annual wage earned in the first year after completing a baccalaureate degree.
BOARD of GOVERNORS State University System of Florida 22
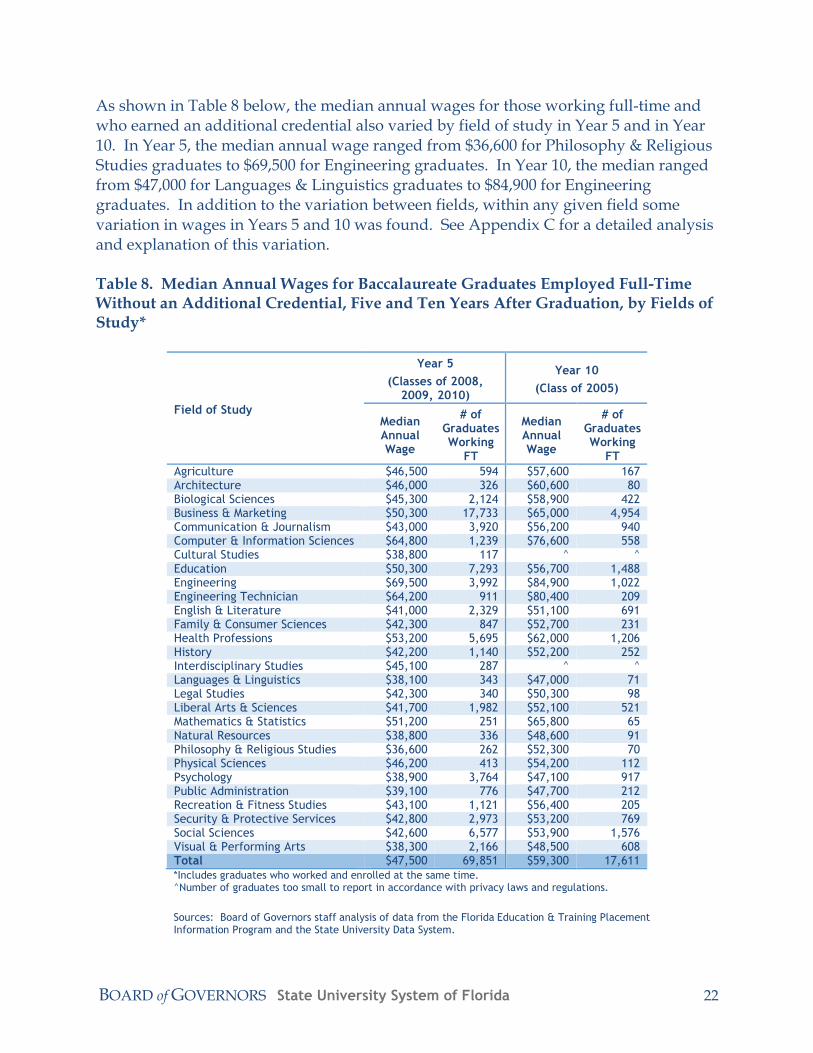
As shown in Table 8 below, the median annual wages for those working full-time and who earned an additional credential also varied by field of study in Year 5 and in Year 10. In Year 5, the median annual wage ranged from $36,600 for Philosophy & Religious Studies graduates to $69,500 for Engineering graduates. In Year 10, the median ranged from $47,000 for Languages & Linguistics graduates to $84,900 for Engineering graduates. In addition to the variation between fields, within any given field some variation in wages in Years 5 and 10 was found. See Appendix C for a detailed analysis and explanation of this variation. Table 8. Median Annual Wages for Baccalaureate Graduates Employed Full-Time Without an Additional Credential, Five and Ten Years After Graduation, by Fields of Study*
Field of Study
Year 5
(Classes of 2008, 2009, 2010)
Year 10
(Class of 2005)
Median Annual Wage
# of Graduates Working
FT
Median Annual Wage
# of Graduates Working
FT
Agriculture $46,500 594 $57,600 167 Architecture $46,000 326 $60,600 80 Biological Sciences $45,300 2,124 $58,900 422 Business & Marketing $50,300 17,733 $65,000 4,954 Communication & Journalism $43,000 3,920 $56,200 940 Computer & Information Sciences $64,800 1,239 $76,600 558 Cultural Studies $38,800 117 ^ ^ Education $50,300 7,293 $56,700 1,488 Engineering $69,500 3,992 $84,900 1,022 Engineering Technician $64,200 911 $80,400 209 English & Literature $41,000 2,329 $51,100 691 Family & Consumer Sciences $42,300 847 $52,700 231 Health Professions $53,200 5,695 $62,000 1,206 History $42,200 1,140 $52,200 252 Interdisciplinary Studies $45,100 287 ^ ^ Languages & Linguistics $38,100 343 $47,000 71 Legal Studies $42,300 340 $50,300 98 Liberal Arts & Sciences $41,700 1,982 $52,100 521 Mathematics & Statistics $51,200 251 $65,800 65 Natural Resources $38,800 336 $48,600 91 Philosophy & Religious Studies $36,600 262 $52,300 70 Physical Sciences $46,200 413 $54,200 112 Psychology $38,900 3,764 $47,100 917 Public Administration $39,100 776 $47,700 212 Recreation & Fitness Studies $43,100 1,121 $56,400 205 Security & Protective Services $42,800 2,973 $53,200 769 Social Sciences $42,600 6,577 $53,900 1,576 Visual & Performing Arts $38,300 2,166 $48,500 608 Total $47,500 69,851 $59,300 17,611
*Includes graduates who worked and enrolled at the same time. ^Number of graduates too small to report in accordance with privacy laws and regulations.
Sources: Board of Governors staff analysis of data from the Florida Education & Training Placement Information Program and the State University Data System.
BOARD of GOVERNORS State University System of Florida 23
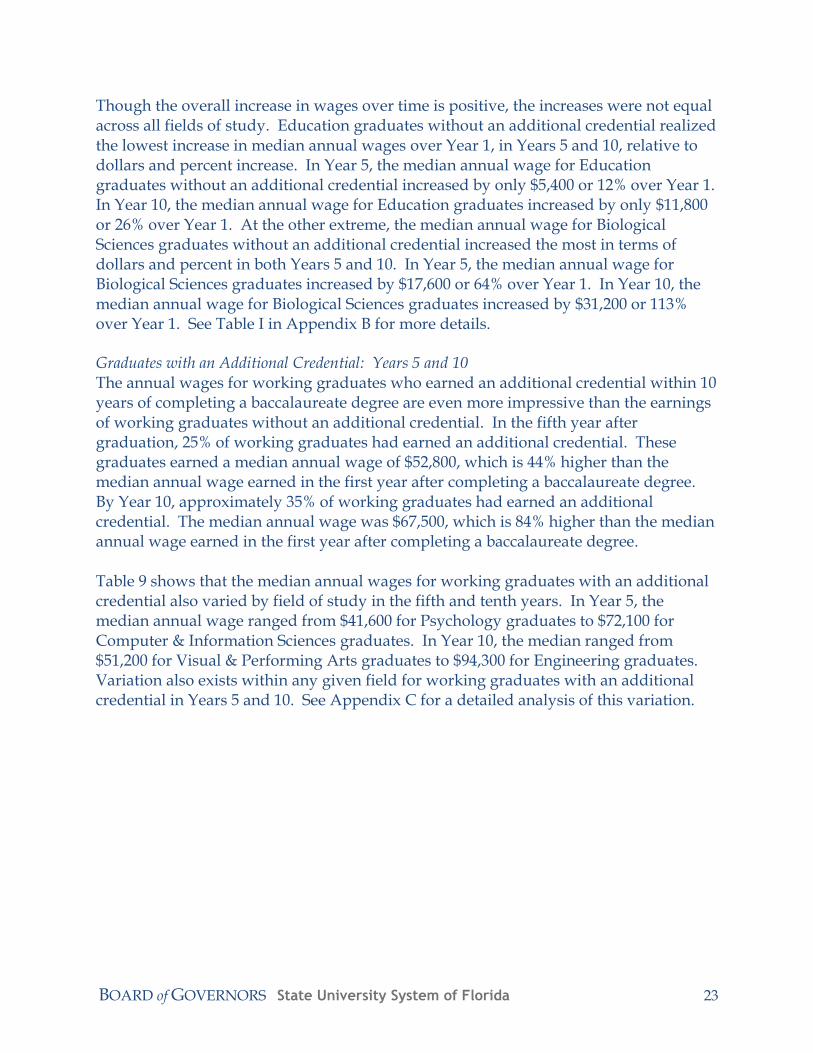
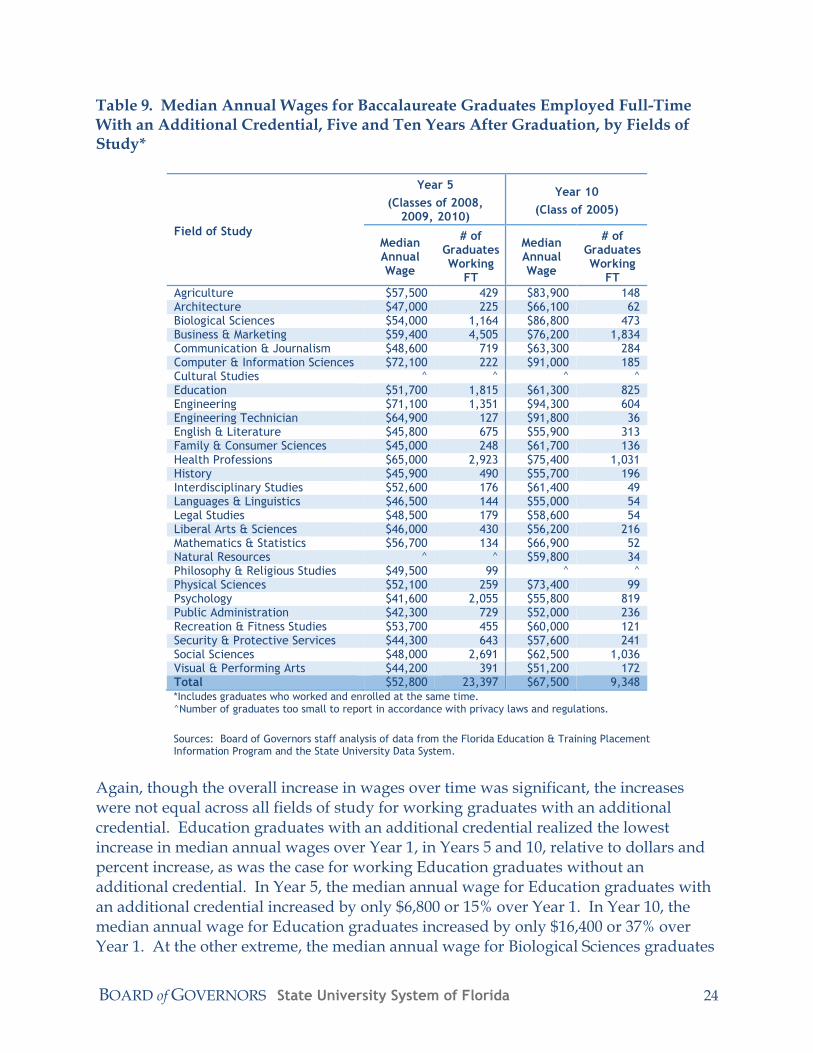
Though the overall increase in wages over time is positive, the increases were not equal across all fields of study. Education graduates without an additional credential realized the lowest increase in median annual wages over Year 1, in Years 5 and 10, relative to dollars and percent increase. In Year 5, the median annual wage for Education graduates without an additional credential increased by only $5,400 or 12% over Year 1. In Year 10, the median annual wage for Education graduates increased by only $11,800 or 26% over Year 1. At the other extreme, the median annual wage for Biological Sciences graduates without an additional credential increased the most in terms of dollars and percent in both Years 5 and 10. In Year 5, the median annual wage for Biological Sciences graduates increased by $17,600 or 64% over Year 1. In Year 10, the median annual wage for Biological Sciences graduates increased by $31,200 or 113% over Year 1. See Table I in Appendix B for more details. Graduates with an Additional Credential: Years 5 and 10 The annual wages for working graduates who earned an additional credential within 10 years of completing a baccalaureate degree are even more impressive than the earnings of working graduates without an additional credential. In the fifth year after graduation, 25% of working graduates had earned an additional credential. These graduates earned a median annual wage of $52,800, which is 44% higher than the median annual wage earned in the first year after completing a baccalaureate degree. By Year 10, approximately 35% of working graduates had earned an additional credential. The median annual wage was $67,500, which is 84% higher than the median annual wage earned in the first year after completing a baccalaureate degree. Table 9 shows that the median annual wages for working graduates with an additional credential also varied by field of study in the fifth and tenth years. In Year 5, the median annual wage ranged from $41,600 for Psychology graduates to $72,100 for Computer & Information Sciences graduates. In Year 10, the median ranged from $51,200 for Visual & Performing Arts graduates to $94,300 for Engineering graduates. Variation also exists within any given field for working graduates with an additional credential in Years 5 and 10. See Appendix C for a detailed analysis of this variation.
BOARD of GOVERNORS State University System of Florida 24
Table 9. Median Annual Wages for Baccalaureate Graduates Employed Full-Time With an Additional Credential, Five and Ten Years After Graduation, by Fields of Study*
Field of Study
Year 5
(Classes of 2008, 2009, 2010)
Year 10
(Class of 2005)
Median Annual Wage
# of Graduates Working
FT
Median Annual Wage
# of Graduates Working
FT
Agriculture $57,500 429 $83,900 148 Architecture $47,000 225 $66,100 62 Biological Sciences $54,000 1,164 $86,800 473 Business & Marketing $59,400 4,505 $76,200 1,834 Communication & Journalism $48,600 719 $63,300 284 Computer & Information Sciences $72,100 222 $91,000 185 Cultural Studies ^ ^ ^ ^ Education $51,700 1,815 $61,300 825 Engineering $71,100 1,351 $94,300 604 Engineering Technician $64,900 127 $91,800 36 English & Literature $45,800 675 $55,900 313 Family & Consumer Sciences $45,000 248 $61,700 136 Health Professions $65,000 2,923 $75,400 1,031 History $45,900 490 $55,700 196 Interdisciplinary Studies $52,600 176 $61,400 49 Languages & Linguistics $46,500 144 $55,000 54 Legal Studies $48,500 179 $58,600 54 Liberal Arts & Sciences $46,000 430 $56,200 216 Mathematics & Statistics $56,700 134 $66,900 52 Natural Resources ^ ^ $59,800 34 Philosophy & Religious Studies $49,500 99 ^ ^ Physical Sciences $52,100 259 $73,400 99 Psychology $41,600 2,055 $55,800 819 Public Administration $42,300 729 $52,000 236 Recreation & Fitness Studies $53,700 455 $60,000 121 Security & Protective Services $44,300 643 $57,600 241 Social Sciences $48,000 2,691 $62,500 1,036 Visual & Performing Arts $44,200 391 $51,200 172 Total $52,800 23,397 $67,500 9,348 *Includes graduates who worked and enrolled at the same time. ^Number of graduates too small to report in accordance with privacy laws and regulations.
Sources: Board of Governors staff analysis of data from the Florida Education & Training Placement Information Program and the State University Data System.
Again, though the overall increase in wages over time was significant, the increases were not equal across all fields of study for working graduates with an additional credential. Education graduates with an additional credential realized the lowest increase in median annual wages over Year 1, in Years 5 and 10, relative to dollars and percent increase, as was the case for working Education graduates without an additional credential. In Year 5, the median annual wage for Education graduates with an additional credential increased by only $6,800 or 15% over Year 1. In Year 10, the median annual wage for Education graduates increased by only $16,400 or 37% over Year 1. At the other extreme, the median annual wage for Biological Sciences graduates
BOARD of GOVERNORS State University System of Florida 25
with an additional credential increased the most in terms dollars and percent in both Years 5 and 10, as was the case for working Biological Sciences graduates without an additional credential. In Year 5, the median annual wage for Biological Sciences graduates increased by $26,300 or 95% over Year 1. In Year 10, the median annual wage for Biological Sciences graduates increased by $59,100 or 213% over Year 1. See Table J in Appendix B for more details. Graduates With and Without an Additional Credential: A Comparison of Years 5 and 10 As previously stated, the wages of working graduates with an additional credential were higher than the wages of those without an additional credential. In Year 5, the median annual wages for all working graduates with an additional credential ($52,800) was $5,300 higher than the median for those without ($47,500). In Year 10, the median annual wages for all working graduates with an additional credential ($67,500) was $8,200 higher than the median for those without ($59,300). It is also important to note that the differences in median annual wages for working graduates with an additional credential compared to those without varied widely across the 28 fields of study, as shown in Table 10. In Year 5, the median annual wage for Engineering Technician graduates working full-time was the nearly same for graduates with an additional credential and those without. At the same time, the Year 5 median annual wage for Philosophy & Religious Studies graduates with a credential ($49,500) was $12,900 higher than the median for those without ($36,600). Similar differences were observed in the Year 10 median annual salaries for working graduates.
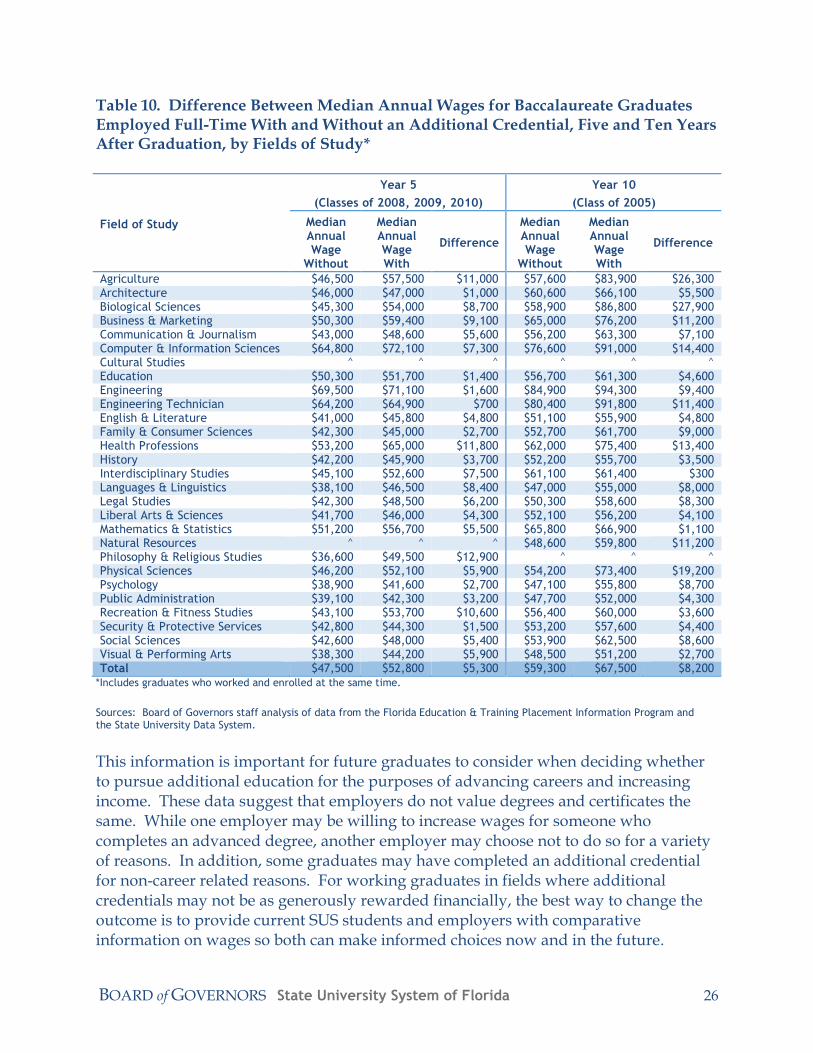
BOARD of GOVERNORS State University System of Florida 26
Table 10. Difference Between Median Annual Wages for Baccalaureate Graduates Employed Full-Time With and Without an Additional Credential, Five and Ten Years After Graduation, by Fields of Study*
Field of Study
Year 5
(Classes of 2008, 2009, 2010)
Year 10
(Class of 2005)
Median Annual Wage
Without
Median Annual Wage With
Difference
Median Annual Wage
Without
Median Annual Wage With
Difference
Agriculture $46,500 $57,500 $11,000 $57,600 $83,900 $26,300 Architecture $46,000 $47,000 $1,000 $60,600 $66,100 $5,500 Biological Sciences $45,300 $54,000 $8,700 $58,900 $86,800 $27,900 Business & Marketing $50,300 $59,400 $9,100 $65,000 $76,200 $11,200 Communication & Journalism $43,000 $48,600 $5,600 $56,200 $63,300 $7,100 Computer & Information Sciences $64,800 $72,100 $7,300 $76,600 $91,000 $14,400 Cultural Studies ^ ^ ^ ^ ^ ^ Education $50,300 $51,700 $1,400 $56,700 $61,300 $4,600 Engineering $69,500 $71,100 $1,600 $84,900 $94,300 $9,400 Engineering Technician $64,200 $64,900 $700 $80,400 $91,800 $11,400 English & Literature $41,000 $45,800 $4,800 $51,100 $55,900 $4,800 Family & Consumer Sciences $42,300 $45,000 $2,700 $52,700 $61,700 $9,000 Health Professions $53,200 $65,000 $11,800 $62,000 $75,400 $13,400 History $42,200 $45,900 $3,700 $52,200 $55,700 $3,500 Interdisciplinary Studies $45,100 $52,600 $7,500 $61,100 $61,400 $300 Languages & Linguistics $38,100 $46,500 $8,400 $47,000 $55,000 $8,000 Legal Studies $42,300 $48,500 $6,200 $50,300 $58,600 $8,300 Liberal Arts & Sciences $41,700 $46,000 $4,300 $52,100 $56,200 $4,100 Mathematics & Statistics $51,200 $56,700 $5,500 $65,800 $66,900 $1,100 Natural Resources ^ ^ ^ $48,600 $59,800 $11,200 Philosophy & Religious Studies $36,600 $49,500 $12,900 ^ ^ ^ Physical Sciences $46,200 $52,100 $5,900 $54,200 $73,400 $19,200 Psychology $38,900 $41,600 $2,700 $47,100 $55,800 $8,700 Public Administration $39,100 $42,300 $3,200 $47,700 $52,000 $4,300 Recreation & Fitness Studies $43,100 $53,700 $10,600 $56,400 $60,000 $3,600 Security & Protective Services $42,800 $44,300 $1,500 $53,200 $57,600 $4,400 Social Sciences $42,600 $48,000 $5,400 $53,900 $62,500 $8,600 Visual & Performing Arts $38,300 $44,200 $5,900 $48,500 $51,200 $2,700 Total $47,500 $52,800 $5,300 $59,300 $67,500 $8,200
*Includes graduates who worked and enrolled at the same time.
Sources: Board of Governors staff analysis of data from the Florida Education & Training Placement Information Program and the State University Data System.
This information is important for future graduates to consider when deciding whether to pursue additional education for the purposes of advancing careers and increasing income. These data suggest that employers do not value degrees and certificates the same. While one employer may be willing to increase wages for someone who completes an advanced degree, another employer may choose not to do so for a variety of reasons. In addition, some graduates may have completed an additional credential for non-career related reasons. For working graduates in fields where additional credentials may not be as generously rewarded financially, the best way to change the outcome is to provide current SUS students and employers with comparative information on wages so both can make informed choices now and in the future.
BOARD of GOVERNORS State University System of Florida 27
CONCLUSION
The results of this study are positive for individuals who complete a baccalaureate degree from Florida’s state universities and for the SUS as a whole. The majority of graduates were employed one, five, and ten years after graduation and with earnings that increase over time. A significant number of graduates continued to pursue additional education and many completed at least one additional credential. By the fifth year after completing a baccalaureate degree, 30% of graduates had earned at least one additional credential. By Year 10, 44% of graduates had completed at least one credential. Over time, the proportion who pursued additional education declined as graduates completed additional credentials, while the proportion of graduates who worked increased. This shift was particularly apparent in several fields of study, such as Agriculture, Biological Sciences, and Physical Sciences. This shift is appropriate since graduates do not need to enroll in further education once certain educational and employment goals are met. Relative to salaries, SUS baccalaureate graduates do very well regardless of whether of additional credential(s) are earned or not. The Year 1 median annual wage was $36,600 and the Year 10 the median was $59,300 for working graduates without an additional credential and $67,500 for working graduates with an additional credential. Graduates in all fields of study earned increasingly higher wages in Years 5 and 10, although the increases were not equal across all fields of study. Like the three previous baccalaureate follow-up studies, this study was designed to be replicated in order to provide critical information about the employment and education outcomes of SUS graduates over time. This study also complements the Board’s other planning tools and can be used to inform system-wide strategic planning efforts. In addition, this information has implications for a broader audience that includes current and future SUS students, SUS alumni, SUS faculty and staff, employers, and policy makers.
BOARD of GOVERNORS State University System of Florida 28
APPENDIX A: TECHNICAL NOTES
1. Data Limitations
The current study was based on individual-level data for 423,699 graduates from the State University Data System (SUDS). These records were matched to records in the National Student Clearinghouse (NSC) and the Florida Education and Training Placement Information Program (FETPIP). These data sources have several limitations that impacted the methodology used for the current study and the way in which the findings were presented in this report. National Student Clearinghouse
The NSC database included records from 3,700 colleges and universities nationwide. These institutions enrolled 98% of all students in public and private U.S. institutions in any given academic year. While this database is comprehensive, some SUS graduates may have pursued additional education at a college or university that does not report data to NSC or at a college or university outside the U.S. The number of graduates pursuing additional education at one of these types of institutions is likely minimal. However, it is impossible to say with certainty that a graduate not found in the NSC database was not enrolled. Impact of NSC Data Limitations on the Current Study
Data provided by NSC does not include several key data elements that would further enhance the baccalaureate follow-up studies. First, the NSC data does not include the number of credit hours or other measures of enrollment intensity that would indicate whether individuals enroll full- or part-time. This information, if available, would be useful in understanding the extent to which graduates work while pursuing additional education. The NSC data also does not include the field of study, which would indicate whether students continue to study in the same field or in a different field. Finally, NSC data does not include the type of additional education SUS graduates pursued. Most graduates likely enrolled in advanced educational programs, although others may have enrolled in a certificate, associate’s degree, or another baccalaureate degree program. Since the current study included graduating classes that had previously been studied, it is important to note that there are several reasons why the education outcomes reported here may differ from the education outcomes previously reported for the classes of 2012, 2014, and 2015. First, institutions are permitted to submit corrections to NSC. Second, institutions are also permitted to submit historical data that might not have been submitted to NSC at the time the prior studies were conducted. Third, additional institutions may have opted to submit data to NSC since the prior studies were conducted. Finally, NSC staff regularly assess and revise the processes and protocols used to review and validate institutional and internal data files in order to improve the quality of the data. As a result of these types of changes to the NSC data, the number
BOARD of GOVERNORS State University System of Florida 29
and percentages of SUS graduates from the classes of 2012, 2014, and 2015 who pursued additional education may differ somewhat from the numbers in previous studies. Florida Education and Training Placement Information Program
The employment data for this study was provided by the Florida Education and Training Placement Information Program (FETPIP), housed with the Florida Department of Education. FETPIP, through an agreement with the Florida Department of Economic Opportunity (DEO), had access to Florida’s Unemployment Insurance (UI) database and the national Wage Record Interchange System 2 (WRIS 2) for the purpose of providing “follow-up data on former students and program participants who have graduated, exited or completed a public education or training program within the State of Florida” (see Florida Statutes Section 1008.39). FETPIP also had access to federal employment data from the U.S. Office of Personnel Management (OPM). Wage Record Interchange System 2
State participation in WRIS 2 is voluntary. The database used for this report contained employment data for up to 41 states, as well as the District of Columbia and Puerto Rico, depending on the timeframe used to determine the employment outcomes. Even though a state may have participated at the time this study was conducted, data may not have been submitted for the time period(s) required for the study. However, there were no significant impacts to the employment outcomes of the SUS graduates as a result of these variations in state participation or availability of data. For the Class of 2012 Year 1 and the Class of 2008 Year 5 outcomes, data from the 29 states listed below, as well as the District of Columbia and Puerto Rico, was available.
Arkansas, Delaware, Florida, Idaho, Illinois, Indiana, Iowa, Kansas, Kentucky, Louisiana, Maryland, Minnesota, Mississippi, Missouri, Nebraska, Nevada, New Jersey, New Mexico, North Carolina, Ohio, Oklahoma, Oregon, Pennsylvania, Rhode Island, South Dakota, Tennessee, Texas, Utah, Wyoming
For the Class of 2013 Year 1 and the Class of 2009 Year 5 outcomes, data from the 38 states listed below, as well as the District of Columbia and Puerto Rico, was available.
Alaska, Arizona, Arkansas, Connecticut, Delaware, Florida, Idaho, Illinois, Indiana, Iowa, Kansas, Kentucky, Louisiana, Maine, Maryland, Michigan, Minnesota, Mississippi, Missouri, Nebraska, Nevada, New Jersey, New Mexico, North Carolina, Ohio, Oklahoma, Oregon, Pennsylvania, Rhode Island, South Carolina, South Dakota, Tennessee, Texas, Utah, Virginia, Washington, Wisconsin, Wyoming
BOARD of GOVERNORS State University System of Florida 30
For the Class of 2014 Year 1, the Class of 2010 Year 5, and the Class of 2005 Year 10 outcomes, data from the 40 states listed below, as well as the District of Columbia and Puerto Rico, was available.
Alaska, Arizona, Arkansas, Connecticut, Delaware, Florida, Idaho, Illinois, Indiana, Iowa, Kansas, Kentucky, Louisiana, Maine, Maryland, Michigan, Minnesota, Mississippi, Missouri, Nebraska, Nevada, New Jersey, New Mexico, North Carolina, North Dakota, Ohio, Oklahoma, Oregon, Pennsylvania, Rhode Island, South Carolina, South Dakota, Tennessee, Texas, Utah, Vermont, Virginia, Washington, Wisconsin, Wyoming
For the Class of 2015 Year 1 outcomes, data from the 41 states listed below, as well as the District of Columbia and Puerto Rico, was available.
Alaska, Arizona, Arkansas, Connecticut, Delaware, Florida, Georgia, Idaho, Illinois, Indiana, Iowa, Kansas, Kentucky, Louisiana, Maine, Maryland, Michigan, Minnesota, Mississippi, Missouri, Nebraska, Nevada, New Jersey, New Mexico, North Carolina, North Dakota, Ohio, Oklahoma, Oregon, Pennsylvania, Rhode Island, South Carolina, South Dakota, Tennessee, Texas, Utah, Vermont, Virginia, Washington, Wisconsin, Wyoming
It is important to note that several states with significant populations had not submitted data to the WRIS 2 database at the time this study was conducted. Montana and New Hampshire were listed as participants in WRIS 2 at the time this study was conducted,
however data from these states was not yet available. The following states did not
participate in WRIS 2: Alabama, California, Colorado, Hawaii, Massachusetts, New York, and West Virginia. The Florida UI database and the WRIS 2 database also do not contain information for all individuals who actually worked. Individuals not reported include those who: 1) are self-employed, 2) are employed in temporary positions not eligible for unemployment insurance, 3) are employed in states that do not participate in WRIS 2, 4) are employed by the military or federal government, or 5) do not have a valid Social Security number. Jobs that are exempt or otherwise not covered by unemployment insurance also are not included in the Florida UI database and the WRIS 2 databases. These include self-employed nonagricultural workers, unpaid family workers, insurance agents paid solely by commission, and employees of religious organizations. Some state and local government workers - such as those who work at state colleges, universities, elementary and secondary schools - may also have been excluded. In addition to the above limitations, at any given time the WRIS 2 database only contains three years of employment data. This is the primary reason that outcomes one,
BOARD of GOVERNORS State University System of Florida 31
five, and ten years after graduation cannot be obtained for a single graduating class, such as the Class of 2005. At the time this study was conducted, data for the Class of 2005 was only available for eight, nine, or ten years after graduation. There are two final limitations of the WRIS 2 data. First, most state labor departments do not require employers to report the number of hours worked. Full and part-time status can be approximated by calculating an annualized minimum wage, which is a method commonly used by other states. For details refer to the definition of “working full-time” provided in the Methodological Notes section of this appendix. Most state labor departments also do not require employers to report the occupation in which employees work. U.S. Office of Personnel Management
As previously noted, FETPIP also had an agreement OPM, which enabled them to access employment information for approximately 96% of all Federal civilian non-Postal Executive Branch employees. However, the following agencies do not provide data for the OPM database.
Federal Reserve Board of Governors, Central Intelligence Agency, Defense Intelligence Agency, Foreign Service personnel at the State Department, National Geospatial-Intelligence Agency, National Security Agency, Office of the Director of National Intelligence, Office of the Vice President, Postal Regulatory Commission, Tennessee Valley Authority, U.S. Postal Service, White House Office
The OPM database also does not include foreign nationals overseas, Public Health Service's Commissioned Officer Corps, non-appropriated fund employees, or the Judicial Branch. In addition, the only Legislative Branch entities that provide data to OPM are the Dwight D. Eisenhower Memorial Commission, the Financial Crisis Inquiry Commission, the Government Printing Office, the Medicare Payment Advisory Commission, the Ronald Reagan Centennial Commission, the U.S. - China Economic and Security Review Commission, the U.S. Commission on International Religious Freedom, and the U.S. Tax Court. Finally, like WRIS 2, the OPM database does not include number of hours worked or occupation information. Impact of WRIS 2 and OPM Data Limitations on the Current Study
As a result of the limitations described above, the most direct impact on the current study is that it is impossible to be certain that the SUS graduates not found in the WRIS 2 or OPM databases were not employed.
BOARD of GOVERNORS State University System of Florida 32
Since the current study included graduating classes for which the Board had previously conducted baccalaureate follow-up studies based on WRIS 2 data, it is important to note that there are several reasons why the employment outcomes reported here may differ from previous reports for the classes of 2014 and 2015. First, states that had participated in WRIS 2 may have decided to submit historical data to the database since the prior studies were conducted. Second, additional states may have joined WRIS 2 since the prior studies were conducted and may have submitted data for the time periods needed for the current study that may not have been available when the previous studies were conducted. Finally, employers and state labor departments are allowed to submit revised data. As a result of these types of changes to the WRIS 2 data, the number and percentages of SUS graduates from the classes of 2014 and 2015 who were employed and the annual wages may differ somewhat from the data reported in previous studies.
2. Protecting Privacy
State and federal privacy laws and regulations directly influenced the way in which data were displayed. To ensure compliance, cell sizes with less than 10 individuals were not displayed. Median wage amounts were also rounded to the nearest hundred to protect privacy. The agreement that enabled FETPIP to access the employment data provided by DEO also created two significant limitations that affected the way in which data were presented in this report. First, the agreement did not allow any employment records to be attached to certain identifying elements such as race and gender to be returned to the data requestor -- in this instance Board staff. Second, WRIS 2 data could only be provided back to Board staff in aggregate form. These restrictions limited the current study to providing only descriptive statistics, rather than more sophisticated statistical analyses that could determine whether statistically significant differences in outcomes existed between graduates with different characteristics (e.g., race/ethnicity, gender). Though this report did not include outcomes by race/ethnicity or gender, those data will be provided in a future report or information brief and be limited to descriptive statistics for the reasons cited above.
3. Methodological Notes
Academic Year and Classes
Academic Years and Classes were defined as outlined in the table below.
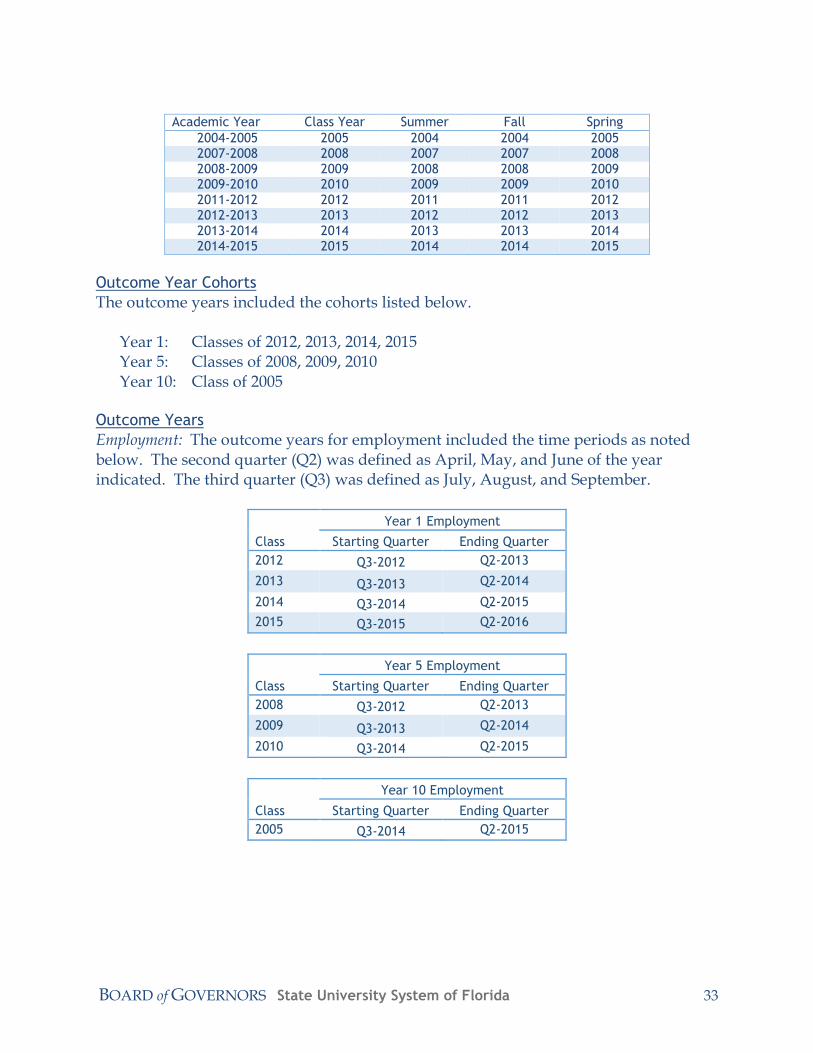
BOARD of GOVERNORS State University System of Florida 33
Academic Year Class Year Summer Fall Spring
2004-2005 2005 2004 2004 2005 2007-2008 2008 2007 2007 2008 2008-2009 2009 2008 2008 2009 2009-2010 2010 2009 2009 2010 2011-2012 2012 2011 2011 2012 2012-2013 2013 2012 2012 2013 2013-2014 2014 2013 2013 2014 2014-2015 2015 2014 2014 2015
Outcome Year Cohorts
The outcome years included the cohorts listed below.
Year 1: Classes of 2012, 2013, 2014, 2015 Year 5: Classes of 2008, 2009, 2010 Year 10: Class of 2005
Outcome Years
Employment: The outcome years for employment included the time periods as noted below. The second quarter (Q2) was defined as April, May, and June of the year indicated. The third quarter (Q3) was defined as July, August, and September.
Class
Year 1 Employment
Starting Quarter Ending Quarter
2012 Q3-2012 Q2-2013
2013 Q3-2013 Q2-2014
2014 Q3-2014 Q2-2015
2015 Q3-2015 Q2-2016
Class
Year 5 Employment
Starting Quarter Ending Quarter
2008 Q3-2012 Q2-2013
2009 Q3-2013 Q2-2014
2010 Q3-2014 Q2-2015
Class
Year 10 Employment
Starting Quarter Ending Quarter
2005 Q3-2014 Q2-2015
BOARD of GOVERNORS State University System of Florida 34
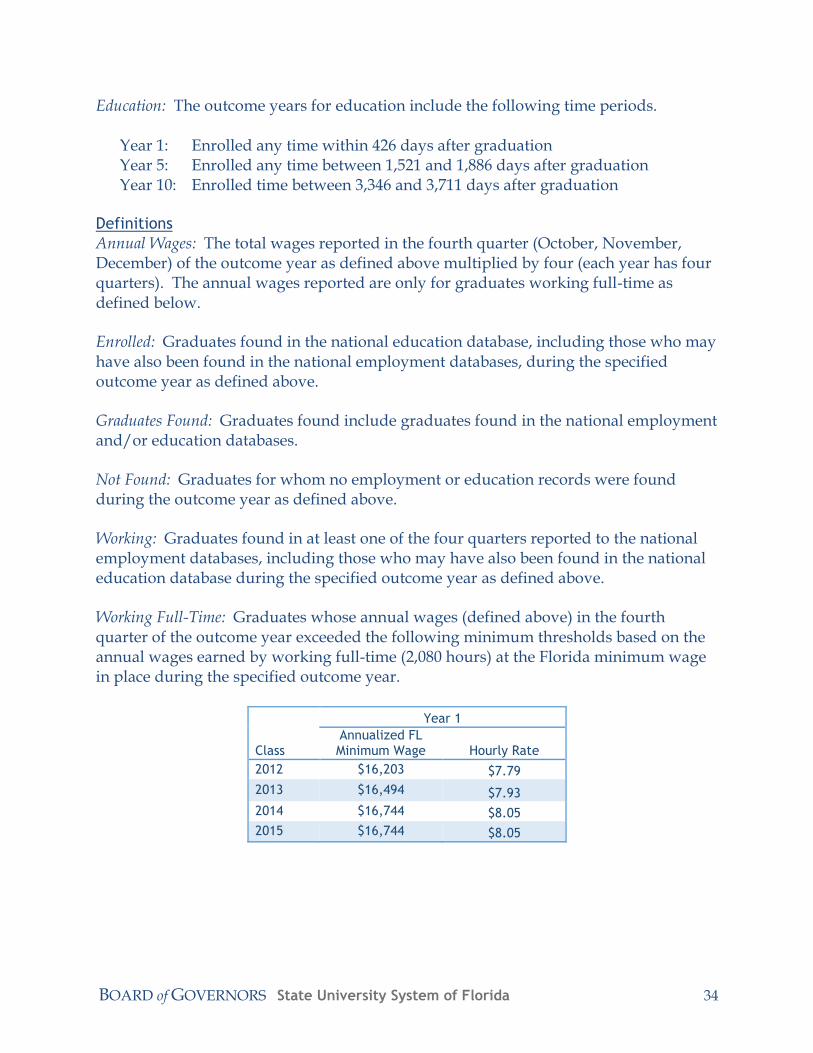
Education: The outcome years for education include the following time periods. Year 1: Enrolled any time within 426 days after graduation Year 5: Enrolled any time between 1,521 and 1,886 days after graduation Year 10: Enrolled time between 3,346 and 3,711 days after graduation
Definitions
Annual Wages: The total wages reported in the fourth quarter (October, November, December) of the outcome year as defined above multiplied by four (each year has four quarters). The annual wages reported are only for graduates working full-time as defined below. Enrolled: Graduates found in the national education database, including those who may have also been found in the national employment databases, during the specified outcome year as defined above. Graduates Found: Graduates found include graduates found in the national employment and/or education databases. Not Found: Graduates for whom no employment or education records were found during the outcome year as defined above. Working: Graduates found in at least one of the four quarters reported to the national employment databases, including those who may have also been found in the national education database during the specified outcome year as defined above. Working Full-Time: Graduates whose annual wages (defined above) in the fourth quarter of the outcome year exceeded the following minimum thresholds based on the annual wages earned by working full-time (2,080 hours) at the Florida minimum wage in place during the specified outcome year.
Class
Year 1
Annualized FL Minimum Wage Hourly Rate
2012 $16,203 $7.79
2013 $16,494 $7.93
2014 $16,744 $8.05
2015 $16,744 $8.05
BOARD of GOVERNORS State University System of Florida 35
Class
Year 5
Annualized FL Minimum Wage Hourly Rate
2008 $16,203 $7.79
2009 $16,494 $7.93
2010 $16,744 $8.05
Class
Year 10
Annualized FL Minimum Wage Hourly Rate
2005 $16,744 $8.05
Working & Enrolled: Graduates found in both the employment databases and the national education database during the same specified outcome year as defined above.
4. Enhancements to the Baccalaureate Follow-Up Study Over Time
Graduate Follow-up Study: Baccalaureate Class of 2012, First Year Outcomes
The pilot study for the Class of 2012 utilized data from the State University Data System, the National Student Clearinghouse, and Florida’s Unemployment Insurance database. As a result, the employment outcomes only included graduates working in Florida. The pilot study also separated graduates who worked while pursuing additional education from the analysis of working graduates and from the analysis of graduates who pursued additional education -- resulting in an under-reporting of graduates in those two sets of analyses. The pilot study included outcomes by race/ethnicity but not outcomes by gender. Baccalaureate Follow-Up Study: Class of 2014
The Class of 2014 study was significantly enhanced through the utilization of WRIS 2 and OPM employment information. These data sources provided the ability to determine employment outcomes of graduates working in other states and in some Federal civilian positions. This study also included analyses by gender in addition to race/ethnicity. Finally, to ensure that the number of graduates who worked and the number of graduates who pursued additional education were not understated, graduates who worked while pursuing additional education were counted among the total number of graduates who worked and the total number of graduates who pursued additional education. Baccalaureate Follow-Up Study: Class of 2015
The Class of 2015 study retained all of the enhancements put in place for the Class of 2014 study. This provided the opportunity to include a comparison of the outcomes for the Class of 2015 to the outcomes for the Class of 2014.
BOARD of GOVERNORS State University System of Florida 36
The Current Baccalaureate Follow-Up Study
The current study retained all of the enhancements made to the Class of 2014 and Class of 2015 studies. In addition, the current study incorporated employment information from WRIS 2 and OPM for the Class of 2012, which as noted above only utilized Florida employment data. The current study also included Year 1 outcomes for the Class of 2013 to fill in the gap between the Class of 2012 and Class of 2014 studies. As previously noted, the employment and education outcomes for the classes of 2012, 2014, and 2015 as reported here may differ also from the outcomes reported in prior studies as a result of changes to the national employment and education databases described above. Though the current report did not include outcomes by race/ethnicity or gender, those data will be provided in a future report or information brief.
BOARD of GOVERNORS State University System of Florida 37
APPENDIX B: SUPPLEMENTAL TABLES
Table A. Number and Percent of Baccalaureate Graduates Who Worked 39
and/or Enrolled, by Outcome Year and by Fields of Study
Table B. Employment and Education Outcomes of Baccalaureate Graduates 40
One Year After Graduation, by Fields of Study, Classes of 2012, 2013, 2014 and
2015 Combined
Table C. Employment and Education Outcomes of Baccalaureate Graduates 41
Five Years After Graduation, by Fields of Study, Classes of 2008, 2009, and 2010
Combined
Table D. Employment and Education Outcomes of Baccalaureate Graduates 42
Ten Years After Graduation, by Fields of Study, Class of 2005
Table E. Number and Percent of Baccalaureate Graduates Who Worked 43
and/or Enrolled One Year After Graduation, by Fields of Study,
Classes of 2012 and 2013
Table F. Number and Percent of Baccalaureate Graduates Who Worked 44
and/or Enrolled One Year After Graduation, by Fields of Study,
Classes of 2014 and 2015
Table G. Number and Percent of Baccalaureate Graduates Who Worked 45
and/or Enrolled Five Years After Graduation, by Fields of Study,
Classes of 2008, 2009, and 2010
Table H. Number and Percent of Graduates Employed Full-Time, With and 46
Without an Additional Credential, Five and Ten Years After Graduation,
by Fields of Study (Year 5: Classes of 2008, 2009 and 2010 Combined;
Year 10: Class of 2005)
BOARD of GOVERNORS State University System of Florida 38
Table I. Dollar and Percent Increase in Median Annual Wages Over Year 1 47
for Graduates Employed Full-Time Without an Additional Credential,
Five and Ten Years After Graduation, by Fields of Study (Year 5: Classes
of 2008, 2009 and 2010 Combined; Year 10: Class of 2005)
Table J. Dollar and Percent Increase in Median Annual Wages Over Year 1 48
for Graduates Employed Full-Time With an Additional Credential,
Five and Ten Years After Graduation, by Fields of Study (Year 5: Classes
of 2008, 2009 and 2010 Combined; Year 10: Class of 2005)
BOARD of GOVERNORS State University System of Florida 39
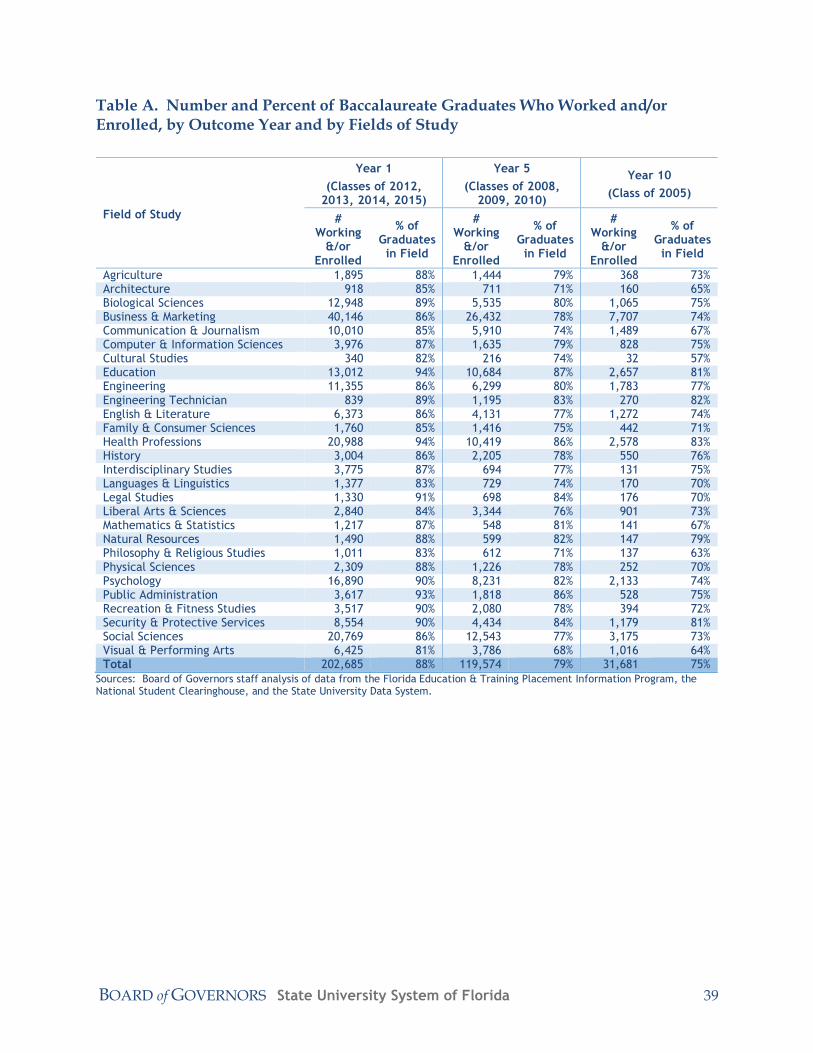
Table A. Number and Percent of Baccalaureate Graduates Who Worked and/or Enrolled, by Outcome Year and by Fields of Study
Field of Study
Year 1
(Classes of 2012, 2013, 2014, 2015)
Year 5
(Classes of 2008, 2009, 2010)
Year 10
(Class of 2005)
# Working
&/or Enrolled
% of Graduates in Field
# Working
&/or Enrolled
% of Graduates in Field
# Working
&/or Enrolled
% of Graduates in Field
Agriculture 1,895 88% 1,444 79% 368 73% Architecture 918 85% 711 71% 160 65% Biological Sciences 12,948 89% 5,535 80% 1,065 75% Business & Marketing 40,146 86% 26,432 78% 7,707 74% Communication & Journalism 10,010 85% 5,910 74% 1,489 67% Computer & Information Sciences 3,976 87% 1,635 79% 828 75% Cultural Studies 340 82% 216 74% 32 57% Education 13,012 94% 10,684 87% 2,657 81% Engineering 11,355 86% 6,299 80% 1,783 77% Engineering Technician 839 89% 1,195 83% 270 82% English & Literature 6,373 86% 4,131 77% 1,272 74% Family & Consumer Sciences 1,760 85% 1,416 75% 442 71% Health Professions 20,988 94% 10,419 86% 2,578 83% History 3,004 86% 2,205 78% 550 76% Interdisciplinary Studies 3,775 87% 694 77% 131 75% Languages & Linguistics 1,377 83% 729 74% 170 70% Legal Studies 1,330 91% 698 84% 176 70% Liberal Arts & Sciences 2,840 84% 3,344 76% 901 73% Mathematics & Statistics 1,217 87% 548 81% 141 67% Natural Resources 1,490 88% 599 82% 147 79% Philosophy & Religious Studies 1,011 83% 612 71% 137 63% Physical Sciences 2,309 88% 1,226 78% 252 70% Psychology 16,890 90% 8,231 82% 2,133 74% Public Administration 3,617 93% 1,818 86% 528 75% Recreation & Fitness Studies 3,517 90% 2,080 78% 394 72% Security & Protective Services 8,554 90% 4,434 84% 1,179 81% Social Sciences 20,769 86% 12,543 77% 3,175 73% Visual & Performing Arts 6,425 81% 3,786 68% 1,016 64% Total 202,685 88% 119,574 79% 31,681 75%
Sources: Board of Governors staff analysis of data from the Florida Education & Training Placement Information Program, the National Student Clearinghouse, and the State University Data System.
BOARD of GOVERNORS State University System of Florida 40
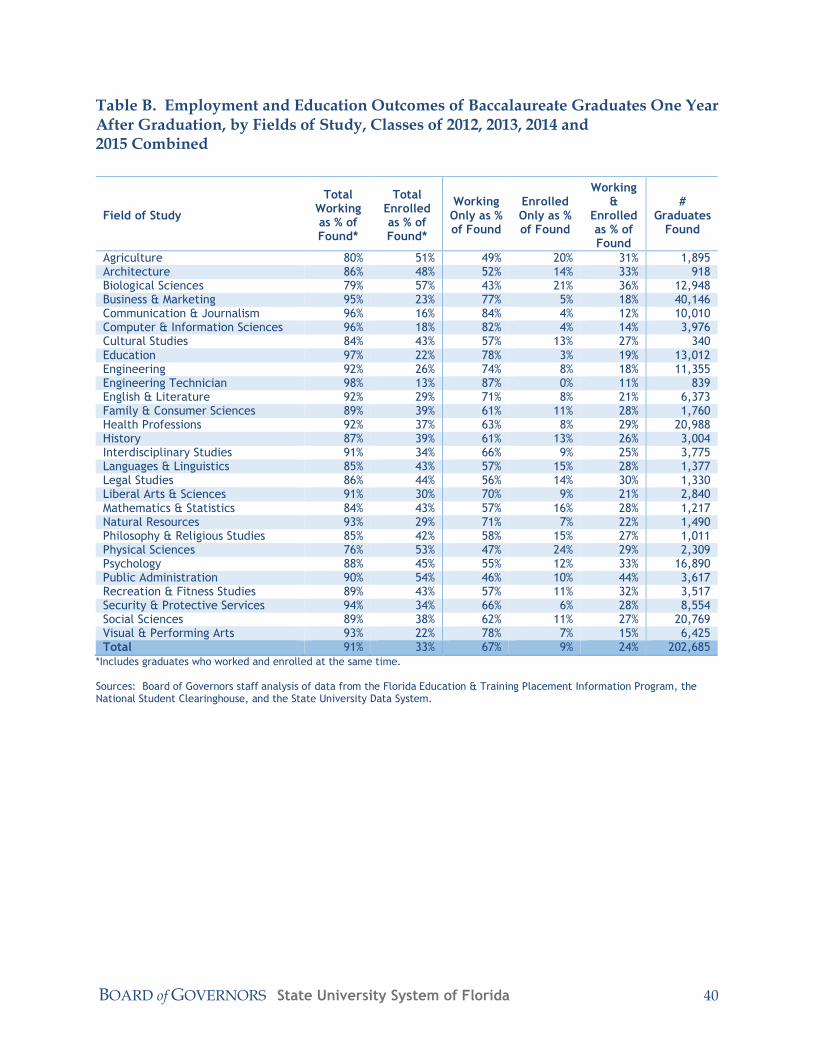
Table B. Employment and Education Outcomes of Baccalaureate Graduates One Year After Graduation, by Fields of Study, Classes of 2012, 2013, 2014 and 2015 Combined
Field of Study
Total Working as % of Found*
Total Enrolled as % of Found*
Working Only as % of Found
Enrolled Only as % of Found
Working &
Enrolled as % of Found
# Graduates
Found
Agriculture 80% 51% 49% 20% 31% 1,895 Architecture 86% 48% 52% 14% 33% 918 Biological Sciences 79% 57% 43% 21% 36% 12,948 Business & Marketing 95% 23% 77% 5% 18% 40,146 Communication & Journalism 96% 16% 84% 4% 12% 10,010 Computer & Information Sciences 96% 18% 82% 4% 14% 3,976 Cultural Studies 84% 43% 57% 13% 27% 340 Education 97% 22% 78% 3% 19% 13,012 Engineering 92% 26% 74% 8% 18% 11,355 Engineering Technician 98% 13% 87% 0% 11% 839 English & Literature 92% 29% 71% 8% 21% 6,373 Family & Consumer Sciences 89% 39% 61% 11% 28% 1,760 Health Professions 92% 37% 63% 8% 29% 20,988 History 87% 39% 61% 13% 26% 3,004 Interdisciplinary Studies 91% 34% 66% 9% 25% 3,775 Languages & Linguistics 85% 43% 57% 15% 28% 1,377 Legal Studies 86% 44% 56% 14% 30% 1,330 Liberal Arts & Sciences 91% 30% 70% 9% 21% 2,840 Mathematics & Statistics 84% 43% 57% 16% 28% 1,217 Natural Resources 93% 29% 71% 7% 22% 1,490 Philosophy & Religious Studies 85% 42% 58% 15% 27% 1,011 Physical Sciences 76% 53% 47% 24% 29% 2,309 Psychology 88% 45% 55% 12% 33% 16,890 Public Administration 90% 54% 46% 10% 44% 3,617 Recreation & Fitness Studies 89% 43% 57% 11% 32% 3,517 Security & Protective Services 94% 34% 66% 6% 28% 8,554 Social Sciences 89% 38% 62% 11% 27% 20,769 Visual & Performing Arts 93% 22% 78% 7% 15% 6,425 Total 91% 33% 67% 9% 24% 202,685
*Includes graduates who worked and enrolled at the same time. Sources: Board of Governors staff analysis of data from the Florida Education & Training Placement Information Program, the National Student Clearinghouse, and the State University Data System.
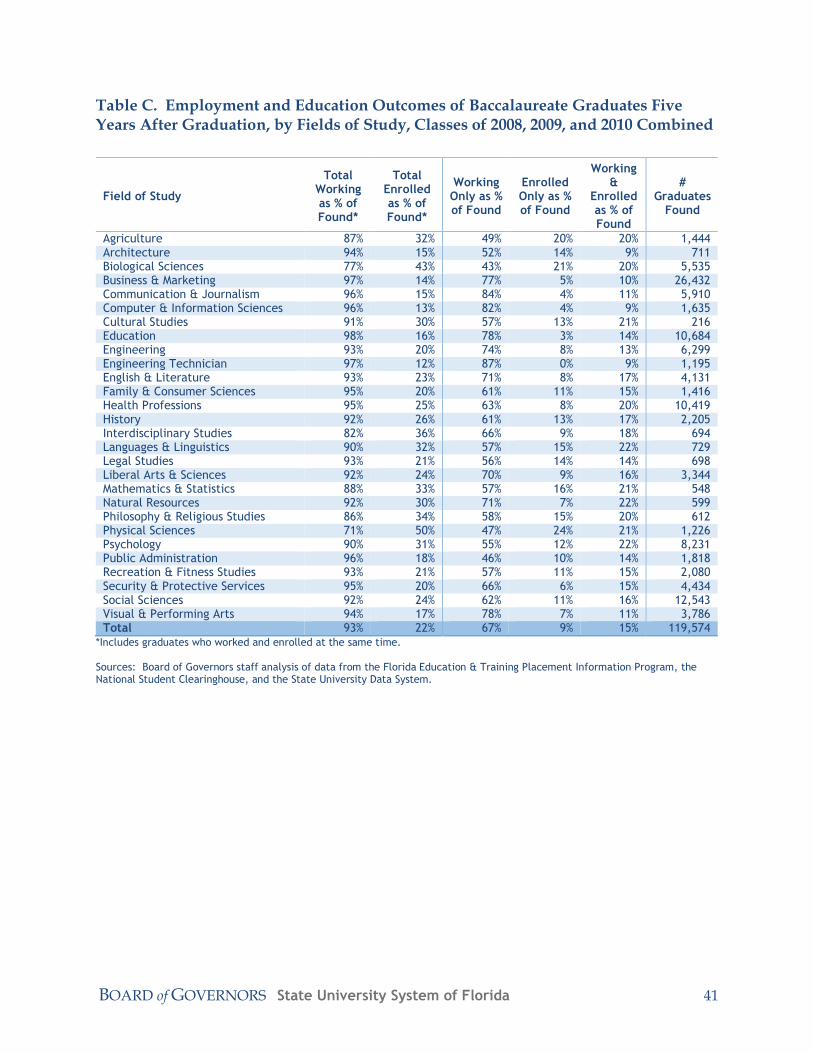
BOARD of GOVERNORS State University System of Florida 41
Table C. Employment and Education Outcomes of Baccalaureate Graduates Five Years After Graduation, by Fields of Study, Classes of 2008, 2009, and 2010 Combined
Field of Study
Total Working as % of Found*
Total Enrolled as % of Found*
Working Only as % of Found
Enrolled Only as % of Found
Working &
Enrolled as % of Found
# Graduates
Found
Agriculture 87% 32% 49% 20% 20% 1,444 Architecture 94% 15% 52% 14% 9% 711 Biological Sciences 77% 43% 43% 21% 20% 5,535 Business & Marketing 97% 14% 77% 5% 10% 26,432 Communication & Journalism 96% 15% 84% 4% 11% 5,910 Computer & Information Sciences 96% 13% 82% 4% 9% 1,635 Cultural Studies 91% 30% 57% 13% 21% 216 Education 98% 16% 78% 3% 14% 10,684 Engineering 93% 20% 74% 8% 13% 6,299 Engineering Technician 97% 12% 87% 0% 9% 1,195 English & Literature 93% 23% 71% 8% 17% 4,131 Family & Consumer Sciences 95% 20% 61% 11% 15% 1,416 Health Professions 95% 25% 63% 8% 20% 10,419 History 92% 26% 61% 13% 17% 2,205 Interdisciplinary Studies 82% 36% 66% 9% 18% 694 Languages & Linguistics 90% 32% 57% 15% 22% 729 Legal Studies 93% 21% 56% 14% 14% 698 Liberal Arts & Sciences 92% 24% 70% 9% 16% 3,344 Mathematics & Statistics 88% 33% 57% 16% 21% 548 Natural Resources 92% 30% 71% 7% 22% 599 Philosophy & Religious Studies 86% 34% 58% 15% 20% 612 Physical Sciences 71% 50% 47% 24% 21% 1,226 Psychology 90% 31% 55% 12% 22% 8,231 Public Administration 96% 18% 46% 10% 14% 1,818 Recreation & Fitness Studies 93% 21% 57% 11% 15% 2,080 Security & Protective Services 95% 20% 66% 6% 15% 4,434 Social Sciences 92% 24% 62% 11% 16% 12,543 Visual & Performing Arts 94% 17% 78% 7% 11% 3,786 Total 93% 22% 67% 9% 15% 119,574
*Includes graduates who worked and enrolled at the same time. Sources: Board of Governors staff analysis of data from the Florida Education & Training Placement Information Program, the National Student Clearinghouse, and the State University Data System.
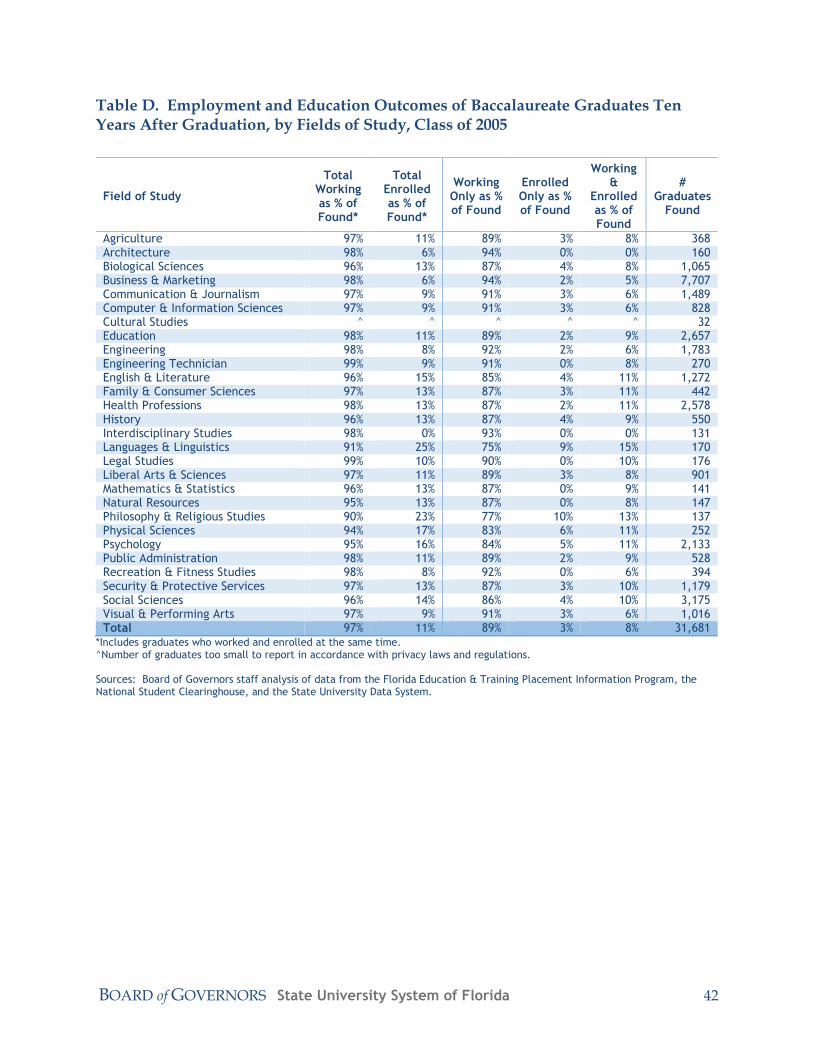
BOARD of GOVERNORS State University System of Florida 42
Table D. Employment and Education Outcomes of Baccalaureate Graduates Ten Years After Graduation, by Fields of Study, Class of 2005
Field of Study
Total Working as % of Found*
Total Enrolled as % of Found*
Working Only as % of Found
Enrolled Only as % of Found
Working &
Enrolled as % of Found
# Graduates
Found
Agriculture 97% 11% 89% 3% 8% 368 Architecture 98% 6% 94% 0% 0% 160 Biological Sciences 96% 13% 87% 4% 8% 1,065 Business & Marketing 98% 6% 94% 2% 5% 7,707 Communication & Journalism 97% 9% 91% 3% 6% 1,489 Computer & Information Sciences 97% 9% 91% 3% 6% 828 Cultural Studies ^ ^ ^ ^ ^ 32 Education 98% 11% 89% 2% 9% 2,657 Engineering 98% 8% 92% 2% 6% 1,783 Engineering Technician 99% 9% 91% 0% 8% 270 English & Literature 96% 15% 85% 4% 11% 1,272 Family & Consumer Sciences 97% 13% 87% 3% 11% 442 Health Professions 98% 13% 87% 2% 11% 2,578 History 96% 13% 87% 4% 9% 550 Interdisciplinary Studies 98% 0% 93% 0% 0% 131 Languages & Linguistics 91% 25% 75% 9% 15% 170 Legal Studies 99% 10% 90% 0% 10% 176 Liberal Arts & Sciences 97% 11% 89% 3% 8% 901 Mathematics & Statistics 96% 13% 87% 0% 9% 141 Natural Resources 95% 13% 87% 0% 8% 147 Philosophy & Religious Studies 90% 23% 77% 10% 13% 137 Physical Sciences 94% 17% 83% 6% 11% 252 Psychology 95% 16% 84% 5% 11% 2,133 Public Administration 98% 11% 89% 2% 9% 528 Recreation & Fitness Studies 98% 8% 92% 0% 6% 394 Security & Protective Services 97% 13% 87% 3% 10% 1,179 Social Sciences 96% 14% 86% 4% 10% 3,175 Visual & Performing Arts 97% 9% 91% 3% 6% 1,016 Total 97% 11% 89% 3% 8% 31,681
*Includes graduates who worked and enrolled at the same time. ^Number of graduates too small to report in accordance with privacy laws and regulations. Sources: Board of Governors staff analysis of data from the Florida Education & Training Placement Information Program, the National Student Clearinghouse, and the State University Data System.
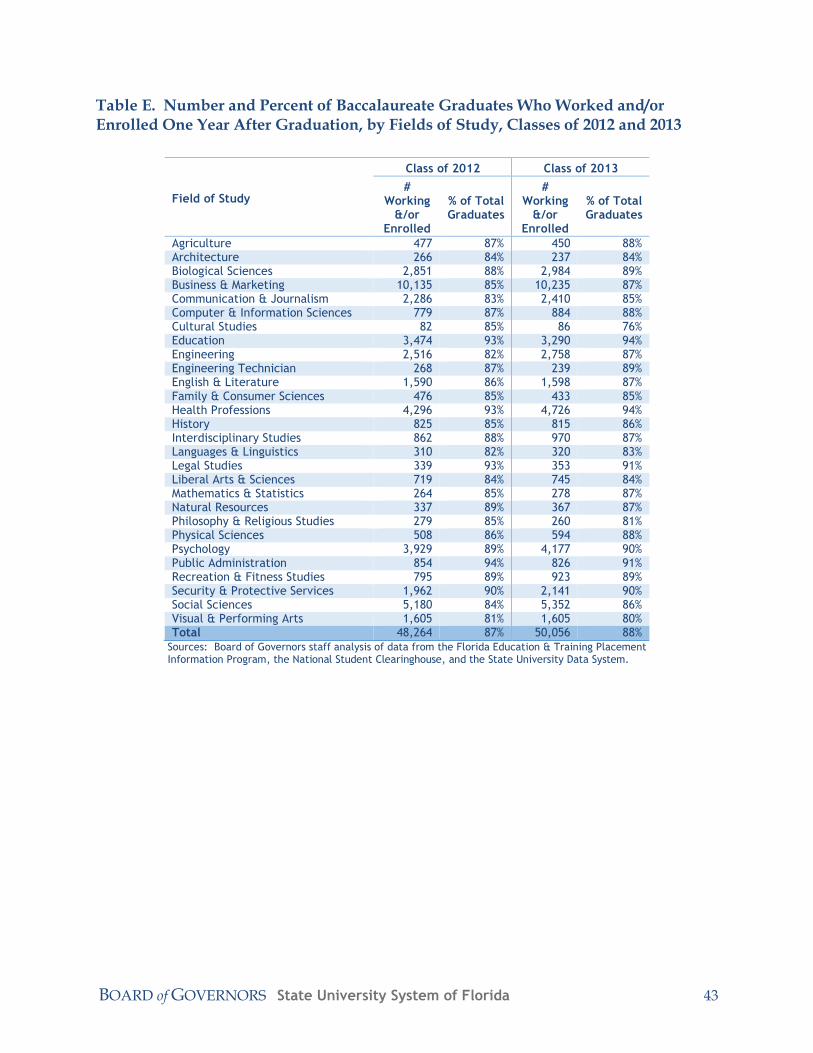
BOARD of GOVERNORS State University System of Florida 43
Table E. Number and Percent of Baccalaureate Graduates Who Worked and/or Enrolled One Year After Graduation, by Fields of Study, Classes of 2012 and 2013
Field of Study
Class of 2012 Class of 2013
# Working
&/or Enrolled
% of Total Graduates
# Working
&/or Enrolled
% of Total Graduates
Agriculture 477 87% 450 88% Architecture 266 84% 237 84% Biological Sciences 2,851 88% 2,984 89% Business & Marketing 10,135 85% 10,235 87% Communication & Journalism 2,286 83% 2,410 85% Computer & Information Sciences 779 87% 884 88% Cultural Studies 82 85% 86 76% Education 3,474 93% 3,290 94% Engineering 2,516 82% 2,758 87% Engineering Technician 268 87% 239 89% English & Literature 1,590 86% 1,598 87% Family & Consumer Sciences 476 85% 433 85% Health Professions 4,296 93% 4,726 94% History 825 85% 815 86% Interdisciplinary Studies 862 88% 970 87% Languages & Linguistics 310 82% 320 83% Legal Studies 339 93% 353 91% Liberal Arts & Sciences 719 84% 745 84% Mathematics & Statistics 264 85% 278 87% Natural Resources 337 89% 367 87% Philosophy & Religious Studies 279 85% 260 81% Physical Sciences 508 86% 594 88% Psychology 3,929 89% 4,177 90% Public Administration 854 94% 826 91% Recreation & Fitness Studies 795 89% 923 89% Security & Protective Services 1,962 90% 2,141 90% Social Sciences 5,180 84% 5,352 86% Visual & Performing Arts 1,605 81% 1,605 80% Total 48,264 87% 50,056 88%
Sources: Board of Governors staff analysis of data from the Florida Education & Training Placement Information Program, the National Student Clearinghouse, and the State University Data System.
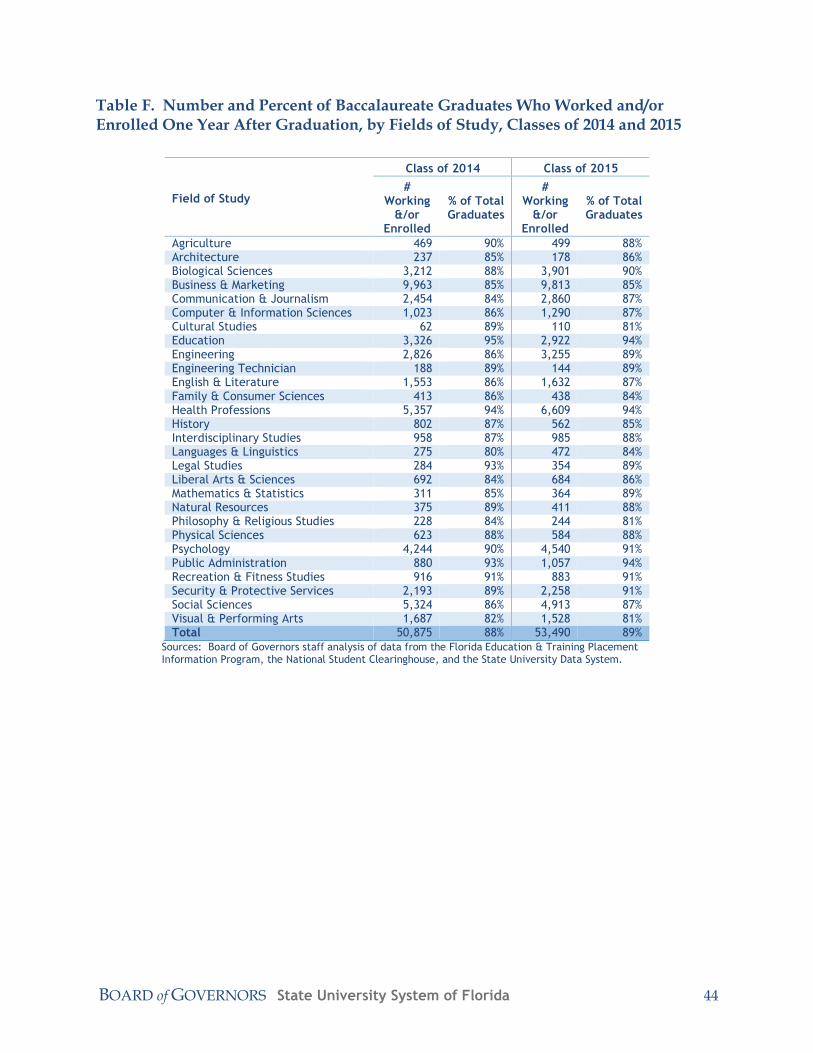
BOARD of GOVERNORS State University System of Florida 44
Table F. Number and Percent of Baccalaureate Graduates Who Worked and/or Enrolled One Year After Graduation, by Fields of Study, Classes of 2014 and 2015
Field of Study
Class of 2014 Class of 2015
# Working
&/or Enrolled
% of Total Graduates
# Working
&/or Enrolled
% of Total Graduates
Agriculture 469 90% 499 88% Architecture 237 85% 178 86% Biological Sciences 3,212 88% 3,901 90% Business & Marketing 9,963 85% 9,813 85% Communication & Journalism 2,454 84% 2,860 87% Computer & Information Sciences 1,023 86% 1,290 87% Cultural Studies 62 89% 110 81% Education 3,326 95% 2,922 94% Engineering 2,826 86% 3,255 89% Engineering Technician 188 89% 144 89% English & Literature 1,553 86% 1,632 87% Family & Consumer Sciences 413 86% 438 84% Health Professions 5,357 94% 6,609 94% History 802 87% 562 85% Interdisciplinary Studies 958 87% 985 88% Languages & Linguistics 275 80% 472 84% Legal Studies 284 93% 354 89% Liberal Arts & Sciences 692 84% 684 86% Mathematics & Statistics 311 85% 364 89% Natural Resources 375 89% 411 88% Philosophy & Religious Studies 228 84% 244 81% Physical Sciences 623 88% 584 88% Psychology 4,244 90% 4,540 91% Public Administration 880 93% 1,057 94% Recreation & Fitness Studies 916 91% 883 91% Security & Protective Services 2,193 89% 2,258 91% Social Sciences 5,324 86% 4,913 87% Visual & Performing Arts 1,687 82% 1,528 81% Total 50,875 88% 53,490 89%
Sources: Board of Governors staff analysis of data from the Florida Education & Training Placement Information Program, the National Student Clearinghouse, and the State University Data System.
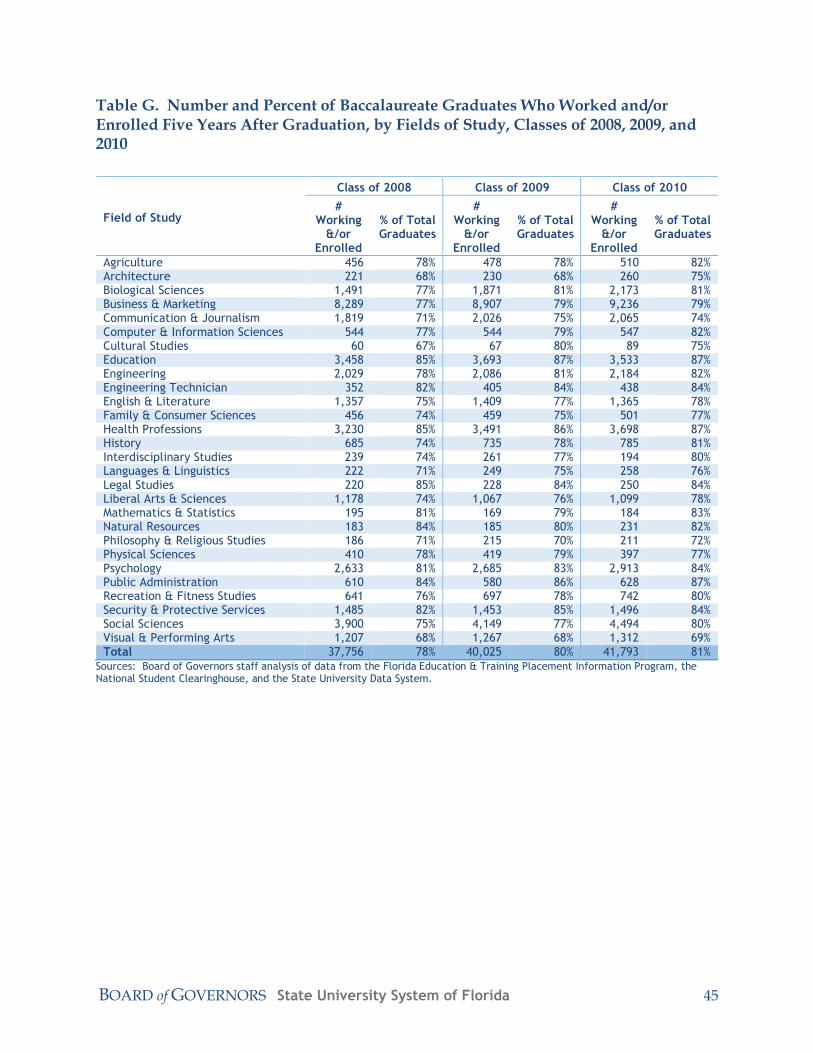
BOARD of GOVERNORS State University System of Florida 45
Table G. Number and Percent of Baccalaureate Graduates Who Worked and/or Enrolled Five Years After Graduation, by Fields of Study, Classes of 2008, 2009, and 2010
Field of Study
Class of 2008 Class of 2009 Class of 2010
# Working
&/or Enrolled
% of Total Graduates
# Working
&/or Enrolled
% of Total Graduates
# Working
&/or Enrolled
% of Total Graduates
Agriculture 456 78% 478 78% 510 82% Architecture 221 68% 230 68% 260 75% Biological Sciences 1,491 77% 1,871 81% 2,173 81% Business & Marketing 8,289 77% 8,907 79% 9,236 79% Communication & Journalism 1,819 71% 2,026 75% 2,065 74% Computer & Information Sciences 544 77% 544 79% 547 82% Cultural Studies 60 67% 67 80% 89 75% Education 3,458 85% 3,693 87% 3,533 87% Engineering 2,029 78% 2,086 81% 2,184 82% Engineering Technician 352 82% 405 84% 438 84% English & Literature 1,357 75% 1,409 77% 1,365 78% Family & Consumer Sciences 456 74% 459 75% 501 77% Health Professions 3,230 85% 3,491 86% 3,698 87% History 685 74% 735 78% 785 81% Interdisciplinary Studies 239 74% 261 77% 194 80% Languages & Linguistics 222 71% 249 75% 258 76% Legal Studies 220 85% 228 84% 250 84% Liberal Arts & Sciences 1,178 74% 1,067 76% 1,099 78% Mathematics & Statistics 195 81% 169 79% 184 83% Natural Resources 183 84% 185 80% 231 82% Philosophy & Religious Studies 186 71% 215 70% 211 72% Physical Sciences 410 78% 419 79% 397 77% Psychology 2,633 81% 2,685 83% 2,913 84% Public Administration 610 84% 580 86% 628 87% Recreation & Fitness Studies 641 76% 697 78% 742 80% Security & Protective Services 1,485 82% 1,453 85% 1,496 84% Social Sciences 3,900 75% 4,149 77% 4,494 80% Visual & Performing Arts 1,207 68% 1,267 68% 1,312 69% Total 37,756 78% 40,025 80% 41,793 81%
Sources: Board of Governors staff analysis of data from the Florida Education & Training Placement Information Program, the National Student Clearinghouse, and the State University Data System.
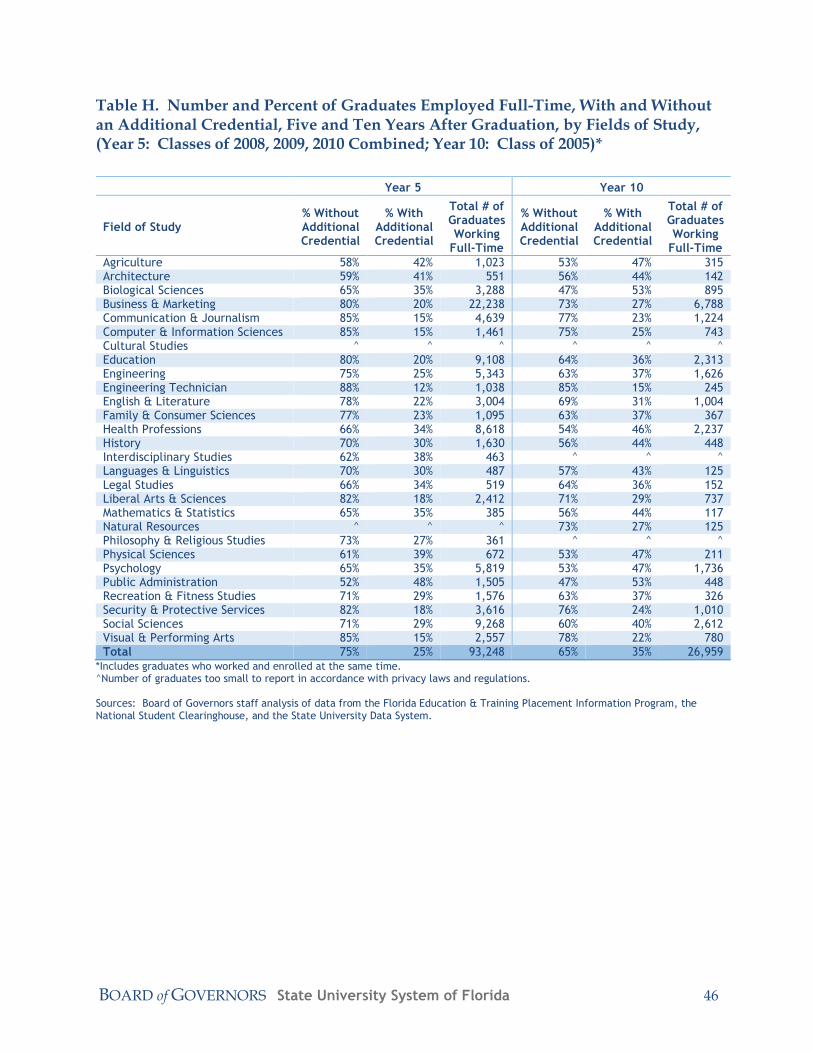
BOARD of GOVERNORS State University System of Florida 46
Table H. Number and Percent of Graduates Employed Full-Time, With and Without an Additional Credential, Five and Ten Years After Graduation, by Fields of Study, (Year 5: Classes of 2008, 2009, 2010 Combined; Year 10: Class of 2005)*
Year 5 Year 10
Field of Study % Without Additional Credential
% With Additional Credential
Total # of Graduates Working
Full-Time
% Without Additional Credential
% With Additional Credential
Total # of Graduates Working
Full-Time
Agriculture 58% 42% 1,023 53% 47% 315 Architecture 59% 41% 551 56% 44% 142 Biological Sciences 65% 35% 3,288 47% 53% 895 Business & Marketing 80% 20% 22,238 73% 27% 6,788 Communication & Journalism 85% 15% 4,639 77% 23% 1,224 Computer & Information Sciences 85% 15% 1,461 75% 25% 743 Cultural Studies ^ ^ ^ ^ ^ ^ Education 80% 20% 9,108 64% 36% 2,313 Engineering 75% 25% 5,343 63% 37% 1,626 Engineering Technician 88% 12% 1,038 85% 15% 245 English & Literature 78% 22% 3,004 69% 31% 1,004 Family & Consumer Sciences 77% 23% 1,095 63% 37% 367 Health Professions 66% 34% 8,618 54% 46% 2,237 History 70% 30% 1,630 56% 44% 448 Interdisciplinary Studies 62% 38% 463 ^ ^ ^ Languages & Linguistics 70% 30% 487 57% 43% 125 Legal Studies 66% 34% 519 64% 36% 152 Liberal Arts & Sciences 82% 18% 2,412 71% 29% 737 Mathematics & Statistics 65% 35% 385 56% 44% 117 Natural Resources ^ ^ ^ 73% 27% 125 Philosophy & Religious Studies 73% 27% 361 ^ ^ ^ Physical Sciences 61% 39% 672 53% 47% 211 Psychology 65% 35% 5,819 53% 47% 1,736 Public Administration 52% 48% 1,505 47% 53% 448 Recreation & Fitness Studies 71% 29% 1,576 63% 37% 326 Security & Protective Services 82% 18% 3,616 76% 24% 1,010 Social Sciences 71% 29% 9,268 60% 40% 2,612 Visual & Performing Arts 85% 15% 2,557 78% 22% 780 Total 75% 25% 93,248 65% 35% 26,959
*Includes graduates who worked and enrolled at the same time. ^Number of graduates too small to report in accordance with privacy laws and regulations. Sources: Board of Governors staff analysis of data from the Florida Education & Training Placement Information Program, the National Student Clearinghouse, and the State University Data System.
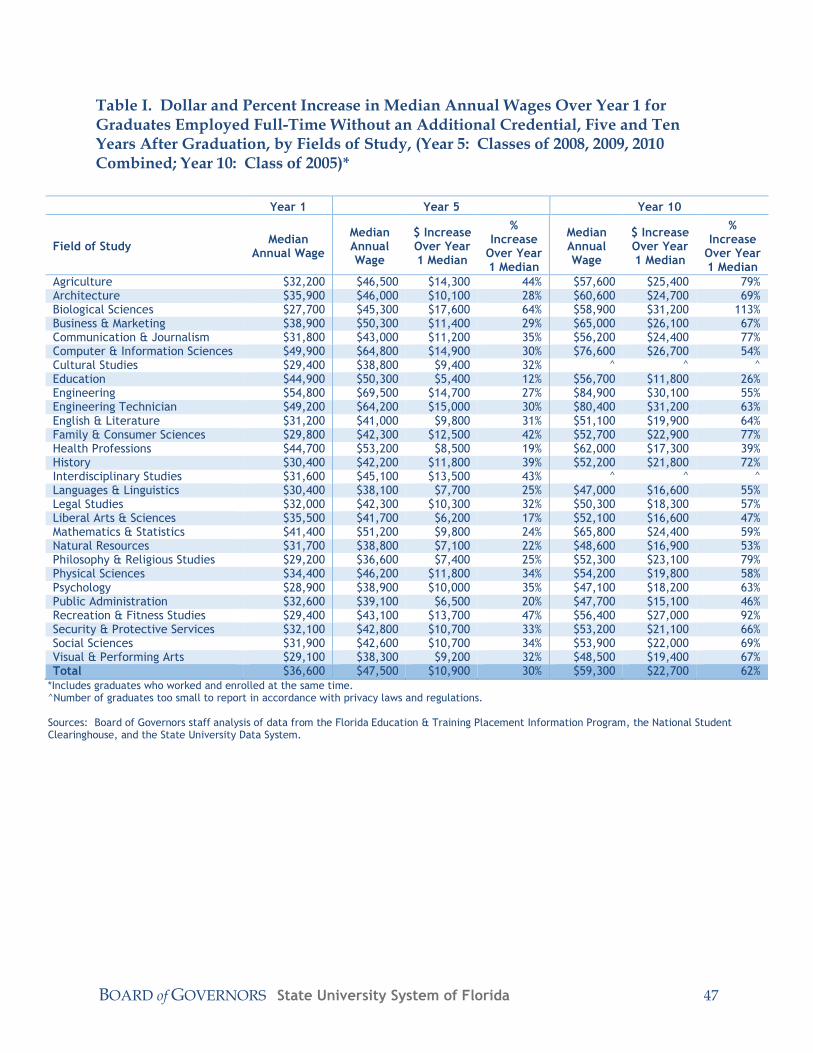
BOARD of GOVERNORS State University System of Florida 47
Table I. Dollar and Percent Increase in Median Annual Wages Over Year 1 for Graduates Employed Full-Time Without an Additional Credential, Five and Ten Years After Graduation, by Fields of Study, (Year 5: Classes of 2008, 2009, 2010 Combined; Year 10: Class of 2005)*
Year 1 Year 5 Year 10
Field of Study Median
Annual Wage
Median Annual Wage
$ Increase Over Year 1 Median
% Increase
Over Year 1 Median
Median Annual Wage
$ Increase Over Year 1 Median
% Increase
Over Year 1 Median
Agriculture $32,200 $46,500 $14,300 44% $57,600 $25,400 79% Architecture $35,900 $46,000 $10,100 28% $60,600 $24,700 69% Biological Sciences $27,700 $45,300 $17,600 64% $58,900 $31,200 113% Business & Marketing $38,900 $50,300 $11,400 29% $65,000 $26,100 67% Communication & Journalism $31,800 $43,000 $11,200 35% $56,200 $24,400 77% Computer & Information Sciences $49,900 $64,800 $14,900 30% $76,600 $26,700 54% Cultural Studies $29,400 $38,800 $9,400 32% ^ ^ ^ Education $44,900 $50,300 $5,400 12% $56,700 $11,800 26% Engineering $54,800 $69,500 $14,700 27% $84,900 $30,100 55% Engineering Technician $49,200 $64,200 $15,000 30% $80,400 $31,200 63% English & Literature $31,200 $41,000 $9,800 31% $51,100 $19,900 64% Family & Consumer Sciences $29,800 $42,300 $12,500 42% $52,700 $22,900 77% Health Professions $44,700 $53,200 $8,500 19% $62,000 $17,300 39% History $30,400 $42,200 $11,800 39% $52,200 $21,800 72% Interdisciplinary Studies $31,600 $45,100 $13,500 43% ^ ^ ^ Languages & Linguistics $30,400 $38,100 $7,700 25% $47,000 $16,600 55% Legal Studies $32,000 $42,300 $10,300 32% $50,300 $18,300 57% Liberal Arts & Sciences $35,500 $41,700 $6,200 17% $52,100 $16,600 47% Mathematics & Statistics $41,400 $51,200 $9,800 24% $65,800 $24,400 59% Natural Resources $31,700 $38,800 $7,100 22% $48,600 $16,900 53% Philosophy & Religious Studies $29,200 $36,600 $7,400 25% $52,300 $23,100 79% Physical Sciences $34,400 $46,200 $11,800 34% $54,200 $19,800 58% Psychology $28,900 $38,900 $10,000 35% $47,100 $18,200 63% Public Administration $32,600 $39,100 $6,500 20% $47,700 $15,100 46% Recreation & Fitness Studies $29,400 $43,100 $13,700 47% $56,400 $27,000 92% Security & Protective Services $32,100 $42,800 $10,700 33% $53,200 $21,100 66% Social Sciences $31,900 $42,600 $10,700 34% $53,900 $22,000 69% Visual & Performing Arts $29,100 $38,300 $9,200 32% $48,500 $19,400 67% Total $36,600 $47,500 $10,900 30% $59,300 $22,700 62%
*Includes graduates who worked and enrolled at the same time. ^Number of graduates too small to report in accordance with privacy laws and regulations. Sources: Board of Governors staff analysis of data from the Florida Education & Training Placement Information Program, the National Student Clearinghouse, and the State University Data System.
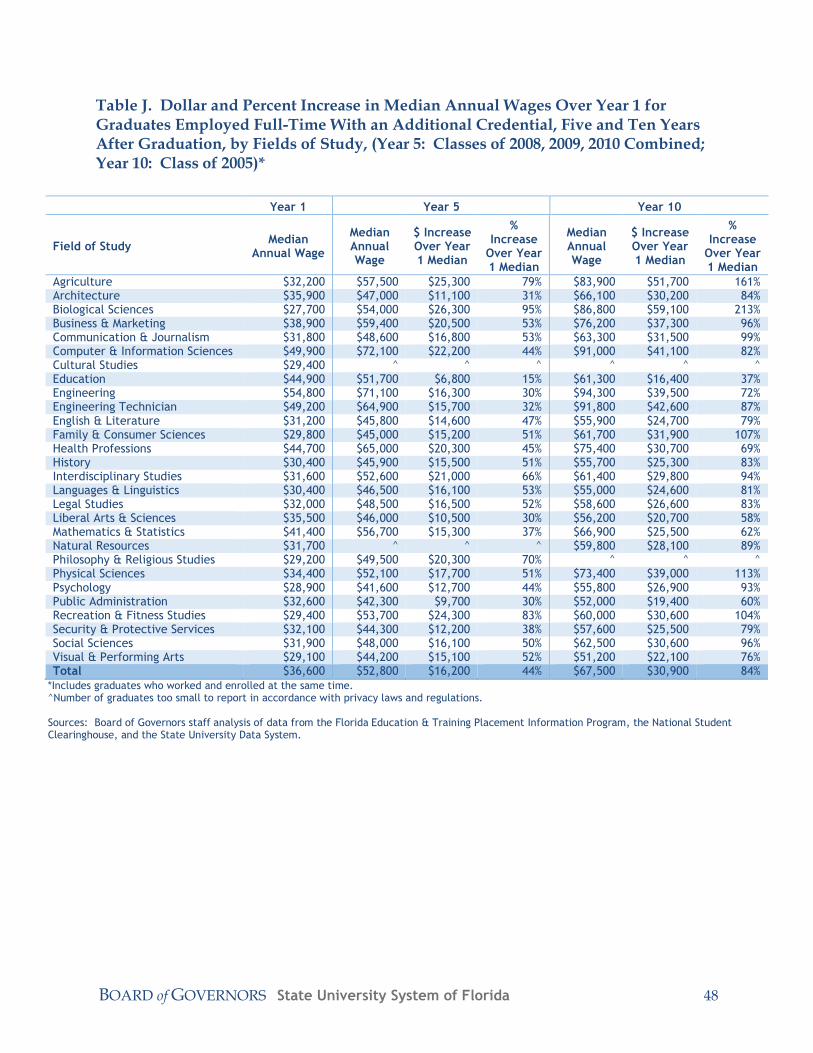
BOARD of GOVERNORS State University System of Florida 48
Table J. Dollar and Percent Increase in Median Annual Wages Over Year 1 for Graduates Employed Full-Time With an Additional Credential, Five and Ten Years After Graduation, by Fields of Study, (Year 5: Classes of 2008, 2009, 2010 Combined; Year 10: Class of 2005)*
Year 1 Year 5 Year 10
Field of Study Median
Annual Wage
Median Annual Wage
$ Increase Over Year 1 Median
% Increase
Over Year 1 Median
Median Annual Wage
$ Increase Over Year 1 Median
% Increase
Over Year 1 Median
Agriculture $32,200 $57,500 $25,300 79% $83,900 $51,700 161% Architecture $35,900 $47,000 $11,100 31% $66,100 $30,200 84% Biological Sciences $27,700 $54,000 $26,300 95% $86,800 $59,100 213% Business & Marketing $38,900 $59,400 $20,500 53% $76,200 $37,300 96% Communication & Journalism $31,800 $48,600 $16,800 53% $63,300 $31,500 99% Computer & Information Sciences $49,900 $72,100 $22,200 44% $91,000 $41,100 82% Cultural Studies $29,400 ^ ^ ^ ^ ^ ^ Education $44,900 $51,700 $6,800 15% $61,300 $16,400 37% Engineering $54,800 $71,100 $16,300 30% $94,300 $39,500 72% Engineering Technician $49,200 $64,900 $15,700 32% $91,800 $42,600 87% English & Literature $31,200 $45,800 $14,600 47% $55,900 $24,700 79% Family & Consumer Sciences $29,800 $45,000 $15,200 51% $61,700 $31,900 107% Health Professions $44,700 $65,000 $20,300 45% $75,400 $30,700 69% History $30,400 $45,900 $15,500 51% $55,700 $25,300 83% Interdisciplinary Studies $31,600 $52,600 $21,000 66% $61,400 $29,800 94% Languages & Linguistics $30,400 $46,500 $16,100 53% $55,000 $24,600 81% Legal Studies $32,000 $48,500 $16,500 52% $58,600 $26,600 83% Liberal Arts & Sciences $35,500 $46,000 $10,500 30% $56,200 $20,700 58% Mathematics & Statistics $41,400 $56,700 $15,300 37% $66,900 $25,500 62% Natural Resources $31,700 ^ ^ ^ $59,800 $28,100 89% Philosophy & Religious Studies $29,200 $49,500 $20,300 70% ^ ^ ^ Physical Sciences $34,400 $52,100 $17,700 51% $73,400 $39,000 113% Psychology $28,900 $41,600 $12,700 44% $55,800 $26,900 93% Public Administration $32,600 $42,300 $9,700 30% $52,000 $19,400 60% Recreation & Fitness Studies $29,400 $53,700 $24,300 83% $60,000 $30,600 104% Security & Protective Services $32,100 $44,300 $12,200 38% $57,600 $25,500 79% Social Sciences $31,900 $48,000 $16,100 50% $62,500 $30,600 96% Visual & Performing Arts $29,100 $44,200 $15,100 52% $51,200 $22,100 76% Total $36,600 $52,800 $16,200 44% $67,500 $30,900 84%
*Includes graduates who worked and enrolled at the same time. ^Number of graduates too small to report in accordance with privacy laws and regulations. Sources: Board of Governors staff analysis of data from the Florida Education & Training Placement Information Program, the National Student Clearinghouse, and the State University Data System.
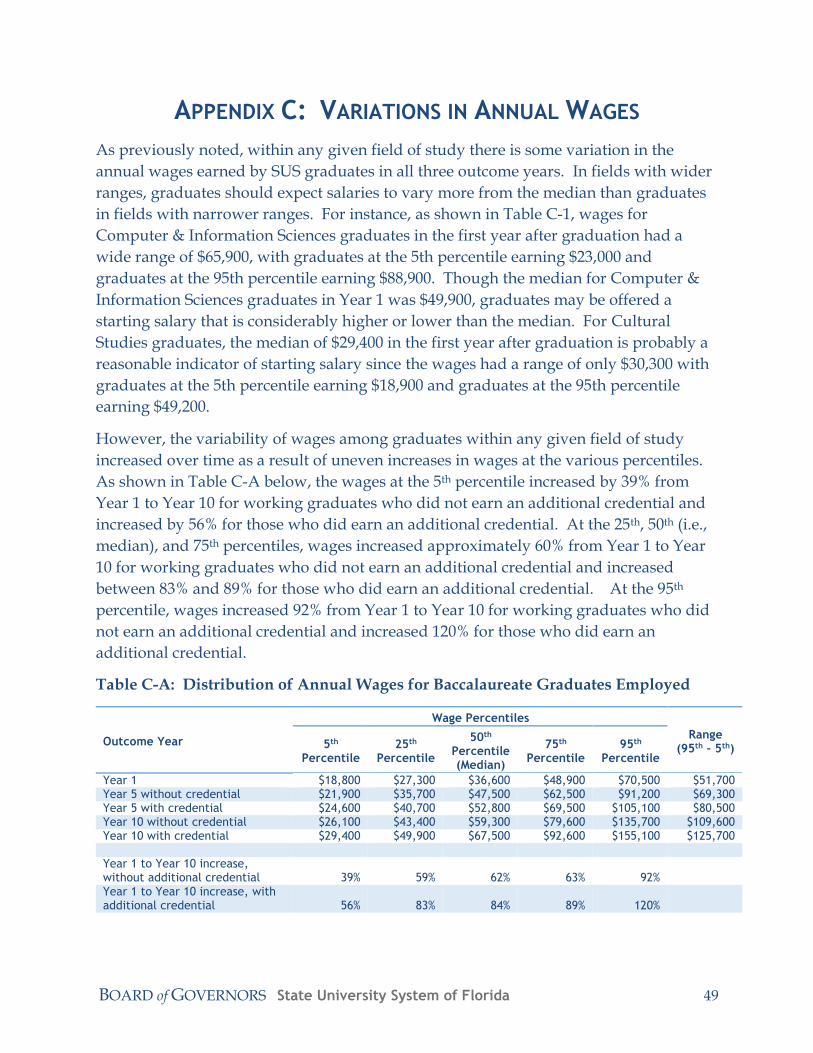
BOARD of GOVERNORS State University System of Florida 49
APPENDIX C: VARIATIONS IN ANNUAL WAGES
As previously noted, within any given field of study there is some variation in the
annual wages earned by SUS graduates in all three outcome years. In fields with wider
ranges, graduates should expect salaries to vary more from the median than graduates
in fields with narrower ranges. For instance, as shown in Table C-1, wages for
Computer & Information Sciences graduates in the first year after graduation had a
wide range of $65,900, with graduates at the 5th percentile earning $23,000 and
graduates at the 95th percentile earning $88,900. Though the median for Computer &
Information Sciences graduates in Year 1 was $49,900, graduates may be offered a
starting salary that is considerably higher or lower than the median. For Cultural
Studies graduates, the median of $29,400 in the first year after graduation is probably a
reasonable indicator of starting salary since the wages had a range of only $30,300 with
graduates at the 5th percentile earning $18,900 and graduates at the 95th percentile
earning $49,200.
However, the variability of wages among graduates within any given field of study
increased over time as a result of uneven increases in wages at the various percentiles.
As shown in Table C-A below, the wages at the 5th percentile increased by 39% from
Year 1 to Year 10 for working graduates who did not earn an additional credential and
increased by 56% for those who did earn an additional credential. At the 25th, 50th (i.e.,
median), and 75th percentiles, wages increased approximately 60% from Year 1 to Year
10 for working graduates who did not earn an additional credential and increased
between 83% and 89% for those who did earn an additional credential. At the 95th
percentile, wages increased 92% from Year 1 to Year 10 for working graduates who did
not earn an additional credential and increased 120% for those who did earn an
additional credential.
Table C-A: Distribution of Annual Wages for Baccalaureate Graduates Employed
Outcome Year
Wage Percentiles
Range (95th – 5th) 5th
Percentile 25th
Percentile
50th Percentile (Median)
75th Percentile
95th Percentile
Year 1 $18,800 $27,300 $36,600 $48,900 $70,500 $51,700 Year 5 without credential $21,900 $35,700 $47,500 $62,500 $91,200 $69,300 Year 5 with credential $24,600 $40,700 $52,800 $69,500 $105,100 $80,500 Year 10 without credential $26,100 $43,400 $59,300 $79,600 $135,700 $109,600 Year 10 with credential $29,400 $49,900 $67,500 $92,600 $155,100 $125,700 Year 1 to Year 10 increase, without additional credential 39% 59% 62% 63% 92% Year 1 to Year 10 increase, with additional credential 56% 83% 84% 89% 120%
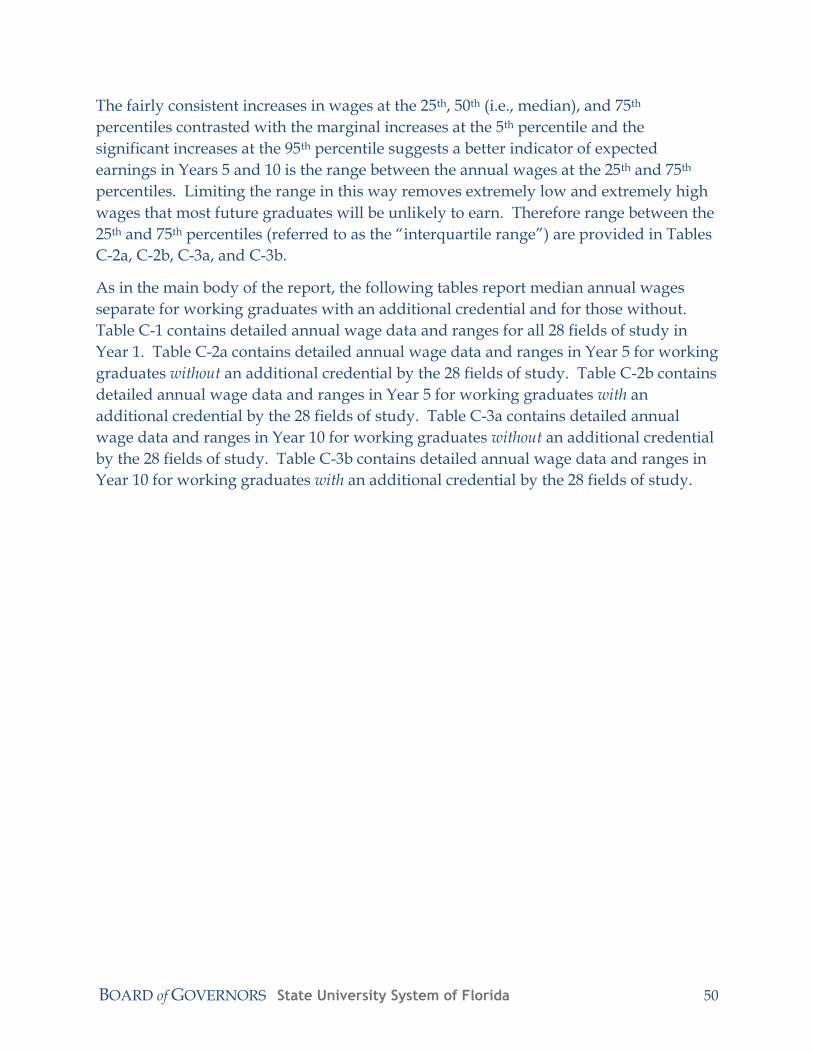
BOARD of GOVERNORS State University System of Florida 50
The fairly consistent increases in wages at the 25th, 50th (i.e., median), and 75th
percentiles contrasted with the marginal increases at the 5th percentile and the
significant increases at the 95th percentile suggests a better indicator of expected
earnings in Years 5 and 10 is the range between the annual wages at the 25th and 75th
percentiles. Limiting the range in this way removes extremely low and extremely high
wages that most future graduates will be unlikely to earn. Therefore range between the
25th and 75th percentiles (referred to as the “interquartile range”) are provided in Tables
C-2a, C-2b, C-3a, and C-3b.
As in the main body of the report, the following tables report median annual wages
separate for working graduates with an additional credential and for those without.
Table C-1 contains detailed annual wage data and ranges for all 28 fields of study in
Year 1. Table C-2a contains detailed annual wage data and ranges in Year 5 for working
graduates without an additional credential by the 28 fields of study. Table C-2b contains
detailed annual wage data and ranges in Year 5 for working graduates with an
additional credential by the 28 fields of study. Table C-3a contains detailed annual
wage data and ranges in Year 10 for working graduates without an additional credential
by the 28 fields of study. Table C-3b contains detailed annual wage data and ranges in
Year 10 for working graduates with an additional credential by the 28 fields of study.
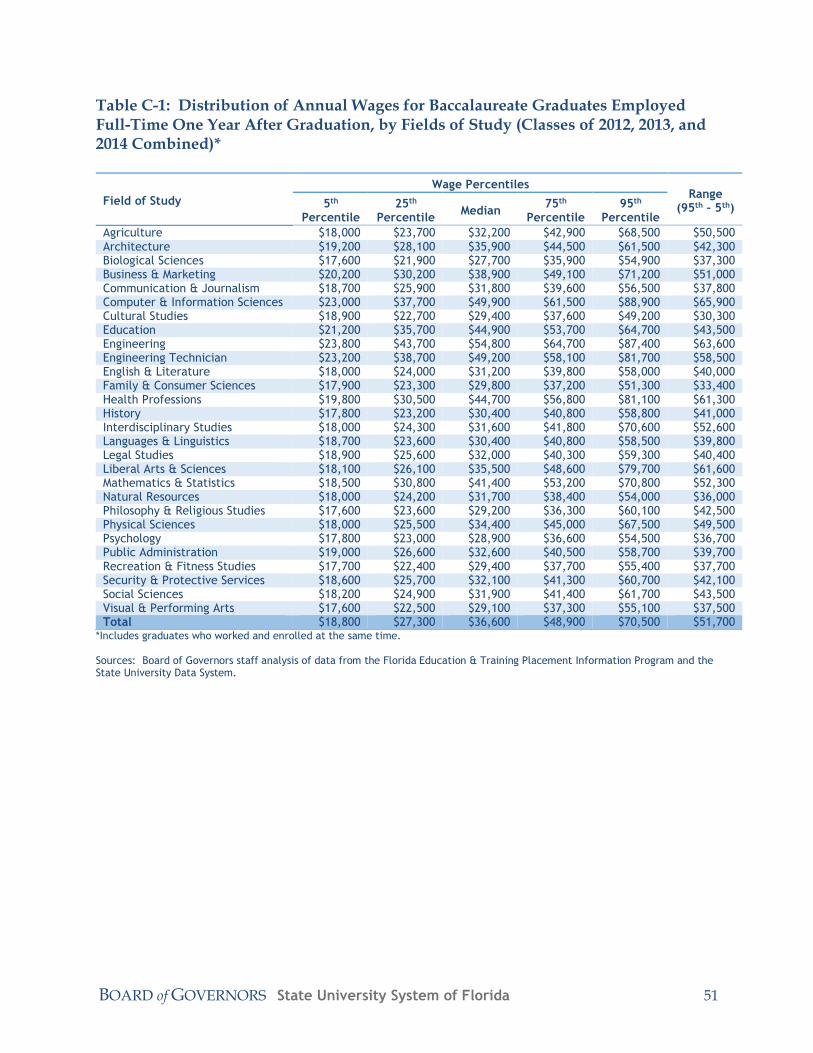
BOARD of GOVERNORS State University System of Florida 51
Table C-1: Distribution of Annual Wages for Baccalaureate Graduates Employed Full-Time One Year After Graduation, by Fields of Study (Classes of 2012, 2013, and 2014 Combined)*
Field of Study
Wage Percentiles Range
(95th – 5th) 5th Percentile
25th Percentile
Median 75th
Percentile 95th
Percentile
Agriculture $18,000 $23,700 $32,200 $42,900 $68,500 $50,500 Architecture $19,200 $28,100 $35,900 $44,500 $61,500 $42,300 Biological Sciences $17,600 $21,900 $27,700 $35,900 $54,900 $37,300 Business & Marketing $20,200 $30,200 $38,900 $49,100 $71,200 $51,000 Communication & Journalism $18,700 $25,900 $31,800 $39,600 $56,500 $37,800 Computer & Information Sciences $23,000 $37,700 $49,900 $61,500 $88,900 $65,900 Cultural Studies $18,900 $22,700 $29,400 $37,600 $49,200 $30,300 Education $21,200 $35,700 $44,900 $53,700 $64,700 $43,500 Engineering $23,800 $43,700 $54,800 $64,700 $87,400 $63,600 Engineering Technician $23,200 $38,700 $49,200 $58,100 $81,700 $58,500 English & Literature $18,000 $24,000 $31,200 $39,800 $58,000 $40,000 Family & Consumer Sciences $17,900 $23,300 $29,800 $37,200 $51,300 $33,400 Health Professions $19,800 $30,500 $44,700 $56,800 $81,100 $61,300 History $17,800 $23,200 $30,400 $40,800 $58,800 $41,000 Interdisciplinary Studies $18,000 $24,300 $31,600 $41,800 $70,600 $52,600 Languages & Linguistics $18,700 $23,600 $30,400 $40,800 $58,500 $39,800 Legal Studies $18,900 $25,600 $32,000 $40,300 $59,300 $40,400 Liberal Arts & Sciences $18,100 $26,100 $35,500 $48,600 $79,700 $61,600 Mathematics & Statistics $18,500 $30,800 $41,400 $53,200 $70,800 $52,300 Natural Resources $18,000 $24,200 $31,700 $38,400 $54,000 $36,000 Philosophy & Religious Studies $17,600 $23,600 $29,200 $36,300 $60,100 $42,500 Physical Sciences $18,000 $25,500 $34,400 $45,000 $67,500 $49,500 Psychology $17,800 $23,000 $28,900 $36,600 $54,500 $36,700 Public Administration $19,000 $26,600 $32,600 $40,500 $58,700 $39,700 Recreation & Fitness Studies $17,700 $22,400 $29,400 $37,700 $55,400 $37,700 Security & Protective Services $18,600 $25,700 $32,100 $41,300 $60,700 $42,100 Social Sciences $18,200 $24,900 $31,900 $41,400 $61,700 $43,500 Visual & Performing Arts $17,600 $22,500 $29,100 $37,300 $55,100 $37,500 Total $18,800 $27,300 $36,600 $48,900 $70,500 $51,700
*Includes graduates who worked and enrolled at the same time. Sources: Board of Governors staff analysis of data from the Florida Education & Training Placement Information Program and the State University Data System.
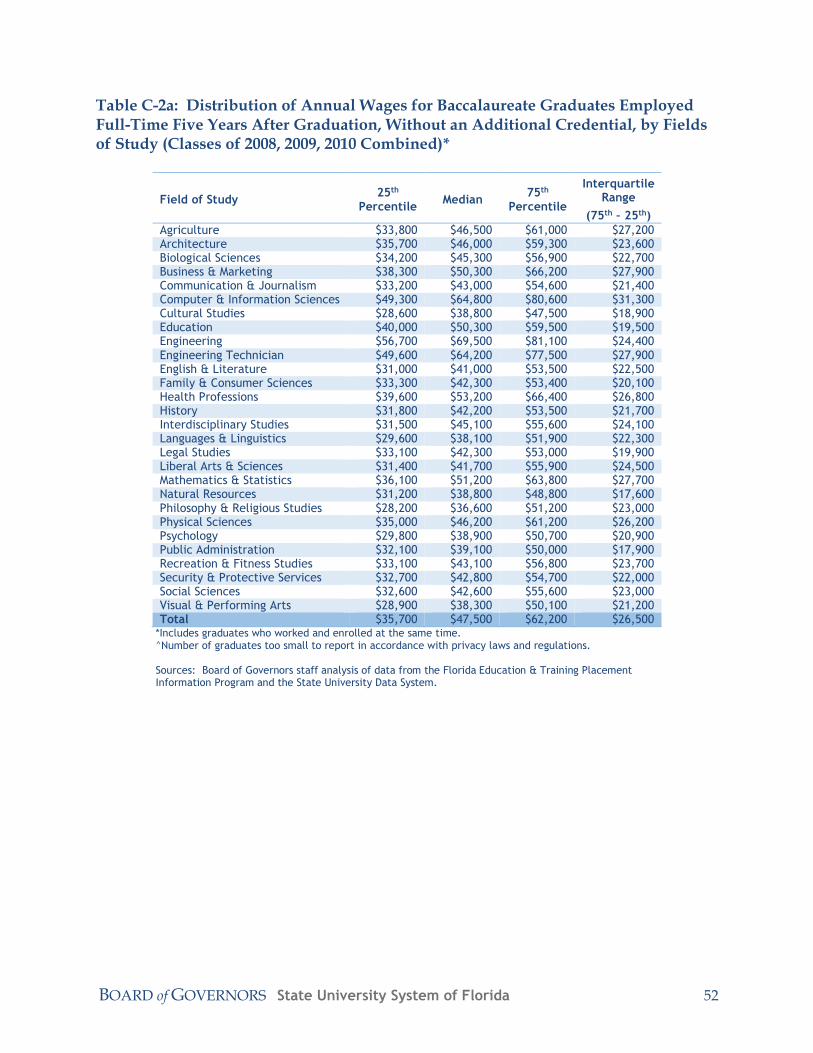
BOARD of GOVERNORS State University System of Florida 52
Table C-2a: Distribution of Annual Wages for Baccalaureate Graduates Employed Full-Time Five Years After Graduation, Without an Additional Credential, by Fields of Study (Classes of 2008, 2009, 2010 Combined)*
Field of Study 25th
Percentile Median
75th Percentile
Interquartile Range
(75th – 25th)
Agriculture $33,800 $46,500 $61,000 $27,200 Architecture $35,700 $46,000 $59,300 $23,600 Biological Sciences $34,200 $45,300 $56,900 $22,700 Business & Marketing $38,300 $50,300 $66,200 $27,900 Communication & Journalism $33,200 $43,000 $54,600 $21,400 Computer & Information Sciences $49,300 $64,800 $80,600 $31,300 Cultural Studies $28,600 $38,800 $47,500 $18,900 Education $40,000 $50,300 $59,500 $19,500 Engineering $56,700 $69,500 $81,100 $24,400 Engineering Technician $49,600 $64,200 $77,500 $27,900 English & Literature $31,000 $41,000 $53,500 $22,500 Family & Consumer Sciences $33,300 $42,300 $53,400 $20,100 Health Professions $39,600 $53,200 $66,400 $26,800 History $31,800 $42,200 $53,500 $21,700 Interdisciplinary Studies $31,500 $45,100 $55,600 $24,100 Languages & Linguistics $29,600 $38,100 $51,900 $22,300 Legal Studies $33,100 $42,300 $53,000 $19,900 Liberal Arts & Sciences $31,400 $41,700 $55,900 $24,500 Mathematics & Statistics $36,100 $51,200 $63,800 $27,700 Natural Resources $31,200 $38,800 $48,800 $17,600 Philosophy & Religious Studies $28,200 $36,600 $51,200 $23,000 Physical Sciences $35,000 $46,200 $61,200 $26,200 Psychology $29,800 $38,900 $50,700 $20,900 Public Administration $32,100 $39,100 $50,000 $17,900 Recreation & Fitness Studies $33,100 $43,100 $56,800 $23,700 Security & Protective Services $32,700 $42,800 $54,700 $22,000 Social Sciences $32,600 $42,600 $55,600 $23,000 Visual & Performing Arts $28,900 $38,300 $50,100 $21,200 Total $35,700 $47,500 $62,200 $26,500
*Includes graduates who worked and enrolled at the same time. ^Number of graduates too small to report in accordance with privacy laws and regulations. Sources: Board of Governors staff analysis of data from the Florida Education & Training Placement Information Program and the State University Data System.
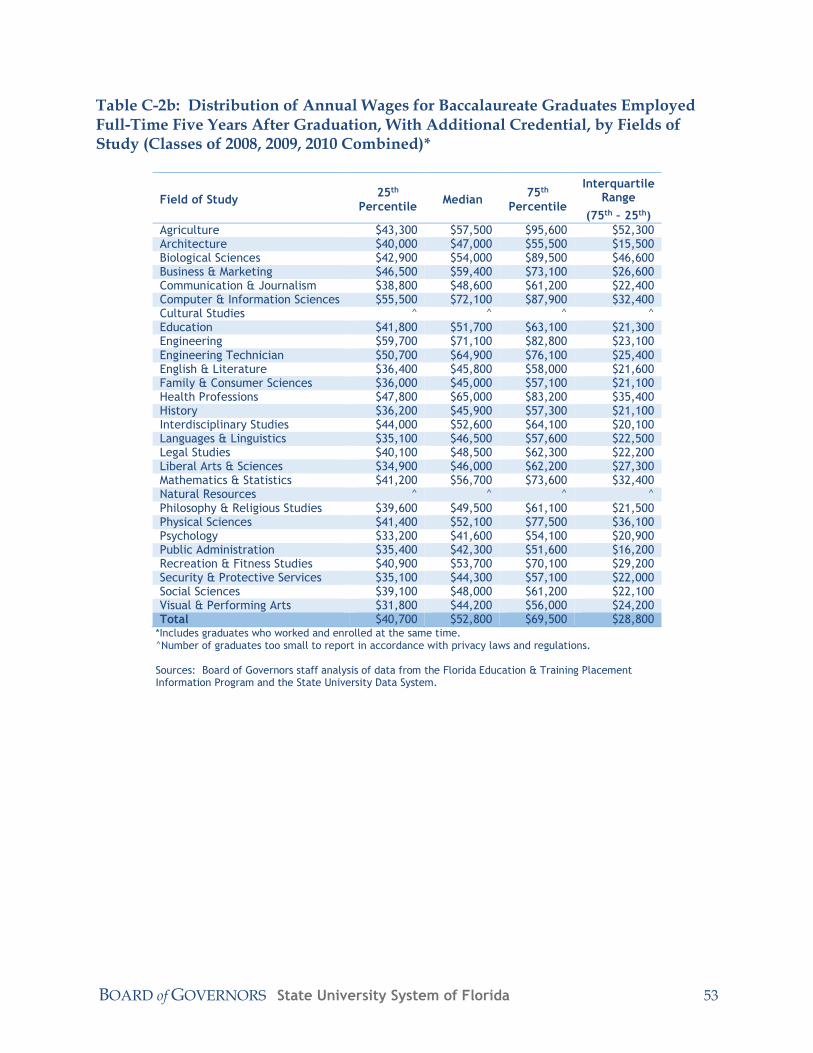
BOARD of GOVERNORS State University System of Florida 53
Table C-2b: Distribution of Annual Wages for Baccalaureate Graduates Employed Full-Time Five Years After Graduation, With Additional Credential, by Fields of Study (Classes of 2008, 2009, 2010 Combined)*
Field of Study 25th
Percentile Median
75th Percentile
Interquartile Range
(75th – 25th)
Agriculture $43,300 $57,500 $95,600 $52,300 Architecture $40,000 $47,000 $55,500 $15,500 Biological Sciences $42,900 $54,000 $89,500 $46,600 Business & Marketing $46,500 $59,400 $73,100 $26,600 Communication & Journalism $38,800 $48,600 $61,200 $22,400 Computer & Information Sciences $55,500 $72,100 $87,900 $32,400 Cultural Studies ^ ^ ^ ^ Education $41,800 $51,700 $63,100 $21,300 Engineering $59,700 $71,100 $82,800 $23,100 Engineering Technician $50,700 $64,900 $76,100 $25,400 English & Literature $36,400 $45,800 $58,000 $21,600 Family & Consumer Sciences $36,000 $45,000 $57,100 $21,100 Health Professions $47,800 $65,000 $83,200 $35,400 History $36,200 $45,900 $57,300 $21,100 Interdisciplinary Studies $44,000 $52,600 $64,100 $20,100 Languages & Linguistics $35,100 $46,500 $57,600 $22,500 Legal Studies $40,100 $48,500 $62,300 $22,200 Liberal Arts & Sciences $34,900 $46,000 $62,200 $27,300 Mathematics & Statistics $41,200 $56,700 $73,600 $32,400 Natural Resources ^ ^ ^ ^ Philosophy & Religious Studies $39,600 $49,500 $61,100 $21,500 Physical Sciences $41,400 $52,100 $77,500 $36,100 Psychology $33,200 $41,600 $54,100 $20,900 Public Administration $35,400 $42,300 $51,600 $16,200 Recreation & Fitness Studies $40,900 $53,700 $70,100 $29,200 Security & Protective Services $35,100 $44,300 $57,100 $22,000 Social Sciences $39,100 $48,000 $61,200 $22,100 Visual & Performing Arts $31,800 $44,200 $56,000 $24,200 Total $40,700 $52,800 $69,500 $28,800
*Includes graduates who worked and enrolled at the same time. ^Number of graduates too small to report in accordance with privacy laws and regulations. Sources: Board of Governors staff analysis of data from the Florida Education & Training Placement Information Program and the State University Data System.
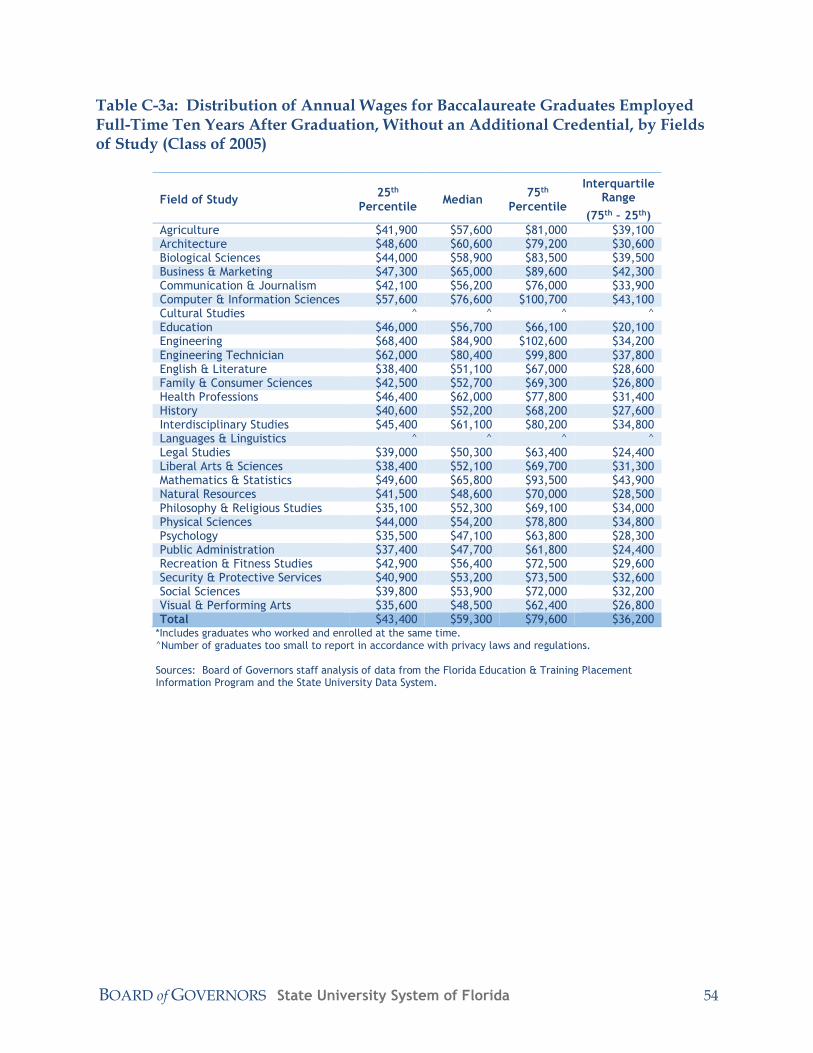
BOARD of GOVERNORS State University System of Florida 54
Table C-3a: Distribution of Annual Wages for Baccalaureate Graduates Employed Full-Time Ten Years After Graduation, Without an Additional Credential, by Fields of Study (Class of 2005)
Field of Study 25th
Percentile Median
75th Percentile
Interquartile Range
(75th – 25th)
Agriculture $41,900 $57,600 $81,000 $39,100 Architecture $48,600 $60,600 $79,200 $30,600 Biological Sciences $44,000 $58,900 $83,500 $39,500 Business & Marketing $47,300 $65,000 $89,600 $42,300 Communication & Journalism $42,100 $56,200 $76,000 $33,900 Computer & Information Sciences $57,600 $76,600 $100,700 $43,100 Cultural Studies ^ ^ ^ ^ Education $46,000 $56,700 $66,100 $20,100 Engineering $68,400 $84,900 $102,600 $34,200 Engineering Technician $62,000 $80,400 $99,800 $37,800 English & Literature $38,400 $51,100 $67,000 $28,600 Family & Consumer Sciences $42,500 $52,700 $69,300 $26,800 Health Professions $46,400 $62,000 $77,800 $31,400 History $40,600 $52,200 $68,200 $27,600 Interdisciplinary Studies $45,400 $61,100 $80,200 $34,800 Languages & Linguistics ^ ^ ^ ^ Legal Studies $39,000 $50,300 $63,400 $24,400 Liberal Arts & Sciences $38,400 $52,100 $69,700 $31,300 Mathematics & Statistics $49,600 $65,800 $93,500 $43,900 Natural Resources $41,500 $48,600 $70,000 $28,500 Philosophy & Religious Studies $35,100 $52,300 $69,100 $34,000 Physical Sciences $44,000 $54,200 $78,800 $34,800 Psychology $35,500 $47,100 $63,800 $28,300 Public Administration $37,400 $47,700 $61,800 $24,400 Recreation & Fitness Studies $42,900 $56,400 $72,500 $29,600 Security & Protective Services $40,900 $53,200 $73,500 $32,600 Social Sciences $39,800 $53,900 $72,000 $32,200 Visual & Performing Arts $35,600 $48,500 $62,400 $26,800 Total $43,400 $59,300 $79,600 $36,200
*Includes graduates who worked and enrolled at the same time. ^Number of graduates too small to report in accordance with privacy laws and regulations. Sources: Board of Governors staff analysis of data from the Florida Education & Training Placement Information Program and the State University Data System.
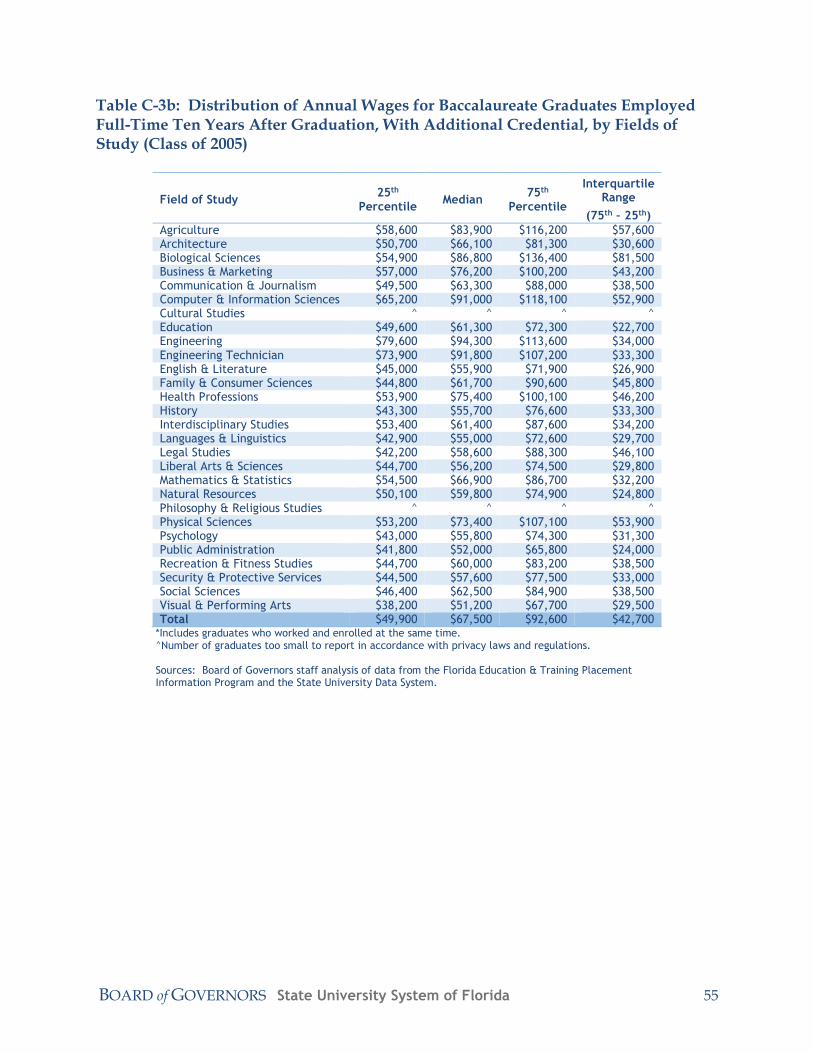
BOARD of GOVERNORS State University System of Florida 55
Table C-3b: Distribution of Annual Wages for Baccalaureate Graduates Employed Full-Time Ten Years After Graduation, With Additional Credential, by Fields of Study (Class of 2005)
Field of Study 25th
Percentile Median
75th Percentile
Interquartile Range
(75th – 25th)
Agriculture $58,600 $83,900 $116,200 $57,600 Architecture $50,700 $66,100 $81,300 $30,600 Biological Sciences $54,900 $86,800 $136,400 $81,500 Business & Marketing $57,000 $76,200 $100,200 $43,200 Communication & Journalism $49,500 $63,300 $88,000 $38,500 Computer & Information Sciences $65,200 $91,000 $118,100 $52,900 Cultural Studies ^ ^ ^ ^ Education $49,600 $61,300 $72,300 $22,700 Engineering $79,600 $94,300 $113,600 $34,000 Engineering Technician $73,900 $91,800 $107,200 $33,300 English & Literature $45,000 $55,900 $71,900 $26,900 Family & Consumer Sciences $44,800 $61,700 $90,600 $45,800 Health Professions $53,900 $75,400 $100,100 $46,200 History $43,300 $55,700 $76,600 $33,300 Interdisciplinary Studies $53,400 $61,400 $87,600 $34,200 Languages & Linguistics $42,900 $55,000 $72,600 $29,700 Legal Studies $42,200 $58,600 $88,300 $46,100 Liberal Arts & Sciences $44,700 $56,200 $74,500 $29,800 Mathematics & Statistics $54,500 $66,900 $86,700 $32,200 Natural Resources $50,100 $59,800 $74,900 $24,800 Philosophy & Religious Studies ^ ^ ^ ^ Physical Sciences $53,200 $73,400 $107,100 $53,900 Psychology $43,000 $55,800 $74,300 $31,300 Public Administration $41,800 $52,000 $65,800 $24,000 Recreation & Fitness Studies $44,700 $60,000 $83,200 $38,500 Security & Protective Services $44,500 $57,600 $77,500 $33,000 Social Sciences $46,400 $62,500 $84,900 $38,500 Visual & Performing Arts $38,200 $51,200 $67,700 $29,500 Total $49,900 $67,500 $92,600 $42,700
*Includes graduates who worked and enrolled at the same time. ^Number of graduates too small to report in accordance with privacy laws and regulations. Sources: Board of Governors staff analysis of data from the Florida Education & Training Placement Information Program and the State University Data System.

325 West Gaines Street, Suite 1614 Tallahassee, FL 32399-0400
Phone (850) 245-0466 Fax (850) 245-9685
www.flbog.edu