baby boomlets and baby health: hospital …economics.ucr.edu/repec/ucr/wpaper/201440.pdf · baby...
TRANSCRIPT
1
Baby Boomlets and Baby Health:
Hospital Crowdedness, Treatment Intensity, and Infant Health
By MINDY MARKS AND MOONKYUNG KATE CHOI*
To identify the causal relationship between health care spending
and infant health, we introduce a new instrument: the number of
infants born on a given day in a given hospital. The thought
experiment is on a crowded day at-risk infants receive reduced care
because resource constraints are binding. Using detailed
information on every birth in California from 2002 to 2006, we find
that hospital crowdedness impacts treatment intensity. We show that
OLS estimates overestimate the benefits of medical care. Our results
suggest that the mortality benefits from additional spending are
negligible and that more intensive treatment increases hospital
readmission rates. (JEL codes: I12, I18)
* Marks: Department of Economics, University of California, Riverside, 4110 Sproul Hall, Riverside, CA 92521 (e-mail:
[email protected]) Choi: Keck Graduate Institute, 535 Watson Drive, Claremont, CA 91711 (e-mail:
[email protected]). This work benefited from conversations with Jorge Agüero, Douglas Almond, Carlos Dobkins,
David Fairris, Mireille Jacobson, Geoffrey Joyce, Marc Law, Thomas Rice, John Romley, and Todd Sorensen. We thank
seminar participants at Colorado University-Denver, University of California-Los Angeles, University of California-
Riverside, University of Connecticut University of Southern California, and the Western Economics Association. We also
thank Ann Finkelstein and Sun Kim for helpful discussions regarding the clinical practices for newborns and the staff at the
State of California Office of Statewide Health Planning and Development. The content of this work does not reflect the
views of OSHPD. We are, of course, solely responsible for any errors.
2
I. Introduction Childbirth is the most common medical procedure. According to Nationwide
Inpatient Sample data (HCUP, 2005), almost 19 percent of all hospitalization
were related to childbirth. Moreover, the second and third most expensive
condition treated in US hospitals were “Mother’s pregnancy and delivery” and
“newborn infants”, which accounted for 5.2 percent and 4.3 percent of the
national hospital bill, respectively (Russo and Andrews, 2006). Despite escalating
health care cost, little consensus has emerged about the value of additional
hospital care for newborns.1
The key methodological challenge when identifying the causal
relationship between health care spending and health is non-random selection of
patients into treatment. To clearly identify the relationship between treatment
intensity and health, an exogenous source of variation in treatment intensity is
needed. This paper introduces a new identifying variable: hospital crowdedness
measured in its simplest form by the number of infants born on a given day in a
given hospital. We examine the effectiveness of additional treatment that stems
from the non-uniform distribution of birth dates within a given hospital.2 The
thought experiment is that on a relatively uncrowded day an infant may receive
more care either because the resource constraints are less binding or because
health care providers respond to the temporary income shock by performing
additional procedures.
1 Evidence from studies investigating the effectiveness of new therapeutic improvements tends to suggest that additional
spending generates declines in infant mortality (Richardson et. al., 1998; Cutler, 2005; Phibbs et. al., 2007; Almond et. al.,
2010). However, other work suggests that neonatal resources have expanded to the point where additional benefits are
negligible. (Goodman et. al., 2002). Using exogenous variation in access to treatment generated by Medicaid expansion,
Currie and Gruber (1996) show that additional treatments to pregnant women and children lowered infant mortality, while
Haas et. al. (1993) and Piper et. al. (1990) find no impact of Medicaid expansion on infant health. 2 This approach is similar in spirit to Hoxby (2000) who looks at the effect of class size on student achievement using
exogenous variation in class size that stems from idiosyncratic variation in the population.

3
We compare infant health within the same hospital using variation in
hospital charges per birth that arises from short-term hospital crowding after
netting out time period (day of the week, month of the year, and calendar year)
effects. By exploiting the variation in crowdedness within hospital and time
period, our estimates are free of bias due to heterogeneity in health outcomes
associated with resource availability, resource quality, or patient mix among
hospitals and across time periods. After netting out time period effects, the
number of infants born on a given day in a given hospital is a plausible instrument
because the number of other infants who share the target infant’s birthday should
not have any independent impact on the target infant’s health other than through
the intensity of hospital care reflected in hospital charges. Moreover, the number
of other infants born on a given day in a given hospital is highly correlated with
health care spending for the target infant and other measures of treatment intensity.
Previous studies have used legislative mandates, specifically mandatory
minimum length of stay coverage for hospitalization after birth to obtain estimates
of the causal impact of additional treatment on infant health as measured by infant
mortality and/or hospital readmission. These studies find no benefit of longer
postpartum hospital stay on infant mortality and mixed results for readmission.3
However, these studies are biased towards finding a null effect of treatment on
infant health because their identification stems from treatment that is altered
3 Madden et. al. (2002) find little or no relationship between postpartum hospital stays and hospital readmission rates.
Meara et. al. (2004) find rates of all-cause rehospitalization did not change in the year after legislation was introduced.
Datar and Sood (2006) find that longer hospital stays for newborns are associated with lower probabilities of hospital
readmissions but no impact on infant mortality. Using a similar methodology as Datar and Sood but a richer restricted use
dataset, Evans et. al. (2008) find no effect of mandated extended hospital stays on infant mortality rate and mixed results
for readmission rates depending on the medical risk of the subgroup. Almond and Doyle (2011) find that infants born
shortly after midnight have longer hospital stays than infants born shortly before midnight due to hospital billing practice.
They show that remaining in the hospital longer has no effect on readmission or mortality. Evans and Garthwaite (2012)
find that for average newborn impacted by the law, longer stays have a statistically insignificant impact on hospital
readmission rates. However, they find impacts for those infants with a high likelihood of readmission.
4
because of legislative mandates not the decision of medical personnel. If health
care providers were practicing effectively, it is not surprising that laws that
require longer hospitalization stays for infants (who would have been voluntarily
discharged by medical personnel before the insurance mandate) do not produce
any health gains. A related literature uses state-level variation in malpractice
reform. Currie and Macleod (2008) find no impact of a reduction in procedures
such as Caesarean section and inducement on newborn health following tort
reform. A null effect of treatment intensity on newborn health might be expected,
if the procedures eliminated are procedures of marginal medical value, procedures
which the medical community was only performing out of fear of lawsuits.
Unlike these studies, our empirical approach exploits variation in
treatment that stems from decisions made by medical personnel when responding
to hospital capacity constraints. In other words, we are identifying the impact of
care medical personnel chose to add when unconstrained, which is likely to be of
more value than care added by legislative mandate or fear of malpractice. In
addition, we estimate a policy relevant Local Average Treatment Effect. The
infants who receive less care when the hospital is crowded are precisely the
infants who would be the first ones to receive less care if hospitals became more
resource constrained due to hospital closures or an increasing birth rate.
We focus on the causal relationship between hospital spending and infant
health measured by mortality and hospital readmission.4 As the best available
summary measure of health inputs, hospital charges reflects length of stay,
number of procedures, and kinds of procedures performed during the
4 There is a large related literature on hospital treatment intensity and adult health. Recent studies which use variation in
treatment from exogenous changes in insurance coverage (Card et. al., 2009) or from automobile accident (Doyle, 2005)
suggest that additional hospital care improves adult mortality. Picone et. al. (2003) find that higher hospitalization costs
improve patient survival. However, studies that use geographic variation in hospital spending tend to find little to no
benefit from additional spending (Skinner et. al., 2005; Landrum et. al., 2008).
5
hospitalization. Health care spending is also at the center of the policy debates.
We further focus on at-risk infants. At-risk infants are those who are either born
prematurely or with low birth weight. Our analysis suggests that differences in
hospital charges between infants born on crowded days and uncrowded days are
especially pronounced among at-risk infants. Additionally, mortality and hospital
readmission are uncommon for non-at-risk infants. For example, the average one-
year mortality rate for at-risk infants is 2.7 percent compare to 0.2 percent for
those infants who are not at-risk. The very low mortality and readmission rates for
non-at-risk infants could mask the beneficial effects of higher hospital spending.
Our dataset captures every birth that occurred in a California hospital
between 2002 and 2006. After conditioning on a rich set of control variables, OLS
estimates suggest that higher health care spending is associated with improved
infant health. Our main finding is that at-risk infants who had more intensive
hospital stays because they were born on uncrowded days fared no better than
their busy day counterparts, and may fare worse. Additional health care spending
does not improve infant health status as measured by neonatal (28 day) mortality
or one-year mortality rates. When infant health is measured by 28-day
readmission rate, we find evidence that additional spending is harmful. These
finding are robust to alternative measures of crowdedness that account for the
duration of the hospital stay. When we look at alternative measures of treatment
intensity, similar findings are obtained.
Two related works document that hospitals respond to short-term variation
in hospital crowdedness by reducing care. Evans and Kim (2006) find some
evidence that “high-risk” adults who are admitted to a California hospital on a
Thursday have slightly shorter lengths of stays if the following Friday and
Saturday have above average admissions. Freedman (2012) documents that the
probability of admissions to a Neonatal Intensive Care Unit (NICU) increases
when there are more vacant NICU beds in an infant’s delivery hospital the day
6
prior to birth. The effect is particularly large for low birth weight infants for
whom there is discretion over the appropriate amount of treatment. These results
align with our findings that hospitals change their treatment decisions in response
to short-term variations in capacity constraints. In reduced form regressions,
Evans and Kim (2006) find no impact of busy Friday/Saturdays on adult mortality,
and small and normally insignificant impacts on readmission probabilities. They
do not look at hospital charges or directly investigate the effect of length of stay
on health outcomes. While interested in the causal impact of NICU admission on
infant health, Freedman (2012) argues that it is inappropriate to use empty NICU
beds as an instrument to estimate the effect of NICU admissions on hospital
charges and health outcomes. First, NICU capacity may impact costs and
outcomes through avenues other than NICU admission, say by substitution of
resources between NICU and non-NICU patients. Since we focus on the impact of
changes in hospital spending and not changes in NICU admissions in response to
crowdedness, our estimates do not suffer from this concern. Second, Freedman
states that infants who are placed into a NICU because there are empty beds are
likely to be unobservably healthier violating the exclusion restriction.5
This paper is organized as follows: Section II describes the dataset and
provides support for our empirical strategy. Section III discusses the relationship
between hospital crowdedness and hospital spending. Section IV presents our
main findings. Section V presents and discusses results from various robustness
checks. Section VI discusses alternative explanations for our findings, and Section
VII concludes the paper.
5 Reduced formed estimates in Freedman (2012) suggest that low and very low birth weight infants born on days with
vacant NICU beds have lower mortality rates, thus suggesting that additional capacity in the form of NICU beds would
increase infant health. He notes that estimates on mortality due to empty NICU beds may overstate the true health effects if
unobservably healthier infants are placed in the NICU. If we estimate a reduced form equation similar to the one estimated
by Freedman, we find that infant born on days with relatively few deliveries have higher mortality rates. Freedman finds
no impact of empty NICU beds on 28-day readmission.
7
II. Data and Descriptive Statistics
A. Data
The data used in this study are confidential data provided by the California Office
of Statewide Health Planning and Development (OSHPD). The OSHPD data link
infant hospital discharge records for all hospital stays during the first year of life
with birth and death certificate data. The OSHPD data provide birth date and birth
hospital for every hospital birth in California between 2002 and 2006, which are
used to generate our identifying variable, the hospital-level crowdedness on
delivery day. While lacking complete health procedure information, the data
contain hospital charges for both infant and mother and length of hospital stay. It
also provides detailed information on prenatal care, parental demographic
information, newborn characteristics. We can exploit the linked nature of our data
and construct our measures of newborn health: whether the newborn died within
28 days, died within a year, or was readmitted to any California hospital within 28
days6.
For the purposes of this study, we measure hospital charges/spending7 as
the sum of hospital charges from all consecutive hospital stays after birth. If a
newborn was transferred from the birth hospital, we track the infant charges for
all transferred hospitals stays until the newborn was discharged and included
6 We cannot identify readmission if it occurs out of the state of California or if the infant is readmitted to a Federal
hospital. Similarly we cannot identify an infant death if it occurs outside the state of California.
7 Throughout the paper we will use the terms hospital charges and spending interchangeably. Hospital charges include all
charges for services rendered during the infant’s stay at the facility, based on the hospital fully established rates. Hospital-
based physician fees are excluded. We assume that hospital charges and physician fees are positively correlated.
Additionally, hospital charges could be thought of as list prices, the actual prices are often much lower and vary by hospital
and insurance companies. Thus we control for hospital fixed effects and type of insurance coverage in all regressions. We
have no reason to believe that the negotiated price varies by the daily hospital crowdedness.

8
these charges in our measure of infant hospital charges. Similarly, hospital stay is
the length of consecutive hospital stays after the birth including transfers.
Initial data from OSHPD contained 2,675,954 birth records with birth date
and birth hospital. We exclude all Kaiser Foundation Hospitals because Kaiser
Hospitals are exempt from reporting hospital charges. Instead of charging
specifically for an inpatient stay, Kaiser Hospitals receive a constant monthly
(capitated) payment from each member, whether or not that member is
hospitalized. Additionally, a small fraction of our sample (less than three percent)
is born in a hospital where very few deliveries occur. Because there is limited
variation in crowdedness, we exclude all hospitals where the average daily
number of births is less than two. This leaves us 2,329,810 births at 226
California hospitals. We construct our daily crowdedness measures from this
sample.
Our analysis sample is further restricted to at-risk infants.8 We classify an
infant as at-risk if she is low birth weight or premature. Following Centers for
Disease Control and Prevention definitions, we limit the sample to those births
where birth weight was less than 2500 grams or gestation length was shorter than
37 weeks. We drop the handful of records with missing hospital charge
information.9 We also drop infants born during the first and the last weeks of our
sample period. When we extend our measure of crowdedness, we cannot obtain
the number of infants born before or after the delivery day for those infants born
on the first or last week of the sample period, respectively. Among the 2.3 million
infants that are born in one of 226 California hospitals between the years 2002
and 2006, there are 302,649 at-risk infants. 8 If we conduct the analysis for all California births, we obtain qualitatively similar findings. If we focus on the non-at-
risk infants, we find a small negative relationship between hospital crowdedness and hospital charges which can be entirely
explained by longer hospital stays. 9 There were 391 observations with missing information on hospital charges. While the mortality rate for those with
missing charge is very high, it is higher on slow day deliveries (49/79 or 62%), than busy day deliveries (58/102 or 57%).

9
Table 1 reports the summary statistics for our analysis sample of at-risk
infants as well as the births which are used to construct the daily hospital
crowdedness measures. The average infant in the analysis sample is born to a 28
year-old woman who completed high school. Over half of all births are to
Hispanic women, and more than half of the births are covered under Medicaid.
The average hospital charge for at-risk infants is around $64,000. Charges
increase to $81,326 if we include hospital charges billed to the mother for the
delivery. The average length of stay in hospital is 3.38 days, which rises to 10
days for at-risk infants. While one-year mortality of all infants is 0.5 percent that
of at-risk infants is more than five times higher at 2.7 percent. The 28 day
readmission rate for at-risk infants is 11.6 percent, four times higher than the rate
for all infants. About 16 percent of at-risk births are multiple births compared to
only 3 percent of all births.
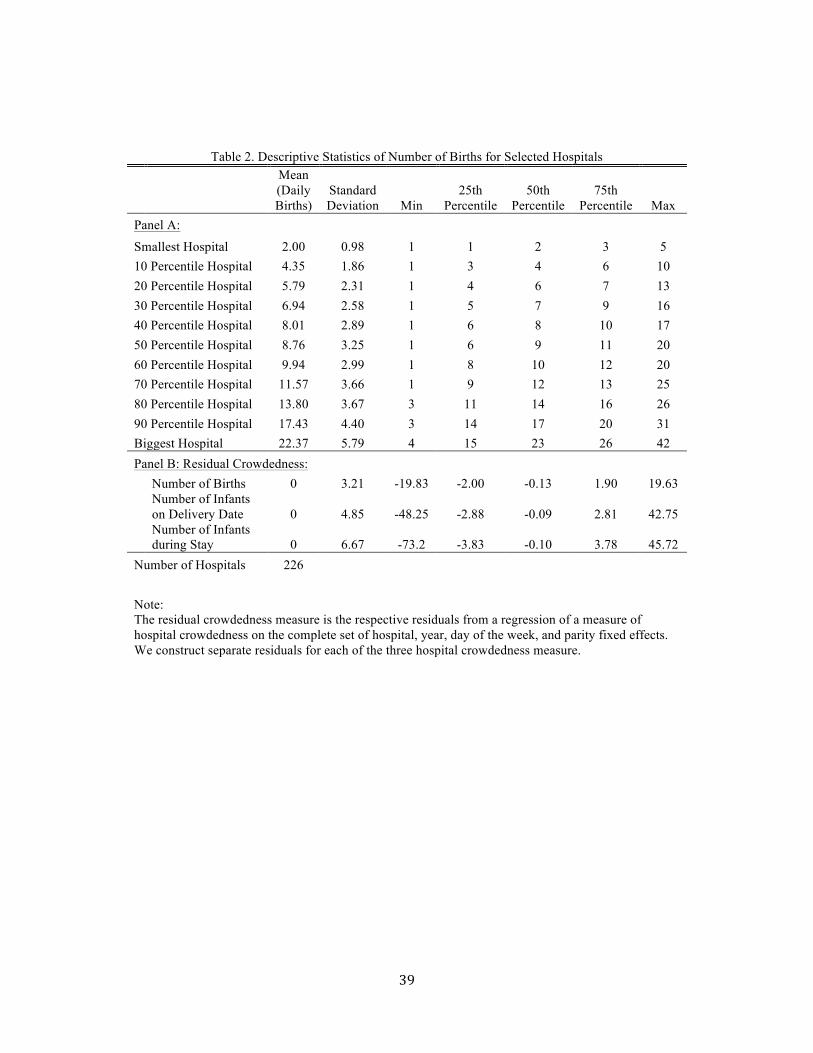
B. Variation in Daily Hospital Crowdedness
Our identification strategy requires sufficient within hospital variation in the daily
number of births. Panel A of Table 2 reports descriptive statistics for selected
representative hospitals. Based on the average daily number of births, the smallest,
every 10th percentile, and the largest hospitals are shown. The columns show the
mean, the standard deviation, the minimum, the quartiles, and the maximum
number of infants born a day for each representative hospital during our sample
period. Table 2 shows there is sizable variation in the number of births within a
given hospital. For example, in the 50th percentile hospital, 20 infants were born
on the busiest day and only one infant was born on the slowest day. The
interquartile ranges are also sizable.
While the numbers in Panel A give a sense of the underlying variation in
crowdedness, the identification strategy is based on exogenous variation in
hospital crowdedness. To isolate the plausibly exogenous variation in daily

10
hospital crowdedness, we construct a residual crowdedness measure which
captures the variation in crowdedness after netting out parity, hospital, and timing
effects. Specifically, the residual crowdedness measure is the eijt’s from equation
(1).
(1) Number of Birthsijt = Parityijt + Hospitalij + Day of the Weekit + Yearit + eijt
Number of Birthsijt is the number of births in hospital j, on infant i’s birth
date t. Parityijt is a set of indicators for multiple births (twins, triplets, and
quadruplets or more). We include parity, because multiple births are
mathematically correlated with daily hospital crowdedness, and multiple births
are associated worse health outcomes. Thus the variation in crowdedness that
stems from multiple births violates the exclusion restriction.
The hospitals in our sample vary in capacity and resources, both of which
are associated with better health outcomes (Gaynor et. al., 2005; Phibbs et al.,
2007; Wehby et. al., 2012 Evans and Kim 2006), thus we include hospital fixed
effects in equation (1). We condition on day of the week, because there are
significantly more births on weekdays than weekends, and numerous authors have
documented an association between weekend births and higher infant mortality
rates (MacFarlane, 1978; Rindfuss et. al., 1979; Mangold, 1981). We further net
out year fixed effects to avoid the bias from the correlation between increase in
the number of births over time and the increase in hospital charges and infant
health over time.
The first row of Panel B in Table 2 summarizes the variation in the
residuals for our main crowdedness measure: daily number of births. In essence,
the residual crowdedness measure captures the variation in hospital crowdedness
after netting out parity, hospital, and time effects. Even after netting out variables
that are associated with crowdedness, there is sizable variation in daily
11
crowdedness. The residuals range from -19.83 to 19.63. At the 25th percentile of
the residual distribution, there are 2 fewer daily births than the hospital-year-day
of the week average, at the 75th percentile there are 1.9 more births than the
hospital-year-day of the week average. Throughout the paper we refer to slow
days as days with residuals in the bottom quartile of the residual distribution and
busy days as days with residuals in the top quartile. The standard deviation of the
residual crowdedness measure is 3.21 (by construction the mean is zero). We will
discuss the magnitude of the first stage results assuming a change in the number
of daily births of one standard deviation of the residual crowdedness measure.
C. Observable Characteristics by Hospital Crowdedness
The underlying assumption for our identification strategy is that hospital
crowdedness should be uncorrelated with any infant level observable (and
unobservable) trait that may impact infant health. We present evidence on the
validity of our approach by reporting summary statistics separately for at-risk
infants born on busy and slow days. Recall that for a given hospital, a delivery day
is defined as busy/slow if the day is in the top/bottom quartile in the residual
crowdedness distribution. In essence we ask, given a hospital, year, day of week,
singleton or multiple births, whether infants born on slow days are different for
their counterparts born on busy days in terms of observable characteristics. If
there are differences in observable traits, it calls into question the identification
strategy as it suggests that slow day births may differ in their health outcomes for
reasons other than hospital crowdedness.
While conditioning on parity, hospital, year, and day of the week rules out
many obvious threats to identification, other possible threats remain. One possible
threat would be hospitals rerouting mothers in labor. If crowded hospitals direct
mothers to less crowded hospitals based on potential delivery complications, our
estimates would be biased because the underlying health status of infants born

12
would be correlated with hospital crowdedness. Alternatively, say that extremely
warm weather creates pregnancy complications that induce early labor. If so
warm days would be more crowded, and those infants born on warm days would
need more treatments due to shorter gestation lengths, thus threatening our
identification strategy.
Table 3 presents evidence on validity of our instrument. The average busy
day has about twice as many births as the average slow day. Hospitals do not
appear to be using transfers to alleviate crowdedness. The underlying transfer rate
is small. The likelihood of transfer at some point during the initial hospitalization
is 0.1 percentage point higher on busy days. However the likelihood of transfer to
another hospital on the infant’s birth date is 0.1 percentage point lower on busy
days.10
The rest of the table demonstrates that for many important infant
background variables slow day births mirror their busy day counterparts. Slow day
infants and busy day infants received similar levels of prenatal care. Parents of
slow day infants tend to be younger and less educated. However the size of the
difference is very small. For example, mothers of slow day infants are younger
than mothers of busy day infants by 0.11 year, which is less than 40 days. The
difference in maternal education is only 0.09 years. Differences in paternal
education and age are also small. The gender and racial distribution of infant born
on slow and busy days are almost identical. Importantly, insurance status also
shows identical coverage across slow and busy day births. Generally, the
differences in observable traits between infants born on slow and busy days are
negligible.
10 To further investigate if hospitals are transferring newborns to relieve crowdedness, we estimated a regression of the
likelihood of transfer on the infant’s birth date on hospital crowdedness and a complete set of control variables. We find a
small negative and statistically insignificant coefficient on the hospital crowdedness variable.
13
Given that we find that the reduction in spending associated with crowded
days does not harm infant health, we would be concerned if busy day infants are
healthier than their slow day counterparts. Slow and busy day infants have
identical likelihood of reporting pregnancy complications. Additionally Caesarean
section rates are also identical between slow day infants and busy day infants.
Birth weight and gestation length are the most commonly used indicators of
newborn health. The length of gestation for slow day infants and busy day infants
are almost identical while at-risk infants born on slow days are only 8 grams
lighter than their busy day counterparts.
Overall, Table 3 shows that, once we condition on hospital, year, day of
the week, and parity, there are no apparent differences in observable family
background and health indicators across infants born on crowded and uncrowded
days. This suggests that the level of crowdedness is orthogonal to underlying
infant characteristics that may impact spending and health. Hospital crowdedness
thus mimics an experiment in which nature assigns, to each infant, a level of
treatment intensity, independent of her background.
The bottom panels of Table 3 presents preliminary evidence of our
findings. Despite the very similar pregnancy, newborn, parental, and insurance
characteristics, infants born on slow days are treated more intensively than their
busy day counterparts. Specifically, slow day infants report an additional $3,592
in hospital charges and an additional half day of hospitalization. Despite receiving
more intensive medical care, slow day infants report slightly higher neonatal
mortality, one-year mortality, and 28-day readmission rates which suggest the
additional spending does not improve, and may harm, infant health.
III. The Impact of Daily Hospital Crowdedness on Hospital Spending

14
Figure 1 shows a visual representation of the relationship between hospital
crowdedness and hospital charges. Specifically, Figure 1 plots the difference in
average infant hospital charges between busy and slow day births grouped by 300
gram birth weight bins plotted at the midpoint. For instance, the data point which
corresponds to 1350g shows the difference in average hospital charge for at-risk
infants with birth weights between 1200g and 1500g. Infants in this birth weight
category born on slow days have an additional $4,022 in hospital spending. As is
clear from the figure, throughout the birth weight distribution, there are sizable
differences in spending in favor of slow day infants.
Equation (2) formalizes the relationship between hospital crowdedness
and health spending utilizing the difference in health care spending that arises
from variation in the number of infants born on a given day in a given hospital.
The first-stage equation for the IV estimate is:
2 Spending!"# = θ!Number of Births!"# + X!"#! θ!+ φ! + λ! +ω!"#
where Spending!"# is log of hospital charge for infant i born in hospital j at time t.
If infant i was transferred to another California hospital after delivery, we tracked
all transferred hospital stays and added all listed hospital charges to construct the
infant spending measure. The key variable Number of Birthsijt captures the
number of infants born on infant i’s date of birth in hospital j on day t.
X!"#! is a vector of control variables. Included in X!"#! are pregnancy
characteristics (the number of prenatal care visits, month the prenatal care began,
and an indicator for pregnancy complications), parental characteristics
(categorical dummy variables for age and education of mother and father, and
insurance type), and newborn characteristics (gender, race, parity (twins, triplets,
quadruples or more), and an indicator for whether the infant was the first born).
15
Flexible measures of birth weight and length of gestation are also included in X!"#! .
Because of the nonlinear impact on infant health, birth weight is categorized at
500g intervals and length of gestation is categorized at two week intervals.
φ! is a set of time indicators for the day of the week, month of the year,
major holiday (New Year’s Day, Independence Day, Thanksgiving Day, or
Christmas), and year. As mentioned earlier, there is an established association
between weekend births and higher infant mortality rates. If weekends have lower
quality staff and/or unobservably sicker infants, then weekend births will have
poor health outcomes, and failure to control for the day of the week would bias
our result.11 We include indicator variable for each month of the year to account
for the fact that infant and maternal characteristics are not uniformly distributed
throughout the year (Dehejia and Muney, 2004; Buckles and Hungerman, 2013;
Currie and Schwandt, 2013). There is seasonal variation in crowdedness as more
children are born in summer months than in other months of the year. We also
control for four major holidays when we observe a significant drop in the number
of infants born. We suspect that the level and quality of hospital staffs and
hospital care might be different on holidays. The year fixed effects control for the
possible differences in health care price, resource capacity, and medical
technology and knowledge over time which may be correlated with crowdedness.
λ! is a set of hospital fixed effects. Hospital fixed effects control for any hospital
specific characteristic that may impact infant health. This includes variation in
level of technology, training of staff, resource capacity and patient mix. Robust
standard errors are clustered at the hospital level.
Table 4 reports the results of equation (2). When the number of infants
born on a given day in a given hospital increases by one, hospital spending per at- 11 However, more recent works (Dowding et. al., 1987; Gould et. al, 2003; Hamilton and Restrepo, 2003) show that
difference in underlying infants’ health and family background across weekend and weekday birth can account for the
difference in mortality rates.

16
risk birth decreases by 0.41 percent. Since the average hospital charge for an at-
risk birth is $64,126, a one standard deviation increase in residual crowdedness is
associated with a decrease in hospital spending of $846. The first stage F-statistics
is 17.58, thus we do not have a weak instrument problem.
We note that the reduction in spending does not simply reflect the fact that
infants born on relatively uncrowded days have higher Caesarean section rates or
longer hospital stays. To investigate the sensitivity of our results, we have
estimated regressions including Caesarean section as an additional control in
equation (2). The coefficient on Number of Birthsijt is unchanged, suggesting that
increased use of Caesarean section is not driving the observed increase in
spending.12 If we include length of hospital stay in equation (2), the coefficient
on Number of Birthsijt decreases by 25 percent but remains statistically significant
at the one-percent level. While a quarter of the decrease in hospital charge can be
attributed to longer hospital stays, the remaining 75 percent of the decrease in
hospital charge is associated with more intense treatment. The first stage result
provides strong evidence that health care providers change the intensity of
treatment based on the short-term fluctuations in crowdedness in the hospital.
IV. The Effectiveness of the Health Care Spending on Newborn Health
Having established that hospital crowdedness is associated with lower spending,
in this section, we investigate if this decrease in spending translates into worse
infant health. Economic theory suggests, at the margin, the benefit of treatment
will be smaller than the cost of providing care especially in the infant health
setting. The infant health setting faces a combination of high prices for inputs,
poorly restrained incentives for overutilization, and high incidence for malpractice
12 We have also directly investigated if hospital crowdedness induces more Caesarean sections. The regression result
(available upon request) reports statistically insignificant relationship between crowdedness and Caesarean section. Finally,
our null relationship between spending and infant health persists in the sample of vaginal delivery infants.

17
lawsuits (Anupam, 2011). Additionally, the vast majority of births are covered by
insurance which leads to inefficient overutilization due to moral hazard (Pauly,
1968).
Figure 2 provides graphical evidence that the additional spending that
occurs on slow days does not translate into better health outcomes. Figure 2
reports the differences in one-year infant mortality rate between busy and slow
day infants by the same 300 gram birth weight bins used in Figure 1. Despite the
higher spending documented in Figure 1, slow day infants seem to, if anything,
have higher mortality rates than their busy day counterparts. As is clear in Figure
2, across the birth weight distribution, the additional spending that slow day
infants receive does not appear to translate into lower mortality.
To formally measure the causal effect of health care spending on infant
health, we use equation (3) for the second stage estimation in our two-stage least
square (2SLS) model:
3 Y!"# = β!Spendıng!"# + X!"#! β! + λ!+ φ! + ε!"#
where the dependent variable Y!"# is an indicator of the health status of infant i
who was born in hospital j at time t. We employ neonatal mortality, one-year
mortality, and 28-day readmission rates as measures of infant health. 13
Spendıng!"# is predicted log of hospital charge for infant i from equation (2).14
The rest of the control variables are the same as in equation (2).
OLS estimates of β! are likely to be biased due to unobserved variables
in ε!"#. The direction of bias is given by two elements: the relationship between 13 As a robustness check, we tried restricting the outcome variable to mortality rate from non-accidental causes only
(excluding ICD-10 code 295-350). The results (available upon request) are similar to those when mortality from all causes
is the outcome variable. 14 Equation (3) is shown for conceptual purposes only. When performing our analysis, we use the ivreg2 commend in
Stata.
18
the omitted variable and the outcome variable (Infant Health), and the relationship
between the omitted variable and the variable of interest (Hospital Spending).
Consider the case where unobservable parental characteristics such as
cautiousness/responsibility influence infant health. If parental cautiousness
correlates negatively with infant mortality or hospital readmission and positively
with spending at birth (say, because cautious parents tend to have better insurance
and/or demand additional or more expensive treatments at birth for their
newborns), not including this variable in the equation (3) biases the OLS
estimates downwards, since part of the estimated beneficial effect of spending on
infant mortality or readmission can be attributed to parental cautiousness. On the
other hand, less healthy infants may receive more intensive hospital treatment and
have higher mortality and readmission rates biasing estimates of the returns to
such care upward in situations where the medical practitioners can observe more
health information than the econometrician. Since we have rich initial health
measures, we expect the bias due to omitting parental characteristics will
dominate and that OLS estimates will overstate the positive relationship between
treatment intensity and infant health. We use hospital crowdedness to instrument
for Spendingijt in equation (2) to address the endogeneity of health care spending.
Table 5 reports the estimated effects of hospital spending on infant health
from a linear probability model where we first ignore and then address the
endogeneity of health care spending. Column (i) in Table 5 reports the OLS
estimates of the relationship between health care spending and the three infant
health outcomes. The OLS results suggest that additional hospital spending leads
to a statistically significant decrease in neonatal mortality, one-year mortality, and
28-day readmission rates. A ten percent increase in spending on at-risk infant is
associated with 0.21 percentage point decrease in one-year mortality from a base
of 2.7 percent, and 0.08 percentage point decrease in readmission rate from a base
of 11.6 percent.
19
Column (ii) contains the corresponding 2SLS estimates of the impact of
hospital charges on infant health. The Wu-Hausman F-tests indicate that the OLS
estimates are biased towards finding a beneficial impact of hospital spending.
When we use the exogenous variation in spending that arises from the relaxation
of a capacity constraint, the marginal benefit of hospital spending on infant health
is, at best, negligible. This is a key result of the paper. The additional spending on
the infants who were born on slower days does not improve infant health as
measured by neonatal mortality, one-year mortality, or 28-day readmission rates.
Although statistically insignificant, the coefficients on the infant mortality
measures are positive. Note that these outcomes are uncommon, making power a
challenge even for at-risk infants (Evans, Garthwaite, and Wei, 2008). The result
on readmission is statistically significant and implies that additional hospital
spending increases the likelihood of hospital readmission. Specifically, a ten
percent increase in spending on at-risk infants leads to 0.56 percentage point
increase in the 28-day readmission rate. Together these results imply that, if
anything, the additional health care spending harms the infants: a phenomenon
known as iatrogenic harm. Numerous studies (Black, 1998; Fisher et. al., 2003;
Landrum et. al., 2008; Grady and Redberg, 2010) find evidence consistent with
iatrogenic harm. These studies argue that additional medical care might be
harmful to patients because all treatments entail some risk. Additionally, greater
use of diagnostic tests may find abnormalities which would not have caused harm
and longer hospital stays increase the risk of infections.
Our IV estimates are identified off of infants who have additional charges
billed solely because they were born on slow days. Given that the Table 6 reports
increased infant mortality and hospital readmission associated with additional
spending, we conclude that, on the margin, additional spending does not reduce
infant mortality. In the next section we investigate the robustness of this finding.

20
V. Robustness Tests
a. Alternative Measures of Hospital Crowdedness
Thus far, hospital crowdedness is measured by the number of infants born on a
given day in a given hospital. However, a newborn might also compete with
infants born before and/or after her birth date for medical resources such as
hospital beds, access to medical procedures, and hospital staff. Hence we create
two alternative measures of crowdedness: Number of Infants on Delivery Date
and Number of Infants during Stay. Equations (4) and (5) show the first step of
how we construct these measures.
(4) Number of Infants Born Beforeij =
⍵1!× number of non_at_risk infants!"#!!!!!!
+ ⍵2!× number of at_risk infants!"#!!"!!!!
(5) Number of Infants Born Afterij =
⍵1!× number of non_at_risk infants!"#!!!!
+ ⍵2!× number of at_risk infants!"#!"!!!
Number of Infants Born Beforeij is a weighted sum of the number of
infants born in hospital j on the days prior to infant i’s birthday where the weights
(⍵1, ⍵2) correspond to fraction of non-at-risk and at-risk infant, respectively who
remain in the hospital on the target infant’s date of birth. Because at-risk infants
have longer hospital stays, we use different lengths (s, r) and weights for at-risk
infants and non-at-risk infants. For example, when s is -1, we determine the
number of non-at-risk infants born one day prior to the target infant’s birth date in
hospital j and set ω1!! to 0.74, because 74 percent of non-at-risk infants remain

21
in the hospital one day after they are born. We account for the non-at-risk births
that happened up to seven days before. By the seventh day, more than 98 percent
of non-at-risk infants are discharged from hospitals. We include at-risk infants
born up to 14 days before the target infant’s birth date.15 We employ a similar
procedure to compute Number of Infants Born After using the same lengths and
weights.
Using equations (6) and (7), we then construct two alternative instruments:
expected Number of Infants on Delivery Date and expected Number of Infants
during Stay
(6) Number of Infants on Delivery Dateijt = Number of Birthsij
+ Number of Infants Born Beforeij
(7) Number of Infants during Stayij = Number of Birthsij
+ Number of Infants Born Beforeij
+ Number of Infants Born Afterij
The average number of infants in the hospital on the target infant’s
delivery date is 23.1 and the average number of infants during the hospital stay is
35.8. We replace Number of Birthsijt in equation (1) with Number of Infants on
Delivery Dateijt and Number of Infants during Stayijt, respectively to construct two
additional residual crowdedness measures. Panel B of Table 2 summarizes the
additional measures of residual crowdedness from equation (1). These new
residual crowdedness measures report smaller minimums, larger maximums, and
wider interquartile ranges than the measure using only the crowdedness on the
15 Sixteen percent of at-risk infants remain in the hospital for longer than 14 days. Given the small number of at-risk
infants born a given day in a given hospital, extending beyond 14 days does not make a meaningful difference in the
calculations.

22
target infant’s birthday. The respective standard deviations of the new residuals
are 4.85 and 6.67. When using the alternative measures of crowdedness, we will
discuss the magnitude of the first stage results in the context of one standard
deviation change in the new residual crowdedness measures.
Panel A in Table 6 reports the first stage regression results of equation (2)
using three measures of hospital crowdedness. Column (ii) replicates the findings
from Table 4 for comparison purposes. Columns (iii) and (iv) shows the results
where Crowdedijt is measured by the expected number of infants on the target
infant’s delivery date and the expected number of infants during hospital stay,
respectively. If newborns compete with infants born a few days before and/or
after their birth date for medical resources, then these alternative measures of
crowdedness should have stronger first stage results. Both additional measures of
hospital crowdedness reveal a large, negative, and statistically significant
relationship between hospital crowdedness and infant hospital charges. A one
standard deviation decrease in either of the alternative residual crowdedness
measures corresponds to an increase in spending around $1,300. Both the
predicted change in hospital spending and the F-statistics are larger for the
alternative measures of crowdedness suggesting that hospital treatment intensity
is also influenced by crowdedness of the days surrounding the target infant’s birth
date.16 Overall, the first stage results provide additional evidence that health care
providers change the intensity of treatment based on short-term fluctuations in
crowdedness in the hospital.
Panel B of Table 6 reports the second stage regression results using the
alternative crowdedness measures. Each cell in Table 6 corresponds to a separate
regression. Column (iii) shows the effect of additional healthcare spending that
16 If we include the Number of Births, Number of Infants Born Before, and Number of Infants Born After as three separate
variables in the first stage equation, we find each is statistically significant, but the coefficient on the Number of Infants
Born After is the smallest.

23
occurs because the birth hospital was uncrowded on the day of and days prior to
the delivery date. For both measures of mortality and the readmission measure,
the results suggest that the additional spending slightly worsens infant health with
the result being statistically significant at the 5% level when the outcome is one-
year mortality, and at the 10% level for the other two outcomes. Specifically, a 10
percent increase in health care spending caused by a decrease in the number of
infants in the hospital on the delivery date increases the one-year mortality rate by
0.31 percentage point, suggesting iatrogenic harm. Column (iv) reports the
effectiveness of additional spending that stems from the variation in crowdedness
over the infant’s entire hospital stay. For all measures of infant health, we again
find a positive relationship between additional spending and infant
mortality/readmission. The coefficient estimates on one-year (consistency)
mortality and 28-day hospital readmission are statistically significant at 10%
level. All six Hausman tests for the alternative crowdedness measures reject the
equivalence of OLS and 2SLS estimates. Overall the results using the more
comprehensive measures of hospital crowdedness strengthen the main finding that
additional hospital spending does not improve, and may harm, infant health.
b. Including Maternal Hospital Charges
The OSHPD records charges to the infant and charges to the mother as separate
entries. Maternal hospital charges include some charges that are directly related to
the labor and delivery (such as Caesarean sections). Thus infants may also receive
health benefit from the spending assigned to their mothers. As a robustness check,
we add to infant charges to the charges billed to the mother to examine the impact
of all spending related to the delivery (delivery spending).
Panel A of Table 7 presents the impact of hospital crowdedness on
delivery spending. While the first stage F-statistics are sufficiently large for all
measures of hospital crowdedness, if one compares the estimated effects of a

24
standard deviation increase in residual crowdedness on spending from Table 6
and Table 7, it is apparent that spending on the birth mother is less responsive to
variation in hospital crowdedness than spending on the infant.17 For instance,
when the number of births on the target infant’s birthdate is used as the
crowdedness measure, the first stage results imply that a one standard deviation
increase in residual crowdedness is associated with a decrease in delivery
spending of a $643. In contrast, there is an $846 reduction in infant charges when
we exclude maternal spending.
Panel B of Table 7 reports the impact of additional spending measured as
sum of mother and infant charges using the three measures of crowdedness as
instruments for delivery spending. Column (i) reports OLS results, which show a
negative correlation between delivery spending and infant mortality/readmission.
The Wu-Hausman F tests suggest that the OLS results are biased. Columns (ii)-(iv)
confirm the main result that additional spending on mother and infant does not
reduce neonatal mortality, one-year mortality, or readmission rates. Regardless of
the measure of hospital crowdedness or the measure of infant health, we find a
positive relationship between delivery spending and infant mortality/readmission.
c. The Impact of Length of Hospital Stay
Although we believe hospital spending is the best available comprehensive
measure of hospital care, as an alternative measure of treatment intensity, we
consider length of the hospital stay which is commonly used in the literate. As we
did with hospital charges, if an infant is transferred to another California hospital,
we add those days to the days spent at the hospital of birth. We examine if
17 We also investigate if hospital crowdedness has an impact on maternal charges only. All three crowdedness measures
have a statistically significant impact on maternal charges. Not surprisingly, maternal charges are most responsive to the
crowdedness measure which captures only the number of births in the hospital on the target infant’s birthday.
25
hospital crowdedness has any impact on the length of hospital stay and if longer
hospital stays have a beneficial impact on infant health.
Panel A in Table 8 presents first stage results of hospital crowdedness on
length of hospital stay using the three different measures of crowdedness. The
first stage F-statistic is weak when we measure crowdedness using only the births
that occur on the target infant’s birth date. This is likely because the discharge
decision for at-risk infants is made well past the birth date. Thus the length of
hospital stay is not very responsive to the crowdedness on the birth date. However,
the F-statistics and magnitude of the effect of a one standard increase in hospital
crowdedness increase as we move to more comprehensive measures of hospital
crowdedness. For instance, column (iv) reports that a one standard deviation
increase in residual crowdedness over the entire hospital stay leads to a 1.32 day
shorter hospital stay. Overall Panel A suggests that health care providers make
discharge decisions based on the short-term fluctuations in crowdedness in the
hospital.
Panel B presents OLS and 2SLS estimates of length of hospital stay
(measured in days) on infant health. The OLS results, located in column (i), again
suggest that additional treatment intensity, measured by length of hospital stay, is
associated with a small but statistically significant reduction in infant mortality
and readmission. However, the Wu-Hausman F tests suggest that the OLS results
are biased towards finding a beneficial impact. Columns (ii)-(iv) report the second
stage regression results on the impact of hospital stay on infant health. They are
consistent with our main findings. Shorter stays that arise because of hospital
crowdedness do not adversely impact either neonatal or one-year mortality. For
all measures of crowdedness, we observe a positive relationship between length of
stay and infant mortality. The effect is significant at 5 percent level when the
predicted number of infant in the hospital on the delivery date is the instrument
and one-year mortality is the outcome. An additional day in the hospital is
26
associated with 0.61 percentage point increase in the one-year mortality rate. We
further observe that longer hospital stays are associated with a marginally
statistically significant increased likelihood of being readmitted to the hospital.
Regardless of the measure of hospital crowdedness, infants that had longer
hospital stays because they were born during less crowded periods are more likely
to have subsequent hospital readmission.
VI. Discussion and Alternative Explanations
A possible explanation for the lessened treatment intensity associated with being
born on a crowded days is recording bias. Specifically, hospitals may fail to
record and bill all the procedures performed because the hospital personals are
swarmed on busy days. If the recording bias is strong enough, infants born on
slow days and busy days might receive the similar level of hospital care (although
they report different levels) which would lead to a null findings of treatment on
infant health in the second stage. We find no evidence of hospitals’ failure to
record procedures. Procedure data is available for 27.81 percent of infants born on
busiest quartile days vs. 27.09 percent of infants born on slowest quartile days.
We identify the four most commonly performed procedures - Circumcision (ICP9:
640), Vaccination NEC (ICP9: 9955), Insertion of Endotracheal Tube (ICP9:
9604), and Other Phototherapy (other than ultraviolet, ICP9: 9983). The
difference in percentage of infant receiving each procedure across slow and busy
days is smaller than 1 percentage point for all four procedures. Moreover, except
Circumcision, which is more physician-intensive, the percentages of newborns
reporting the other three procedures are higher among infants born on busy days.
This suggests that hospitals are consistently recording the procedures regardless
of hospital crowdedness. Additionally, as shown previously, length of the hospital
stay also responds to hospital crowdedness but is unlikely to be subject to
recording bias.

27
An explanation for the finding of iatrogenic harm is that the first stage
results are being driving by teaching hospitals allowing low-skilled residents to
perform extra procedures on slow days. We split the sample into teaching and
non-teaching hospitals and find that if anything, the second stage coefficients of
interest are larger in the non-teaching subsample.
Finally, the health effects documented above may simply be an artifact of
supplier-induced demand.18 If the additional treatments that occur on slow days
are only occurring to pad the medical bills and not because they are deemed
medically necessary, then one would expect little to no benefit, and possible harm.
We conduct the following two exercises which suggest that the relationship
between crowdedness and treatment intensity does not simply reflect supplier-
induced demand and instead is consistent with the relaxation of binding capacity
constraints.
First, we split the sample into deliveries that were covered by a managed
care plan and those which were not. If supplier-induced demand is driving the
negative relationship between crowdedness and spending, then we should expect
a smaller or non-existent first-stage for those births covered by managed care. As
is shown in Table 9, there is no difference in the response of hospital charges to
crowdedness on the day of birth by managed care status.19 While both samples
have a sufficiently strong first stage, in neither sample do we observe positive
health benefits from additional charges.
18 One of the features of medical market is an agency relationship between doctors and patients. Because doctors have
asymmetrically more knowledge about medical care than their patients do, doctors are expected to behave as patients’
agents when making treatment decisions. However, studies find that when doctors face negative income shocks, doctors
may exploit the agency relationship and provide more care in order to maintain their income. See Chapter 9 of the
Handbook of Health Economics (McGuire, 2000) and Gruber and Owings (1996) for reviews of the supplier induced
demand literature. 19 In results not shown that use the alternative measures of crowdedness, the range of the estimates is fairly tight. We also
split the sample by not-for-profit status with the hypothesis that supplier induced demand might be larger at for-profit
hospitals. We find no difference in the response of hospital charges to crowdedness by not-for-profit status.
28
Second, under the capacity constraint hypothesis, at low levels of
crowdedness, additional births should not impact the amount of care (since the
hospital still has ample capacity). At some point the hospital will exceed its
normal capacity after which additional births will reduce spending per birth.
Under a supplier-induced demand model, on the slowest days the hospital
personnel face the largest reduction in income, as such spending should be greater
at very low levels of crowdedness than at low-to-moderate levels of crowdedness.
To investigate if our results are being driving by capacity constraints, we
construct crowdedness quintiles using the residual crowdedness measures from
equation (1). Then we estimate equation (2) but replace the single daily
crowdedness measure with five crowdedness quintiles. So the 80th decile would
turn on if an infant was born on one of the ten busiest Mondays (or any other day
of the week) in a given hospital in a given year. Figure 3 shows the results of this
exercise graphically where we omit the slowest quintile. As shown in Figure 3,
infants born on days which are below the median level of crowdedness for a given
day of the week, hospital, year, and parity experience similar level of spending.
However, once the hospital exceeds the median level of crowdedness, then as the
hospital become more crowded, spending declines, especially for days in the
busiest quintile. At-risk infants born when the hospital is most crowded
experience 4 percent lower spending than infants born on the least crowded days.
These findings are inconsistent with most supplier-induced demand models and
suggest instead that the hospital face binding capacity constraints. In other words,
the care that is cut is care that the hospital provides whenever it has the capacity
to do so.
VII. Conclusions
Using the hospital level of crowdedness on an infant’s birth date to generate
exogenous variation in treatment intensity, we estimate the impact of additional
29
health care measured by hospital spending on infants, delivery spending, and
length of hospital stay on infant health using the universe of birth in California
hospitals between the years 2002 and 2006. Our paper documents that on days
when more deliveries occur, hospital respond to the short-term crowdedness by
treating at-risk infant less intensively.
We identify the health consequences of hospital care on infants who
received additional treatments solely because they were born on slow days when
the hospital had excess capacity. We find no evidence that the additional hospital
spending translates in to better infant health as measured by neonatal mortality,
one-year mortality, and 28-day readmission rates, and some evidence that
additional spending harms at-risk infants. These results suggest, at best, we are at
the so-called “flat part of the curve” of the health production function. This is in
contrast to the OLS estimates which consistently suggest that additional
treatments reduce mortality and readmission. These findings are robust to
alternative measures of hospital crowdedness and alternative measures of hospital
treatment.
Unlike other studies that utilize variation in treatment intensity from
legislative changes, the variation in treatment identified in our study stems from
the medical personnel’s decisions. We identify health consequences of reduction
in care for infants born on busier days in the same hospital with identical health
and family background characteristics. This is precisely the information from
which the policy debates about staffing ratio and the number of newborn intensive
care units benefit. Our findings suggest that new hospital construction, changes in
staffing requirements, or reduction in birth rates that reduce crowdedness in
maternity wards will lead to additional per infant hospital charges without
increasing infant health status and possibly harming infant health.
Our result should be interpreted cautiously. While our measures of infant
health are common in the literature and good proxies for infant health, they are

30
not perfect measures of health status. It is possible that additional spending has
benefits such as decreased levels of discomfort for infants or improved parental
satisfaction that we are unable to measure. Additionally, because resources and
commitment to prenatal health may differ across states and countries, our results
might not be generalized beyond California. In particular, our results may not
generalize to states that have certificate of need laws, which require state approval
for hospital construction or expansion, in place.
Finally we note that the instrument which we introduce in this paper,
hospital crowdedness, could be applied to other settings where there is little
possibility of timing the onset of medical need. For example, the benefit of
emergency room care for heart attack patients could be estimated by employing a
hospital crowdedness measure to generate exogenous variation in access to
treatment.

31
References
Almond, Douglas, Joseph J. Doyle Jr., Amanda E. Kowalski, and Heidi Williams,
“Estimating Marginal Returns to Medical Care: Evidence from At-Risk
Newborns,” Quarterly Journal of Economics 125:2 (2010), 591-634.
Almond, Douglas, and Joseph J. Doyle Jr., “After Midnight: A Regression
Discontinuity Design in Length of Postpartum Hospital Stays,” American
Economic Journal: Economic Policy 3:3 (2011), 1-34.
Anupam, Jena B., Seth Seabury, Darius Lakdawalla, and Amitabh Chandra,
“Malpractice Risk According to Physician Specialty,” New England Journal of
Medicine 365 (August 2011), 629-636.
Black, William C., “Advances in Radiology and the Real versus Apparent Effects
of Early Diagnosis,” Europe Journal of Radiology 27:2 (1998), 116-122.
Buckles, Kasey, and Daniel M. Hungerman, “Season of Birth and Later Outcomes:
Old Questions, New Answers,” The Review of Economics and Statistics 95:3
(2013), 711-724.
Card, David, Carlos Dobkin, and Nicole Maestas, “Does Medicare Save Lives,”
Quarterly Journal of Economics 124:2 (2009), 597-636.
Currie, Janet and Jonathan Gruber, “Saving Babies: The Efficacy and Cost of
Recent Changes in the Medicaid Eligibility of Pregnant Women,” Journal of
Political Economy 104:6 (1996), 1263-1296.

32
Currie, Janet, and W. Bentley Macleod, “First Do No Harm? Tort Reform and
Birth Outcomes,” Quarterly Journal of Economics 123:2 (2008), 795-830.
Currie, Janet, and Hannes Schwandt, “Within-mother Analysis of Seasonal
Patterns in Health at Birth,” Proceedings of the National Academy of Sciences of
the United States of America 110:28 (2013).
Cutler, David, Your Money or Your Life: Strong Medicine for America’s Health
Care System, 1st ed. (Oxford: Oxford University Press, 2005)
Datar, Ashlesha and Neeraj Sood, “Impact of Postpartum Hospital-Stay
Legislation on Newborn Length of Stay, Readmission, and Mortality in
California,” Pediatrics 118:1 (2006), 63-72.
Dehejia, Rajeev, and Adriana Lleras-Muney, “Booms, Busts, and Babies’ Health,”
Quarterly Journal of Economics 119:3 (2004), 1091-1130.
Dowding VM, NM Duiqnan, GR Henry, and DW MacDonald, “Induction of
Labour, Birthweight and Perinatal Mortality by Day of the Week,” British
Journal of Obstetrics & Gynecology 94:5 (1987), 413-419.
Doyle, Joseph J. Jr., “Health Insurance, Treatment and Outcomes: Using Auto
Accidents as Health Shocks,” The Review of Economics and Statistics 87:2 (2005),
256-270.
33
Evans, William N. and Beom Soo Kim, “Patient Outcomes When Hospitals
Experience a Surge in Admissions,” Journal of Health Economics 25:2 (2006),
365-388.
Evans, William N., Craig Garthwaite, and Heng Wei, “The Impact of Early
Discharge Laws on the Health of Newborns,” Journal of Health Economics 27:4
(2008), 843-870.
Evans, William N. and Craig Garthwaite, “Estimating Heterogeneity in the
Benefits of Medical Treatment Intensity,” The Review of Economics and Statistics
94:3 (2012), 635-649
Freedman, Seth, “Capacity and Utilization in Health Care: The Effect of empty
Beds on Neonatal Intensive Care Admission,” Working Paper, 2012.
Fisher, Elliott S., David E. Wennberg, Thrse A. Stukel, Daniel J. Gottlieb, F. L.
Lucas, and Etoile L. Pinder, “The Implications of Regional Variations in
Medicare Spending,” Annals of Internal Medicine 138:4 (2003), 288-298.
Gaynor, Martin, Harald Seider, and William B. Vogt, “The Volume-Outcome
Effect, Scale Economies, and Learning-by-Doing,” The American Economic
Review 95:2 (2005), 243-247.
Goodman, David C. Elliott S. Fisher, George A. Little, Therese A. Stukel,
Chiang-hua Chang, and Kenneth S. Schoendorf, “The Relation between the
Availability of Neonatal Intensive Care and Neonatal Mortality,” New England
Journal of Medicine 346 (May 2002), 1538-1544.

34
Gould, Jeffrey B. Cheng Qin, Amy R. Marks, and Gilberto Chavez, “Neonatal
Mortality in Weekend vs Weekday Births,” The Journal of the American Medical
Association 289:22 (2003), 2958-2962.
Grady, Deborah and Rita F. Redberg “Less is More. How Less Health Care Can
Result in Better Health,” Archives of Internal Medicine 170:9 (2010), 749-750.
Gruber, Jonathan, and Maria Owings, “Physician Financial Incentives and
Cesarean Section Delivery,” RAND Journal of Economics 27:1 (1996), 99-123.
Haas, Jennifer S., Steven Udvarhelyi, Carl N. Morris, and Arnold M. Epstein,
“The Effect of Providing Health Coverage to Poor Uninsured Pregnant Women in
Massachusetts,” Journal of the American Medical Association 269:1 (1993), 87-
91.
Hamilton, Patti and Elizabeth Restrepo, “Weekend Birth and Higher Neonatal
Mortality: A Problem of Patient Acuity or Quality of Care?” Journal of Obstetric,
Gynecologic & Neonatal Nursing 32:6 (2003), 724-733.
HCUP Nationwide Inpatient Sample (NIS). Healthcare Cost and Utilization
Project (HCUP). 2005. Agency for Healthcare Research and Quality, Rockville,
MD. (Accessed 12/1/2011).
Hoxby, Caroline M., “The Effects of Class Size on Student Achievement: New
Evidence from Population Variation,” Quarterly Journal of Economics 115:4
(2000), 1239-1285.

35
Landrum, MB., ER Meara, A. Chandra, E. Guadaqnoli, and NL Keating, “Is
Spending More Always Wasteful? The Appropriateness of Care and Outcomes
among Colorectal Cancer Patients,” Health Affairs 27:1 (2008), 159-168.
MacFarlane, Alison, “Variations in Number of Births and Perinatal Mortality by
Day of Week in England and Wales,” British Medical Journal 2:6153 (1978),
1670-1673.
Madden, Jeanne M., Stephen B. Soumerai, Tracy A. Lieu, Kenneth D. Mandl,
Fang Zhang, and Dennis Ross-Degnan, “Effects of a Law against Early
Postpartum Discharge on Newborn Follow-up, Adverse Events, and HMO
Expenditures,” The New England Journal of Medicine 347 (December 2002),
2031-2038.
Mangold, William D. “Neonatal Mortality by the Day of the Week in the 1974-75
Arkansas Live Birth Cohort,” American Journal of Public Health 71:6 (1981),
601-605.
Meara, Ellen, Uma R. Kotagal, Harry D. Atherton, and Tracy A. Lieu, “Impact of
Early Newborn Discharge Legislation and Early Follow-up Visits on Infant
Outcomes in a State Medicaid Population,” Pediatrics 113:6 (2004), 1619-1627.
McGuire, Thomas G., “Physician Agency,” in Handbook of Health Economics,
Culyer A.J. and Newhouse J. P., eds. (Amsterdam: Elsevier, 2000).
Pauly, Mark, “The Economics of Moral Hazard: Comment,” The American
Economic Review 58:3, part 1 (1968), 531-537.
36
Picone, Gabriel A., Frank A. Sloan, Shin-Yi Chou, and Donald H. Taylor, Jr.,
“Does Higher Hospital Cost Imply Higher Quality of Care?” The Review of
Economics and Statistics 85:1 (2003), 51-62.
Piper, Joyce M., Wayne A. Ray, and Marie R. Griffin, “Effects of Medicaid
Eligibility Expansion on Prenatal Care and Pregnancy Outcome in Tennessee,”
Journal of the American Medical Association 264:17 (1990), 2219-2223.
Phibbs, Ciaran S., Laurence C. Baker, Aaron B. Caughey, Beate Danielsen, Susan
K. Schmitt, and Roderic H. Phibbs, “Level and Volume of Neonatal Intensive
Care and Mortality in Very-Low birth weight Infants,” New England Journal of
Medicine 356 (May 2007), 2165-2175.
Richardson, Douglas K., James E. Gray, Steven L. Gortmaker, Donald A.
Goldmann, DeWayne M. Pursley, and Marie C. McCormick, “Declining Severity
Adjusted Mortality: Evidence of Improving Neonatal Intensive Care,” Pediatrics
102:4 (1998), 893 – 899.
Rindfuss, Ronald R., JL Ladinsky, E. Coppock, VW Marshall, and AS
Macpherson, “Convenience and the Occurrence of Births: Induction of Labor in
the United States and Canada,” International Journal of Health Services 9:3
(1979), 439-460.
Russo, Allison C., and Rozanne M. Andrews “The National Hospital Bill: The
Most Expensive Conditions, by Payer, 2004,” HCUP Statistical Brief #13.
Agency for Healthcare Research and Quality, Rockville, MD. (2006).

37
Skinner, Jonathan S., Elliott S. Fisher, and John Wennberg “The Efficiency of
Medicare” in D. Wise (ed.) Analyses in the Economics of Aging. Chicago:
University of Chicago Press and NBER (2005), 129-57.
Wehby, George, Fred Ullrich, and Yang Xie. 2012. “Very Low Birth Weight
Hospital Volume and Mortality – An Instrumental Variables Approach,” Medical
Care 50:8, 714-721.
Williams, Ronald L. and Peter M. Chen “Identifying the Sources of the Recent
Decline in Perinatal Mortality Rates in California,” The New England Journal of
Medicine 306:4 (1982), 207-214.

38
Table 1. Summary Statistics At-risk Infants All Births Variable Mean S.D. Mean S.D. Pregnancy Characteristics
Month prenatal care began 2.26 (1.49)
2.26 (1.41)
Number of prenatal visits 11.87 (5.29)
12.39 (4.05)
No pregnancy complication 0.31 (0.46)
0.34 (0.47)
Parental Characteristics
Mother's age 28.16 (6.83)
27.92 (6.37)
Mother's education (years) 12.05 (3.41)
12.22 (3.43)
Father's age 31.02 (7.66)
30.85 (7.21)
Father's education (years) 12.01 (3.59)
12.19 (3.59)
Newborn Characteristics
Boy 0.52 (0.50)
0.51 (0.50)
White 0.67 (0.47)
0.71 (0.45)
Black 0.10 (0.30)
0.07 (0.25)
Asian 0.08 (0.27)
0.08 (0.28)
Hispanic 0.51 (0.50)
0.52 (0.50)
First born 0.37 (0.48)
0.38 (0.49)
Single birth 0.84 (0.37)
0.97 (0.17)
Birth Characteristics
Birth weight (g) 2561 (759)
3318 (574)
Gestation (days) 246 (31)
275 (24)
Caesarean section 0.44 (0.50)
0.31 (0.46)
Primary Payer
Medicaid 0.53 (0.50)
0.51 (0.50)
Private insurance 0.41 (0.49)
0.44 (0.50)
Self-pay 0.02 (0.15)
0.02 (0.15)
Variables of Interest
Infant hospital charge ($) 64,126 (193,941)
13,126 (78,972)
Mother and infant hospital charge ($) 81,326 (200,968)
26,624 (82,156)
Hospital stay (days) 10.01 (19.68)
3.38 (8.12)
Number of procedures1 1.08 (2.23)
0.43 (1.07)
Probability of transfer from birth hospital 0.067 (0.250)
0.017 (0.130)
Probability of the same day transfer 0.039 (0.194)
0.009 (0.094)
Outcome Variables
Neonatal mortality 0.021 (0.145)
0.003 (0.058)
One-year mortality 0.027 (0.162)
0.005 (0.071)
28-day Readmission 0.116 (0.32)
0.031 (0.173)
Observations 302,649 2,329,810 1. Data on procedures is available for only 28 percent of the observations.
39
Table 2. Descriptive Statistics of Number of Births for Selected Hospitals
Mean (Daily Births)
Standard Deviation Min
25th Percentile
50th Percentile
75th Percentile Max
Panel A: Smallest Hospital 2.00 0.98 1 1 2 3 5
10 Percentile Hospital 4.35 1.86 1 3 4 6 10 20 Percentile Hospital 5.79 2.31 1 4 6 7 13 30 Percentile Hospital 6.94 2.58 1 5 7 9 16 40 Percentile Hospital 8.01 2.89 1 6 8 10 17 50 Percentile Hospital 8.76 3.25 1 6 9 11 20 60 Percentile Hospital 9.94 2.99 1 8 10 12 20 70 Percentile Hospital 11.57 3.66 1 9 12 13 25 80 Percentile Hospital 13.80 3.67 3 11 14 16 26 90 Percentile Hospital 17.43 4.40 3 14 17 20 31 Biggest Hospital 22.37 5.79 4 15 23 26 42 Panel B: Residual Crowdedness:
Number of Births 0 3.21 -19.83 -2.00 -0.13 1.90 19.63
Number of Infants on Delivery Date 0 4.85 -48.25 -2.88 -0.09 2.81 42.75
Number of Infants during Stay 0 6.67 -73.2 -3.83 -0.10 3.78 45.72
Number of Hospitals 226
Note: The residual crowdedness measure is the respective residuals from a regression of a measure of hospital crowdedness on the complete set of hospital, year, day of the week, and parity fixed effects. We construct separate residuals for each of the three hospital crowdedness measure.

40
Table 3. Summary Statistics by Hospital Crowdedness
Slow Days Busy Days
Variable Mean S.D. Mean S.D. Difference
Number of infants born 7.89 (4.63)
15.63 (6.66)
-7.74
Transfer from birth hospital 0.064 (0.245)
0.065 (0.246)
-0.001
Same day transfer 0.037 (0.189)
0.036 (0.187)
0.001
Prenatal Care
Month prenatal care began 2.23 (1.47)
2.24 (1.47)
-0.01
Number of prenatal visits 12.00 (5.26)
12.06 (5.32)
-0.06
Parental Characteristics
Mother's age 28.16 (6.83)
28.26 (6.86)
-0.11
Mother's education (years) 12.03 (3.40)
12.12 (3.41)
-0.09
Father's age 31.03 (7.66)
31.09 (7.64)
-0.06
Father's education (years) 11.99 (3.58)
12.09 (3.61)
-0.11
Newborn Characteristics
Boy 0.52 (0.50)
0.52 (0.50)
0.00
White 0.66 (0.47)
0.67 (0.47)
0.00
Black 0.10 (0.30)
0.10 (0.30)
0.00
Asian 0.08 (0.27)
0.08 (0.27)
0.00
Hispanic 0.52 (0.50)
0.52 (0.50)
0.00
First born 0.37 (0.48)
0.37 (0.48)
0.00
Primary Payer
Medicaid 0.53 (0.50)
0.53 (0.50)
0.00
Private insurance 0.40 (0.49)
0.41 (0.49)
0.00
Self-pay 0.02 (0.15)
0.02 (0.15)
0.00
Birth Characteristics
Caesarean section 0.44 (0.50)
0.44 (0.50)
0.00
Pregnancy complication 0.67 (0.47)
0.67 (0.47)
0.00
Birth weight (g) 2546 (768)
2553 (756)
-8
Gestation (days) 245.6 (30.0)
246.2 (31.3)
-0.6
Variables of Interest
Infant hospital charge ($) 67,917 (201,518)
64,325 (191,285)
3,592
Mother hospital charge ($) 18,051 (23,139)
17,971 (23,252)
80
Hospital stay (days) 10.54 (20.45)
10.07 (19.57)
0.48
Number of procedures 1.15 (2.30)
1.10 (2.26)
0.05
Outcome Variables
Neonatal mortality 0.023 (0.149)
0.020 (0.140)
0.003
One-year mortality 0.028 (0.166)
0.026 (0.158)
0.002
28-day Readmission 0.036 (0.185)
0.034 (0.182) 0.002 Observations 77,497 77,461 Notes: Slow/busy days are days with residual crowdedness in the bottom/top quartile of the residual distribution (see Equation (1)). Data on procedures is available for only 28 percent of the observations.

41
Table 4. Impact of Hospital Crowdedness on Hospital Spending for At-risk Infants
Number of Births -0.0041
(0.0010)***
[$ 846]
F-Statistics 17.58 R-squared 0.5465 Observations 302,649
Notes: The dependent variable is the log of hospital spending from all consecutive hospital
stay after birth. The regression includes indicators for: mother and father's age and education, infant's race, gender, parity, month prenatal care began, number of prenatal visits, insurance type, day of the week, month, year, holiday, birth weight categorized in 500 gram interval, and gestation in two weeks. * denotes significant at 10%; ** significant at 5%; *** significant at 1%. Robust standard errors corrected for clustering on hospital cells are reported in parentheses. The number in bracket corresponds to the predicted change in average hospital charges from a one standard deviation change in the number of daily births after netting out parity, hospital, year, and day of the week effects (residual crowdedness).

42
Table 5. Impact of Hospital Spending on Infant Health
OLS 2SLS
(i) (ii)
Neonatal Mortality
Log(Health Care Spending) -0.0260 0.0276
(0.0012)*** (0.0213)
Wu-Hausman F test
0.0013
One-year Mortality
Log(Health Care Spending) -0.0214 0.0285
(0.0012)*** (0.0263)
Wu-Hausman F test
0.0084
28-day Readmission
Log(Health Care Spending) -0.0083 0.0557
(0.0005)*** (0.0264)**
Wu-Hausman F test
0.0066 Observations 302,649 302,649
Notes: Each cell represents a separate regression.
All models include the control variables listed in Table 4. * denotes significant at 10%; ** significant at 5%; *** significant at 1%. Robust standard errors corrected for clustering on hospital cells are reported in parentheses.

43
Table 6. Robustness of results to Alternative Measures of Hospital Crowdedness
OLS
2SLS
Number of Births
Number of Infants on
Delivery Date
Number of Infants
during Stay
(i) (ii) (iii) (iv)
Panel A: 1st Stage Results Coefficient
-0.0041 -0.0042 -0.0032
Robust Standard Error
(0.0010)*** (0.0008)*** (0.0006)*** F-Statistics
17.58 25.99 25.27
R-squared
0.5465 0.5466 0.5466
[$ 846] [$1,306 ] [$1,369 ]
Panel B: 2nd Stage Results
Neonatal Mortality
Log(Health Care Spending) -0.0260
0.0276 0.0242 0.0190
(0.0012)***
(0.0213) (0.0127)* (0.0126)
Wu-Hausman F test
0.0013 0.0000 0.0002
One-year Mortality
Log(Health Care Spending) -0.0214
0.0285 0.0306 0.0251
(0.0012)***
(0.0263) (0.0154)** (0.0140)*
Wu-Hausman F test
0.0084 0.0000 0.0003
28-day Readmission
Log(Health Care Spending) -0.0083
0.0557 0.0344 0.0326
(0.0005)***
(0.0264)** (0.0190)* (0.0198)*
Wu-Hausman F test
0.0066 0.0156 0.0174 Observations 302,649 302,649 302,649 302,649
Notes: Number of Births, Number of Infants on Delivery Date, and Number of Infants during Stay are the
number of deliveries on target infant’s birthdate, the expected number of infants in the hospital on the delivery date, and the expected number of infants during the hospitalization stay, respectively. All models include the control variables listed in Table 4.
* denotes significant at 10%; ** significant at 5%; *** significant at 1%. Robust standard errors corrected for clustering on hospital cells are reported in parentheses.
The number in bracket corresponds to the predicted change in average hospital charges from a one standard deviation change in the respective crowdedness measure after netting out parity, hospital, year, and day of the week effects (residual crowdedness). Each cell in panel B represents a separate regression.

44
Table 7. Impact of Delivery Spending on Infant Health
OLS
2SLS
Number of Births
Number of Infants on
Delivery Date
Number of Infants during
Stay (i) (ii) (iii) (iv) Panel A: 1st Stage Results
Coefficient
-0.0025 -0.0023 -0.0018 Robust Standard Error
(0.0007)*** (0.0006)*** (0.0005)***
F-Statistics
12.98 16.82 14.93 R-squared
0.5649 0.5649 0.5649
[$ 643] [$ 907] [$ 976]
Panel B: 2nd Stage Results
Neonatal Mortality
Log(Health Care Spending) -0.0411
0.0460 0.0444 0.0338
(0.0015)***
(0.0375) (0.0263)* (0.0249)
Wu-Hausman F test
0.0016 0.0001 0.0004
One-year Mortality
Log(Health Care Spending) -0.0333
0.0475 0.0562 0.0447
(0.0015)***
(0.0457) (0.0325)* (0.0293)
Wu-Hausman F test
0.0104 0.0001 0.0005
28-day Readmission
Log(Health Care Spending) -0.0100
0.0932 0.0625 0.0574
(0.0005)***
(0.0430)** (0.0375)* (0.0379)
Wu-Hausman F test
0.0075 0.0199 0.0215 Observations 302,649 302,649 302,649 302,649
Notes: Delivery spending is the sum of infant and maternal hospital charges.
Number of Births, Number of Infants on Delivery Date, and Number of Infants during Stay are the number of deliveries on target infant’s birthdate, the expected number of infants in the hospital on the delivery date, and the expected number of infants during the hospitalization stay, respectively. All models include the control variables listed in Table 4.
* denotes significant at 10%; ** significant at 5%; *** significant at 1%. Robust standard errors corrected for clustering on hospital cells are reported in parentheses.
The number in bracket corresponds to the predicted change in average hospital charges from a one standard deviation change in the respective crowdedness measure after netting out parity, hospital, year, and day of the week effects (residual crowdedness).

45
Each cell in panel B represents a separate regression.

46
Table 8. Impact of Length of Hospital Stay on Infant Health
OLS
2SLS
Number of Births
Number of Infants on
Delivery Date
Number of Infants during
Stay (i) (ii) (iii) (iv)
Panel A: 1st Stage Results Coefficient
-0.0196 -0.0215 -0.0197
Robust S.E.
(0.0078)** (0.0063)*** (0.0047)*** F-Statistics
6.54 11.03 17.29
R-squared
0.4736 0.4742 0.4742
[-0.63 day] [-1.04 day] [-1.32 days]
Panel B: 2nd Stage Results
Neonatal Mortality
Hospital Stay (1Day) -0.0041
0.0057 0.0047 0.0031
(0.0001)***
(0.0049) (0.0027)* (0.0021)
Wu-Hausman F test
0.0019 0.0000 0.0001
One-year Mortality
Hospital Stay (1Day) -0.0035
0.0059 0.0061 0.0042
(0.0001)***
(0.0059) (0.0031)** (0.0022)*
Wu-Hausman F test
0.0121 0.0001 0.0002
28-day Readmission
Hospital Stay (1Day) -0.0007
0.0092 0.0058 0.0052
(0.0000)***
(0.0051)* (0.0034)* (0.0031)*
Wu-Hausman F test
0.0109 0.0287 0.0309 Observations 302,649 302,649 302,649 302,649
Notes: The dependent variable in Panel A is the length of the infant's first hospital stay (in days) including
all transfers. Number of Births, Number of Infants on Delivery Date, and Number of Infants during Stay are the number of deliveries on target infant’s birthdate, the expected number of infants in the hospital on the delivery date, and the expected number of infants during the hospitalization stay, respectively. All models include the control variables listed in Table 4.
* denotes significant at 10%; ** significant at 5%; *** significant at 1%. Robust standard errors corrected for clustering on hospital cells are reported in parentheses.
The number in bracket corresponds to the predicted change in average hospital charges from a one standard deviation change in the respective crowdedness measure after netting out parity, hospital, year, and day of the week effects (residual crowdedness).

47
Each cell in panel B represents a separate regression. Table 9. Managed Care vs. Traditional Insurance
Managed Care Traditional Insurance (i) (ii) Panel A: 1st Stage Results
Coefficient -0.0040 -0.0038 Robust Standard Error (0.0012)*** (0.0012)*** F-Statistics 10.35 10.10 R-squared 0.5463 0.5484
[$ 818] [$ 773]
Panel B: 2nd Stage Results
Neonatal Mortality
Log(Health Care Spending) 0.0164 0.0565
(0.0243) (0.0420)
One-year Mortality
Log(Health Care Spending) 0.0062 0.0702
(0.0281) (0.0458)
28-day Readmission
Log(Health Care Spending) 0.0582 0.0650
(0.0343)* (0.0414)
Panel C: Summary Statistics Ave. Number of Births 10.50 10.51 Ave. Birth Weight 2565 2566 Ave. Gestation 246 246 Ave. Infant Charges $ 63,553 $ 63,342 Ave. Mother and Infant Charges $ 81,392 $ 81,210 Ave. Hospital Stay (Days) 9.95 9.92 Observations 177,045 122,074
Notes: All models include the control variables listed in Table 4. * denotes significant at 10%; ** significant at 5%; *** significant at 1%. Robust standard errors corrected for clustering on hospital cells are reported in parentheses. The number in bracket corresponds to the predicted change in average hospital charges from a one standard deviation change in the number of daily births after netting out parity, hospital, year, and day of the week effects (residual crowdedness). Each cell in panel B represents a separate regression. Insurance information is missing for 3,530 observations.
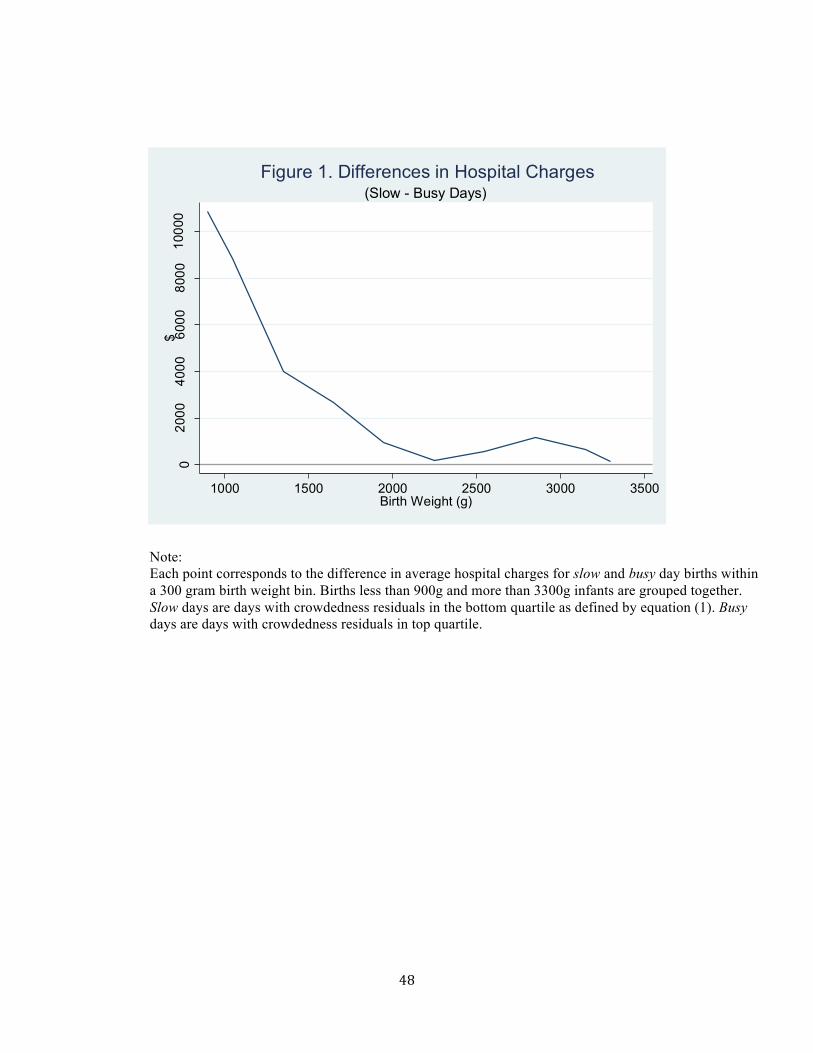
48
Note: Each point corresponds to the difference in average hospital charges for slow and busy day births within a 300 gram birth weight bin. Births less than 900g and more than 3300g infants are grouped together. Slow days are days with crowdedness residuals in the bottom quartile as defined by equation (1). Busy days are days with crowdedness residuals in top quartile.
020
0040
0060
0080
0010
000
$
1000 1500 2000 2500 3000 3500Birth Weight (g)
(Slow - Busy Days)Figure 1. Differences in Hospital Charges
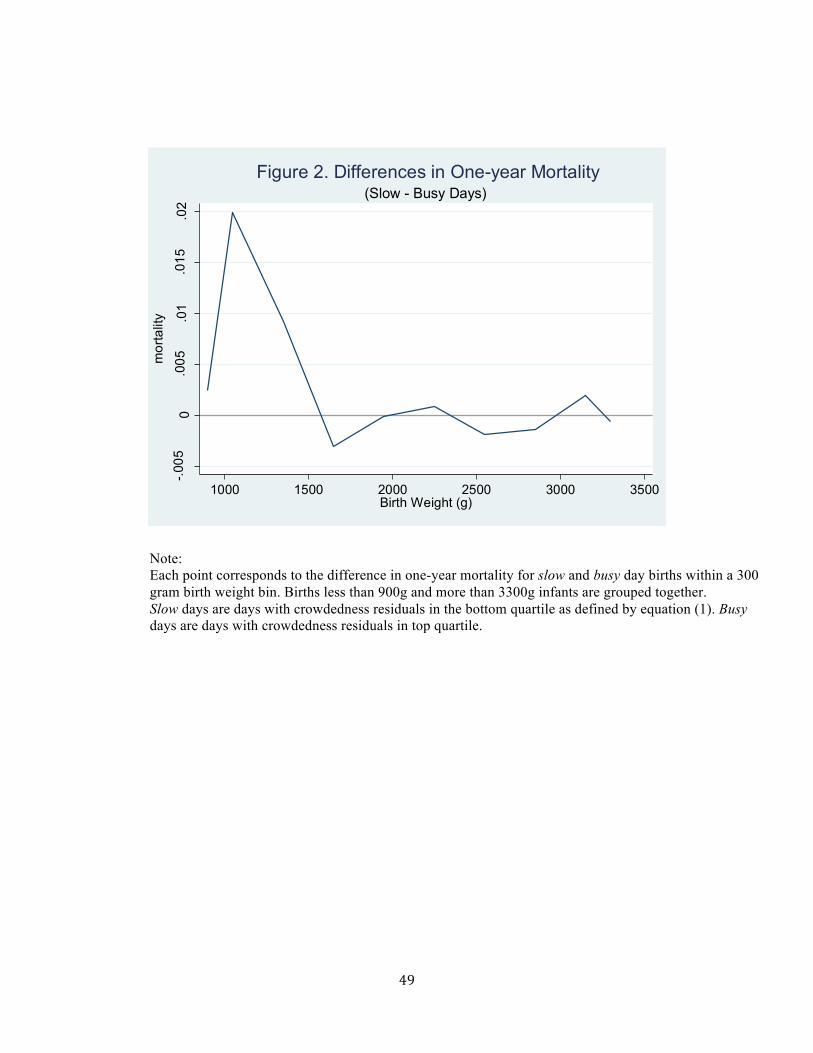
49
Note: Each point corresponds to the difference in one-year mortality for slow and busy day births within a 300 gram birth weight bin. Births less than 900g and more than 3300g infants are grouped together. Slow days are days with crowdedness residuals in the bottom quartile as defined by equation (1). Busy days are days with crowdedness residuals in top quartile.
-.005
0.0
05.0
1.0
15.0
2
mor
talit
y
1000 1500 2000 2500 3000 3500Birth Weight (g)
(Slow - Busy Days)Figure 2. Differences in One-year Mortality
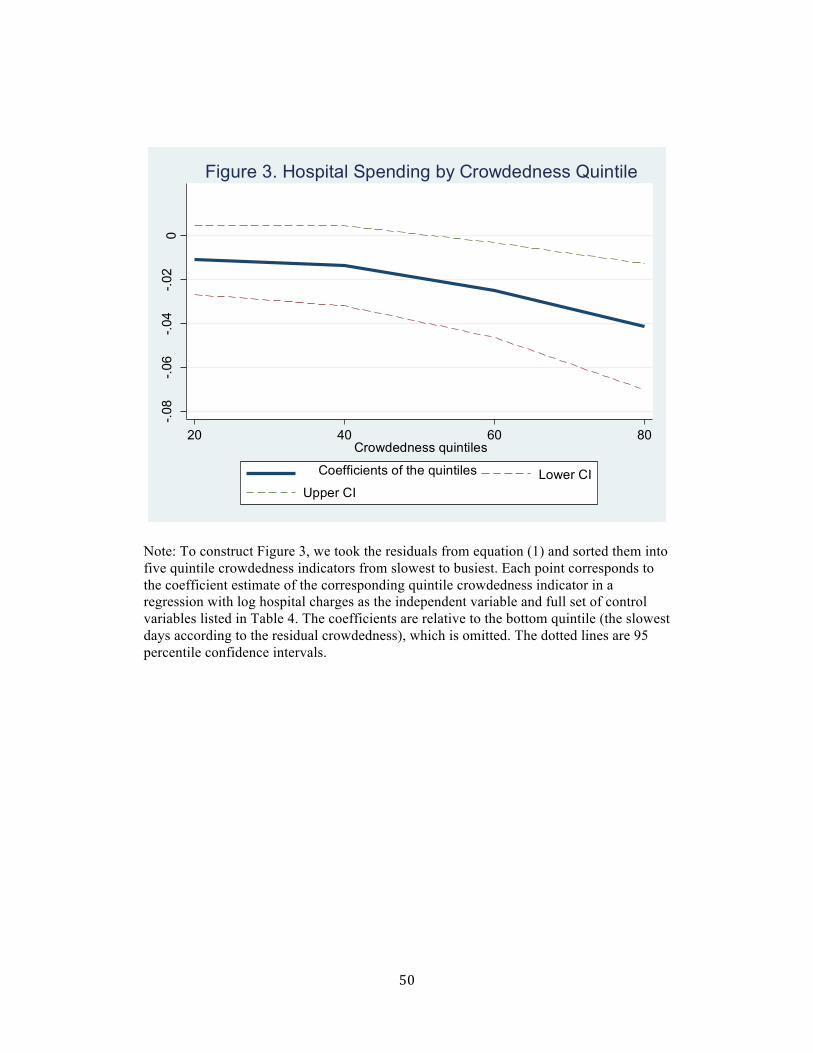
50
Note: To construct Figure 3, we took the residuals from equation (1) and sorted them into five quintile crowdedness indicators from slowest to busiest. Each point corresponds to the coefficient estimate of the corresponding quintile crowdedness indicator in a regression with log hospital charges as the independent variable and full set of control variables listed in Table 4. The coefficients are relative to the bottom quintile (the slowest days according to the residual crowdedness), which is omitted. The dotted lines are 95 percentile confidence intervals.
-.08
-.06
-.04
-.02
0
20 40 60 80Crowdedness quintiles
Coefficients of the quintiles Lower CIUpper CI
Figure 3. Hospital Spending by Crowdedness Quintile