b. georges bank haddock melanogrammus …. georges bank haddock melanogrammus aegelfinus elizabeth...
TRANSCRIPT

Groundfish Assessment Updates 2012 96 B- GB Haddock
B. Georges Bank Haddock Melanogrammus aegelfinus Elizabeth N. Brooks1, Sandra J. Sutherland1, L. Van Eeckhaute2, Michael Palmer1, 1NEFSC 166 Water Street Woods Hole, MA 02543 2 Fisheries and Oceans Canada 531 Brandy Cove Road St. Andrews, New Brunswick E5B 2L9 Canada B. Georges Bank Haddock
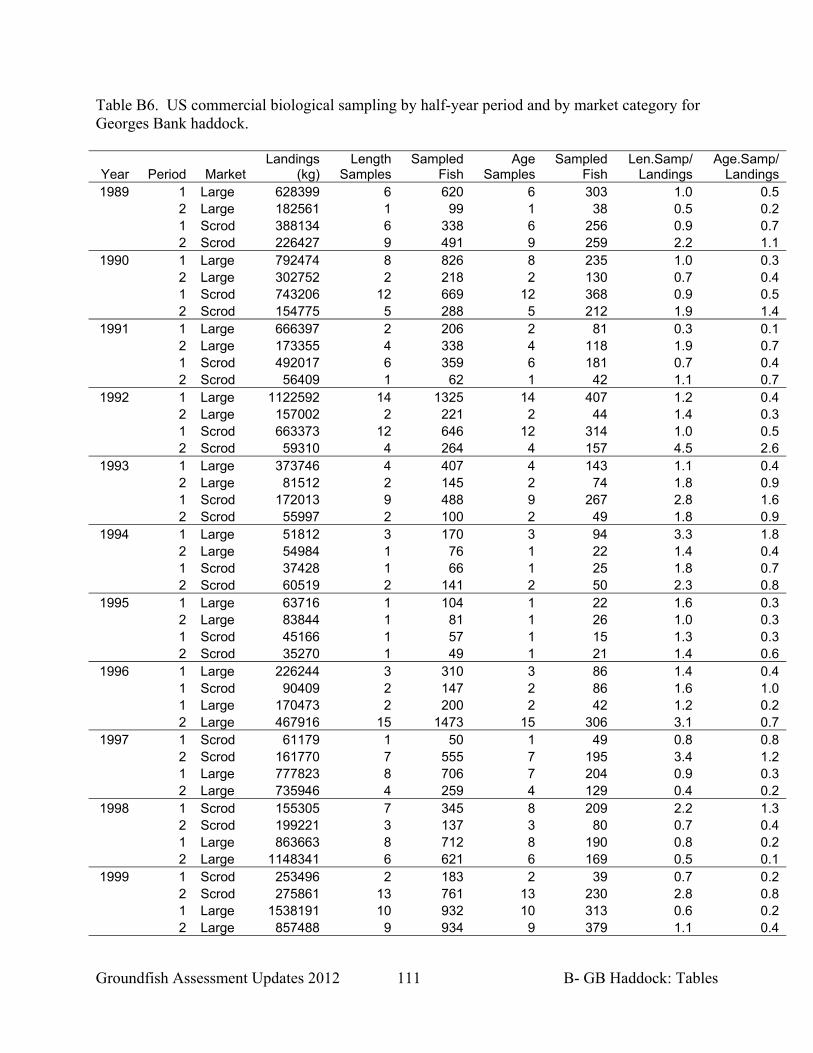
A. Background The Georges Bank haddock stock was last assessed as part of the GARM-III (Brooks et al. 2008). That assessment was a benchmark, and all methods that were accepted by the GARM-III review panel were used in this update. Three additional years of catch and index data are incorporated. B. Fishery Total catches of Georges Bank haddock have steadily increased in the past decade, from 8711 mt in 2000 to 25903 mt in 2010 (Table B1; Fig. 1). Catch exceeded 20000 mt for the last three years (2008-2010). On average, the US fraction of recent catch has been 30% with Canada accounting for the remaining catch. US catch has been dominated by landings the last three years, with over 90% of the landings due to otter trawl gear (Table B2). Longline and gillnet account for most of the remaining landings. In 2007, about 40% of the US catch was due to discarding (Table B3), primarily undersized fish from the 2003 boomer year class. Since then, discard estimates have decreased dramatically, accounting for 1-6% of the total catch. The number of trips observed for discard estimation has been high, with over 1000 trips in each of the last three years (Table B4). All of the US catch of Georges Bank haddock is due to the commercial fleet, as recreational discards are estimated to be zero or near-zero (Table B5). Recent sampling of commercial landings by market category for lengths ranged from 1 to 10 fish per mt of landings and about 0.5 to 5 fish for age sampling per mt landed (Table B6).

Groundfish Assessment Updates 2012 97 B- GB Haddock
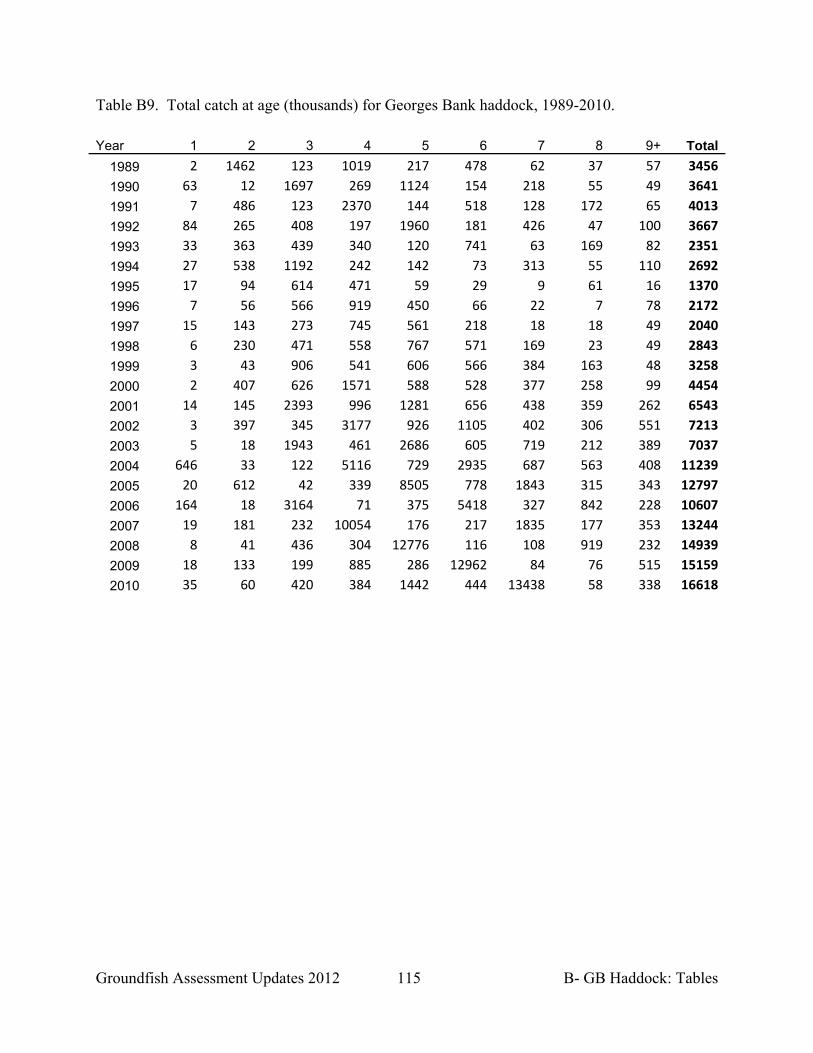
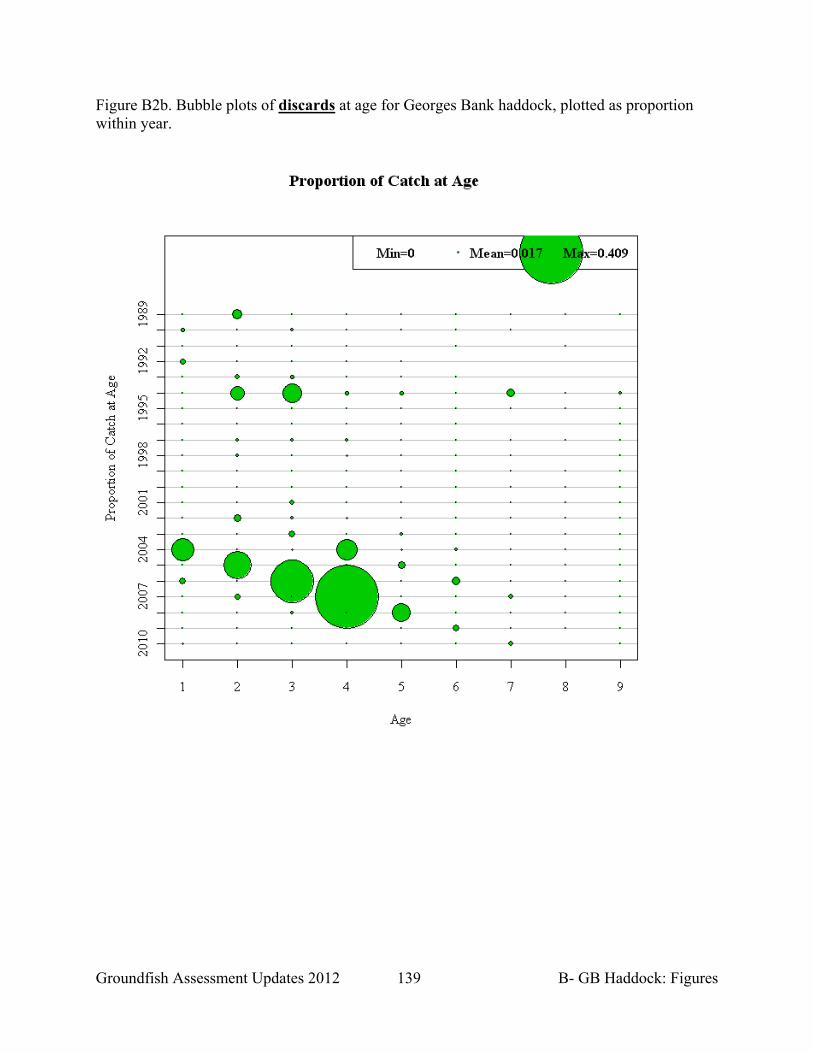
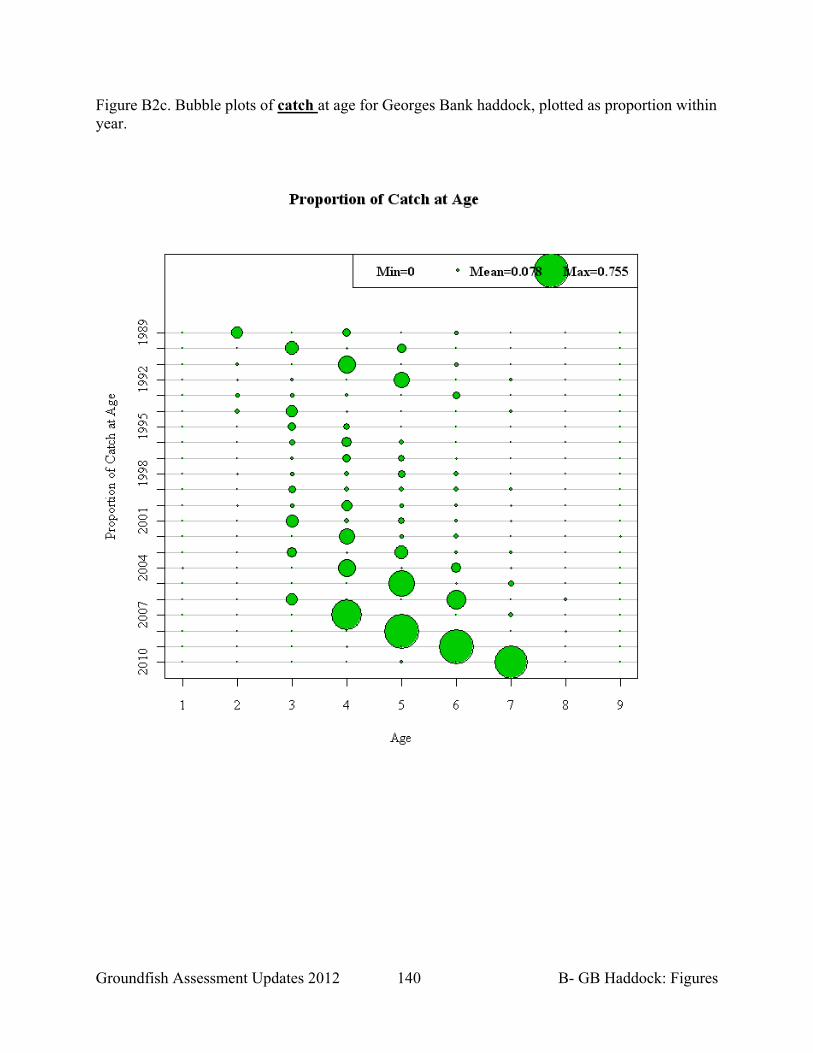
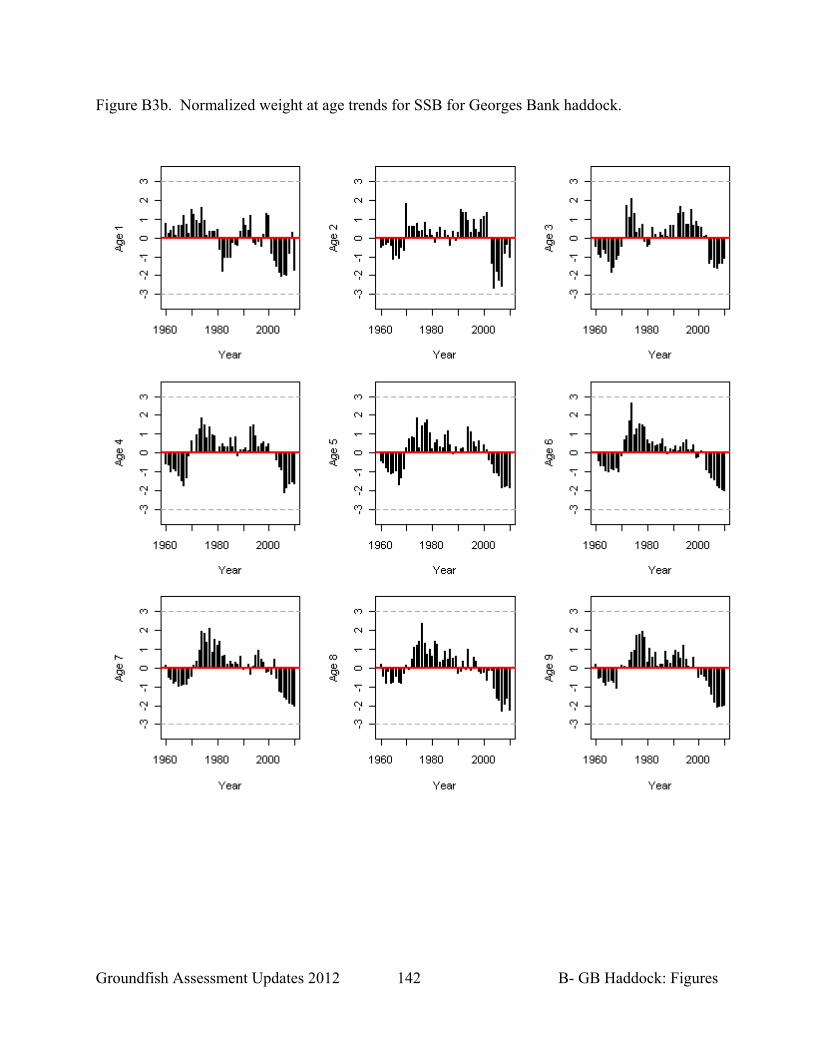
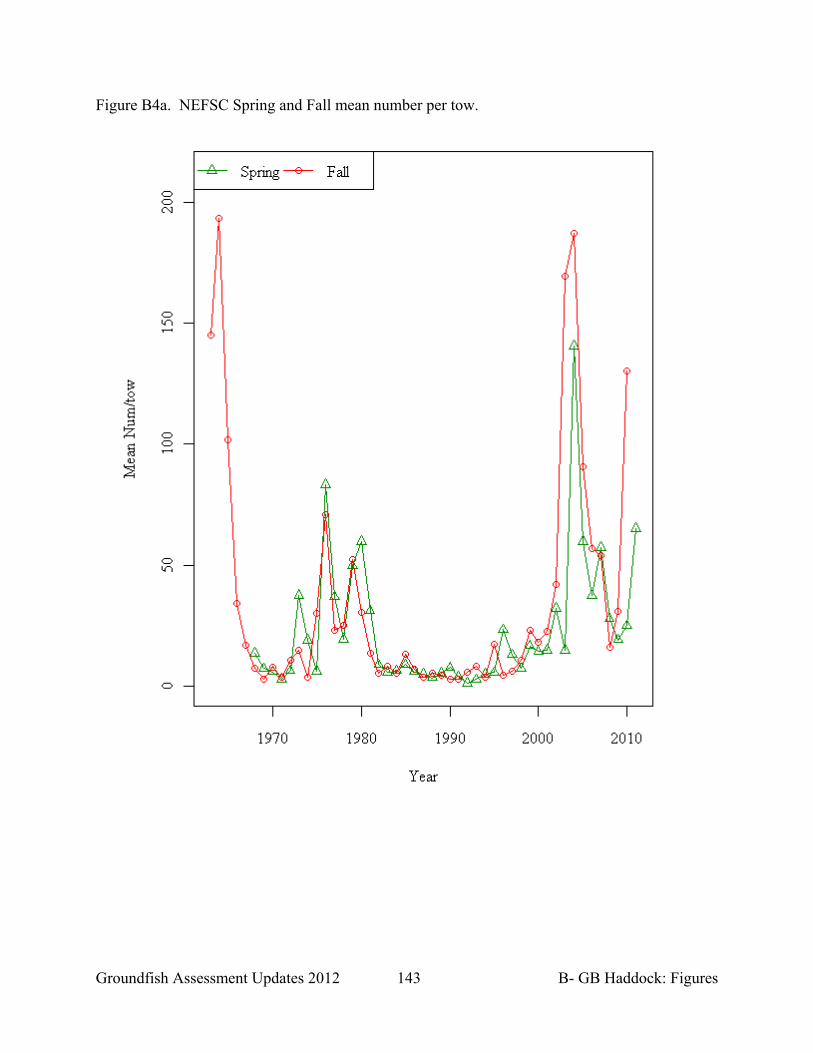
Ageing of samples Precision age testing for haddock is conducted six times a year, once for each cruise (spring & autumn) and for each quarter of the commercial samples. The precision tests are for both Georges Bank and Gulf of Maine stocks combined. Each precision test includes a subsample of about 100 fish, and measures the repeatability of age assignment by the age reader. Two accuracy tests for Georges Bank haddock are conducted each year, using the reference collection of Georges Bank samples (N 60; one prior to and one after the production ageing). In addition to these tests, an annual exchange of Georges Bank age samples is conducted with DFO staff in Canada to compare age assignments between the age readers (2-4 separate precision tests each year representing a range of sample sources/seasons; N 50 within each test). For the period 2008 to 2010, the precision levels for all haddock (Georges Bank and Gulf of Maine) had an average agreement of 97% and an average CV of 0.5%. The best results showed complete agreement (100%, 0.0% CV) between the ages for each fish; the worst results were 92% agreement and a CV of 1.3%, both on tests of the autumn survey. No bias occurred in any of the tests. All of these results exceed our standards for adequate ages (>80% agreement, <5% CV, and no bias). Accuracy tests on Georges Bank haddock resulted in an average 94% agreement (1.6% CV). The best result was 96.7% (0.3% CV) for the January 2009 test; the worst result was 88% agreement (4.1% CV) in October 2010. Full testing results and an explanation of the statistics listed above can be found at http://www.nefsc.noaa.gov/fbp/QA-QC/hd-results.html. Landings at age were estimated from an age-length key derived from the commercially sampled fish. Discards at age were estimated from total discards by applying age-length keys from the spring and fall NEFSC groundfish survey. Age specific components of landings, discards, and total catch can be found in Tables B7-B9, and Figure B2. The 2003 year class continues to dominate both the landed and discarded fraction of the catch. The weights at age for the catch are a weighted mean of the age-specific weights from the various components of the catch (US landings, US discards, Canadian landings, Canadian discards). In recent years, weight at age declined for all ages, coincident with the extraordinarily large 2003 year class (Table B10; Fig. B3). Consistent with previous assessments, spawning weights have been calculated from the catch weights by the Rivard method. C. Research surveys For the NEFSC spring and fall groundfish surveys, the trends in mean number per tow and mean kg per tow for the last decade have tracked the 2003 year class (Table B11; Fig. B4). Both the spring and fall surveys peaked in 2004; there was some noise but mean number per tow declined sharply through 2010 while mean kg/tow declined more

Groundfish Assessment Updates 2012 98 B- GB Haddock
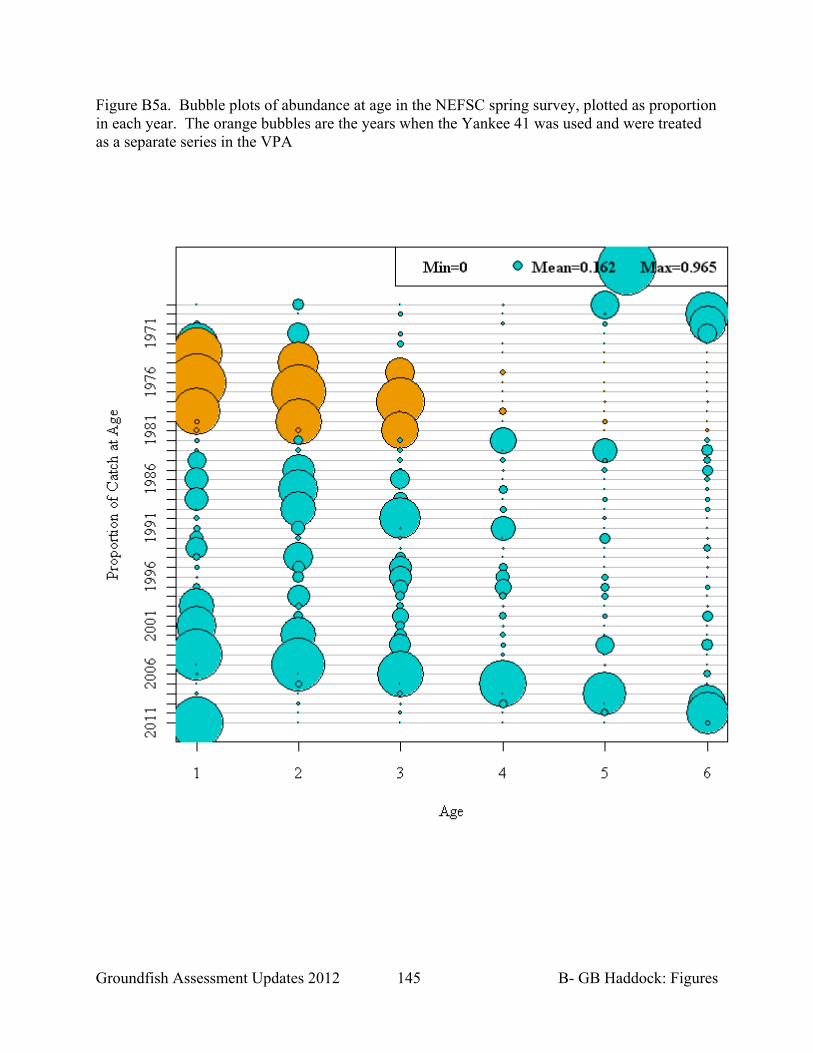
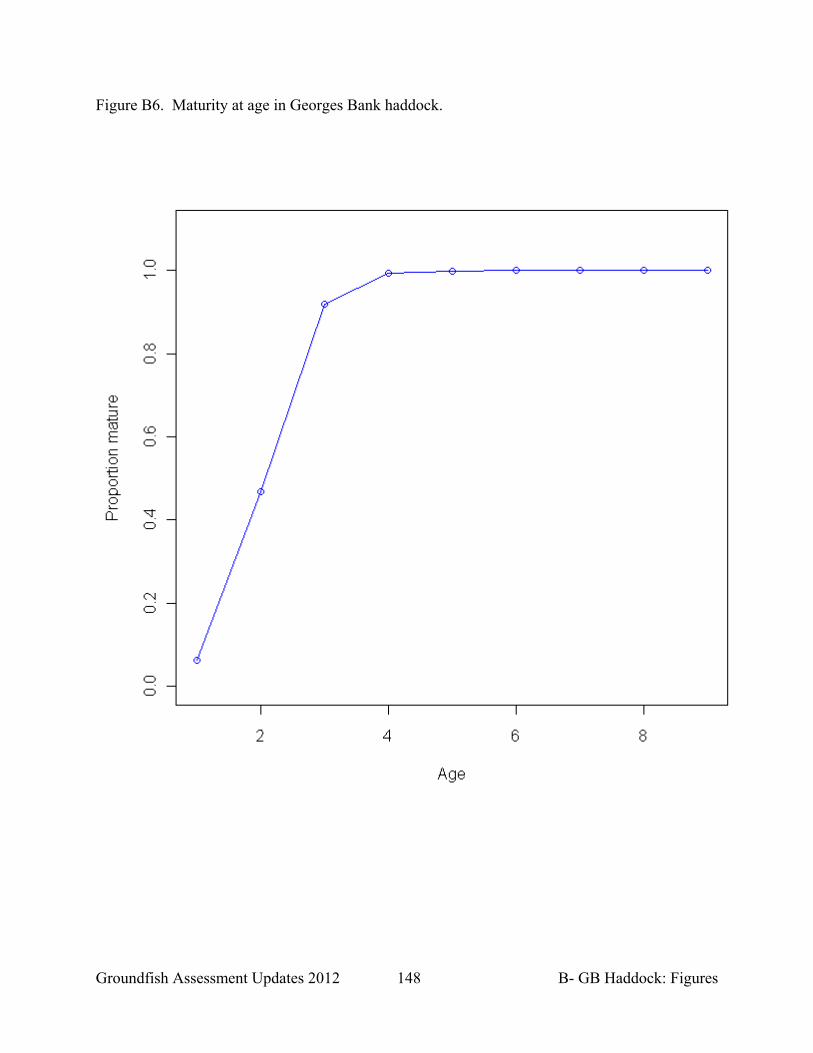
gradually as declines in numbers was somewhat offset by gains in weight with age. The fall 2010 mean number/tow and the spring 2011 mean number per tow are quite large. These two observations provide the first glimpse of the incoming 2010 year class, which may be the first strong year class since 2003. The indices at age have been scaled and reflect minimum swept area estimates for the two NEFSC surveys and for the DFO spring survey on Georges Bank (Tables B12-B14; Fig. B5). The NEFSC fall survey is lagged forward an age and a year, while the two spring surveys (NEFSC and DFO) reflect true ages. The spring 2011 estimates for age 1 are large for both NEFSC and DFO. The fall and spring NEFSC surveys for 2009-2010 were conducted from the R/V Henry Bigelow, and are expressed in units that are consistent with the R/V Albatross IV. A large scale calibration study between vessels was conducted, and initial estimates for constant calibration factors were calculated by Miller et al. (2010). Additional analyses were done to estimate length specific calibration factors and are reported in Brooks et al. (2010). Length specific calibration factors and CV are given in Table B15. The calibration factors are estimated to be very precise, with CVs ranging from 3% to 7%. D. Assessment Model The final GARM-III base model for Georges Bank haddock was performed with the NOAA Fisheries Toolbox (NFT) ADAPT VPA version 2.8.0. That input file was then run in ADAPT VPA version 3.1.1 to confirm that the results were identical. The additional data were then added and run with the same configuration as for GARM-III. Ages one through nine were modeled, with age class nine serving as a plus-group. The first year in the catch at age was 1931 (data from 1931 to 1962 from Clark et al., 1982). The F for the oldest ages is calculated from the F on ages 5 to 7. Maturity Most haddock are immature at age 1 and almost fully mature by age 3. Previous assessments used time-varying stanzas of maturity at age in VPA analyses. A single ogive for all years was adopted at GARM-III based on the age at 50% maturity not appearing to differ significantly across years for the 3 or 5 year window. Data from 2008-2010 provided no evidence to deviate from the existing maturity ogive (Fig. B6). Natural Mortality As in previous assessments for this stock, M=0.2 was assumed for all ages (1-9+) and all years. No alternatives were explored. Indices A total of 30 age-specific indices were used: ages 1 through 8 for the NEFSC spring survey, ages 1 through 8 for the NEFSC spring survey with the Yankee-41 net, ages 1 through 8 for the Canadian DFO spring survey, and ages 1 through 6 for the NEFSC fall

Groundfish Assessment Updates 2012 99 B- GB Haddock
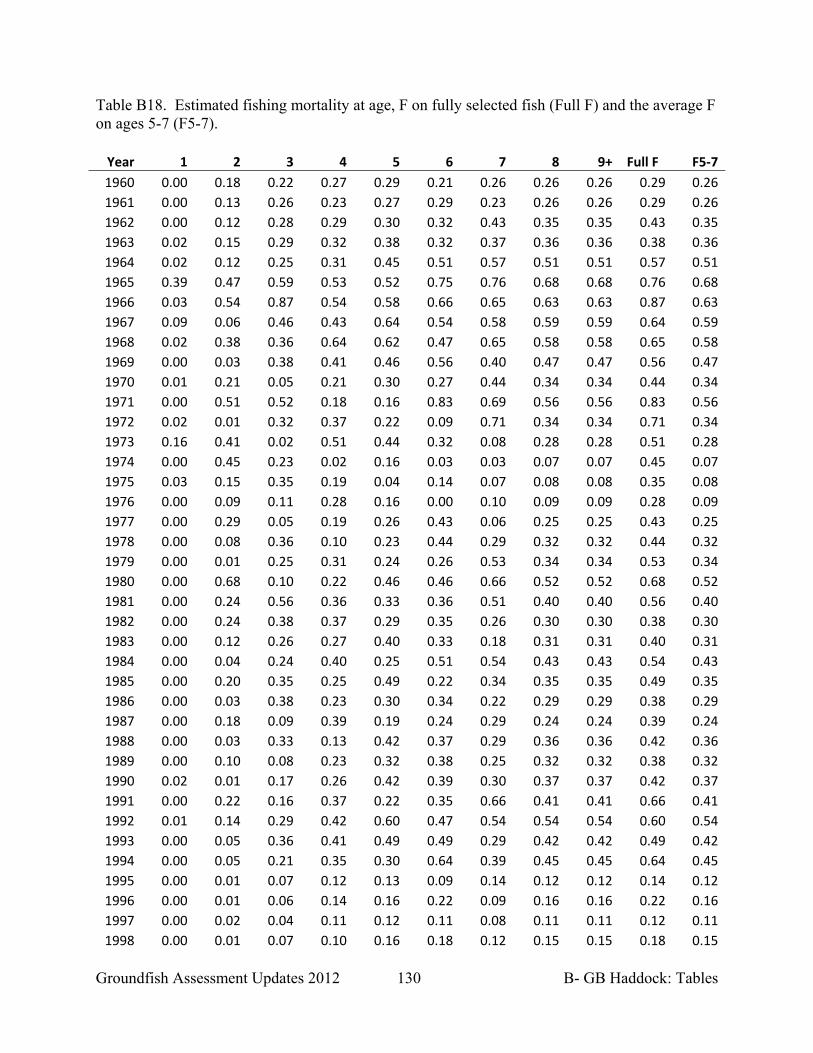
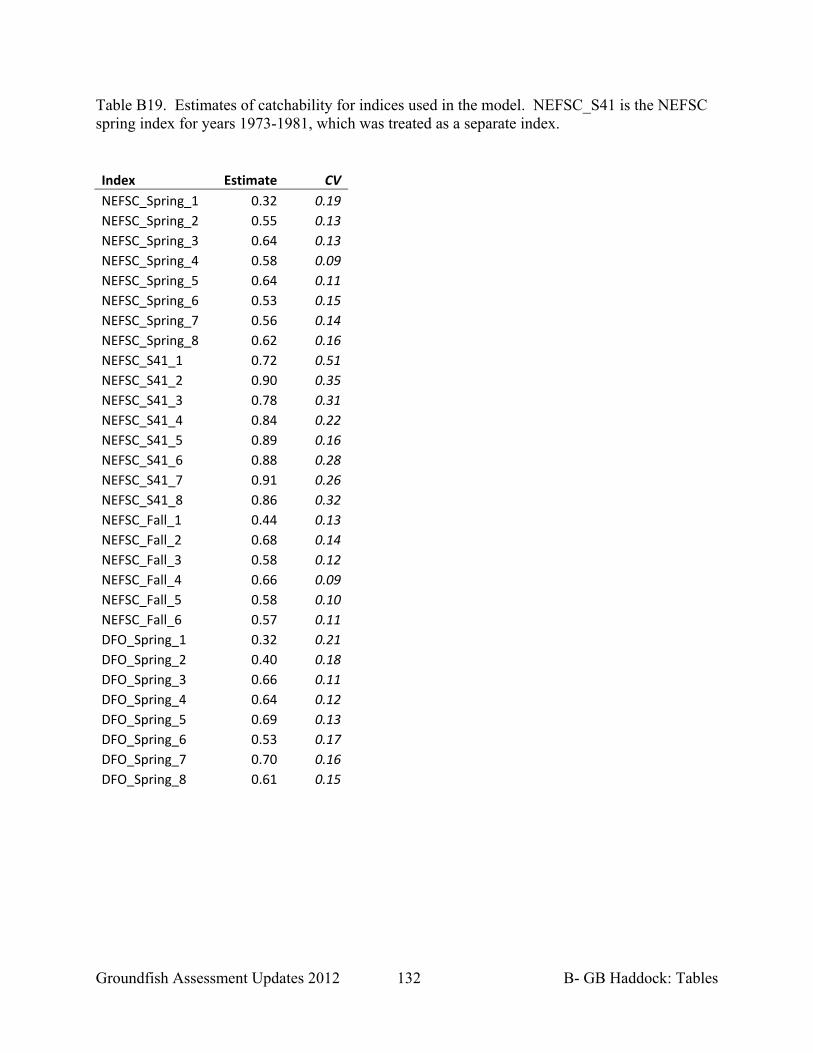
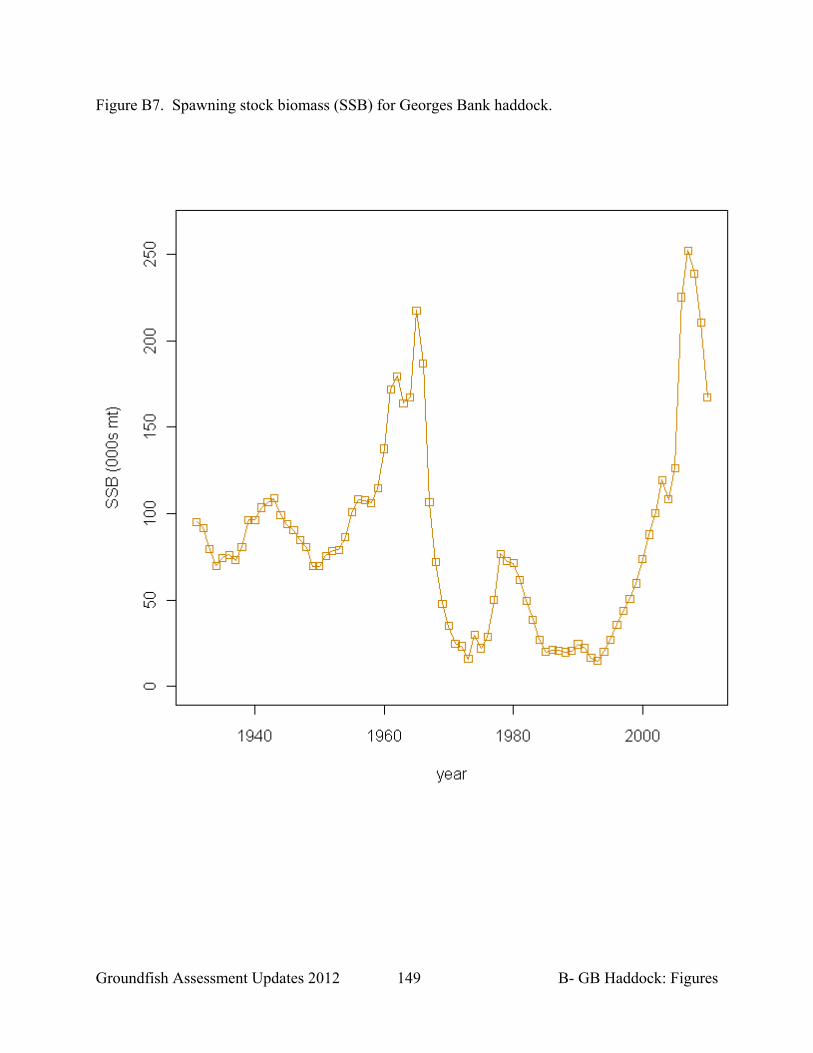
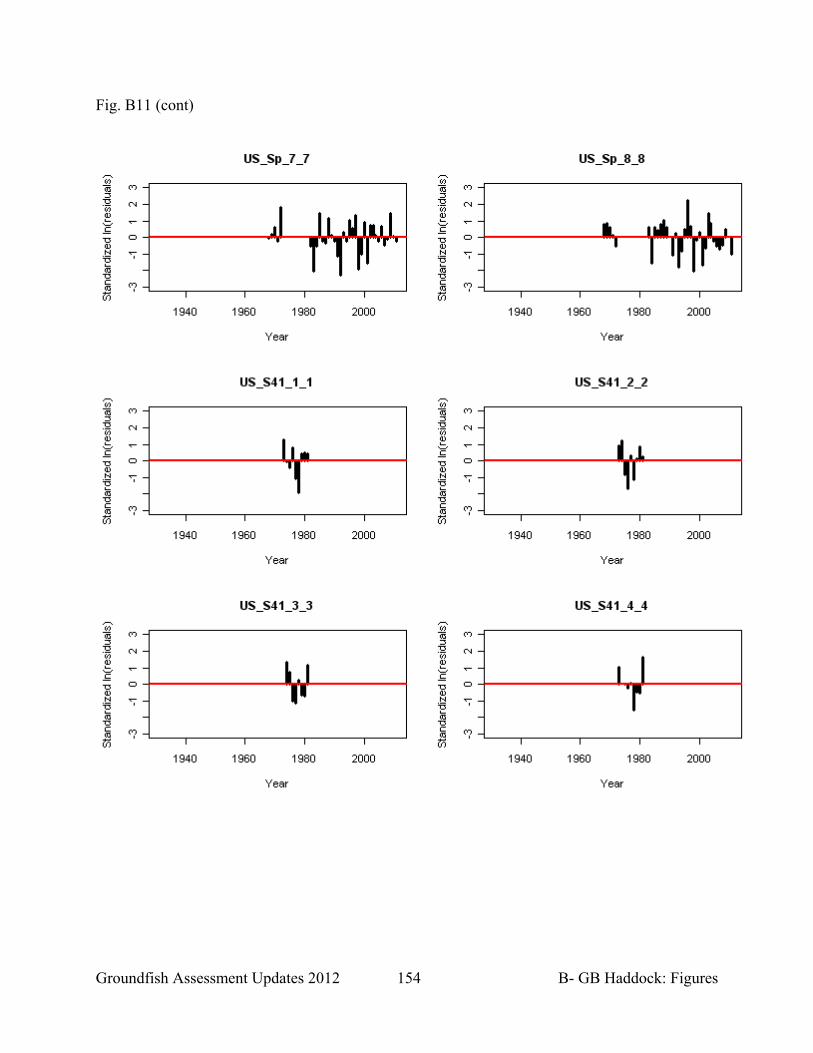
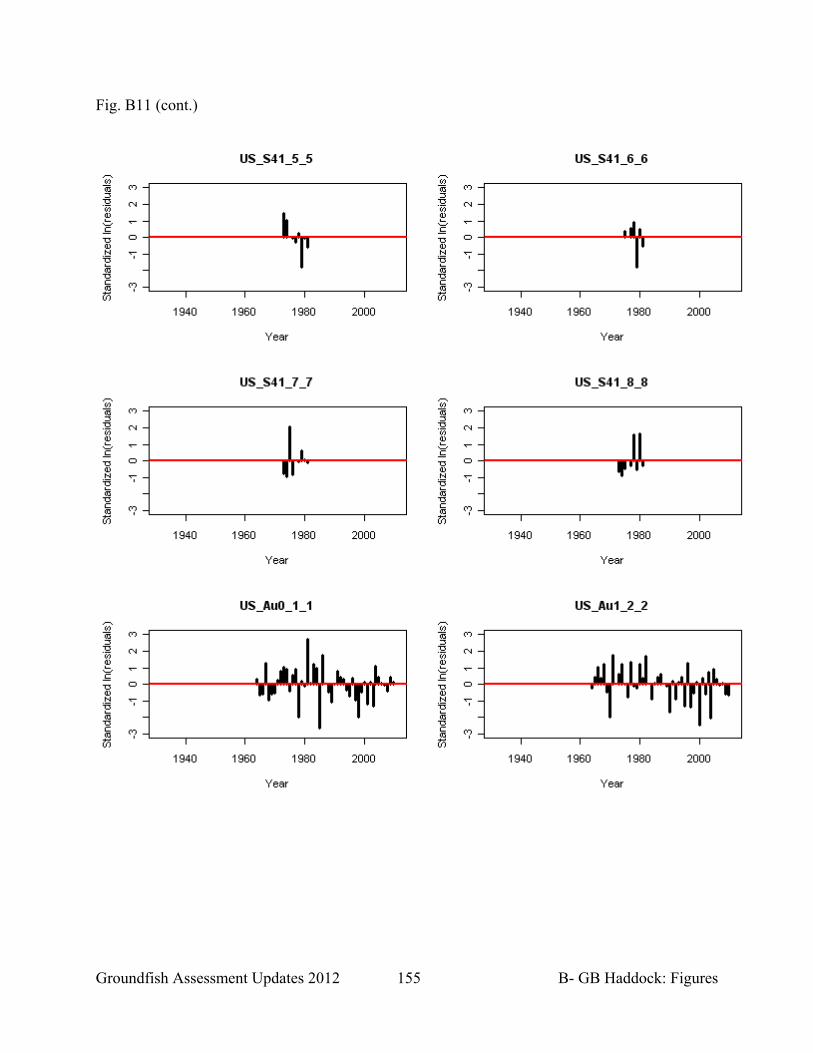
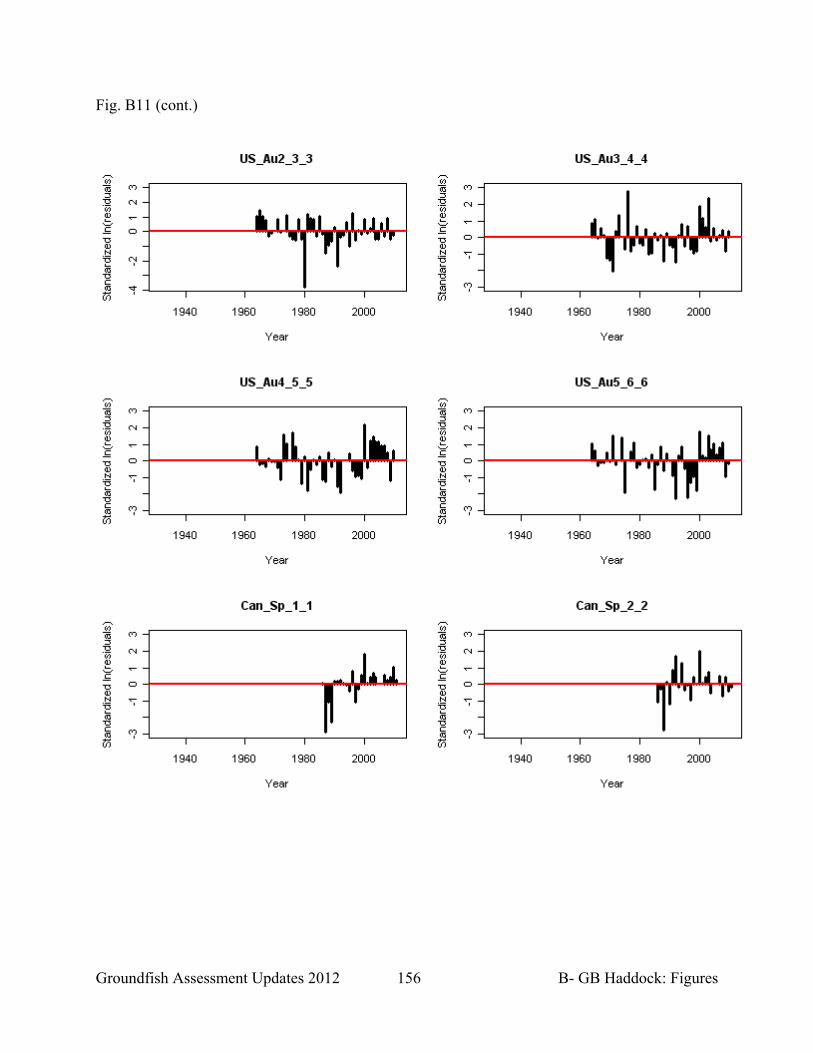
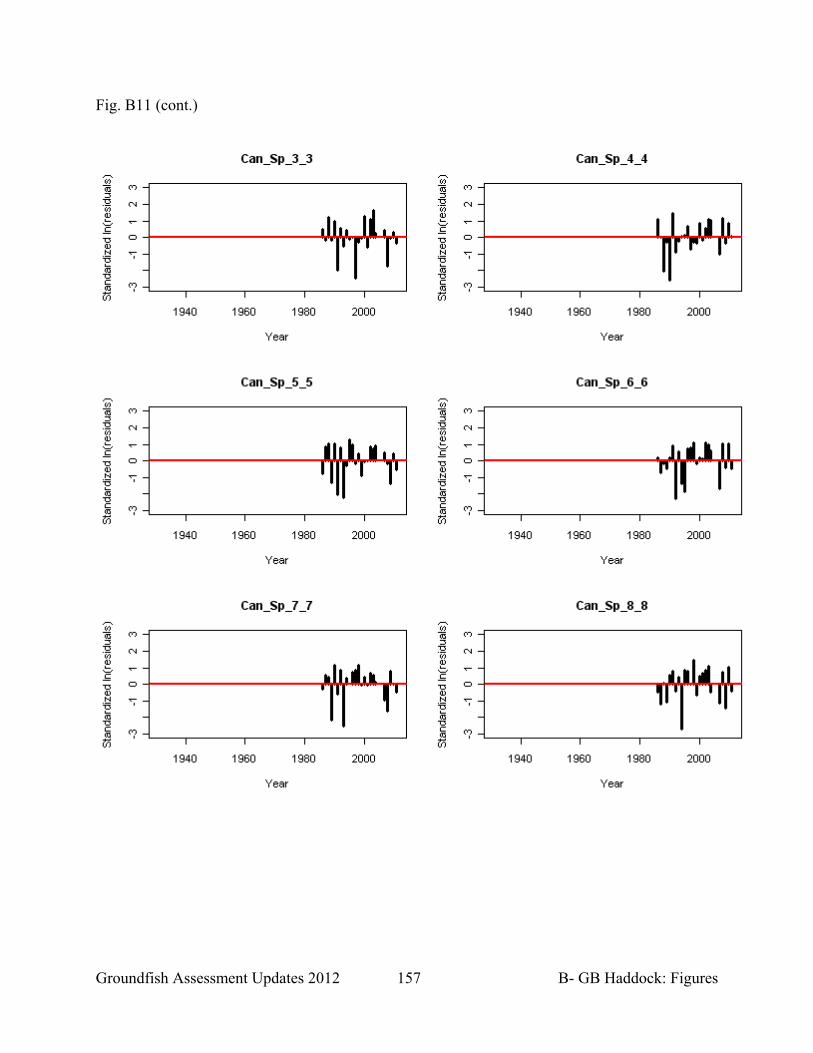
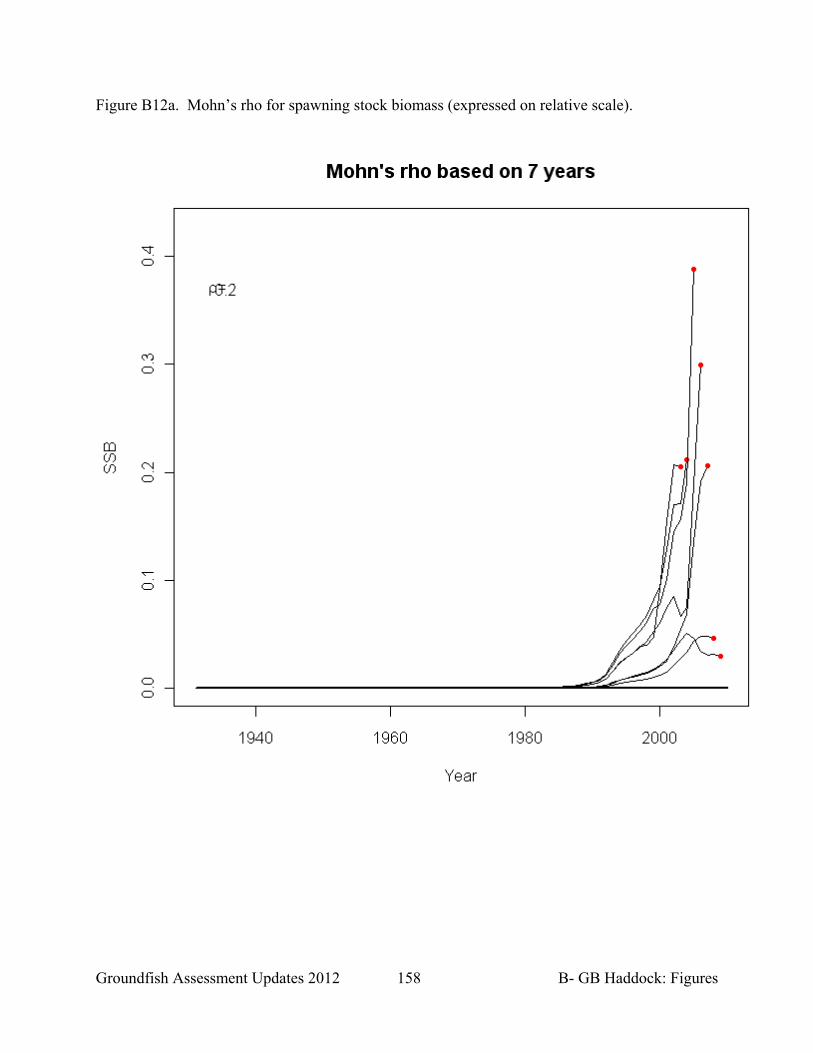
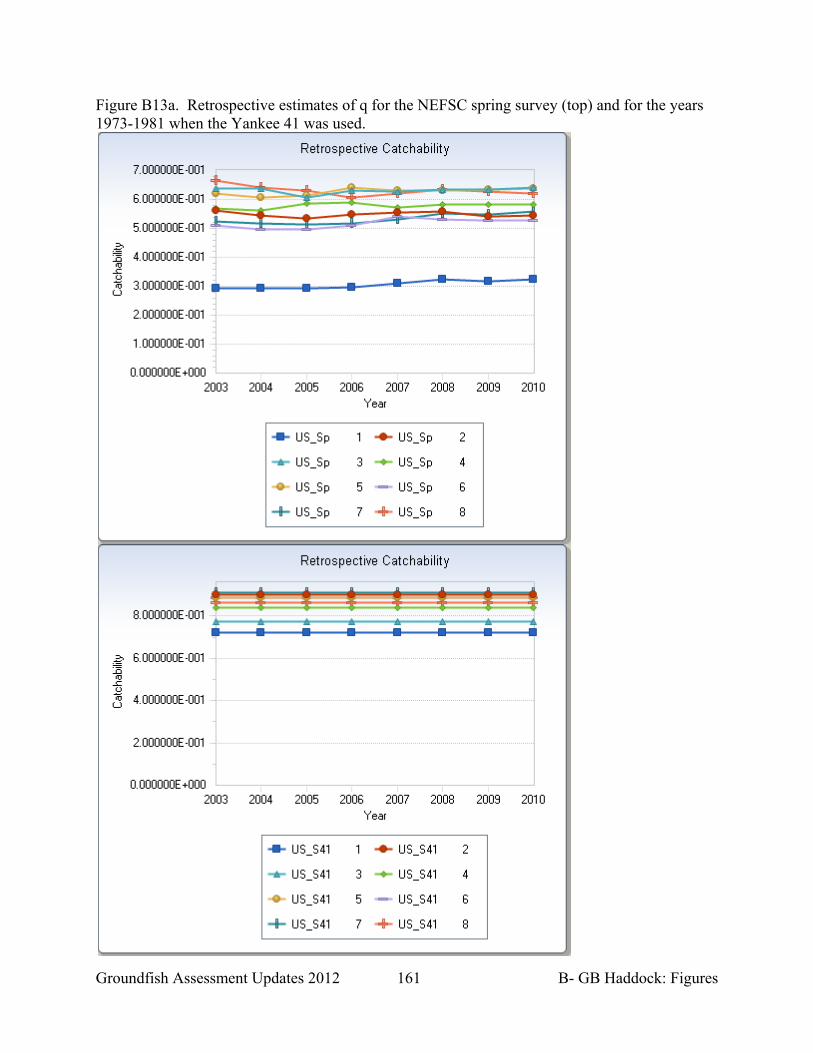
survey. The NEFSC indices used the conversion coefficients to calibrate for the type of door used and the vessel. VPA Results The VPA estimated a steady increase in SSB from a low of about 15,000 mt in the early 1990s, to about 252,000 mt in 2007 (Table B16, Fig. B7). The dramatic increase 2005-2007 is due to the exceptionally large 2003 year class reaching maturity. From 2007 to 2010, SSB decreased 35% as that 2003 year class decreased in number from both natural and fishing mortality. The estimated size of the 2003 year class is 412,386,000 age-1 fish, which is slightly less than the 1963 year class size of 460,816,000 age-1 fish (Table B17; Fig. B8). Excluding these two large year classes, the average recruitment between 1964 and 2007 has been about 17 million age 1 fish. From 1980 to 1994, average fishing mortality on ages 5 to 7 was about 0.4, but dropped to 0.12 in 1995 and remained low for several years (Table B18; Fig. B9). Since 1998, fishing mortality steadily increased from 0.15 to 0.26 in 2006, but has since been close to or below 0.2. The catchabilities (q’s) estimated in this assessment tended to flatten for the indices of older ages (Fig. B10). The model estimates of q’s ranged from about 0.3 to about 0.7 for the NEFSC and DFO surveys (Table B19). The years 1973-1981 in the spring NEFSC spring survey are modeled as a separate index, and have catchabilities in the range of 0.72-0.91. Uncertainty in model estimates was obtained by performing one thousand bootstrap iterations of the base VPA. The estimated precision for stock numbers in 2011 ranged from 23% to 32% for ages three to eight, and was slightly higher at age two (42%). The estimated number of age 1 recruits in 2011 was nearly 750 million age-1 fish, but this value was highly uncertain with a CV of 84%. Spawning stock biomass in 2010 was estimated at 167,266 mt and was fairly precise with a CV of 17%. Estimated average fishing mortality on ages 5 to 7 in 2010 was 0.18 with a CV of 13%. VPA Diagnostics Plots of standardized residuals for the indices did not show any strong patterning (Fig. B11). The average Mohn’s rho was calculated for the seven retrospective relative differences in years 2003-2009 (Fig 12). The values for Mohn’s rho were 0.2 for SSB, -0.15 for F, and 0.14 for age-1 recruitment. Retrospective plots of catchability estimates showed very little sensitivity to years being removed from the model (Fig. B13).
Groundfish Assessment Updates 2012 100 B- GB Haddock
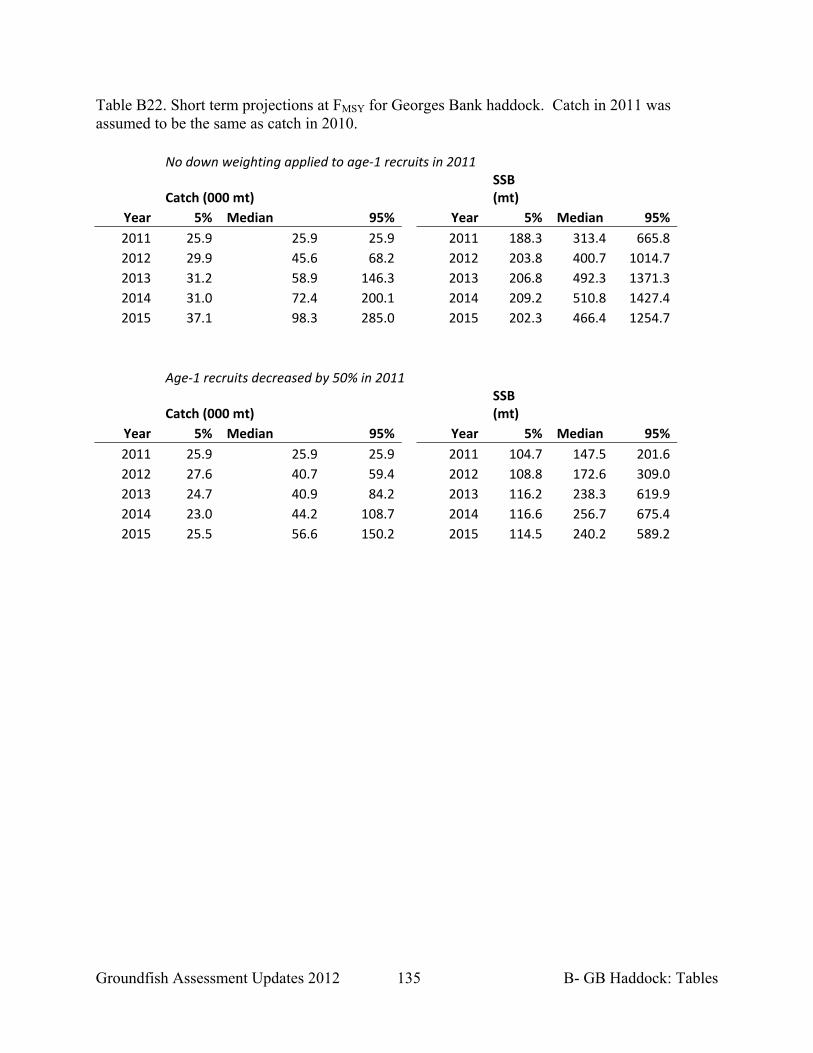
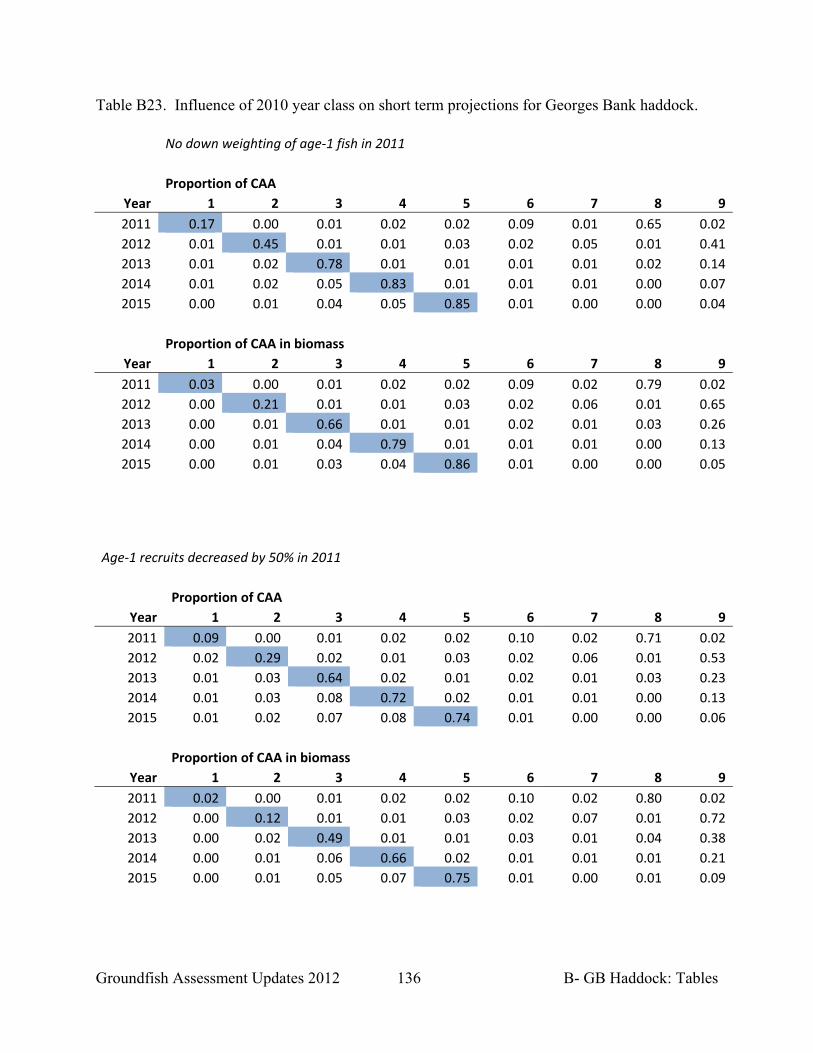
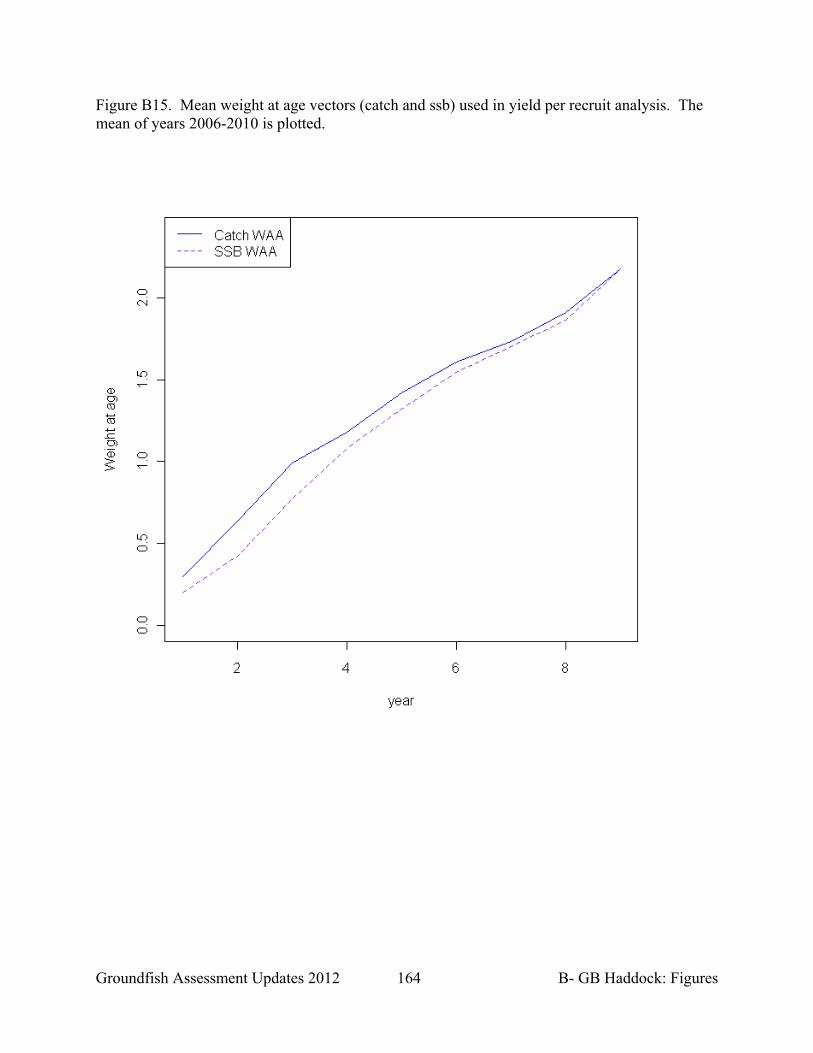
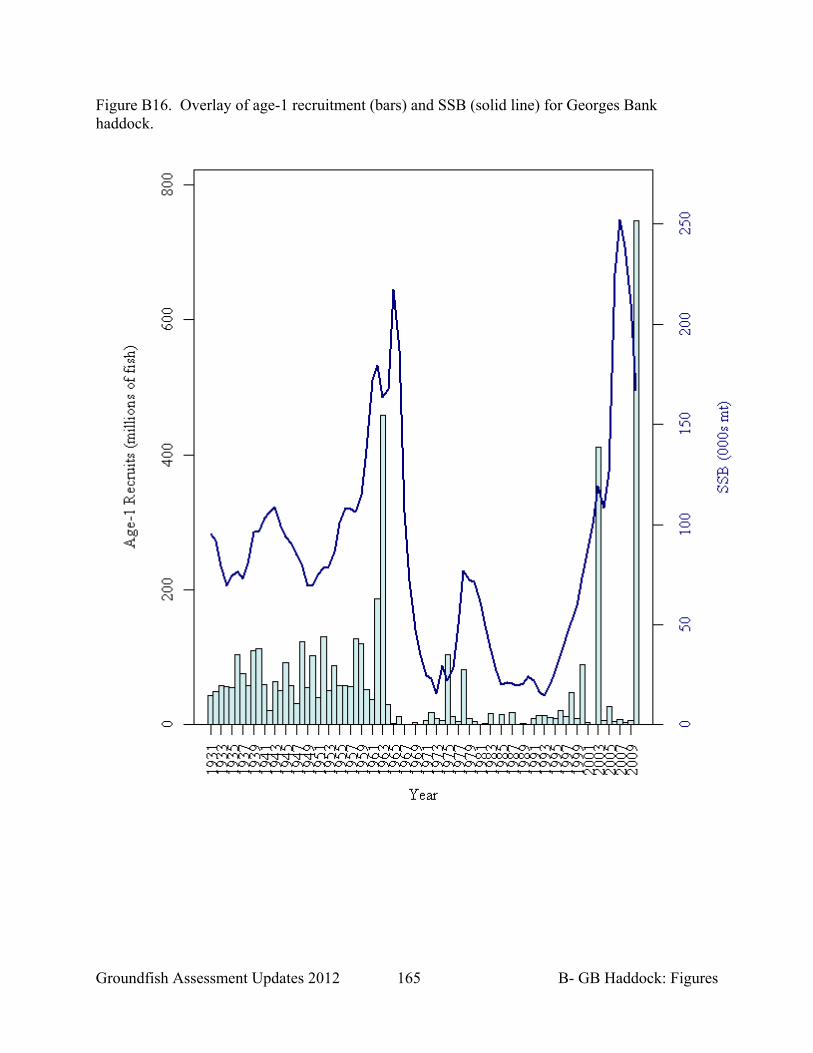
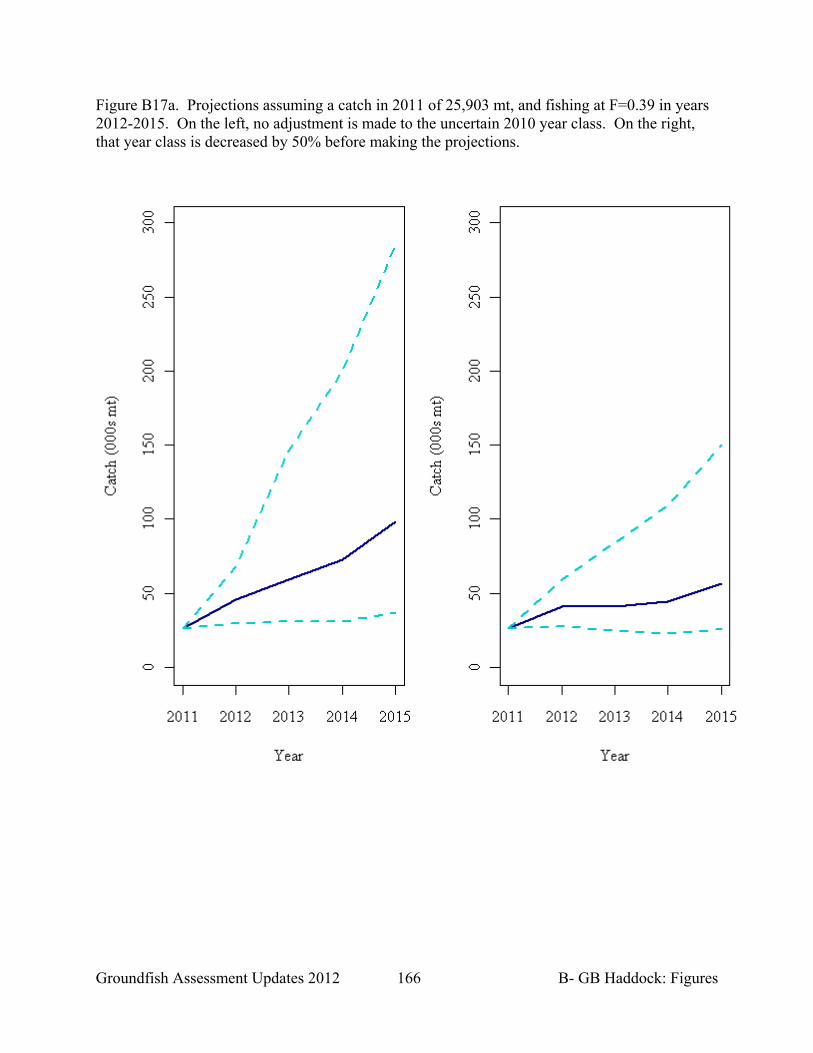
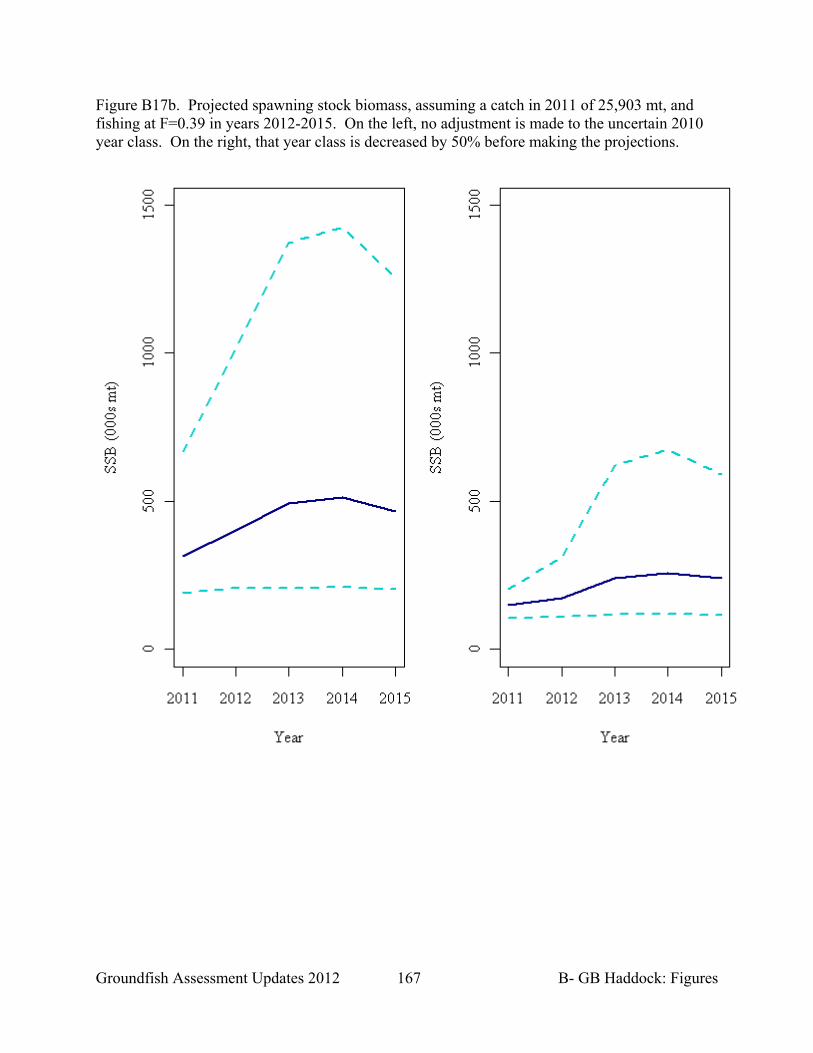
E. Biological reference points (BRPs) The NMFS Toolbox program for calculating yield per recruit was used to estimate F40% (the current proxy for FMSY). An average of the last 5 years selectivity at age was examined to determine the fully selected age; ages beyond that were assumed to be fully selected as well (Fig. B14). The stock weight, catch weight, SSB weights, and maturity were also based on an average of the last 5 years (2006-2010; Table B20 and Fig. B15). Compared to the selectivity at age that was used to derive the BRPs in GARM-III, the selectivity ogive in this assessment shows age 6 to be fully selected and age 5 to have a selectivity of about 0.71 (Table B20). For this assessment, the updated estimate of F40% was 0.39 compared to the current GARM-III value of 0.35 (Table B20). As was done for GARM-III, the NMFS Toolbox program AGEPRO was used to determine equilibrium, median values for SSBMSY and MSY under the F40% from the YPR analysis. The selectivity ogive and weights used in the determination of F40% (see Table B20) were applied to the population for 100 years and the median, 5th, and 95th percentiles of 1000 bootstraps are reported for SSB and yield (Table B21). The recruitment option employed was to sample from the empirical cdf (Model 14 in AGEPRO). At the GARM-III-BRP meeting, it was noted that recruitment tended to be stronger when SSB levels exceeded 75,000 mt (Fig. B16). The panel therefore recommended that the recruitment estimates to be sampled in the AGEPRO projections should come from the model estimates when SSB>75,000 mt, but excluding the large 1963 and 2003 year classes. Both the 1963 and 2003 year classes were excluded, as were the final two model estimates (2009 and 2010 recruitment). The long-term median recruitment from this projection is 54.2 million age-1 fish, with 90% CI ranging from 4 million to 130 million fish. The estimates of equilibrium SSBMSY and MSY are 124,900 mt and 28,000 mt, respectively. There is a 90% probability that SSBMSY is between 71,800 and 187,800 mt, and that MSY is between 16,300 and 41,900 mt. F. Projection As the Georges Bank haddock stock is still considered rebuilt, no rebuilding projections were made. However, a projection was made to estimate catch and stock levels from 2011-2015. In this projection, catch in 2011 was assumed to be at the same level as catch in 2010 (25,903 mt), and fishing mortality was assumed to be FMSY in 2012-2015 (F=0.39). Under this mixed harvest scenario, the realized F in 2011 is projected to be 0.20, and catch in years 2012-2015 is projected to increase from 45,600 mt to 98,200 mt. SSB from 2011 to 2015 is projected to range from 313,300 mt to 466,300 mt (Table B22; Fig. B17). Sensitivity projection The estimate of the 2010 year class is uncertain, but the high initial estimate has a large influence on projected short-term catch (Table B23). As this initial estimate is only based on data from the spring 2011 survey indices of age-1 fish, there are no
Groundfish Assessment Updates 2012 101 B- GB Haddock
corroborating observations in the catch. A sensitivity projection was done where the estimated size of the 2010 year class is reduced by half. This 50% reduction was motivated by examining the direction and magnitude of change between initial estimates of two recent above average year classes (2003 and 1998). Specifically, the relative change in estimates of year class size was compared between an estimate based on one year of data and model runs that added one additional year of data. Rather than computing this relative change from the terminal point (as in Mohn’s rho), the relative change was calculated from the initial model estimate. This more closely replicates the present scenario: survey observations from one year are all that is being used to estimate the 2010 year class. In future years, the estimate will become less certain as data are added to the model. The question is how biased is the initial 2010 year class estimate, and what is the best way to address this in projections? Figure B18 shows the relative change in estimated year class size as additional years of data are added to the model. In general, estimates of year classes tended to stabilize with three to five years of data. Over the range of years considered, the current estimates of two recent large year classes (1998 and 2003) were about half of the initial estimate based on one year of data. Results from this sensitivity projection lead to catches that range from 40,700 mt in 2012 to 56,500 mt in 2015. From 2011 to 2015, SSB ranged from 147,700 mt to 240,200 (Fig. B17). G. Summary Stock Status The estimate of SSB2010 is 167,278 mt, which is greater than the median estimate of SSBMSY (124,900 mt). Therefore, the Georges Bank haddock stock is not overfished. The estimate of F on fully selected fish in 2010 is 0.24, which is less than the FMSY proxy (0.39), therefore overfishing is not occurring. Applying Mohn’s rho for 7 years did not cause the stocks status to differ from the calculated confidence interval, therefore the retrospective pattern was not considered for additional sensitivity configurations (Fig. B19). Sources of Uncertainty The primary source of uncertainty for this stock is the estimate of the 2010 year class. It is hypothesized that there is less uncertainty in age specific mean lengths and weights, compared to the GARM-III assessment, because the patterns have stabilized somewhat over the period of years used to estimate the reference points and for making projections. If the 2010 year class materializes and is indeed large, the current slower growth may persist. The catch projections for 2011-2015 used the same series of recruitment estimates as were used to estimate reference points, i.e. values of recruitment that corresponded to SSB greater than 75,000 mt. There were 39 recruitments that matched this criterion, and the mean recruitment was 58 million fish. If all estimated recruitments had been sampled (excluding the final two years, and excluding the two extraordinary 1963 and 2003 year
Groundfish Assessment Updates 2012 102 B- GB Haddock
classes), then the mean recruitment would have been somewhat lower at 41.7 million fish. Recent recruitment since 2000 (excluding 2003) has averaged about 19 million fish. It can be expected that projected catch advice will be sensitive to the recruitment values that are sampled from. H. Panel Conclusions and Comments
Status of Georges Bank Haddock Stock SSB in 2010 is estimated to be 167,279 mt. Status determination is based on average F5-7, which is estimated to be 0.18. (F on fully selected fish in 2010 is estimated to be 0.24.) Revised estimates of the biological reference points are:
SSBmsy proxy= 124,900 mt, Fmsy proxy = 0.39, and MSY proxy= 28,000 mt.
Based on these results, the stock of Georges Bank haddock is not overfished and overfishing is not occurring. The stock is above the biomass target. The results are based on the same model used in GARM-III (NEFSC 2008, CRD#08-15). Short-term projection methodology adopted a new approach to reduce the influence of a potentially large but uncertain 2010 year class. The initial estimate of the 2010 year class is nearly 750 million age-1 fish, although the CV on this estimate is 84%. Recruitment estimate for 2010 was reduced by multiplying it by 0.41 for the short-term projections, which is the magnitude of reduction observed between the initial and final estimate for the large 2003 year class at age 1. The BRPs are based on the following updates: average of the most recent 5 years of weights and selectivity at age, the same approach used in GARM 2008.

Groundfish Assessment Updates 2012 103 B- GB Haddock
GB Haddock. Summary of Assessment Information
GB Haddock 2002 2003 2004 2005 2006 2007 2008 2009 2010 2011 Avg Min Max YrRange
Landings (mt) 13019 12535 17121 21087 14629 14837 20632 22930 25759 10635 2296 25759 1989‐2010
Discards (mt) 239 292 1132 727 1360 1968 389 196 144 508 103 2209 1989‐2010
Catch (mt) 13258 12827 18253 21814 15989 16815 21021 23126 25903 21847 2442 150362 1960‐'10
SSB 100258 119310 108126 126290 225173 252065 238744 210557 167279 82400 14836 252065 1960‐'10
Recruits 5551 2870 412375 7985 28833 7123 9365 4773 7605 748016 53074 267 748016 1960‐'11
F avg 5‐7 0.24 0.22 0.31 0.33 0.26 0.19 0.13 0.14 0.18 0.32 0.07 0.68 1960‐'10

Groundfish Assessment Updates 2012 104 B- GB Haddock
Reviewer Comments
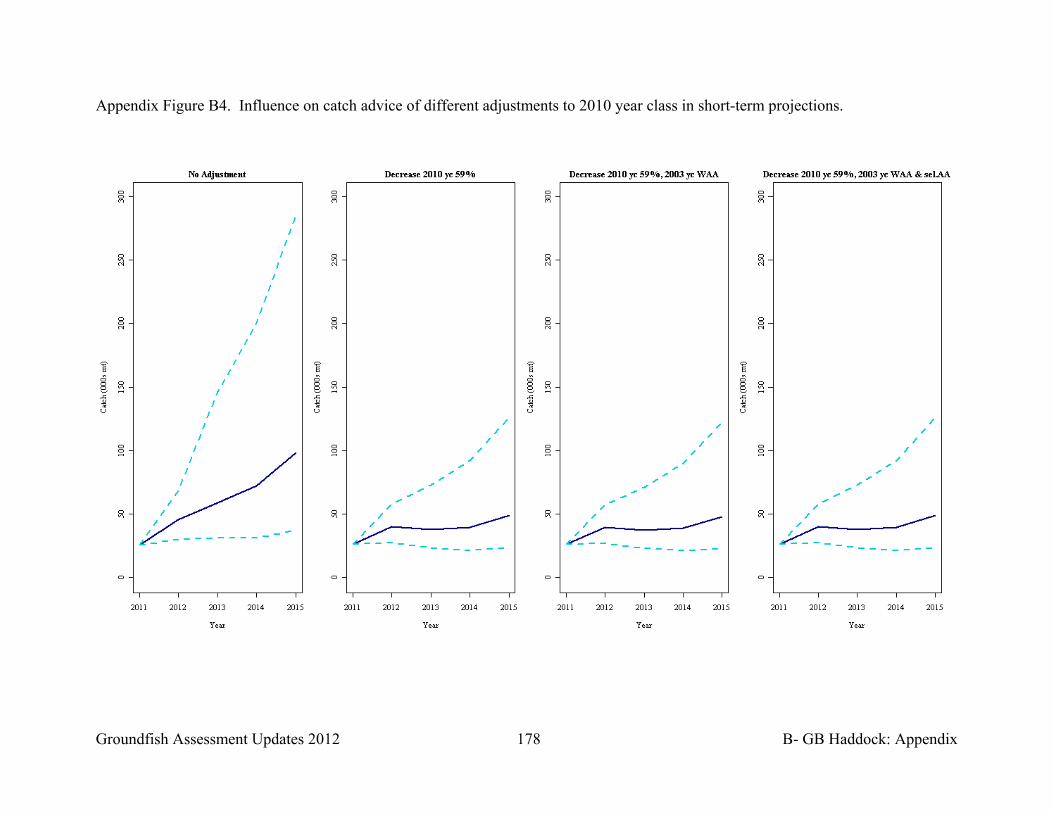
The work that is presented is accepted by the Review Panel for determining stock status and providing catch advice. The 2010 yearclass appears to be large. The panel asked about the impact of slow growth, selectivity and how a tendency for initial year class strength to be overestimated could impact projections. This concern arose because of experience with overestimatiion of projected catch as the 2003 year class recruited to the fishery. Currently growth is similar to that observed for the 2003 yearclass. Fishery selectivity is different, but management has altered size limits several times so that year class effects and management effects on selectivity are confounded. The panel expressed concern that weights and selectivity could be misspecified in short term projections for the 2010 year class. To address these concerns, three additional projections were conducted and are included in GB haddock Appendix: i) the 2010 year class was multiplied by 0.41, which was the most recent calculation for rescaling of the 2003 year class (Appendix Tables B1-B2); ii) in addition to (i), realized weights for the 2003 year class were used as projected weights for the 2010 year class (Appendix Table B3, Appendix Figs B1-B2); iii) in addition to (i) and (ii), realized selectivity for the 2003 year class were used as projected selectivity for the 2010 year class (Appendix Table B3; Appendix Fig. B3). It should be noted that for the third projection, the realized selectivities for the 2003 year class at ages 1-3, and 7.5 months for age 4 were based on a higher minimum size regulation. Neither projected catches nor projected SSB for the additional sensitivity scenarios differed markedly between the three additional projections (Appendix Fig. B4). Given the difference in minimum size (it is now lower than what the 2003 year class experienced in its first 4 years), the panel decided to select sensitivity run (i) as the most appropriate for management advice.

Groundfish Assessment Updates 2012 105 B- GB Haddock
I. References Clark SH, Overholtz WJ, Hennemuth RC. 1982. Review and assessment of the Georges
Bank and Gulf of Maine haddock fishery. J. Northw. Atl. Fish. Sci. 3:1-27. Brooks, EN, ML Travel, S Sutherland, L Van Eeckhaute, and L Col. Assessment of
Georges Bank Haddock. GARM-III Working Paper. Brooks EN, Miller TJ, Legault CM, O’Brien L, Clark KJ, Garvaris S, Eeckhaute LV.
2010. Determining Length-based Calibration Factors for Cod, Haddock and Yellowtail Flounder. Transboundary Resource Assessment Committee (TRAC) Reference Document 2010/08. 23 p.
Miller TJ, Das C, Politis PJ, Miller AS, Lucey SM, Legault CM, Brown RW, Rago PJ.
2010. Estimation of Albatross IV to Henry B. Bigelow calibration factors. Northeast Fish Sci Cent Ref Doc. 10-05. 233 p.

Groundfish Assessment Updates 2012 106 B- GB Haddock: Tables
Table B1. Georges Bank haddock total catch biomass (mt) by country, 1960-2010.
Year USA Canada USSR Spain Other Total 1960 40800 77 0 0 0 40877 1961 46384 266 0 0 0 46650 1962 49409 3461 1134 0 0 54004 1963 44150 8379 2317 0 0 54846 1964 46512 11625 5483 2 464 64086 1965 52823 14889 81882 10 758 1503621966 52918 18292 48409 1111 544 1212741967 34728 13040 2316 1355 30 51469 1968 25469 9323 1397 3014 1720 40923 1969 16456 3990 65 1201 540 22252 1970 8415 1978 103 782 22 11300 1971 7306 1630 374 1310 242 10862 1972 3869 742 137 1098 20 5866 1973 2777 1661 602 386 3 5429 1974 2396 622 109 764 559 4450 1975 3989 1544 8 61 4 5606 1976 2904 1521 4 46 9 4484 1977 7934 3060 0 0 0 10994 1978 12160 10356 0 0 0 22516 1979 14279 5368 0 0 0 19647 1980 17470 10168 0 0 0 27638 1981 19176 5835 0 0 0 25011 1982 12625 5002 0 0 0 17627 1983 8682 3327 0 0 0 12009 1984 8807 1587 0 0 0 10394 1985 4273 3670 0 0 0 7943 1986 3339 3507 0 0 0 6846 1987 2156 4841 0 0 0 6997 1988 2492 4197 0 0 0 6689 1989 1718 3197 0 0 0 4915 1990 2106 3468 0 0 0 5574 1991 1434 5563 0 0 0 6997 1992 2053 4191 0 0 0 6244 1993 827 3841 0 0 0 4668 1994 2302 2525 0 0 0 4827 1995 309 2133 0 0 0 2442 1996 436 3695 0 0 0 4131 1997 1151 2682 0 0 0 3833 1998 2192 3473 0 0 0 5665 1999 2628 3729 0 0 0 6357 2000 3280 5431 0 0 0 8711 2001 5037 6751 0 0 0 11788 2002 6741 6517 0 0 0 13258 2003 5954 6873 0 0 0 12827

Groundfish Assessment Updates 2012 107 B- GB Haddock: Tables
Table B1 (cont.)
2004 8415 9838 0 0 0 18253 2005 7278 14536 0 0 0 21814 2006 3938 12051 0 0 0 15989 2007 4855 11951 0 0 0 16815 2008 6207 14814 0 0 0 21021 2009 5477 17648 0 0 0 23126 2010 9310 16592 0 0 0 25903

Groundfish Assessment Updates 2012 108 B- GB Haddock: Tables
Table B2. US and Canadian landings (mt) by gear of Georges Bank haddock for years 1989-2010.
US landings CAN landings US + CAN
YEAR GILLNET HOOK/ LINE OTHER TRAWL Total US TRAWL Longline Scallop Other
Total CAN TOTAL
US % of TOTAL
1989 42 25 8 1356 1430 1976 977 12 95 3060 4490 0.32
1990 24 16 12 1953 2005 2411 853 7 69 3340 5345 0.38
1991 19 27 9 1341 1395 4028 1309 8 111 5456 6851 0.2
1992 11 17 3 1974 2005 2583 1384 4 87 4058 6063 0.33
1993 6 16 6 659 687 2489 1143 2 93 3727 4414 0.16
1994 9 35 1 162 207 1597 714 9 91 2411 2618 0.08
1995 14 61 0 156 231 1647 390 7 21 2065 2296 0.1
1996 39 69 0 213 320 2689 947 0 26 3662 3982 0.08
1997 40 68 1 772 880 1991 722 0 36 2749 3629 0.24
1998 80 68 1 1767 1915 2422 921 0 28 3371 5286 0.36
1999 128 35 0 2411 2574 2761 887 0 32 3680 6254 0.41
2000 133 25 1 3044 3203 4146 1186 0 70 5402 8605 0.37
2001 131 49 9 4631 4820 5112 1633 0 29 6774 11594 0.42
2002 186 38 14 6294 6532 4954 1521 0 12 6487 13019 0.5
2003 51 164 4 5541 5760 4985 1776 0 14 6775 12535 0.46
2004 40 783 120 6433 7375 7744 2000 0 1 9745 17120 0.43
2005 29 865 91 5618 6604 12115 2368 0 1 14484 21088 0.31
2006 26 297 56 2265 2643 10088 1896 0 1 11985 14628 0.18
2007 9 240 5 2695 2930 10034 1854 0 1 11889 14819 0.2
2008 27 402 25 5397 2695 12615 2164 0 2 14781 17475 0.15
2009 41 415 0 4879 5397 15407 2185 0 3 17595 22992 0.23
2010 28 361 43 8748 4879 14100 2476 0 2 16578 21457 0.23

Groundfish Assessment Updates 2012 109 B- GB Haddock: Tables
Table B3. US discards (mt) by gear, and CV (in parentheses), of Georges Bank haddock for years 2007-2010.
Year Hook/Line OT‐lg OT‐sm GN‐lg GN‐xlg Scallop
2007 74 0.33 1812 0.17 9 0.39 3 0.51 0 3 0.22
2008 43 0.14 303 0.23 3 1.26 3 0.33 0.1 0.70 2 0.23
2009 27 0.17 108 0.22 3 0.70 4 0.45 0.1 0.80 1 0.32
2010 13 0.28 74 0.11 37 0.85 4 0.22 0.2 0.46 2 0.88
Groundfish Assessment Updates 2012 110 B- GB Haddock: Tables
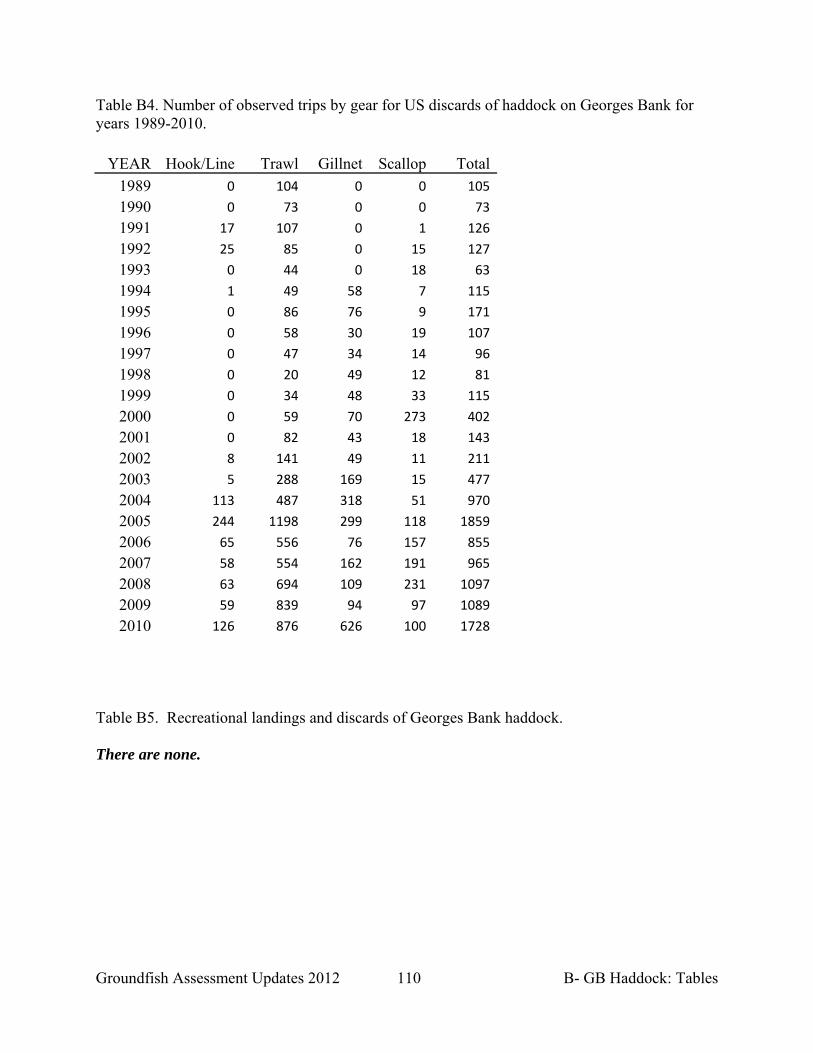
Table B4. Number of observed trips by gear for US discards of haddock on Georges Bank for years 1989-2010.
YEAR Hook/Line Trawl Gillnet Scallop Total
1989 0 104 0 0 105
1990 0 73 0 0 73
1991 17 107 0 1 126
1992 25 85 0 15 127
1993 0 44 0 18 63
1994 1 49 58 7 115
1995 0 86 76 9 171
1996 0 58 30 19 107
1997 0 47 34 14 96
1998 0 20 49 12 81
1999 0 34 48 33 115
2000 0 59 70 273 402
2001 0 82 43 18 143
2002 8 141 49 11 211
2003 5 288 169 15 477
2004 113 487 318 51 970
2005 244 1198 299 118 1859
2006 65 556 76 157 855
2007 58 554 162 191 965
2008 63 694 109 231 1097
2009 59 839 94 97 1089
2010 126 876 626 100 1728
Table B5. Recreational landings and discards of Georges Bank haddock. There are none.
Groundfish Assessment Updates 2012 111 B- GB Haddock: Tables
Table B6. US commercial biological sampling by half-year period and by market category for Georges Bank haddock.
Year Period Market Landings
(kg) Length
SamplesSampled
FishAge
SamplesSampled
Fish Len.Samp/
LandingsAge.Samp/
Landings1989 1 Large 628399 6 620 6 303 1.0 0.5 2 Large 182561 1 99 1 38 0.5 0.2 1 Scrod 388134 6 338 6 256 0.9 0.7 2 Scrod 226427 9 491 9 259 2.2 1.11990 1 Large 792474 8 826 8 235 1.0 0.3 2 Large 302752 2 218 2 130 0.7 0.4 1 Scrod 743206 12 669 12 368 0.9 0.5 2 Scrod 154775 5 288 5 212 1.9 1.41991 1 Large 666397 2 206 2 81 0.3 0.1 2 Large 173355 4 338 4 118 1.9 0.7 1 Scrod 492017 6 359 6 181 0.7 0.4 2 Scrod 56409 1 62 1 42 1.1 0.71992 1 Large 1122592 14 1325 14 407 1.2 0.4 2 Large 157002 2 221 2 44 1.4 0.3 1 Scrod 663373 12 646 12 314 1.0 0.5 2 Scrod 59310 4 264 4 157 4.5 2.61993 1 Large 373746 4 407 4 143 1.1 0.4 2 Large 81512 2 145 2 74 1.8 0.9 1 Scrod 172013 9 488 9 267 2.8 1.6 2 Scrod 55997 2 100 2 49 1.8 0.91994 1 Large 51812 3 170 3 94 3.3 1.8 2 Large 54984 1 76 1 22 1.4 0.4 1 Scrod 37428 1 66 1 25 1.8 0.7 2 Scrod 60519 2 141 2 50 2.3 0.81995 1 Large 63716 1 104 1 22 1.6 0.3 2 Large 83844 1 81 1 26 1.0 0.3 1 Scrod 45166 1 57 1 15 1.3 0.3 2 Scrod 35270 1 49 1 21 1.4 0.61996 1 Large 226244 3 310 3 86 1.4 0.4 1 Scrod 90409 2 147 2 86 1.6 1.0 1 Large 170473 2 200 2 42 1.2 0.2 2 Large 467916 15 1473 15 306 3.1 0.71997 1 Scrod 61179 1 50 1 49 0.8 0.8 2 Scrod 161770 7 555 7 195 3.4 1.2 1 Large 777823 8 706 7 204 0.9 0.3 2 Large 735946 4 259 4 129 0.4 0.21998 1 Scrod 155305 7 345 8 209 2.2 1.3 2 Scrod 199221 3 137 3 80 0.7 0.4 1 Large 863663 8 712 8 190 0.8 0.2 2 Large 1148341 6 621 6 169 0.5 0.11999 1 Scrod 253496 2 183 2 39 0.7 0.2 2 Scrod 275861 13 761 13 230 2.8 0.8 1 Large 1538191 10 932 10 313 0.6 0.2 2 Large 857488 9 934 9 379 1.1 0.4

Groundfish Assessment Updates 2012 112 B- GB Haddock: Tables
Table B6 (cont.)
2000 1 Scrod 487740 10 507 10 201 1.0 0.4 2 Scrod 299435 14 826 14 283 2.8 0.9 1 Large 1850629 23 2145 23 753 1.2 0.4 2 Large 1063648 21 2144 21 707 2.0 0.72001 1 Scrod 856432 11 647 11 233 0.8 0.3 2 Scrod 935665 14 874 14 273 0.9 0.3 1 Large 2506455 11 932 11 362 0.4 0.1 2 Large 1615059 16 1657 16 493 1.0 0.32002 1 Scrod 1428733 7 409 7 169 0.3 0.1 2 Scrod 806907 9 573 9 197 0.7 0.2 1 Large 2255111 18 1846 17 517 0.8 0.2 2 Large 879281 21 2208 19 613 2.5 0.72003 1 Scrod 1683556 20 1220 19 384 0.7 0.2 2 Scrod 809636 13 765 12 204 0.9 0.3 1 Large 1639086 20 2216 19 545 1.4 0.3 2 Large 1085046 19 1918 16 353 1.8 0.32004 1 Scrod 2542608 16 1156 16 307 0.5 0.1 2 Scrod 1843139 23 1600 19 282 0.9 0.2 1 Large 1655434 21 1848 18 383 1.1 0.2 2 Large 1123669 32 2815 31 1072 2.5 1.02005 1 Scrod 2631612 20 1136 19 264 0.4 0.1 2 Scrod 1122887 25 1390 22 436 1.2 0.4 1 Large 557172 40 3306 36 1631 5.9 2.9 2 Large 482089 29 2432 28 1209 5.0 2.52006 1 Scrod 1119984 33 1607 32 773 1.4 0.7 2 Scrod 411924 30 1489 29 676 3.6 1.6 1 Large 557172 40 3306 36 1631 5.9 2.9 2 Large 482089 29 2432 28 1209 5.0 2.52007 1 Scrod 994414 29 1449 29 618 1.5 0.6
2 Scrod 1240913 40 1997 37 849 1.6 0.7
1 Large 327839 27 1873 27 1046 5.7 3.2
2 Large 336784 38 2671 35 1335 7.9 4.0
2008 1 Scrod 2541463 42 2049 42 981 0.8 0.4
2 Scrod 2190639 36 1876 35 862 0.9 0.4
1 Large 369581 47 3450 45 1653 9.3 4.5
2 Large 693611 32 2852 32 1456 4.1 2.1
2009 1 Scrod 2393773 44 2188 40 975 0.9 0.4
2 Scrod 2022335 46 2346 46 1085 1.2 0.5
1 Large 374001 30 2542 28 1169 6.8 3.1
2 Large 515613 31 2615 30 1283 5.1 2.5
2010 1 Scrod 4662461 68 3391 62 1550 0.7 0.3
2 Scrod 2445521 51 2659 47 1148 1.1 0.5
1 Large 1130560 56 5465 53 2611 4.8 2.3
2 Large 813924 46 4027 44 2042 4.9 2.5

Groundfish Assessment Updates 2012 113 B- GB Haddock: Tables
Table B7. Total landings at age (thousands) of Georges Bank haddock for years 1989-2010. Year 1 2 3 4 5 6 7 8 9 Total
1989 0 1322 97 997 215 466 60 36 56 3248
1990 2 11 1648 264 1119 153 217 55 49 3518
1991 6 464 120 2366 144 517 128 171 65 3981
1992 7 250 405 196 1952 181 426 47 100 3563
1993 7 295 376 338 118 739 63 169 82 2188
1994 1 247 793 162 61 55 140 30 40 1529
1995 2 70 592 459 57 28 7 58 15 1288
1996 1 39 550 899 435 65 22 7 73 2092
1997 3 92 219 695 534 207 17 16 43 1826
1998 1 185 455 527 738 555 167 23 44 2694
1999 1 36 884 536 602 562 382 160 46 3207
2000 0 391 608 1563 583 525 374 256 97 4395
2001 2 130 2319 969 1266 649 433 356 259 6382
2002 1 288 299 3137 915 1101 397 304 549 6992
2003 2 8 1849 446 2644 597 711 210 385 6851
2004 178 3 67 4677 671 2861 675 546 399 10077
2005 2 114 34 319 8373 763 1815 311 341 12072
2006 6 4 2205 43 341 5233 301 802 215 9150
2007 1 29 186 8350 158 191 1708 162 304 11089
2008 2 28 378 298 12491 112 106 912 226 14552
2009 12 117 188 860 283 12864 83 75 513 14994
2010 2 51 409 380 1432 443 13373 58 335 16483

Groundfish Assessment Updates 2012 114 B- GB Haddock: Tables
Table B8. Total discard at age (thousands) of Georges Bank haddock for years 1989-2010. Age Year 1 2 3 4 5 6 7 8 9 Total
1989 2 140 26 22 2 12 2 1 1 208
1990 61 1 49 5 5 1 1 0 0 123
1991 1 22 3 4 0 1 0 1 0 32
1992 77 15 3 1 8 0 0 0 0 104
1993 26 68 63 2 2 2 0 0 0 163
1994 26 291 399 80 81 18 173 25 70 1163
1995 15 24 22 12 2 1 2 3 1 82
1996 6 17 16 20 15 1 0 0 5 80
1997 12 51 54 50 27 11 1 2 6 214
1998 5 45 16 31 29 16 2 0 5 149
1999 2 7 22 5 4 4 2 3 2 51
2000 2 16 18 8 5 3 3 2 2 59
2001 12 15 74 27 15 7 5 3 3 161
2002 2 109 46 40 11 4 5 2 2 221
2003 3 10 94 15 42 8 8 2 4 186
2004 468 30 55 439 58 74 12 17 9 1162
2005 18 498 8 20 132 15 28 4 2 725
2006 158 14 959 28 34 185 26 40 13 1457
2007 19 151 45 1703 19 26 127 15 50 2156
2008 6 13 58 6 285 3 2 7 5 387
2009 6 16 12 25 3 99 1 1 2 165
2010 33 9 11 5 9 2 65 0 3 136
Groundfish Assessment Updates 2012 115 B- GB Haddock: Tables
Table B9. Total catch at age (thousands) for Georges Bank haddock, 1989-2010. Year 1 2 3 4 5 6 7 8 9+ Total
1989 2 1462 123 1019 217 478 62 37 57 3456
1990 63 12 1697 269 1124 154 218 55 49 3641
1991 7 486 123 2370 144 518 128 172 65 4013
1992 84 265 408 197 1960 181 426 47 100 3667
1993 33 363 439 340 120 741 63 169 82 2351
1994 27 538 1192 242 142 73 313 55 110 2692
1995 17 94 614 471 59 29 9 61 16 1370
1996 7 56 566 919 450 66 22 7 78 2172
1997 15 143 273 745 561 218 18 18 49 2040
1998 6 230 471 558 767 571 169 23 49 2843
1999 3 43 906 541 606 566 384 163 48 3258
2000 2 407 626 1571 588 528 377 258 99 4454
2001 14 145 2393 996 1281 656 438 359 262 6543
2002 3 397 345 3177 926 1105 402 306 551 7213
2003 5 18 1943 461 2686 605 719 212 389 7037
2004 646 33 122 5116 729 2935 687 563 408 11239
2005 20 612 42 339 8505 778 1843 315 343 12797
2006 164 18 3164 71 375 5418 327 842 228 10607
2007 19 181 232 10054 176 217 1835 177 353 13244
2008 8 41 436 304 12776 116 108 919 232 14939
2009 18 133 199 885 286 12962 84 76 515 15159
2010 35 60 420 384 1442 444 13438 58 338 16618

Groundfish Assessment Updates 2012 116 B- GB Haddock: Tables
Table B10. Weights at age for the catch and SSB for Georges Bank haddock.
Catch weights at age
Year 1 2 3 4 5 6 7 8 9+
1989 0.53 0.89 1.48 1.79 2.21 2.57 3.24 3.56 3.82
1990 0.64 0.97 1.48 1.78 2.12 2.55 2.81 2.99 4.16
1991 0.58 1.20 1.31 1.82 2.18 2.65 2.85 3.05 4.34
1992 0.54 1.18 1.64 1.77 2.19 2.52 2.97 3.37 4.27
1993 0.66 1.17 1.73 2.17 2.12 2.63 2.65 3.12 4.01
1994 0.45 1.09 1.64 2.21 2.63 2.73 2.90 3.78 4.55
1995 0.43 0.97 1.49 2.03 2.54 2.82 3.28 3.09 3.98
1996 0.46 1.10 1.50 1.84 2.33 2.54 3.42 3.52 3.71
1997 0.42 1.00 1.69 1.89 2.21 2.55 3.14 3.38 3.66
1998 0.51 0.97 1.49 1.92 2.33 2.69 3.03 3.04 4.07
1999 0.68 1.10 1.53 1.83 2.11 2.34 2.70 2.97 3.68
2000 0.66 1.13 1.46 1.89 2.25 2.37 2.73 2.99 3.30
2001 0.36 1.17 1.46 1.75 2.16 2.53 2.63 2.73 3.41
2002 0.31 0.91 1.34 1.74 1.95 2.47 3.13 3.07 3.34
2003 0.26 0.65 1.36 1.61 1.86 2.05 2.52 3.09 3.17
2004 0.21 0.39 1.00 1.50 1.67 1.95 2.07 2.47 2.91
2005 0.18 0.57 1.05 1.45 1.67 1.83 2.03 2.13 2.63
2006 0.19 0.48 0.95 1.06 1.61 1.78 1.89 2.06 2.31
2007 0.19 0.41 0.94 1.15 1.36 1.64 1.83 1.70 2.11
2008 0.36 0.75 1.00 1.22 1.37 1.58 1.70 1.94 2.14
2009 0.53 0.84 1.00 1.24 1.40 1.54 1.66 2.12 2.13
2010 0.23 0.71 1.06 1.22 1.36 1.51 1.60 1.73 2.19
SSB weights at age
1 2 3 4 5 6 7 8 9+
1989 0.39 0.61 1.20 1.55 1.93 2.30 2.82 3.25 3.82
1990 0.47 0.72 1.15 1.62 1.95 2.37 2.69 3.11 4.16
1991 0.41 0.88 1.13 1.64 1.97 2.37 2.70 2.93 4.34
1992 0.37 0.83 1.40 1.52 1.99 2.35 2.80 3.10 4.27
1993 0.51 0.79 1.42 1.89 1.94 2.40 2.58 3.04 4.01
1994 0.30 0.85 1.39 1.95 2.39 2.40 2.76 3.17 4.55
1995 0.27 0.66 1.28 1.82 2.37 2.72 2.99 3.00 3.98
1996 0.31 0.69 1.20 1.65 2.17 2.54 3.10 3.39 3.71
1997 0.27 0.67 1.36 1.68 2.02 2.43 2.83 3.40 3.66
1998 0.35 0.63 1.22 1.80 2.10 2.44 2.78 3.09 4.07
1999 0.52 0.75 1.22 1.65 2.01 2.34 2.69 3.00 3.68
2000 0.50 0.88 1.27 1.70 2.03 2.24 2.53 2.84 3.30
2001 0.22 0.88 1.29 1.60 2.02 2.39 2.50 2.73 3.41

Groundfish Assessment Updates 2012 117 B- GB Haddock: Tables
2002 0.21 0.57 1.25 1.59 1.85 2.31 2.81 2.84 3.34
2003 0.21 0.44 1.11 1.47 1.79 2.00 2.50 3.11 3.17
2004 0.13 0.32 0.80 1.43 1.64 1.90 2.06 2.49 2.91
2005 0.11 0.35 0.64 1.21 1.58 1.75 1.99 2.10 2.63
2006 0.13 0.29 0.73 1.06 1.53 1.72 1.86 2.05 2.31
2007 0.09 0.28 0.67 1.04 1.20 1.62 1.80 1.79 2.11
2008 0.24 0.37 0.64 1.07 1.25 1.47 1.67 1.88 2.14
2009 0.46 0.55 0.87 1.11 1.31 1.45 1.62 1.89 2.13
2010 0.08 0.61 0.95 1.11 1.30 1.45 1.57 1.70 2.19

Groundfish Assessment Updates 2012 118 B- GB Haddock: Tables
Table B11. Mean number/tow and mean kg/tow from the NEFSC spring (left) and fall (right) bottom trawl survey.
YEAR Mean
Num/tow CV %
Mean kg/tow
CV % YEAR
Mean Num/tow CV %
Mean kg/tow
CV %
1963 ‐‐‐ ‐‐‐ ‐‐‐ ‐‐‐ 1963 144.9 16 79.8 17
1964 ‐‐‐ ‐‐‐ ‐‐‐ ‐‐‐ 1964 193.2 19 96.6 18
1965 ‐‐‐ ‐‐‐ ‐‐‐ ‐‐‐ 1965 101.7 15 72.8 15
1966 ‐‐‐ ‐‐‐ ‐‐‐ ‐‐‐ 1966 34.0 19 30.4 19
1967 ‐‐‐ ‐‐‐ ‐‐‐ ‐‐‐ 1967 17.0 29 24.9 21
1968 13.6 27 20.6 22 1968 7.5 33 16.8 32
1969 7.2 25 16.9 29 1969 3.0 26 8.5 27
1970 5.9 55 17.1 69 1970 7.6 52 13.2 38
1971 2.9 28 5.0 24 1971 3.6 25 5.6 30
1972 6.5 40 7.5 20 1972 10.8 21 8.5 20
1973 37.5 69 15.4 34 1973 14.8 35 9.8 27
1974 19.0 36 17.7 34 1974 3.8 26 4.0 27
1975 6.2 41 8.2 43 1975 29.9 25 15.1 52
1976 83.2 48 15.7 33 1976 70.8 48 35.8 43
1977 36.9 38 26.6 36 1977 23.2 33 27.6 34
1978 19.4 28 31.3 28 1978 25.1 21 18.1 19
1979 49.7 28 20.3 19 1979 52.2 57 32.1 46
1980 59.8 37 53.8 35 1980 30.4 22 22.0 22
1981 31.2 23 38.1 23 1981 13.4 31 14.3 21
1982 8.9 22 13.1 20 1982 5.4 32 7.3 22
1983 5.6 18 13.2 26 1983 8.0 38 5.8 23
1984 6.3 29 7.4 26 1984 5.4 39 4.5 30
1985 8.9 34 11.1 32 1985 13.2 33 3.7 18
1986 5.9 23 5.9 27 1986 6.8 45 5.0 26
1987 5.0 53 5.6 49 1987 3.6 38 2.6 42
1988 3.4 20 3.4 17 1988 5.3 24 5.3 27
1989 5.3 26 4.7 20 1989 4.3 33 4.5 33
1990 7.7 51 7.6 36 1990 2.9 30 2.6 35
1991 4.0 44 4.4 42 1991 2.9 38 0.9 23
1992 1.2 26 1.4 28 1992 5.9 37 3.2 35
1993 2.7 29 2.5 44 1993 8.0 40 4.3 38
1994 4.9 64 3.6 63 1994 3.5 39 2.9 45
1995 5.6 45 5.7 44 1995 17.1 39 10.7 37
1996 23.4 73 25.7 70 1996 4.4 23 4.1 36
1997 12.9 68 18.5 79 1997 6.1 57 6.5 42
1998 7.3 44 6.1 40 1998 10.8 22 5.8 26
1999 16.6 45 7.7 43 1999 23.1 43 33.1 46

Groundfish Assessment Updates 2012 119 B- GB Haddock: Tables
2000 14.3 49 17.9 62 2000 18.0 40 15.4 45
2001 14.9 23 6.1 30 2001 22.7 35 20.0 43
2002 32.2 36 22.3 32 2002 42.1 35 36.3 34
2003 14.8 37 15.6 38 2003 169.5 30 23.0 37
2004 140.5 63 41.4 30 2004 187.0 36 55.8 29
2005 59.8 34 17.7 24 2005 90.5 23 39.4 24
2006 37.3 29 17.3 28 2006 57.0 25 37.4 26
2007 57.3 34 34.6 36 2007 53.9 45 43.9 45
2008 27.7 45 23.8 53 2008 16.0 36 18.0 37
2009 19.1 23 28.5 24 2009 30.7 28 34.2 31
2010 25.0 19 41.9 21 2010 130.3 44 19.9 21
2011 65.2 31 20.4 20

Groundfish Assessment Updates 2012 120 B- GB Haddock: Tables
Table B12. Minimum swept area abundance indices at age for NEFSC spring survey.
Age 1 Age 2 Age 3 Age 4 Age 5 Age 6 Age 7 Age 8
1968 1298 9185 1493 2272 21811 5453 811 1461
1969 0 227 1883 811 1363 13729 3343 909
1970 2175 811 0 1071 1493 1493 6491 3181
1971 0 3765 811 0 389 389 292 2661
1972 13048 292 1980 389 97 130 422 97
1973 99579 15709 0 1753 292 0 584 32
1974 6913 43136 9283 0 779 0 32 325
1975 3051 3148 10776 2045 0 422 292 32
1976 262221 974 1947 2986 1396 0 130 0
1977 1980 108439 1363 3960 1947 1461 0 130
1978 227 3148 51704 1168 3051 2661 519 195
1979 117235 5128 3668 18533 1071 519 1201 195
1980 16878 151575 1655 3376 15807 2175 1201 1493
1981 10711 10678 63259 7108 2467 5777 779 357
1982 2467 4966 3051 13210 1363 909 1980 0
1983 1396 1785 1883 714 7822 32 130 3765
1984 6784 3830 2077 2045 1883 2337 227 130
1985 0 16099 2467 1298 2824 1104 3797 325
1986 8082 584 6686 779 357 682 389 1071
1987 0 11749 195 2629 260 325 162 714
1988 5031 130 3213 422 1039 389 357 389
1989 65 11328 1461 2304 454 1331 195 162
1990 2791 0 18565 1071 1883 195 422 0
1991 1753 3473 779 6005 292 325 65 130
1992 1298 584 357 227 1071 97 97 97
1993 3797 2110 584 454 389 1201 195 65
1994 2269 8708 3254 481 330 214 503 49
1995 1627 4172 7528 2969 536 370 93 578
1996 3525 14908 28744 16894 8497 1133 237 243
1997 5826 3319 10885 11871 6522 2887 409 228
1998 2673 9582 4049 3437 2773 696 196 18
1999 33135 6581 6950 2328 2085 1646 663 652
2000 5937 7692 13322 6521 3604 3591 3292 1543
2001 32502 2789 7910 2707 977 682 374 265
2002 593 62469 21807 10459 3546 1548 1969 552
2003 32 811 17689 3927 15742 3116 3700 2791
2004 363974 6005 3895 29406 7076 8666 1396 3116
2005 2597 173126 519 1233 10873 1461 3278 617
2006 6532 1850 93249 1644 2058 12006 1684 1537
2007 2813 22645 5946 146829 1139 829 4489 367

Groundfish Assessment Updates 2012 121 B- GB Haddock: Tables
2008 5956 2817 8334 895 65429 1385 478 3342
2009 4863 3591 2757 8761 1357 37154 993 633
2010 1309 1180 5915 3262 10623 1299 55782 0
2011 185638 2371 1590 1612 1259 2185 696 15799

Groundfish Assessment Updates 2012 122 B- GB Haddock: Tables
Table B13. Minimum swept area abundance indices at age for NEFSC fall survey.
Year Age 1 Age 2 Age 3 Age 4 Age 5 Age 6
1964 272418 82407 29936 22101 27082 19296
1965 7689 366336 206889 18909 5803 12380
1966 1064 32982 251188 31483 3482 2612
1967 19925 3095 9382 59678 10881 1693
1968 97 21811 1161 3240 21956 5271
1969 290 193 3095 435 1064 12526
1970 1257 97 0 919 435 532
1971 145 13396 677 48 919 871
1972 7883 0 1016 242 48 725
1973 21908 8173 0 1693 290 0
1974 10494 29210 5223 0 629 145
1975 2418 5755 3192 1016 0 48
1976 76217 2031 2321 15766 2998 0
1977 14025 208291 1693 1741 2660 967
1978 436 6941 60803 1824 1864 2062
1979 42915 2737 3371 30104 595 833
1980 4284 147902 119 2935 12375 833
1981 37917 8805 41289 1467 595 5513
1982 1229 19911 6743 12018 674 1349
1983 4401 0 4304 1112 4546 435
1984 18812 774 677 871 967 3047
1985 97 10785 2853 774 919 193
1986 36839 2110 4966 714 162 325
1987 0 16586 292 3927 195 422
1988 5842 0 2564 325 2499 195
1989 227 9802 584 4219 389 1298
1990 1517 160 8783 639 2156 293
1991 2502 2182 80 3859 160 559
1992 7000 665 772 160 719 53
1993 9250 6751 747 779 0 1525
1994 4924 13121 6521 985 0 186
1995 2955 2506 2622 2166 402 147
1996 7377 23168 15917 7519 1222 39
1997 4256 1765 3005 3370 1583 463
1998 1049 8003 4762 2431 1777 1056
1999 14008 9050 8028 2348 1338 571
2000 5922 2728 10934 26130 11429 7536
2001 13433 9161 17791 10077 3562 2143
2002 2774 28471 5459 24147 6877 3774
2003 377 6203 72276 17673 27709 6075
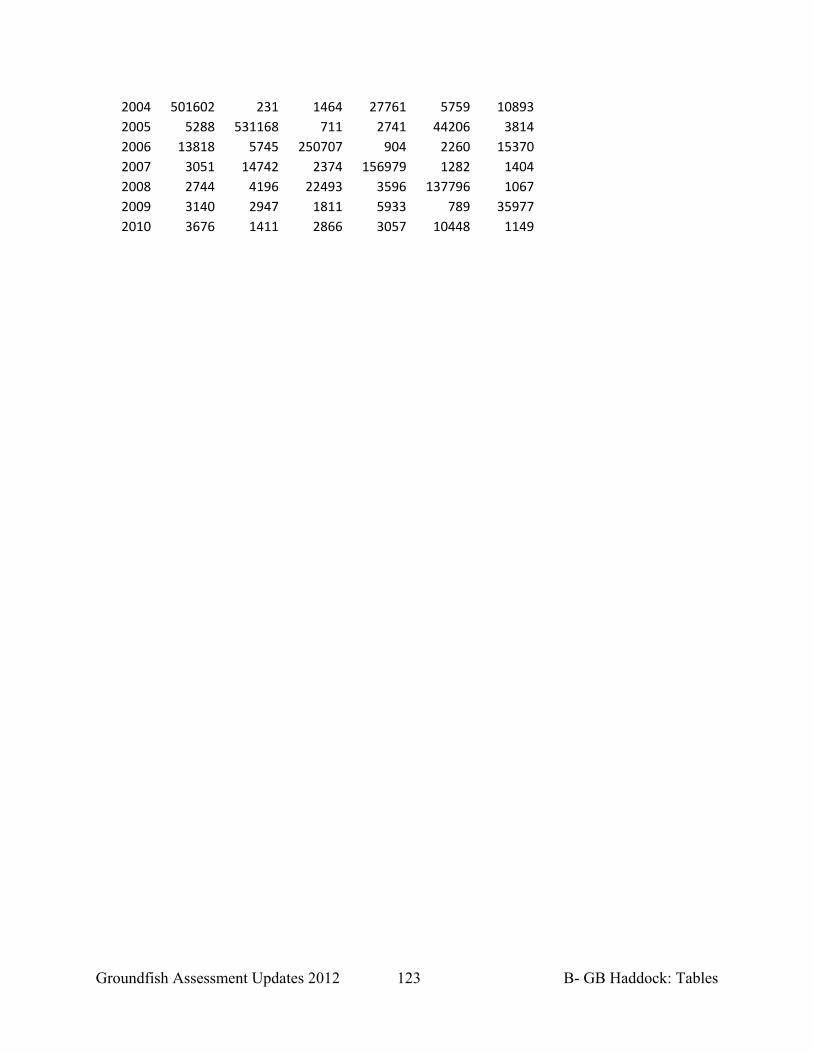
Groundfish Assessment Updates 2012 123 B- GB Haddock: Tables
2004 501602 231 1464 27761 5759 10893
2005 5288 531168 711 2741 44206 3814
2006 13818 5745 250707 904 2260 15370
2007 3051 14742 2374 156979 1282 1404
2008 2744 4196 22493 3596 137796 1067
2009 3140 2947 1811 5933 789 35977
2010 3676 1411 2866 3057 10448 1149

Groundfish Assessment Updates 2012 124 B- GB Haddock: Tables
Table B14. Minimum swept area abundance indices at age for DFO spring survey.
Year Age 1 Age 2 Age 3 Age 4 Age 5 Age 6 Age 7 Age 8
1986 5714 310 8515 1506 267 408 479 521
1987 42 4278 971 3533 943 113 422 141
1988 2069 70 12005 239 4011 253 239 155
1989 42 7515 1013 2984 267 591 42 42
1990 1309 155 13891 183 4729 324 1534 183
1991 1056 2350 197 12652 155 2252 127 619
1992 4644 4152 1590 239 5376 42 1492 56
1993 5573 3040 774 633 56 1801 28 450
1994 4673 16213 5742 591 338 28 985 14
1995 2730 3687 6052 3124 788 42 0 676
1996 8599 4067 6812 7093 4110 366 338 56
1997 2449 1633 1393 3293 3336 2393 324 127
1998 3392 11512 4335 3617 5292 5165 2787 338
1999 27796 4799 10077 3110 1970 1900 1773 464
2000 25797 96547 13117 12540 2970 2181 2730 1604
2001 31357 3983 15312 4349 5813 1816 1618 1984
2002 2787 44614 9359 21617 6080 7487 2238 1858
2003 1922 3582 97567 7229 18640 4133 3779 1697
2004 207872 580 2807 55692 5541 10384 1739 1023
2005 0 0 0 0 0 0 0 0
2006 0 0 0 0 0 0 0 0
2007 4215 15001 4419 80460 1121 178 4177 299
2008 3923 1248 4813 5204 109124 1009 195 8595
2009 2466 4439 2981 7907 891 49461 696 140
2010 7002 1078 4770 3913 10468 2852 66009 490
2011 315264 2127 1708 3104 1332 2987 735 29975

Groundfish Assessment Updates 2012 125 B- GB Haddock: Tables
Table B15. Calibration factors at length applied to 2009 and 2010 NEFSC surveys. Length (cm) Estimate CV
1‐18 2.626169 0.070962
19 2.580551 0.069482
20 2.534933 0.067956
21 2.489315 0.066384
22 2.443697 0.064765
23 2.398079 0.063096
24 2.352461 0.061376
25 2.306843 0.059606
26 2.261226 0.057785
27 2.215608 0.055912
28 2.16999 0.053989
29 2.124372 0.052019
30 2.078754 0.050004
31 2.033136 0.047951
32 1.987518 0.045868
33 1.9419 0.043767
34 1.896282 0.041668
35 1.850664 0.039594
36 1.805047 0.037583
37 1.759429 0.035684
38 1.713811 0.033963
39 1.668193 0.032508
40 1.622575 0.031427
41 1.576957 0.030848
42 1.531339 0.030902
43 1.485721 0.031704
44 1.440103 0.033337
45 1.394485 0.035839
46 1.348868 0.039209
47 1.30325 0.043428
48 1.257632 0.048471
49 1.212014 0.054326
50 1.166396 0.060995
>=51 1.16399 0.06137

Groundfish Assessment Updates 2012 126 B- GB Haddock: Tables
Table B16. Estimates of spawning stock biomass (SSB) and January 1 biomass.
Year SSB January 1 Biomass
1960 137525 261928 1961 171975 266177 1962 179431 246772 1963 163737 290348 1964 167402 447882 1965 217565 427380 1966 186839 265251 1967 106435 137889 1968 71846 91654 1969 47766 57663 1970 34913 43090 1971 24771 31422 1972 23222 30466 1973 15889 29102 1974 29695 44728 1975 22061 32703 1976 28598 68128 1977 49855 94994 1978 76793 99301 1979 72409 116118 1980 71227 115195 1981 61538 79618 1982 49505 59318 1983 38684 45588 1984 26978 35613 1985 20041 27942 1986 21010 30619 1987 20829 28831 1988 19764 29506
1989 20525 28873 1990 24361 30422 1991 22019 27778 1992 16501 24534 1993 14836 28319 1994 20257 33497 1995 26749 37379 1996 35643 46797 1997 43585 57313 1998 50807 67047

Groundfish Assessment Updates 2012 127 B- GB Haddock: Tables
1999 59528 94876 2000 73600 105017 2001 87872 122822 2002 100258 134118 2003 119310 136169
2004 108126 170384 2005 126290 202093 2006 225173 262027 2007 252065 275473 2008 238744 260918 2009 210557 232338 2010 167279 185601 2011 301991.05

Groundfish Assessment Updates 2012 128 B- GB Haddock: Tables
Table B17. Estimated number at age for Georges Bank haddock for ages 1-9+.
Year 1 2 3 4 5 6 7 8 9+
1960 122245 106224 34088 21407 13203 10239 3725 1965 1685
1961 54312 99853 72550 22399 13424 8053 6770 2342 3182
1962 39050 44411 72117 45973 14561 8367 4925 4403 3337
1963 188241 31905 32344 44439 28253 8822 4974 2627 3994
1964 460816 151491 22475 19812 26363 15773 5242 2811 3642
1965 32513 368163 109665 14304 11929 13764 7724 2428 3032
1966 4155 18003 188650 49979 6915 5833 5300 2959 2023
1967 14013 3299 8612 64678 23760 3185 2461 2256 1717
1968 542 10436 2549 4459 34417 10213 1525 1126 2094
1969 1111 437 5856 1451 1934 15196 5225 652 1653
1970 4616 908 348 3271 786 997 7112 2866 1782
1971 267 3737 601 270 2165 476 624 3753 2371
1972 8526 217 1828 292 185 1512 171 256 4801
1973 19498 6836 176 1083 165 122 1127 68 2036
1974 10577 13615 3701 141 535 87 73 852 4002
1975 7930 8617 7129 2417 114 372 69 57 1276
1976 105348 6313 6091 4105 1630 90 266 53 1495
1977 13983 86117 4726 4473 2540 1132 73 196 558
1978 6125 11447 52655 3698 3041 1610 602 56 270
1979 83888 5014 8680 30082 2751 1975 851 367 176
1980 10934 68674 4081 5539 18124 1775 1245 412 218
1981 7364 8945 28384 3027 3653 9382 918 529 315
1982 2581 6028 5744 13325 1727 2143 5355 453 470
1983 3284 2112 3879 3226 7533 1060 1240 3370 320
1984 18080 2688 1534 2438 2015 4138 621 846 1720
1985 2518 14801 2116 986 1335 1288 2044 296 577
1986 16786 2061 9900 1227 628 670 844 1190 268
1987 2614 13738 1638 5549 801 381 391 555 706
1988 19995 2140 9414 1223 3066 544 245 239 395
1989 1364 16366 1704 5517 877 1656 308 150 230
1990 3406 1115 12081 1285 3600 523 927 197 174
1991 2716 2732 902 8362 810 1939 290 563 213
1992 10741 2217 1799 628 4719 533 1123 123 263
1993 15568 8718 1576 1107 337 2110 274 538 261
1994 15420 12716 6810 896 601 169 1063 168 334
1995 12687 12601 9926 4503 517 364 72 589 156
1996 11778 10372 10232 7572 3262 370 271 52 586
1997 23451 9637 8441 7866 5372 2265 244 202 537
1998 14637 19187 7760 6664 5768 3892 1658 184 382
1999 49156 11979 15501 5929 4953 4032 2673 1205 352

Groundfish Assessment Updates 2012 129 B- GB Haddock: Tables
2000 11668 40242 9768 11874 4366 3510 2791 1843 703
2001 90866 9551 32580 7433 8306 3045 2398 1946 1422
2002 5551 74382 7689 24515 5188 5647 1903 1570 2824
2003 2870 4542 60540 5983 17209 3414 3629 1197 2192
2004 412375 2345 3703 47812 4483 11670 2251 2324 1685
2005 7985 337041 1890 2922 34534 3014 6917 1227 1336
2006 28833 6520 275392 1510 2086 20631 1769 4008 1084
2007 7123 23458 5322 222615 1172 1371 12024 1154 2296
2008 9365 5814 19042 4148 173187 801 927 8192 2065
2009 4773 7660 4723 15197 3122 130269 552 661 4480
2010 7605 3891 6152 3687 11644 2298 94968 376 2206
2011 748016 6195 3132 4658 2672 8234 1481 65649 300
Groundfish Assessment Updates 2012 130 B- GB Haddock: Tables
Table B18. Estimated fishing mortality at age, F on fully selected fish (Full F) and the average F on ages 5-7 (F5-7). Year 1 2 3 4 5 6 7 8 9+ Full F F5‐7
1960 0.00 0.18 0.22 0.27 0.29 0.21 0.26 0.26 0.26 0.29 0.26
1961 0.00 0.13 0.26 0.23 0.27 0.29 0.23 0.26 0.26 0.29 0.26
1962 0.00 0.12 0.28 0.29 0.30 0.32 0.43 0.35 0.35 0.43 0.35
1963 0.02 0.15 0.29 0.32 0.38 0.32 0.37 0.36 0.36 0.38 0.36
1964 0.02 0.12 0.25 0.31 0.45 0.51 0.57 0.51 0.51 0.57 0.51
1965 0.39 0.47 0.59 0.53 0.52 0.75 0.76 0.68 0.68 0.76 0.68
1966 0.03 0.54 0.87 0.54 0.58 0.66 0.65 0.63 0.63 0.87 0.63
1967 0.09 0.06 0.46 0.43 0.64 0.54 0.58 0.59 0.59 0.64 0.59
1968 0.02 0.38 0.36 0.64 0.62 0.47 0.65 0.58 0.58 0.65 0.58
1969 0.00 0.03 0.38 0.41 0.46 0.56 0.40 0.47 0.47 0.56 0.47
1970 0.01 0.21 0.05 0.21 0.30 0.27 0.44 0.34 0.34 0.44 0.34
1971 0.00 0.51 0.52 0.18 0.16 0.83 0.69 0.56 0.56 0.83 0.56
1972 0.02 0.01 0.32 0.37 0.22 0.09 0.71 0.34 0.34 0.71 0.34
1973 0.16 0.41 0.02 0.51 0.44 0.32 0.08 0.28 0.28 0.51 0.28
1974 0.00 0.45 0.23 0.02 0.16 0.03 0.03 0.07 0.07 0.45 0.07
1975 0.03 0.15 0.35 0.19 0.04 0.14 0.07 0.08 0.08 0.35 0.08
1976 0.00 0.09 0.11 0.28 0.16 0.00 0.10 0.09 0.09 0.28 0.09
1977 0.00 0.29 0.05 0.19 0.26 0.43 0.06 0.25 0.25 0.43 0.25
1978 0.00 0.08 0.36 0.10 0.23 0.44 0.29 0.32 0.32 0.44 0.32
1979 0.00 0.01 0.25 0.31 0.24 0.26 0.53 0.34 0.34 0.53 0.34
1980 0.00 0.68 0.10 0.22 0.46 0.46 0.66 0.52 0.52 0.68 0.52
1981 0.00 0.24 0.56 0.36 0.33 0.36 0.51 0.40 0.40 0.56 0.40
1982 0.00 0.24 0.38 0.37 0.29 0.35 0.26 0.30 0.30 0.38 0.30
1983 0.00 0.12 0.26 0.27 0.40 0.33 0.18 0.31 0.31 0.40 0.31
1984 0.00 0.04 0.24 0.40 0.25 0.51 0.54 0.43 0.43 0.54 0.43
1985 0.00 0.20 0.35 0.25 0.49 0.22 0.34 0.35 0.35 0.49 0.35
1986 0.00 0.03 0.38 0.23 0.30 0.34 0.22 0.29 0.29 0.38 0.29
1987 0.00 0.18 0.09 0.39 0.19 0.24 0.29 0.24 0.24 0.39 0.24
1988 0.00 0.03 0.33 0.13 0.42 0.37 0.29 0.36 0.36 0.42 0.36
1989 0.00 0.10 0.08 0.23 0.32 0.38 0.25 0.32 0.32 0.38 0.32
1990 0.02 0.01 0.17 0.26 0.42 0.39 0.30 0.37 0.37 0.42 0.37
1991 0.00 0.22 0.16 0.37 0.22 0.35 0.66 0.41 0.41 0.66 0.41
1992 0.01 0.14 0.29 0.42 0.60 0.47 0.54 0.54 0.54 0.60 0.54
1993 0.00 0.05 0.36 0.41 0.49 0.49 0.29 0.42 0.42 0.49 0.42
1994 0.00 0.05 0.21 0.35 0.30 0.64 0.39 0.45 0.45 0.64 0.45
1995 0.00 0.01 0.07 0.12 0.13 0.09 0.14 0.12 0.12 0.14 0.12
1996 0.00 0.01 0.06 0.14 0.16 0.22 0.09 0.16 0.16 0.22 0.16
1997 0.00 0.02 0.04 0.11 0.12 0.11 0.08 0.11 0.11 0.12 0.11
1998 0.00 0.01 0.07 0.10 0.16 0.18 0.12 0.15 0.15 0.18 0.15

Groundfish Assessment Updates 2012 131 B- GB Haddock: Tables
1999 0.00 0.00 0.07 0.11 0.14 0.17 0.17 0.16 0.16 0.17 0.16
2000 0.00 0.01 0.07 0.16 0.16 0.18 0.16 0.17 0.17 0.18 0.17
2001 0.00 0.02 0.08 0.16 0.19 0.27 0.22 0.23 0.23 0.27 0.23
2002 0.00 0.01 0.05 0.15 0.22 0.24 0.26 0.24 0.24 0.26 0.24
2003 0.00 0.00 0.04 0.09 0.19 0.22 0.25 0.22 0.22 0.25 0.22
2004 0.00 0.02 0.04 0.13 0.20 0.32 0.41 0.31 0.31 0.41 0.31
2005 0.00 0.00 0.02 0.14 0.32 0.33 0.35 0.33 0.33 0.35 0.33
2006 0.01 0.00 0.01 0.05 0.22 0.34 0.23 0.26 0.26 0.34 0.26
2007 0.00 0.01 0.05 0.05 0.18 0.19 0.18 0.19 0.19 0.19 0.19
2008 0.00 0.01 0.03 0.08 0.08 0.17 0.14 0.13 0.13 0.17 0.13
2009 0.00 0.02 0.05 0.07 0.11 0.12 0.18 0.14 0.14 0.18 0.14
2010 0.01 0.02 0.08 0.12 0.15 0.24 0.17 0.18 0.18 0.24 0.18
Groundfish Assessment Updates 2012 132 B- GB Haddock: Tables
Table B19. Estimates of catchability for indices used in the model. NEFSC_S41 is the NEFSC spring index for years 1973-1981, which was treated as a separate index. Index Estimate CV
NEFSC_Spring_1 0.32 0.19
NEFSC_Spring_2 0.55 0.13
NEFSC_Spring_3 0.64 0.13
NEFSC_Spring_4 0.58 0.09
NEFSC_Spring_5 0.64 0.11
NEFSC_Spring_6 0.53 0.15
NEFSC_Spring_7 0.56 0.14
NEFSC_Spring_8 0.62 0.16
NEFSC_S41_1 0.72 0.51
NEFSC_S41_2 0.90 0.35
NEFSC_S41_3 0.78 0.31
NEFSC_S41_4 0.84 0.22
NEFSC_S41_5 0.89 0.16
NEFSC_S41_6 0.88 0.28
NEFSC_S41_7 0.91 0.26
NEFSC_S41_8 0.86 0.32
NEFSC_Fall_1 0.44 0.13
NEFSC_Fall_2 0.68 0.14
NEFSC_Fall_3 0.58 0.12
NEFSC_Fall_4 0.66 0.09
NEFSC_Fall_5 0.58 0.10
NEFSC_Fall_6 0.57 0.11
DFO_Spring_1 0.32 0.21
DFO_Spring_2 0.40 0.18
DFO_Spring_3 0.66 0.11
DFO_Spring_4 0.64 0.12
DFO_Spring_5 0.69 0.13
DFO_Spring_6 0.53 0.17
DFO_Spring_7 0.70 0.16
DFO_Spring_8 0.61 0.15

Groundfish Assessment Updates 2012 133 B- GB Haddock: Tables
Table B20. Input and output for the yield per recruit analysis.
2012 update
Age Stock
wt Catch
wt SSB wt Selectivity M Maturity
1 0.20 0.30 0.20 0.02 0.20 0.06
2 0.42 0.64 0.42 0.06 0.20 0.47
3 0.77 0.99 0.77 0.22 0.20 0.92
4 1.08 1.18 1.08 0.38 0.20 0.99
5 1.32 1.42 1.32 0.71 0.20 1.00
6 1.54 1.61 1.54 1.00 0.20 1.00
7 1.70 1.73 1.70 1.00 0.20 1.00
8 1.86 1.91 1.86 1.00 0.20 1.00
9+ 2.17 2.17 2.17 1.00 0.20 1.00
F YPR SSB/R
F40% 0.39 0.49 2.21
GARM‐III
Age Stock
wt Catch
wt SSB wt Selectivity M Maturity
1 0.11 0.20 0.11 0.01 0.20 0.06
2 0.36 0.59 0.36 0.03 0.20 0.47
3 0.80 1.09 0.80 0.15 0.20 0.92
4 1.25 1.38 1.25 0.40 0.20 0.99
5 1.56 1.66 1.56 1.00 0.20 1.00
6 1.82 1.89 1.82 1.00 0.20 1.00
7 2.05 2.09 2.05 1.00 0.20 1.00
8 2.34 2.35 2.34 1.00 0.20 1.00
9+ 2.64 2.64 2.64 1.00 0.20 1.00
F YPR SSB/R
F40% 0.35 0.57 2.60

Groundfish Assessment Updates 2012 134 B- GB Haddock: Tables
Table B21. Updated reference point estimates compared to GARM-III estimates for Georges Bank haddock. SSBmsy and MSY are in thousands of metric tons; recruitment is in millions of age-1 fish.
2012 update Median 5th 95th
SSBmsy 124.9 71.8 187.8
MSY 28 16.3 41.9
Recruitment 54.2 4 130
GARM‐III Median 5th 95th
SSBmsy 158,873
96,350
229,744
MSY 32,746
19,538
48,865
Recruitment 59 4 130
Groundfish Assessment Updates 2012 135 B- GB Haddock: Tables
Table B22. Short term projections at FMSY for Georges Bank haddock. Catch in 2011 was assumed to be the same as catch in 2010.
No down weighting applied to age‐1 recruits in 2011
Catch (000 mt) SSB (mt)
Year 5% Median 95% Year 5% Median 95%
2011 25.9 25.9 25.9 2011 188.3 313.4 665.8
2012 29.9 45.6 68.2 2012 203.8 400.7 1014.7
2013 31.2 58.9 146.3 2013 206.8 492.3 1371.3
2014 31.0 72.4 200.1 2014 209.2 510.8 1427.4
2015 37.1 98.3 285.0 2015 202.3 466.4 1254.7
Age‐1 recruits decreased by 50% in 2011
Catch (000 mt) SSB (mt)
Year 5% Median 95% Year 5% Median 95%
2011 25.9 25.9 25.9 2011 104.7 147.5 201.6
2012 27.6 40.7 59.4 2012 108.8 172.6 309.0
2013 24.7 40.9 84.2 2013 116.2 238.3 619.9
2014 23.0 44.2 108.7 2014 116.6 256.7 675.4
2015 25.5 56.6 150.2 2015 114.5 240.2 589.2
Groundfish Assessment Updates 2012 136 B- GB Haddock: Tables
Table B23. Influence of 2010 year class on short term projections for Georges Bank haddock.
No down weighting of age‐1 fish in 2011
Proportion of CAA Year 1 2 3 4 5 6 7 8 9
2011 0.17 0.00 0.01 0.02 0.02 0.09 0.01 0.65 0.02
2012 0.01 0.45 0.01 0.01 0.03 0.02 0.05 0.01 0.41
2013 0.01 0.02 0.78 0.01 0.01 0.01 0.01 0.02 0.14
2014 0.01 0.02 0.05 0.83 0.01 0.01 0.01 0.00 0.07
2015 0.00 0.01 0.04 0.05 0.85 0.01 0.00 0.00 0.04
Proportion of CAA in biomass
Year 1 2 3 4 5 6 7 8 9
2011 0.03 0.00 0.01 0.02 0.02 0.09 0.02 0.79 0.02
2012 0.00 0.21 0.01 0.01 0.03 0.02 0.06 0.01 0.65
2013 0.00 0.01 0.66 0.01 0.01 0.02 0.01 0.03 0.26
2014 0.00 0.01 0.04 0.79 0.01 0.01 0.01 0.00 0.13
2015 0.00 0.01 0.03 0.04 0.86 0.01 0.00 0.00 0.05
Age‐1 recruits decreased by 50% in 2011
Proportion of CAA Year 1 2 3 4 5 6 7 8 9
2011 0.09 0.00 0.01 0.02 0.02 0.10 0.02 0.71 0.02
2012 0.02 0.29 0.02 0.01 0.03 0.02 0.06 0.01 0.53
2013 0.01 0.03 0.64 0.02 0.01 0.02 0.01 0.03 0.23
2014 0.01 0.03 0.08 0.72 0.02 0.01 0.01 0.00 0.13
2015 0.01 0.02 0.07 0.08 0.74 0.01 0.00 0.00 0.06
Proportion of CAA in biomass
Year 1 2 3 4 5 6 7 8 9
2011 0.02 0.00 0.01 0.02 0.02 0.10 0.02 0.80 0.02
2012 0.00 0.12 0.01 0.01 0.03 0.02 0.07 0.01 0.72
2013 0.00 0.02 0.49 0.01 0.01 0.03 0.01 0.04 0.38
2014 0.00 0.01 0.06 0.66 0.02 0.01 0.01 0.01 0.21
2015 0.00 0.01 0.05 0.07 0.75 0.01 0.00 0.01 0.09

Groundfish Assessment Updates 2012 137 B- GB Haddock: Figures
Figure B1. Catch of Georges Bank haddock by country; (a) in mt; (b) as a proportion. (a)
(b)

Groundfish Assessment Updates 2012 138 B- GB Haddock: Figures
Figure B2a. Bubble plots of landings at age for Georges Bank haddock, plotted as proportion within year.
Groundfish Assessment Updates 2012 139 B- GB Haddock: Figures
Figure B2b. Bubble plots of discards at age for Georges Bank haddock, plotted as proportion within year.
Groundfish Assessment Updates 2012 140 B- GB Haddock: Figures
Figure B2c. Bubble plots of catch at age for Georges Bank haddock, plotted as proportion within year.

Groundfish Assessment Updates 2012 141 B- GB Haddock: Figures
Figure B3a. Normalized weight at age trends for catch for Georges Bank haddock.
Groundfish Assessment Updates 2012 142 B- GB Haddock: Figures
Figure B3b. Normalized weight at age trends for SSB for Georges Bank haddock.
Groundfish Assessment Updates 2012 143 B- GB Haddock: Figures
Figure B4a. NEFSC Spring and Fall mean number per tow.

Groundfish Assessment Updates 2012 144 B- GB Haddock: Figures
Figure B4b. NEFSC Spring and Fall mean kg per tow.
Groundfish Assessment Updates 2012 145 B- GB Haddock: Figures
Figure B5a. Bubble plots of abundance at age in the NEFSC spring survey, plotted as proportion in each year. The orange bubbles are the years when the Yankee 41 was used and were treated as a separate series in the VPA

Groundfish Assessment Updates 2012 146 B- GB Haddock: Figures
Figure B5b. Bubble plots of abundance at age in the NEFSC fall survey, plotted as proportion in each year.

Groundfish Assessment Updates 2012 147 B- GB Haddock: Figures
Figure B5c. Bubble plots of abundance at age in the DFO spring survey, plotted as proportion in each year.
Groundfish Assessment Updates 2012 148 B- GB Haddock: Figures
Figure B6. Maturity at age in Georges Bank haddock.
Groundfish Assessment Updates 2012 149 B- GB Haddock: Figures
Figure B7. Spawning stock biomass (SSB) for Georges Bank haddock.

Groundfish Assessment Updates 2012 150 B- GB Haddock: Figures
Figure B8. Recruitment of age-1 fish for Georges Bank haddock.

Groundfish Assessment Updates 2012 151 B- GB Haddock: Figures
Figure B9. Fishing mortality for Georges Bank haddock, expressed as the F on fully selected fish (“F Full”) and the average F on ages 5-7 (“F5-7”).

Groundfish Assessment Updates 2012 152 B- GB Haddock: Figures
Figure B10. Estimated catchabilities for each index in the Georges Bank haddock assessment. See Table B19 for name of each index.

Groundfish Assessment Updates 2012 153 B- GB Haddock: Figures
Figure B11. Standardized residuals for the indices in the Georges Bank haddock assessment.
Groundfish Assessment Updates 2012 154 B- GB Haddock: Figures
Fig. B11 (cont)
Groundfish Assessment Updates 2012 155 B- GB Haddock: Figures
Fig. B11 (cont.)
Groundfish Assessment Updates 2012 156 B- GB Haddock: Figures
Fig. B11 (cont.)
Groundfish Assessment Updates 2012 157 B- GB Haddock: Figures
Fig. B11 (cont.)
Groundfish Assessment Updates 2012 158 B- GB Haddock: Figures
Figure B12a. Mohn’s rho for spawning stock biomass (expressed on relative scale).

Groundfish Assessment Updates 2012 159 B- GB Haddock: Figures
Figure B12b. Mohn’s rho for F (expressed on relative scale).

Groundfish Assessment Updates 2012 160 B- GB Haddock: Figures
Figure B12c. Mohn’s rho for recruitment (expressed on relative scale).
Groundfish Assessment Updates 2012 161 B- GB Haddock: Figures
Figure B13a. Retrospective estimates of q for the NEFSC spring survey (top) and for the years 1973-1981 when the Yankee 41 was used.

Groundfish Assessment Updates 2012 162 B- GB Haddock: Figures
Figure B13b. Retrospective estimates of q for the NEFSC fall survey (top) and for the DFO spring survey (bottom).

Groundfish Assessment Updates 2012 163 B- GB Haddock: Figures
Figure B14. Mean selectivity at age vector used in YPR analysis. The mean of years 2006-2010 is plotted.
Groundfish Assessment Updates 2012 164 B- GB Haddock: Figures
Figure B15. Mean weight at age vectors (catch and ssb) used in yield per recruit analysis. The mean of years 2006-2010 is plotted.
Groundfish Assessment Updates 2012 165 B- GB Haddock: Figures
Figure B16. Overlay of age-1 recruitment (bars) and SSB (solid line) for Georges Bank haddock.
Groundfish Assessment Updates 2012 166 B- GB Haddock: Figures
Figure B17a. Projections assuming a catch in 2011 of 25,903 mt, and fishing at F=0.39 in years 2012-2015. On the left, no adjustment is made to the uncertain 2010 year class. On the right, that year class is decreased by 50% before making the projections.
Groundfish Assessment Updates 2012 167 B- GB Haddock: Figures
Figure B17b. Projected spawning stock biomass, assuming a catch in 2011 of 25,903 mt, and fishing at F=0.39 in years 2012-2015. On the left, no adjustment is made to the uncertain 2010 year class. On the right, that year class is decreased by 50% before making the projections.

Groundfish Assessment Updates 2012 168 B- GB Haddock: Figures
Figure B18. Relative change in estimated year class strength between the first estimate with one year of data (on the horizontal line y=1), and subsequent model runs with additional years of data.

Groundfish Assessment Updates 2012 169 B- GB Haddock: Figures
Figure B19. Stock status for Georges Bank haddock. The base model with 90% confidence interval is plotted as well as a point (blue square) demonstrating the effect of the calculated Mohn’s rho statistic on stock status.
0
1
2
0 0.5 1 1.5 2
F/F
msy
B/Bmsy
Georges Bank Haddock
Bmsy
1/2 Bmsy
Fmsy
Base (Final)
Rho. Adj

Groundfish Assessment Updates 2012 170 B- GB Haddock: Appendix
GB haddock Appendix : Panel Requests related to projections, and dependency on the uncertain incoming 2010 year class, which was estimated to be nearly 750 million age-1 fish (CV=84%). Appendix Table B1. Initial estimates of incoming year classes (thousands) with only 1 year of data (spring surveys only) and subsequent estimates of year class size as additional years of data are added.
Yearclass Number of years data 1998 1999 2000 2001 2002 2003 2004 2005 2006 2007 2008 2009 2010
1
108,072 NA NA NA NA NA NA NA NA NA NA NA NA
2
70,808
44,253 NA NA NA NA NA NA NA NA NA NA NA
3
37,900
17,310
104,255 NA NA NA NA NA NA NA NA NA NA
4
41,384
20,317
91,788
4,274 NA NA NA NA NA NA NA NA NA
5
48,811
19,462
87,321
4,787
849 NA NA NA NA NA NA NA NA
6
56,414
21,811
103,281
6,136
1,798
1,008,802 NA NA NA NA NA NA NA
7
53,136
20,343
93,972
5,568
1,365
811,522
8,664 NA NA NA NA NA NA
8
50,515
20,140
100,401
6,017
1,684
677,830
7,678
21,766 NA NA NA NA NA
9
51,342
15,991
91,319
5,523
2,045
572,982
9,303
35,825
12,077 NA NA NA NA
10
50,319
11,970
97,522
5,646
2,912
493,885
8,251
26,402
7,416
16,325 NA NA NA
11
49,884
12,062
94,638
5,498
3,396
457,050
7,466
28,530
7,224
11,218
11,516 NA NA
12
50,467
12,259
95,391
5,821
3,403
420,443
7,544
29,111
7,582
10,515
6,084
9,787 NA
13
49,157
11,668
90,867
5,551
2,870
412,386
7,986
28,833
7,123
9,365
4,773
7,605
748,020

Groundfish Assessment Updates 2012 171 B- GB Haddock: Appendix
Appendix Table B2. Relative adjustment between initial estimates of incoming year classes with only 1 year of data (spring surveys only) and subsequent estimates of year class size as additional years of data are added.
Yearclass
Number of years data 1998 1999 2000 2001 2002 2003 2004 2005 2006 2007 2008 2009 2010
1
1.00 NA NA NA NA NA NA NA NA NA NA NA NA
2
0.66
1.00 NA NA NA NA NA NA NA NA NA NA NA
3
0.35
0.39
1.00 NA NA NA NA NA NA NA NA NA NA
4
0.38
0.46
0.88
1.00 NA NA NA NA NA NA NA NA NA
5
0.45
0.44
0.84
1.12
1.00 NA NA NA NA NA NA NA NA
6
0.52
0.49
0.99
1.44
2.12
1.00 NA NA NA NA NA NA NA
7
0.49
0.46
0.90
1.30
1.61
0.80
1.00 NA NA NA NA NA NA
8
0.47
0.46
0.96
1.41
1.98
0.67
0.89
1.00 NA NA NA NA NA
9
0.48
0.36
0.88
1.29
2.41
0.57
1.07
1.65
1.00 NA NA NA NA
10
0.47
0.27
0.94
1.32
3.43
0.49
0.95
1.21
0.61
1.00 NA NA NA
11
0.46
0.27
0.91
1.29
4.00
0.45
0.86
1.31
0.60
0.69
1.00 NA NA
12
0.47
0.28
0.91
1.36
4.01
0.42
0.87
1.34
0.63
0.64
0.53
1.00 NA
13
0.45
0.26
0.87
1.30
3.38
0.41
0.92
1.32
0.59
0.57
0.41
0.78
1.00
Groundfish Assessment Updates 2012 172 B- GB Haddock: Appendix
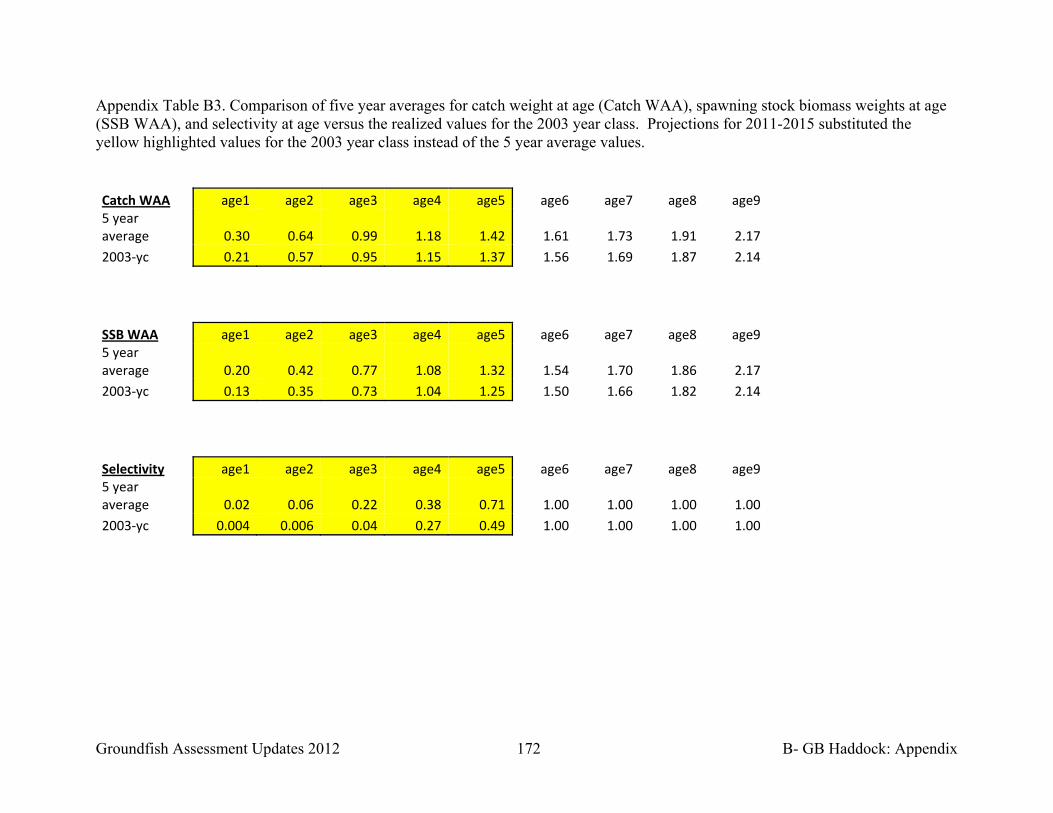
Appendix Table B3. Comparison of five year averages for catch weight at age (Catch WAA), spawning stock biomass weights at age (SSB WAA), and selectivity at age versus the realized values for the 2003 year class. Projections for 2011-2015 substituted the yellow highlighted values for the 2003 year class instead of the 5 year average values. Catch WAA age1 age2 age3 age4 age5 age6 age7 age8 age95 year average 0.30 0.64 0.99 1.18 1.42 1.61 1.73 1.91 2.17
2003‐yc 0.21 0.57 0.95 1.15 1.37 1.56 1.69 1.87 2.14
SSB WAA age1 age2 age3 age4 age5 age6 age7 age8 age95 year average 0.20 0.42 0.77 1.08 1.32 1.54 1.70 1.86 2.17
2003‐yc 0.13 0.35 0.73 1.04 1.25 1.50 1.66 1.82 2.14
Selectivity age1 age2 age3 age4 age5 age6 age7 age8 age95 year average 0.02 0.06 0.22 0.38 0.71 1.00 1.00 1.00 1.00
2003‐yc 0.004 0.006 0.04 0.27 0.49 1.00 1.00 1.00 1.00

Groundfish Assessment Updates 2012 173 B- GB Haddock: Appendix
Appendix Table B4. Short term catch (000s mt) projections for Georges Bank haddock. The base run, using the estimated size of 2010 year class with no adjustment is compared with three sensitivities: i) the magnitude of the 2010 year class is multiplied by 0.41; ii) in addition to (i), the estimated weights at age for the 2003 year class were used for the 2010 year class; iii) in addition to (i) and (ii), the estimated selectivities for the 2003 year class were used for the 2010 year class.
CATCH (000s mt)
No Adjustment
Year 1% 5% 10% 25% 50% 75% 90% 95% 99%
2011 25.9 25.9 25.9 25.9 25.9 25.9 25.9 25.9 25.9
2012 25.5 29.9 33.0 38.8 45.6 54.3 63.8 68.2 85.5
2013 25.3 31.2 34.4 44.8 58.9 84.5 116.4 146.3 238.9
2014 23.3 31.0 36.3 49.5 72.4 109.4 156.3 200.1 340.6
2015 26.4 37.1 45.0 63.7 98.3 152.2 220.7 285.0 493.2
Rescale by 59%
Year 1% 5% 10% 25% 50% 75% 90% 95% 99%
2011 25.9 25.9 25.9 25.9 25.9 25.9 25.9 25.9 25.9
2012 23.0 27.2 29.5 34.4 40.0 46.7 53.1 57.5 64.1
2013 19.5 23.3 25.9 30.9 37.8 48.8 61.6 72.9 112.8
2014 17.3 21.4 23.9 30.0 39.3 55.0 74.7 92.0 151.7
2015 18.0 23.3 27.0 35.2 49.2 71.6 100.2 126.0 212.5
Rescale by 59%, use 2003 WAA
Year 1% 5% 10% 25% 50% 75% 90% 95% 99%
2011 25.9 25.9 25.9 25.9 25.9 25.9 25.9 25.9 25.9
2012 22.7 26.8 29.1 34.0 39.5 46.2 52.5 57.0 63.2
2013 19.3 23.1 25.7 30.5 37.2 47.8 60.1 70.8 109.5
2014 17.3 21.2 23.7 29.7 38.7 54.1 73.3 90.2 148.2
2015 17.8 22.9 26.4 34.4 48.0 69.6 97.2 122.2 205.2
Rescale by 59%, use 2003 WAA and selectivity
2011 25.9 25.9 25.9 25.9 25.9 25.9 25.9 25.9 25.9
2012 20.1 24.2 26.6 30.4 36.1 42.2 48.1 51.9 58.7
2013 15.0 17.5 19.0 21.8 25.2 29.3 33.2 36.1 41.3
2014 16.1 19.6 21.8 26.6 33.8 46.0 61.0 74.0 119.1
2015 16.7 21.2 24.3 31.1 42.4 60.4 83.5 104.0 172.6

Groundfish Assessment Updates 2012 174 B- GB Haddock: Appendix
Appendix Table B5. Short term SSB (000s mt) projections for Georges Bank haddock. The base run, using the estimated size of 2010 year class with no adjustment is compared with three sensitivities: i) the magnitude of the 2010 year class is multiplied by 0.41; ii) in addition to (i), the estimated weights at age for the 2003 year class were used for the 2010 year class; iii) in addition to (i) and (ii), the estimated selectivities for the 2003 year class were used for the 2010 year class.
SSB (000s mt)
No Adjustment
Year 1% 5% 10% 25% 50% 75% 90% 95% 99%
2011 96.0 109.6 117.9 134.6 153.6 176.0 196.5 211.6 231.0
2012 106.9 131.4 144.6 179.9 228.4 311.8 412.2 499.4 801.9
2013 118.2 160.9 192.6 269.8 404.4 622.6 895.5 1153.5 1969.0
2014 120.7 169.0 204.5 288.6 442.5 683.7 989.7 1276.2 2215.2
2015 116.7 161.5 193.4 265.3 394.6 598.0 856.0 1093.7 1879.6
Rescale by 59%
Year 1% 5% 10% 25% 50% 75% 90% 95% 99%
2011 90.4 104.3 113.2 127.8 146.3 167.9 188.9 200.1 222.9
2012 87.1 104.6 114.4 135.3 162.7 199.6 243.2 274.7 391.5
2013 85.7 107.5 120.4 155.7 208.8 300.4 416.4 521.8 870.6
2014 81.5 106.6 123.5 161.2 223.7 324.2 452.9 567.1 956.3
2015 79.2 105.2 122.3 157.8 212.7 296.9 405.8 498.6 822.3
Rescale by 59%, use 2003 WAA
Year 1% 5% 10% 25% 50% 75% 90% 95% 99%
2011 89.0 103.5 111.9 125.9 144.6 165.8 186.0 197.7 221.6
2012 84.6 100.8 109.5 129.2 153.7 187.4 223.6 246.8 337.0
2013 84.4 105.2 117.5 151.4 201.6 288.6 398.7 498.0 826.3
2014 81.0 104.6 121.4 158.1 218.2 315.6 439.3 550.0 921.5
2015 77.7 102.7 119.3 153.7 206.1 286.5 388.9 477.8 779.9
Rescale by 59%, use 2003 WAA and selectivity
2011 88.9 103.5 111.8 125.9 144.6 165.7 186.0 197.6 221.5
2012 84.5 100.9 109.6 129.3 153.8 187.7 224.1 247.4 338.1
2013 85.4 107.0 119.6 154.6 206.8 297.1 412.1 515.6 855.7
2014 84.5 109.8 127.7 167.5 234.3 341.9 480.0 603.7 1015.4
2015 83.0 110.0 128.2 166.1 226.7 320.9 441.2 546.7 904.7

Groundfish Assessment Updates 2012 175 B- GB Haddock: Appendix
Appendix Figure B1. Comparison of 5-year average catch weight at age (solid grey) and realized catch weight at age (ages 1-5) for 2003 year class.

Groundfish Assessment Updates 2012 176 B- GB Haddock: Appendix
Appendix Figure B2. Comparison of 5-year average SSB weight at age (solid grey) and realized SSB weight at age (ages 1-5) for 2003 year class.
Groundfish Assessment Updates 2012 177 B- GB Haddock: Appendix
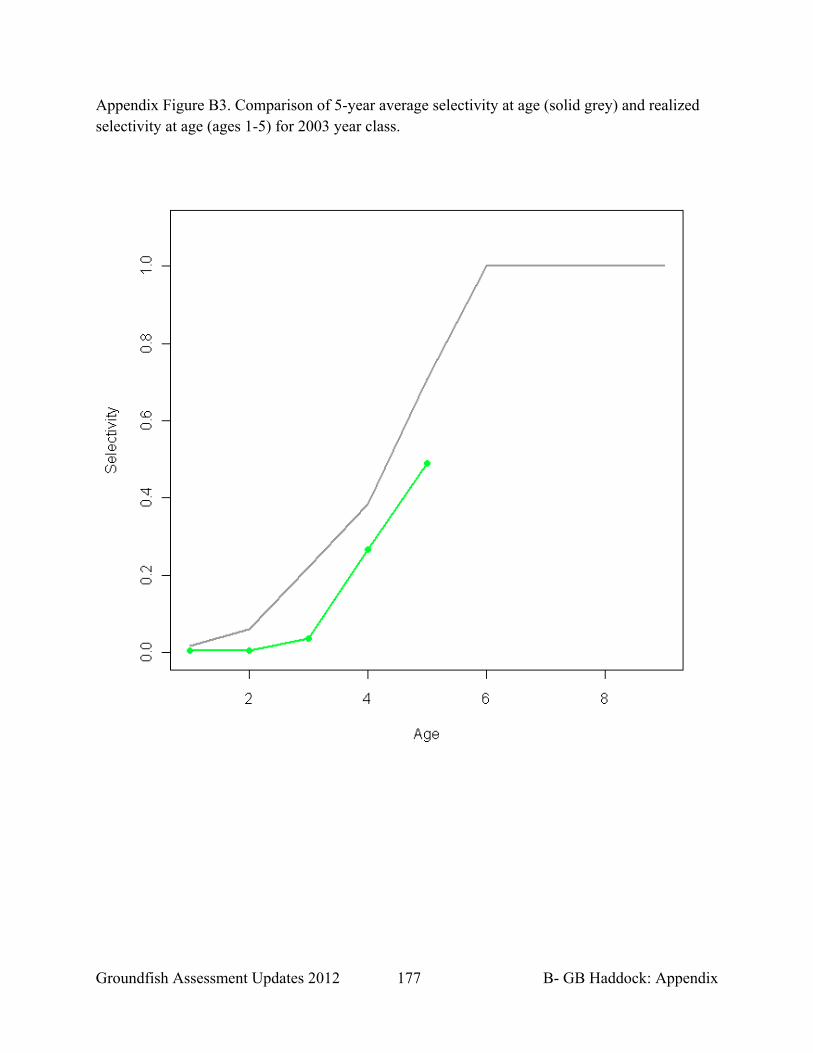
Appendix Figure B3. Comparison of 5-year average selectivity at age (solid grey) and realized selectivity at age (ages 1-5) for 2003 year class.
Groundfish Assessment Updates 2012 178 B- GB Haddock: Appendix
Appendix Figure B4. Influence on catch advice of different adjustments to 2010 year class in short-term projections.

Groundfish Assessment Updates 2012 179 B- GB Haddock: Appendix
Appendix Figure B5. Influence on ssb of different adjustments to 2010 year class in short-term projections.