axiom h2 - amazon s3h2+overview.pdf · 700 – axiom – h2 overview– rev 7 - 03 aug 2017 4/35...
TRANSCRIPT

700 – Axiom - H1 Overview– Rev 2 - 03 Aug 2017
AXIOM H2 Smart Datalogger for Extreme Environments
Overview and Quick Start Guide
1.800.548.4264 | www.ftsinc.com
700-Axiom – H2 Overview Rev. 7 03 Aug 2017
EXTREME ENVIRONMENTS. EXTREMELY RELIABLE.

Contact Information
Canadian Headquarters:
1065 Henry Eng Place
Victoria, BC | V9B 6B2 | Canada
www.ftsinc.com
Toll-free: 1.800.548.4264
Local: 250.478.5561
Technical support portal: http://support.ftsinc.com
Email: [email protected]

The Axiom Suite of Manuals
Axiom (F6/H2/H2) Overview Description, Quick Start Guide, General Operating Instructions, Specifications
Axiom Operator’s Manual Detailed description of all functions of 7 home screen icons. Brief description of Telemetry (8th icon). Covers Sensor Extensions and sensor mapping.
Axiom Telemetry Reference Detailed description of the Telemetry functions including message formatting.
Axiom Field Reference and Guide A field reference with the most common features used on site visits.
Axiom Installation and Maintenance Guide
Installation and maintenance details.
i
Table of Contents
Table of Contents ...................................................................................................................... i
Chapter 1 Description ............................................................................................................. 1
1.1 General ............................................................................................................................ 1
1.2 Power connections ......................................................................................................... 2
1.2.1 Solar panel .............................................................................................................................................................................2
1.2.2 Battery .....................................................................................................................................................................................3
1.3 Sensor inputs .................................................................................................................. 3
1.3.1 Dedicated rain sensor .......................................................................................................................................................3
1.3.2 SDI ports .................................................................................................................................................................................3
1.3.3 Internal sensors ...................................................................................................................................................................4
1.4 Telemetry panel .............................................................................................................. 5
1.4.1 Telemetry options ..............................................................................................................................................................5
1.5 User interface .................................................................................................................. 7
1.5.1 Touchscreen .........................................................................................................................................................................7
1.5.2 USB ports ................................................................................................................................................................................7
1.5.3 GUI Home screen ................................................................................................................................................................7
Chapter 2 Quick start guide ................................................................................................. 10
2.1 Configuring the Datalogger........................................................................................ 10
2.1.1 Load and Modify an existing Configuration/Template File ............................................................................ 10
2.1.2 Configure dedicated and internal sensors ............................................................................................................. 11
2.1.3 Configure mathematical calculations and program scripts ............................................................................ 11
2.1.4 Log Data .............................................................................................................................................................................. 11
2.1.5 Display or Configure Telemetry port settings ...................................................................................................... 12
2.1.6 Confirm Station Operation ........................................................................................................................................... 12
2.1.7 Save Configuration to USB ........................................................................................................................................... 12
2.1.8 Graph and View Data ..................................................................................................................................................... 13
2.1.9 Export Data to USB .......................................................................................................................................................... 13
Chapter 3 Operating Instructions ........................................................................................ 14
3.1 General ......................................................................................................................... 14
3.1.1 Mouse and keyboard connection ............................................................................................................................. 14
3.1.2 Password protection ...................................................................................................................................................... 14
3.1.3 Datalogger time ............................................................................................................................................................... 15
3.1.4 Using template and configuration files .................................................................................................................. 15
3.1.5 USB connection to a PC ................................................................................................................................................. 15
3.1.6 Touchscreen considerations ....................................................................................................................................... 17
3.1.7 Telemetry connection to a PC .................................................................................................................................... 17
ii
3.2 USB memory stick information ................................................................................... 18
3.2.1 Requirements .................................................................................................................................................................... 18
3.2.2 File structure ...................................................................................................................................................................... 19
3.3 Datalogger status ........................................................................................................ 20
3.3.1 Home screen status indicators ................................................................................................................................... 20
3.3.2 Data point values ............................................................................................................................................................. 21
3.3.3 Audit log .............................................................................................................................................................................. 22
3.4 Data status ................................................................................................................... 22
3.4.1 Data storage information ............................................................................................................................................. 22
3.4.2 Data viewing ...................................................................................................................................................................... 23
3.4.3 Data operations ................................................................................................................................................................ 23
3.4.4 Remote Datalogger communication ....................................................................................................................... 24
3.5 Telemetry Devices ....................................................................................................... 24
Chapter 4 Specifications....................................................................................................... 28
4.1 Datalogger ................................................................................................................... 28
4.1.1 General ................................................................................................................................................................................. 28
4.1.2 User interface .................................................................................................................................................................... 29
4.1.3 Connectors ......................................................................................................................................................................... 29
4.2 Internal G6 transmitter (OPTIONAL) .......................................................................... 34
4.2.1 Transmission data rates ................................................................................................................................................. 34
4.2.2 Output .................................................................................................................................................................................. 34
4.2.3 Frequency range .............................................................................................................................................................. 34
4.2.4 Frequency stability .......................................................................................................................................................... 34
4.2.5 Channel bandwidth ........................................................................................................................................................ 34
4.2.6 Time keeping ..................................................................................................................................................................... 34
4.2.7 GPS ........................................................................................................................................................................................ 34
Revision History ..................................................................................................................... 35

700 – Axiom – H2 Overview– Rev 7 - 03 Aug 2017 1/35
Chapter 1 Description _________________________________________________________________________________
1.1 General
The FTS Axiom H2 Datalogger is a robust weatherproof Datalogger with a built-in power management
system, support for a variety of sensors and telemetry devices, an industrial grade colour touchscreen
display, and standard USB ports.
The Axiom H2 employs the FTS Quick Touch System™ which combines a graphical user interface (GUI)
with a colour touchscreen display and USB ports for easy operation. On-site data retrieval, Datalogger
parameter optimization, and performance information are simple and intuitive.
The Datalogger can store multiple Datalogger configurations as well as several years of typical
environmental data. Data in the Axiom H2 is stored in a circular buffer in non-volatile memory with
time tags on each record. The time tags have a resolution of one second and correctly account for leap
years. Non-volatile memory ensures that data is preserved through power cycles and the circular buffer
ensures that the oldest data is overwritten by the newest data when the memory fills.
The Datalogger is watertight, even without connectors attached. Device connectors (sensors and
telemetry) are circular metal shell, bayonet, military style connectors which are uniquely keyed and
colour coded to minimize erroneous connections. The Datalogger supports SDI-12 sensors as well as a
FTS Rain Gauge.
The built-in power management system integrates a SOLAR PANEL input and a BATTERY input to
provide a method of regulating and maintaining the optimal battery charge condition.
Support for two independent telemetry devices is standard with each Datalogger. The Axiom H2
Datalogger can be ordered with two external telemetry ports (model Axiom H2-TLM-2) or with an
internal FTS G6 transmitter with one external telemetry port (model Axiom H2-G6-TLM). The Axiom H2
automatically synchronizes with UTC time if an FTS G6 transmitter is connected either externally or
internally to the Datalogger. The Datalogger can be set to any time zone offset.
Figure 1 identifies the components of the Axiom H2 Datalogger front panel. The front panel is divided
into four functional locks:
Power Connections SOLAR PANEL and BATTERY inputs
Sensor Inputs colour coded sensor inputs
Telemetry Panel dual TELEMETRY or internal G6 with single TELEMETRY
User Interface touchscreen, stylus, and USB ports

700 – Axiom – H2 Overview– Rev 7 - 03 Aug 2017 2/35
Figure 1: Axiom H2 Datalogger front panel
1.2 Power connections
Power connections for the Axiom H2 Datalogger comprise the SOLAR PANEL input and the BATTERY input.
The BATTERY input is the power source for the Datalogger while the SOLAR PANEL input is used by the
internal power management system to charge the 12-volt battery.
1.2.1 Solar panel
The SOLAR PANEL input is colour coded on the Datalogger front panel with a black ring around the
connector. The connector is a three terminal, pin (male), bayonet, military style connector which can
accept a solar panel array up to a maximum of 100 Watts. The SOLAR PANEL input has an internal
blocking diode to prevent battery voltage from running back through the power management system
and discharging through the solar panel at night.
SENSORINPUTS
POWERCONNECTIONS
GROUND
RAIN
SDI DSDI B BATTERY
SDI CSDI A SOLAR PANEL
USB DEVICE
TELEMETRY
GOESGPS
USB
TELEMETRYPANEL
H2DATALOGGER
USERINTERFACE

700 – Axiom – H2 Overview– Rev 7 - 03 Aug 2017 3/35
Normally solar panels are provided by FTS with the appropriate mating connector; however, if required,
details for the solar panel connection can be found in the Specifications section of this manual.
1.2.1.1 Solar charge operation
The SOLAR PANEL input provides power directly to the battery charge control circuits. This allows the
internal power management system to begin to charge the battery attached to the BATTERY input even
when there is not enough battery capacity to run the Datalogger (i.e. a completely discharged battery).
In addition, once the Datalogger is powered, battery charging is temperature compensated for optimal
battery charging.
1.2.2 Battery
The BATTERY connector is colour coded on the Datalogger front panel with a black ring around the
connector. The connector is a seven terminal, pin (male), bayonet, military style connector which is
designed to connect to a 12 V, absorbed glass mat, deep cycle battery. The cable connection to the
battery includes the main battery connection as well as voltage sensing leads and a temperature
sensing element. This set of connections enables the Datalogger’s power management system to
optimize battery charging as it is able to accurately measure the battery voltage and to temperature
compensate the battery charging algorithm.
Details of the battery connection can be found in the Specifications section of this manual.
1.3 Sensor inputs
The Axiom H2 Datalogger has a dedicated rain sensor port, four independent SDI-121 connection ports,
as well as several internal sensors.
1.3.1 Dedicated rain sensor
The RAIN input is colour coded on the Datalogger front panel with a blue ring around the connector.
The connector is a three terminal, socket (female), bayonet, military style connector which is compatible
with tipping bucket rain gauge sensors.
Rain sensing on the Axiom H2 Datalogger is accomplished by counting the number of tips of a
calibrated tipper bucket and then converting the number of tips to a specific rainfall amount.
Normally Rain Gauges are provided by FTS with the appropriate mating connector. Details for the RAIN
input connection can be found in the Specifications section of this manual.
1.3.2 SDI ports
The Axiom H2 Datalogger has four fully independent front panel SDI-12 ports (SDI A, SDI B, SDI C, and
SDI D). The SDI ports are special dedicated sensor connectors as the SDI-12 is a multi-drop interface
(more than one sensor can be connected to a single SDI bus). Four independent SDI ports allow sensors
which require a long time to return data to be placed on a separate bus from quicker SDI sensors.
1 SDI-12 is a serial digital interface standard for microprocessor based sensors (for more information, see http://www.sdi-12.org.)

700 – Axiom – H2 Overview– Rev 7 - 03 Aug 2017 4/35
Multiple ports also offer protection against a damaged sensor disrupting communications to all SDI
sensors as the sensors can be split between two buses.
The Axiom H2 is the master all four SDI ports and fully supports the SDI protocol (currently version 1.3).
SDI-12 ports are colour coded on the Datalogger front panel with an orange ring around the connector.
The connector is a three terminal, socket (female), bayonet, military style connector which is compatible
with all SDI-12 sensors with mating military connectors.
Normally SDI sensors are provided by FTS with the appropriate mating connector. Details for the SDI
port connections can be found in the Specifications section of this manual.
1.3.3 Internal sensors
Internal sensors are sensors which are inside the Datalogger case (internal to the Datalogger). The
purpose of these sensors is to provide the user additional station operating information.
1.3.3.1 Battery
The internal battery sensor measures parameters of the Datalogger’s front panel BATTERY input. The
battery sensor can be configured to measure battery voltage, current, and temperature.
1.3.3.1.1 Battery voltage
Battery voltage is measured in Volts.
1.3.3.1.2 Battery current
Battery current is measured in Amps. A negative reading indicates current is being pulled from the
battery (i.e. the battery is being discharged). A positive reading indicates current is being supplied to
the battery (i.e. the battery is being charged from the solar panel).
1.3.3.1.3 Battery temperature
Battery temperature can be measured in Celsius or Fahrenheit.
1.3.3.2 Solar panel
The internal solar panel sensor measures parameters of the Datalogger’s front panel SOLAR PANEL input.
This sensor can be configured to measure solar panel voltage and current.
1.3.3.2.1 Solar panel voltage
Solar panel voltage is measured in Volts.
1.3.3.2.2 Solar panel current
Solar panel current, the current supplied by the solar panel to charge the battery, is measured in Amps.
1.3.3.3 Case temperature
The case temperature sensor measures the temperature internal to the Axiom H2 Datalogger. Case
temperature can be reported in Celsius or Fahrenheit.

700 – Axiom – H2 Overview– Rev 7 - 03 Aug 2017 5/35
1.3.3.4 Location
Three internal location measurements are available in the Datalogger. Elevation, latitude, longitude are
automatically populated if there is a G6 transmitter connected to the Datalogger (obtained from the
GPS). If the Datalogger is using telemetry other than an FTS G6 transmitter, these three values can be
manually entered through the user interface (on the Site tab of the Station screen).
1.3.3.4.1 Elevation
Elevation is the distance above sea level. Elevation can be reported in metres, feet, or inches.
1.3.3.4.2 Latitude and longitude
Latitude and Longitude are automatically reported if there is an FTS G6 transmitter connected with a
GPS fix or they can be manually entered in degrees-minutes-seconds (dms) format on the Datalogger
touchscreen. However; when these parameters are logged, they are stored in decimal format.
1.3.3.5 Telemetry specific
Additional internal sensors may be available to the user depending on the telemetry device attached to
the Datalogger (e.g., Forward Power if a G6 transmitter is used as a telemetry device). Refer to the
Telemetry Reference manual appropriate to your Telemetry device.
1.4 Telemetry panel
The telemetry panel on the Axiom H2 Datalogger allows for factory configuration for the telemetry
device connections. The Axiom H2 supports the connection of two telemetry devices. The devices can
both be external to the Datalogger (dual external telemetry panel, Axiom Datalogger model number:
H2-TLM-2) or one device can be externally connected and a G6 transmitter can be internal to the Axiom
H2 (single external telemetry panel with built-in G6, Axiom Datalogger model number: H2-G6-TLM)..
External TELEMETRY connectors on the Axiom H2 Datalogger are colour coded on the telemetry panel
with a green ring around the connector. The connector is an eight terminal, pin (male), bayonet, military
style connector which is compatible with existing FTS telemetry devices.
Normally telemetry devices are provided by FTS with the appropriate mating connector. Details for the
TELEMETRY connector can be found in the Specifications section of this manual.
1.4.1 Telemetry options
Figure 2 and Figure 3 illustrate the two telemetry panel options which can be selected at the time of
order.
1.4.1.1 Dual external telemetry
The top connector on the dual external telemetry panel is defined as Telemetry Port A. The lower
connector is defined as Telemetry Port B. Both connections are functionally identical.

700 – Axiom – H2 Overview– Rev 7 - 03 Aug 2017 6/35
Figure 2: Dual External Telemetry Panel
1.4.1.2 Internal G6 transmitter with external telemetry
This telemetry panel option has the upper telemetry port replaced with two RF connectors: an N-type
connector and an SMA connector. The N-type connector is used for the internal FTS G6 transmit
antenna connection while the SMA connector is the FTS GOES transmitter’s GPS connection. The
internal FTS G6 transmitter is defined as Telemetry Port A while the lower telemetry connector remains
defined as Telemetry Port B.
Figure 3: Internal FTS G6 Transmitter with Single External Telemetry Panel

700 – Axiom – H2 Overview– Rev 7 - 03 Aug 2017 7/35
1.4.1.2.1 GPS connection
The GPS connector on the telemetry panel shown in Figure 3 is used by the internal FTS G6 transmitter.
The FTS G6 transmitter uses the GPS signal to synchronize its clock to UTC time. The Axiom H2
Datalogger is in turn synchronized with UTC time from the FTS G6 transmitter and can be set to any
time zone offset. The Axiom H2 Datalogger also obtains position information (latitude, longitude, and
elevation) from the FTS G6 transmitter
1.5 User interface
The Datalogger’s user interface incorporates an industrial grade colour touchscreen with a GUI
(graphical user interface) application, and standard USB connectors. This eliminates the need for a
personal computer during site visits or when configuring the Datalogger.
1.5.1 Touchscreen
The display used in the Axiom H2 Datalogger is a high visibility, industrial grade, 3.5” colour LCD
module with quarter VGA resolution and a built-in touch panel. The display is backlit and is bright and
clear even in direct sunlight. A tethered stylus is supplied with each Datalogger for use with the
touchscreen although most icons are large enough to be operated with a bare finger.
1.5.1.1 Backlight
The touchscreen’s backlight turns on when the touchscreen is touched and automatically turns off after
10 minutes of non-use (no touches on the touchscreen).
1.5.2 USB ports
Two styles of USB ports are present on the Datalogger. The USB DEVICE port is used to connect the
Datalogger to a PC while the dual USB HOST port is used to connect USB accessories (mouse, keyboard,
memory stick, etc.) to the Datalogger. Both USB port types (USB HOST and USB DEVICE) support USB Basic-
Speed data transfer (low speed of 1.5 Mb/s, and full speed of 12 Mb/s).
1.5.3 GUI Home screen
The Home screen (Figure 4) is the top-most screen in the graphical user interface (GUI), and is the screen
which appears when the Datalogger has completed powering up. Information on the current state of
the Datalogger is provided through the Home screen status indicators. From the Home screen the user
can navigate to the desired location or perform the desired action by pressing the appropriate icon.
For detailed directions on each of the home screen icons and their functions, refer to the Axiom
Configuration Reference.

700 – Axiom – H2 Overview– Rev 7 - 03 Aug 2017 8/35
Figure 4: Home screen
1.5.3.1 Status indicators
The status indicators provide cursory information such as sensor activity, battery voltage, and battery
state to allow the user to make a quick assessment as to how the Datalogger is operating.
Refer to the Operation section of this manual for specifics on the Home screen status indicators.
1.5.3.2 Station Icon
The Station icon accesses screens that provide the user with Datalogger specifics such as software
version, serial number, manufacture date, etc. The user can also enter a station name and description as
well as save and load Datalogger configuration files.
1.5.3.3 Sensors icon
The Sensors icon accesses screens that provide the user access to sensor definitions. The Sensors screen
allows the user to define new sensors (Internal, Dedicated, or SDI) as well as individually examine
existing sensor operation and configuration.
Refer to the Operation section of this manual for details on sensor monitoring.
1.5.3.4 SDI-12 icon
The SDI-12 icon accesses screens that provide the user access to the Datalogger’s SDI ports and
specifically to SDI sensor definitions. The SDI Sensor Mapping screen allows the user to define new SDI
sensors and examine their operation, to automatically detect SDI sensors that are connected to the
Datalogger, and to manually issue commands over the SDI ports.
Refer to the Operation section of this manual for details on SDI sensor set-up and operation.
1.5.3.5 Processes icon
The Processes icon accesses screens that enable the user to define mathematical calculations and custom
scripts to manipulate sensor measurements or other processes. A process output is treated the same as
a sensor reading – both are valid data points as the Datalogger is not concerned about the source of the
data. Any data point can be logged, transmitted, displayed, or used in another calculation.
Status Indicators

700 – Axiom – H2 Overview– Rev 7 - 03 Aug 2017 9/35
1.5.3.6 Current Conditions icon
The Current Conditions icon accesses screens that display and configure a set of user selected data points
to facilitate easy monitoring of a specific set of data. The user can manually refresh the current
condition readings at any time or have the Datalogger automatically update the display (on a one
minute interval) with a series of current condition readings.
Refer to the Operation section of this manual for details on viewing the current conditions.
1.5.3.7 Telemetry icon
The Telemetry icon accesses screens that allow the user to configure the telemetry port for a specific
telemetry device and to retrieve status information from the device. The options are G6 (FTS G6
satellite transmitter); RVT (FTS Radio Voice Transmitter); AirTalk (FTS AirTalk transmitter); DB9 and
DB9-P (simple serial communications); Modbus (Modbus specific telemetry devices); Ubicom (FTS
Ubicom transceiver); G5 (FTS GOES transmitter); FTS (all other telemetry types); and None (disabled).
Refer to the Operation section of this manual for details on telemetry device configuration and status
monitoring.
1.5.3.8 Service icon
The Service icon accesses screens that provide access to Datalogger maintenance related items. Through
Service, the user can set the Datalogger’s data and time, review and manage the Datalogger’s audit log,
record serial numbers of the sensors used by the Datalogger, and issue site visit service reports.

700 – Axiom – H2 Overview– Rev 7 - 03 Aug 2017 10/35
Chapter 2 Quick start guide ______________________________________________________________________________
2.1 Configuring the Datalogger
FTS normally configures the Datalogger to meet the user’s requirements; however, should it be
necessary, the user can set-up or modify the Datalogger’s configuration.
There are three ways to configure a Datalogger:
1. Load and modify an existing Configuration File,
2. Load and modify an existing Template File, or
3. Configure the Datalogger from start to finish using the touchscreen and GUI.
2.1.1 Load and Modify an existing Configuration/Template File
A basic guide to configure the Datalogger is outlined in the steps below. Details on configuration
specifics can be found in the Axiom Configuration Reference.
1. Power the Datalogger
a. Attach the battery to the power cable.
b. Plug the power connector into the Datalogger.
2. Set the Datalogger’s date, time, and time zone:
a. Press Service.
b. Press Set Date/Time.
c. Enter date, time, and time zone values.
d. Press OK and then Home when you are finished.
3. Set the station name and description:
a. Press Station and select the Site tab.
b. Press Edit.
c. Enter your station name and description
d. Press OK when you are done.
4. To configure the Datalogger from an existing template or configuration file:
a. On the Home screen, press Station.
b. Select the Setup tab on the Station Set-up screen.
c. Press Load Configuration.
d. Select the template or configuration file.
700 – Axiom – H2 Overview– Rev 7 - 03 Aug 2017 11/35
e. After the Datalogger has loaded the desired configuration go to Step 9 to
configure/confirm the telemetry settings. Otherwise press Home and continue with the
steps below.
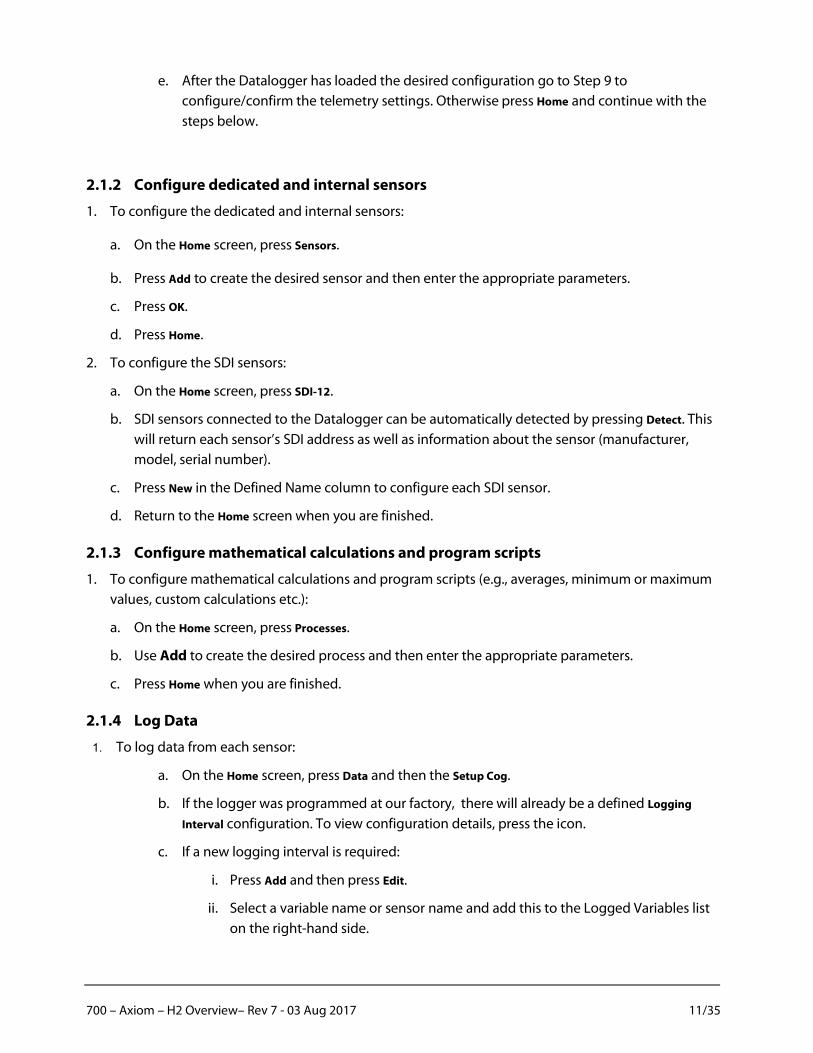
2.1.2 Configure dedicated and internal sensors
1. To configure the dedicated and internal sensors:
a. On the Home screen, press Sensors.
b. Press Add to create the desired sensor and then enter the appropriate parameters.
c. Press OK.
d. Press Home.
2. To configure the SDI sensors:
a. On the Home screen, press SDI-12.
b. SDI sensors connected to the Datalogger can be automatically detected by pressing Detect. This
will return each sensor’s SDI address as well as information about the sensor (manufacturer,
model, serial number).
c. Press New in the Defined Name column to configure each SDI sensor.
d. Return to the Home screen when you are finished.
2.1.3 Configure mathematical calculations and program scripts
1. To configure mathematical calculations and program scripts (e.g., averages, minimum or maximum
values, custom calculations etc.):
a. On the Home screen, press Processes.
b. Use Add to create the desired process and then enter the appropriate parameters.
c. Press Home when you are finished.
2.1.4 Log Data
1. To log data from each sensor:
a. On the Home screen, press Data and then the Setup Cog.
b. If the logger was programmed at our factory, there will already be a defined Logging
Interval configuration. To view configuration details, press the icon.
c. If a new logging interval is required:
i. Press Add and then press Edit.
ii. Select a variable name or sensor name and add this to the Logged Variables list
on the right-hand side.

700 – Axiom – H2 Overview– Rev 7 - 03 Aug 2017 12/35
iii. Continue adding to the list until all the variables you want logged appear on the
right-hand side.
iv. Choose a logging interval time
v. Press OK to save.
d. Return to the Home screen when you are finished.
2.1.5 Display or Configure Telemetry port settings
1. To display or configure the current telemetry port settings:
a. On the Home screen, press Telemetry.
b. Setup is required only for G6 transmitter. If the Datalogger is connected to a G6
transmitter (internally or externally):
i. Press the port’s Status button to display a summary status screen for the G6
transmitter.
ii. Press the Setup Cog and then Edit to configure your station’s NESID and relevant
transmit parameters.
iii. Navigate to the Self-Timed Tab to set the desired message format.
iv. Press OK after you are done to return to the setup screen.
v. Next, select the desired message format and then press Set Message to configure
the data transmitted in each transmission.
vi. Return to the Home screen when you are finished.
2.1.6 Confirm Station Operation
1. Confirm proper station operation:
a. On the Home screen, press Current Conditions
b. Press the Setup Cog and choose which Datalogger parameters to monitor. Press OK when
finished.
c. Press Refresh on the Current Conditions screen to update the display with the latest sensor
readings.
d. Return to the Home screen when you are finished.
2.1.7 Save Configuration to USB
1. For your records, save the Datalogger’s configuration to your USB memory stick:
a. Plug your memory stick into one of the Datalogger’s USB HOST ports.
b. On the Home screen, press Station and then select the Set-up tab.
c. Press Save Configuration and then press OK to save the Datalogger’s configuration to the
USB memory stick.

700 – Axiom – H2 Overview– Rev 7 - 03 Aug 2017 13/35
If desired you can also save a template of the Datalogger’s configuration to the USB memory stick
(refer the Operation section of this manual for the difference between templates and
configurations).
2.1.8 Graph and View Data
1. To graph data:
a. On the Home screen, press Data.
b. Press Graph.
c. Press the Setup Cog to configure the graph.
2. To view data:
a. On the Home screen, press Data.
b. Press Table.
2.1.9 Export Data to USB
1. To export data to your USB memory stick:
a. Plug your memory stick into one of the Datalogger’s USB HOST ports.
b. On the Home screen, press Data.
c. Press Download.
d. Select the desired date range and then press Download to download the data.
e. Note that the export process can require some time if a large data range is selected.

700 – Axiom – H2 Overview– Rev 7 - 03 Aug 2017 14/35
Chapter 3 Operating Instructions __________________________________________________________________________________
3.1 General
Datalogging is a simple, straightforward process – data is sampled and stored on predefined intervals.
Operation of the Datalogger is also quite simple as the Datalogger GUI has several facilities (which can
be password protected) to configure the Datalogger and to monitor the status of the Datalogger and
datalogging system. The user has several options when interfacing with the Datalogger. The simplest
option is to use the Datalogger’s touchscreen GUI together with a USB memory stick. Alternately, the
Datalogger can be connected to a PC as a USB device. Third, the Datalogger telemetry port can be
connected to a PC through an RS-232 serial port. As well, several telemetry choices exist for remote data
collection from the Datalogger.
3.1.1 Mouse and keyboard connection
For convenience, a USB mouse and/or keyboard can be connected to the Datalogger’s USB HOST ports.
The Datalogger’s touchscreen continues to function while the mouse and keyboard are connected.
3.1.2 Password protection
Two levels of password protection can be utilized on the Datalogger. A User Level password grants
touchscreen read-only access to the Datalogger while a Tech Level password enables the operator to
modify the Datalogger configuration. It is the choice of the station operator whether or not to enable
password protection on the Datalogger as passwords are not set when the Datalogger is shipped from
FTS.
3.1.2.1 User level
A User Level password allows the operator read-only access to the Datalogger. The operator is able to
examine Datalogger status (i.e. view data, read sensors, view telemetry configuration etc.) but cannot
change the configuration of the logger if a Tech Level password is set.
3.1.2.2 Tech level
The purpose of the Tech (technician) Level password is to prevent unauthorized modifications to the
Datalogger. A Tech Level password allows the operator full access to the Datalogger. The operator is
able to modify Datalogger operation (i.e. load new configurations, create and change datalogging
intervals, create and change sensor definitions etc.). There are no restrictions placed on a Tech Level
user. If a Tech Level password is not set then the User Level has access to Tech Level functionality.
3.1.2.3 Logout
Automatic logout from User Level or Tech Level occurs after 20 minutes of touchscreen inactivity. In
addition, a station operator can force a logout by pressing Logout on the Service screen.

700 – Axiom – H2 Overview– Rev 7 - 03 Aug 2017 15/35
3.1.3 Datalogger time
The user can set the Datalogger to report the time in whatever time zone they desire. The Datalogger
continually displays the time (as per the time zone setting) in the upper right corner of the display. All
datalogging and all audit log entries are recorded with the time of the time zone setting.
3.1.3.1 Setting the time
On the Service screen, press Set Date/Time to set the Datalogger date, time and time zone. Check the
Enable Daylight Savings box if you want the Datalogger to track daylight savings time.
3.1.3.2 Operation with a G6 transmitter
When the Datalogger is connected to a G6 transmitter, the Datalogger’s time automatically
synchronizes with the high-accuracy, GPS-synchronized clock in the G6 transmitter. Clock
synchronization occurs the first time the G6’s time is synchronized. Clock synchronization also occurs
before each test or self-timed G6 transmission and every 24 hours after power on but only if there is a
time difference greater than one second between the Datalogger and G6 transmitter. Although the
Datalogger is synchronized with the G6’s time, the time zone setting of the Datalogger is unaffected. If
you want the Datalogger time to match the G6 transmitter time, set the Datalogger’s time zone to the
UTC setting and do not select the Enable Daylight Savings checkbox.
3.1.4 Using template and configuration files
Configuration and template files are powerful tools for maintaining a network of Dataloggers.
Configuration files allow unique Datalogger configurations to be saved or loaded while template files
are used to store or distribute specific data collection algorithms for use in any number of Dataloggers.
3.1.4.1 Configuration files
A configuration file encompasses all Datalogger details – this includes Datalogger specific information
such as site and telemetry parameters as well as general data collection and processing algorithms.
Saving the Datalogger’s configuration is useful as it becomes a record which can be used to restore or
duplicate a specific Datalogger set-up.
3.1.4.2 Template files
Unlike configuration files, template files do not include Datalogger specific information. Template files
only contain the data collection and processing algorithms. This allows a template file to be loaded into
several Dataloggers to ensure consistent data sampling on all sites while retaining the specifics of each
Datalogger. The Datalogger can be preloaded with multiple template files (prior to deployment) so that
field selection of the data collection algorithm can be done through the Datalogger’s GUI (no other
tools required). Template files can also be loaded from a USB memory stick or PC.
3.1.5 USB connection to a PC
The Datalogger can be connected as a slave device through the Datalogger’s USB DEVICE port. This
section describes how this feature appears (differently) under Windows XP and Windows 7.
700 – Axiom – H2 Overview– Rev 7 - 03 Aug 2017 16/35
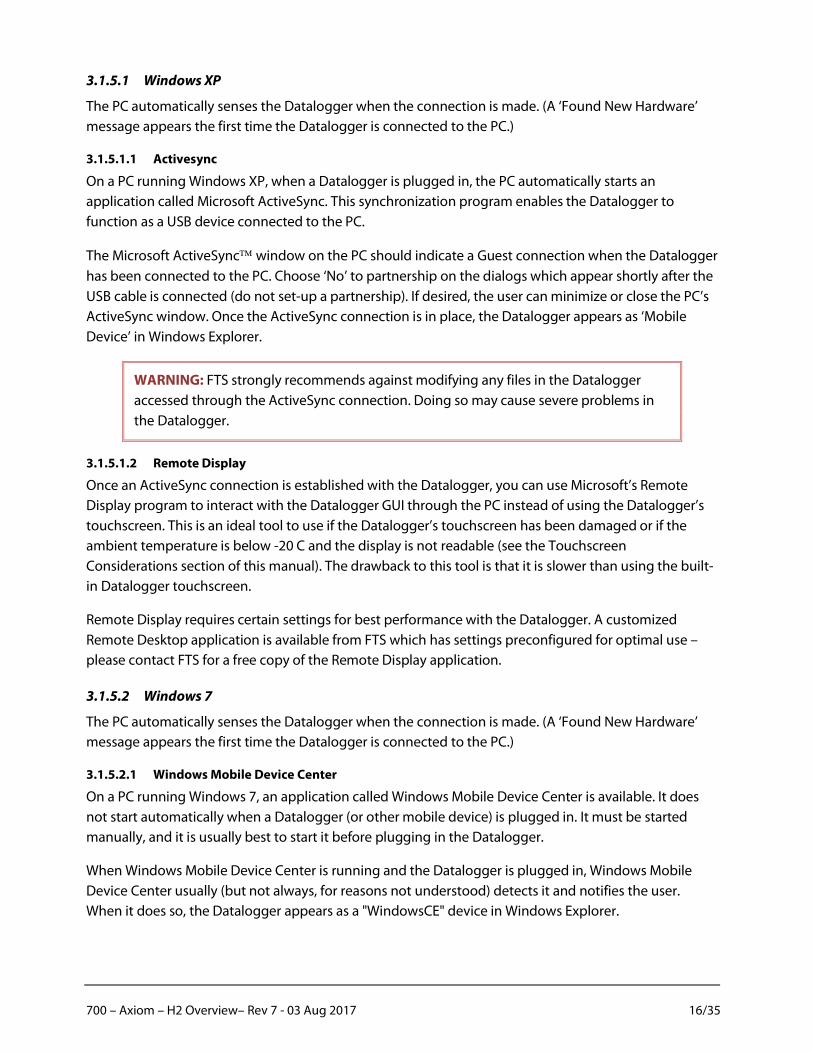
3.1.5.1 Windows XP
The PC automatically senses the Datalogger when the connection is made. (A ‘Found New Hardware’
message appears the first time the Datalogger is connected to the PC.)
3.1.5.1.1 Activesync
On a PC running Windows XP, when a Datalogger is plugged in, the PC automatically starts an
application called Microsoft ActiveSync. This synchronization program enables the Datalogger to
function as a USB device connected to the PC.
The Microsoft ActiveSync window on the PC should indicate a Guest connection when the Datalogger
has been connected to the PC. Choose ‘No’ to partnership on the dialogs which appear shortly after the
USB cable is connected (do not set-up a partnership). If desired, the user can minimize or close the PC’s
ActiveSync window. Once the ActiveSync connection is in place, the Datalogger appears as ‘Mobile
Device’ in Windows Explorer.
WARNING: FTS strongly recommends against modifying any files in the Datalogger
accessed through the ActiveSync connection. Doing so may cause severe problems in
the Datalogger.
3.1.5.1.2 Remote Display
Once an ActiveSync connection is established with the Datalogger, you can use Microsoft’s Remote
Display program to interact with the Datalogger GUI through the PC instead of using the Datalogger’s
touchscreen. This is an ideal tool to use if the Datalogger’s touchscreen has been damaged or if the
ambient temperature is below -20 C and the display is not readable (see the Touchscreen
Considerations section of this manual). The drawback to this tool is that it is slower than using the built-
in Datalogger touchscreen.
Remote Display requires certain settings for best performance with the Datalogger. A customized
Remote Desktop application is available from FTS which has settings preconfigured for optimal use –
please contact FTS for a free copy of the Remote Display application.
3.1.5.2 Windows 7
The PC automatically senses the Datalogger when the connection is made. (A ‘Found New Hardware’
message appears the first time the Datalogger is connected to the PC.)
3.1.5.2.1 Windows Mobile Device Center
On a PC running Windows 7, an application called Windows Mobile Device Center is available. It does
not start automatically when a Datalogger (or other mobile device) is plugged in. It must be started
manually, and it is usually best to start it before plugging in the Datalogger.
When Windows Mobile Device Center is running and the Datalogger is plugged in, Windows Mobile
Device Center usually (but not always, for reasons not understood) detects it and notifies the user.
When it does so, the Datalogger appears as a "WindowsCE" device in Windows Explorer.

700 – Axiom – H2 Overview– Rev 7 - 03 Aug 2017 17/35
WARNING: FTS strongly recommends against modifying any files in the Datalogger
accessed through the Windows Mobile Device Center connection. Doing so may cause
severe problems in the Datalogger.
3.1.5.2.2 No Windows 7 equivalent of Remote Display
Even though Windows Mobile Center is described as a replacement for Microsoft ActiveSync, it does not
provide exactly the same features and Microsoft Remote Display does not work with it (nor is Remote
Display provided with Windows 7). There is currently no program that provides the same functionality
of Remote Display on Windows 7.
3.1.6 Touchscreen considerations
3.1.6.1 Temperature
When the Datalogger is operated at low temperatures (lower than -20 Celsius), the display responds
more slowly than it does at room temperature. Also, the display becomes faint or has low contrast. This
is normal for the display. Although the official specification for low temperature operation of the display
is -20 Celsius, we have found that typically the display remains readable until approximately -30 Celsius.
When performing a site visit at temperatures colder than -20 Celsius, the user should bring along a
laptop computer so that they can remotely connect to the Datalogger. Note that although the display
becomes unreadable at cold temperatures, this does not affect the Datalogger’s operation. The
Datalogger continues to log the required data and as the temperature rises, the Datalogger display
once again becomes readable.
3.1.6.2 Touch
The Datalogger’s touchscreen is a sensitive membrane – only the attached stylus or a bare finger should
be used to touch the screen (i.e. do not use a screwdriver, pen, pliers, pocket knife, etc. in place of a
stylus).
3.1.6.3 Screen calibration
The Datalogger’s touchscreen is factory calibrated; however, if you notice that the presses on the
touchscreen do not register in the correct location, then the touchscreen may need to be recalibrated.
To recalibrate the touchscreen, go to the Service screen and press Screen Calibration.
3.1.7 Telemetry connection to a PC
The Datalogger can be connected to a PC’s RS-232 port using a CBL-F6H2-TLM-CP cable (available from
FTS) to establish a serial connection (9600 baud, no parity, 8 data bits, 1 stop bit) to the Datalogger’s
TELEMETRY port. The serial connection can be used by FTS software (i.e. AutoCaller, StreamTrac, etc.) or
by terminal software (i.e. HyperTerminal) to retrieve data from the Datalogger. The TELEMETRY port
connection is not intended for Datalogger maintenance (i.e. uploading of Datalogger configurations or
application software). The primary purpose of the TELEMETRY port is for telemetry device connections.

700 – Axiom – H2 Overview– Rev 7 - 03 Aug 2017 18/35
3.1.7.1 ASCII data download
Data can be retrieved from the Datalogger over using a command line, text based interface. The
getdatarange command can be used to retrieve all data or a range of data stored in the Datalogger.
Password protection over the command line interface mirrors password protection in the Datalogger.
That is, if password protection has been set in the Datalogger then the user is required to enter the
appropriate password over the command line in order to gain access to the logger’s data. The date
format specified in the getdatarange command determines the format of the date field in the returned
data (see examples below).
Example 1 – mm/dd/yyyy format
C/R String
Cmd getdatarange 10/02/2009 10/04/2009
Resp Data From: H1 at FTS Date: 10/02/2009,00:00:00 to: 10/04/2009,00:00:00 Date,Time,HG MM/DD/YYYY,HH:MM:SS,m 10/02/2009,18:08:03,1.432 10/02/2009,18:09:04,1.433 10/02/2009,18:10:05,1.43 …
Example 2 – yyyy/mm/dd format
C/R String
Cmd getdatarange 2009/10/02
Resp Data From: H1 at FTS Date: 2009/10/02,00:00:00 to: 9999/12/31,23:59:59 Date,Time,HG YYYY/MM/DD,HH:MM:SS,m 2009/10/02,18:08:03,1.432 2009/10/02,18:09:04,1.433 2009/10/02,18:10:05,1.435 …
Notes
the getdatarange command does not require that an end date be specified
pressing Ctrl+C on the keyboard during data retrieval will terminate the download
3.2 USB memory stick information
The Datalogger has two USB HOST ports which are both capable of interfacing to a USB memory stick (or
keyboard or mouse). A memory stick can be used to save Datalogger information as well as provide the
Datalogger with application software upgrades.
3.2.1 Requirements
Although data and configuration files are quite small, a minimum 2 GB USB memory stick is
recommended for use with the Datalogger as the large capacity ensures ample room for data from
many station visits. Any USB memory stick is compatible with the Datalogger’s USB HOST port.

700 – Axiom – H2 Overview– Rev 7 - 03 Aug 2017 19/35
3.2.2 File structure
The Axiom H2 Datalogger uses a defined file structure on the memory stick to help with file
housekeeping. The memory stick file structure used by the Axiom H2 Datalogger is shown in Figure 5.
Figure 5: Memory Stick File Structure
3.2.2.1 H2 Data Logger folder
The H2 Data Logger folder in the root of the USB memory is the folder in which all Axiom H2 Datalogger
information is stored.
3.2.2.2 SW folder
The SW (software) folder is the folder the Datalogger examines when the user updates the Datalogger’s
application software. A typical application update file would be named H2_v229.CAB.
3.2.2.2.1 Custom devices
The Custom Devices subfolder is the folder the Datalogger examines when the user updates the
Datalogger’s sensor extensions. The sensor extension file for the SDI-AM module is named AmModDll.dll.
3.2.2.3 Template folder
The Template folder is the directory used by the Axiom H2 Datalogger when saving or loading template
files from a USB memory stick. A typical default name for a template file is Template-2014-4-9-15-28.xml
(format Template-YYYY-MM-DD-hh-mm); however, the user can specify a filename during the save template
process.
3.2.2.4 Station folder
The station folder is the default folder used by the Axiom H2 Datalogger if the Datalogger’s Station
name has not been specified (i.e. the Station field on the Site tab on the Station Set-up screen is blank).
This means that the default station folder could contain data from several stations (i.e. data from every
Datalogger whose Station name has been left blank). If the Datalogger has been assigned a Station
name, then the Datalogger creates a folder on the memory stick with the same name as the
Datalogger’s Station name. This way every named Datalogger site has its own station folder in the main
Axiom H2 Data Logger folder.

700 – Axiom – H2 Overview– Rev 7 - 03 Aug 2017 20/35
3.2.2.4.1 Config folder
The Config (configuration) subfolder is the directory used by the Axiom H2 Datalogger when saving or
loading configuration files from a USB memory stick. A typical default name for a configuration file is
Configuration-2014-4-9-15-28.xml (format Configuration-YYYY-MM-DD-hh-mm); however, the user can specify a
filename during the save configuration process.
3.2.2.4.2 Data folder
The Data subfolder is the directory used by the Axiom H2 Datalogger when exporting data, audit logs,
and G6 transmission history files to a USB memory stick. Default file names are as follows:
Audit Logs: AuditLog-YYYY-MM-DD-hh-mm.txt
G6 Tx History TelemA- YYYY-MM-DD-hh-mm.txt
Exported Data <Station Name>-YYYY-MM-DD-hh-mm.csv
3.2.2.4.3 Visit Report folder
The Visit Report subfolder is the directory used by the Axiom H2 Datalogger for storing site visit reports
and configuration summary reports to a USB memory stick. Typical file names are as follows:
Note: timestamp format is YYYY-MM-DD-hh-mm format. E.g., 2014-4-9-13-28 denotes April 9, 2014 at 13:28
3.3 Datalogger status
The Axiom H2 Datalogger’s Quick Touch System allows the user to quickly assess the Datalogger.
Status indicators on the Home screen provide a snapshot of Datalogger’s current operating state. The
Home screen also provides easy access to more detailed Datalogger status information such as data
point values (sensor readings and processing calculations), as well as an audit log file. Additionally, the
Datalogger time is always displayed in the upper right corner of the touchscreen to show that the
Datalogger is functioning.
3.3.1 Home screen status indicators
Home screen status indicators provide information such as sensor activity, transmitter status, battery
voltage, and battery state to allow the user to make a quick assessment as to how the Datalogger is
operating. The four status indicators at the bottom of the Home screen are: Built-in, SDI, Battery, and Telem
(see Figure 4 ).
3.3.1.1 Built-in
Colour Meaning
Green dedicated front panel sensors or internal sensors are being read by the Datalogger
Black no sensor reading activity
Start Visit: StartVisitReport_2014-4-9-13-28.txt
End Visit: EndVisitReport_2014-4-9-13-57.txt
Configuration Summary: ConfigSummary_2014-8-19-14-47.csv

700 – Axiom – H2 Overview– Rev 7 - 03 Aug 2017 21/35
3.3.1.2 SDI
SDI is actually two indicators in one, split left and right, for SDI A and SDI B sensor inputs respectively.
Colour Meaning
Green SDI A (left) or SDI B (right) sensors are being read by the Datalogger
Black no sensor reading activity
Detailed information on a specific SDI sensor is available through that SDI sensor’s definition screen.
3.3.1.3 Battery
The Battery status indicator has black text which displays the voltage of the battery connected to the
Datalogger’s BATTERY input while the background colour displays the charging status of the battery.
Background colours for the Battery indicator are:
Colour Meaning
Black no status available
Yellow the battery is being discharged
Green the battery is being charged
Detailed information on the BATTERY and SOLAR PANEL inputs are available through their respective
definition screens.
3.3.1.4 Telem
Telem is actually two indicators in one, split left and right, for the Telemetry A and Telemetry B ports
respectively.
Colour Meaning
Green Datalogger is supplying power to the telemetry port
Red port power is turned off (due to a power cycle schedule)
Black power to the port is disabled (eg: Telem is set to “none” for that port)
3.3.2 Data point values
Data point values are another source for confirming proper Datalogger operation. Data points
encompass all sensor readings, Built-in and SDI, as well as all process calculations. Individual data points
are viewed by selecting the desired sensor or process from the screens accessed from the Home screen
through Sensors, SDI-12, or Processes, as appropriate.
3.3.2.1 Current Conditions
Screens accessed from the Home screen Current Conditions icon allow the user to define a custom set of
data points which can be simultaneously displayed. The data points selected for the Current Conditions
display can be manually refreshed or be automatically refreshed every minute (for up to 60 minutes).

700 – Axiom – H2 Overview– Rev 7 - 03 Aug 2017 22/35
Built-in sensors are read every time a manual or automatic refresh event occurs whereas SDI sensors
display the last value read from the sensor. A process returns the current value of the process at the
time the refresh was selected.
3.3.3 Audit log
A chronological summary of significant Datalogger events is captured in the Datalogger’s audit log text
file. The Audit log is a circular file in which the newest message overwrites the oldest message once the
file has reached its maximum size (20 kB). The audit log file is viewed by pressing Audit Log on the Service
screen. The user can clear the audit log file or save the file to a USB memory stick.
3.4 Data status
To access the Data Status screen (Figure 6), press Data on the Home screen.
Data Status shows a summary of the data which has been recorded in the Datalogger and allows
examination of that data (“Data Status” does not refer to the quality of the data collected.) The Data
Status screen also provides the user options to configure datalogging or examine recorded data.
Figure 6: Data Status screen
3.4.1 Data storage information
The Datalogger stores data in a non-volatile circular 14 MB file. Once the data file is full, the Datalogger
begins to overwrite the oldest stored data.
3.4.1.1 Percentage full
A bar graph showing the percentage of the file already used for data storage full is displayed. The
percentage full is a calculation of the actual number of bytes used out of the available for data storage.
This bar is typically green but turns yellow when the Datalogger starts to overwrite the oldest data.
3.4.1.2 Capacity
The reported capacity is the estimated number of days of data the Datalogger can stored before the
Datalogger begins to overwrite the oldest stored data. The capacity estimate is based on the record size
stored during each log event and Datalogger’s currently defined Log Intervals.

700 – Axiom – H2 Overview– Rev 7 - 03 Aug 2017 23/35
3.4.1.3 Oldest data
Oldest Data is the date and time of the oldest data currently stored in the Datalogger. Oldest Data date
and time is updated when the data file reaches its size limit and the Datalogger starts to overwrite the
oldest data.
3.4.1.4 Newest data
Newest Data is the date and time of the newest data currently stored in the Datalogger. Newest Data
date and time is updated as new data is recorded.
3.4.1.5 Estimated overwrite date
The Est (estimated) Overwrite Date is the date on which the Datalogger starts to overwrite data stored
in its circular data file. The estimated overwrite date is based on the capacity estimation and the current
date.
3.4.2 Data viewing
The user can examine logged data in tabular or graphical format.
To view and to customize a graph of the available data, use the Data Graph screen (Home > Data > Graph).
To view all logged data in a tabular format, use the Data Table screen (Home > Data > Table).
3.4.2.1 Graph view
Graph View (the Data Graph screen; Home > Data > Graph Data ) is useful for examining a data trend over a
short period of time. While it is possible to graph a large time period, the user should be aware that it
may take the Datalogger an extended time to format the graph depending on the number of readings
in the selected range.
To configure the graph (set the date and time range, select the data points to display, set the y-axis
minimum and maximum), use the Graph Setup screen (Home > Data > Graph Data > Setup Cog).
3.4.2.2 Table view
Table View (the Data Table screen; Home > Data > Display Table)is useful for examining specific data values,
presented in a tabular format. The user is able to resize the data columns as well as reposition the data
columns, by drag and drop, so that they can easily compare data point values.
The Jump button on the Data Table screen allows the user to go to a specific time in the logged data.
3.4.3 Data operations
To export selected logged data to a USB memory stick, or to delete the Datalogger’s logged data file,
use the Download Data screen (Home > Data > Download Data).
3.4.3.1 Downloading stored data
To download data, use the Download Data screen (Home > Data > Download Data). Specify the date range
and file format (either CSV or binary) to save to a USB memory stick. The requested data is downloaded
(saved) to the memory stick inserted in the USB HOST port when Download is pressed.

700 – Axiom – H2 Overview– Rev 7 - 03 Aug 2017 24/35
The download process does not delete the original data from the Datalogger.
3.4.3.2 Deleting stored data
To delete the Datalogger’s stored data, press Delete on the Data Status screen (Home > Data). The user is
prompted to confirm the data deletion after Delete is pressed.
WARNING ! Deleting the data PERMANENTLY removes the data from the Datalogger.
3.4.4 Remote Datalogger communication
Data and Datalogger information can also be remotely retrieved from the Datalogger using a variety of
telemetry devices. Please contact FTS for assistance in choosing the telemetry option appropriate for
your application.
3.5 Telemetry Devices
The Datalogger has two Telemetry ports (A and B) which support simultaneous connection of two
telemetry devices. For datalogger models with an internal G6 transmitter, Telemetry A is automatically
assigned Device Type: G6.
For datalogger models with external telemetry ports, determine to which telemetry port the device is
connected and select the corresponding Telemetry tab. Press on the Dev Type button and select the
appropriate Device Type from the droop down menu.
Internal G6 Transmitter Assigning a Telemetry Device
Figure 7: Telemetry screen

700 – Axiom – H2 Overview– Rev 7 - 03 Aug 2017 25/35
The Device Type selections are:
None: Selecting None as the port’s telemetry device type disables the telemetry port by turning off
port power as well as disabling all port communications.
FTS FTS indicates that FTS protocols must be used. This is for use with commercial devices (ie: non-FTS). In order for full functionality with the Datalogger, these devices must use FTS protocols. This includes IP modems, radio modems, and Globalstar modems.
FTS2: This is an extended version of FTS protocols which are specific to and should only be used with
the FTS Ubicom Transmitter.
G5: The G5 device type is specific to and should only be used with the FTS G5 GOES Transmitter.
G6 The G6 device type is specific to and should only be used with the FTS G6 GOES Transmitter.
RVT: The RVT device type is specific to and should only be used with the FTS RVT Radio Voice
Transmitter.
Refer to the RVT Telemetry Reference Manual for detailed RVT configuration and status information
provided by Status.
AirTalk The AirTalk device type is specific to and should only be used with the FTS AirTalk radio voice
transmitter.
Refer to the Air Talk Telemetry Reference Manual for detailed configuration instructions and for
status information provided by Status.
DB9/DB9-P: The DB9/DB9-P device type is for simple serial communication. The port settings are user
configurable. Default ports settings are 9600 baud with 1 stop bit, no parity, 8 data bits and no flow
control. The Port status indicator will always be black for the DB9 device as power is not supplied
through the DB9 connector; it will be green for DB9-P since power is supplied through the DB9-
logger connection.
Serial Port Configuration: The Serial Port Configuration screen is displayed when the Status
button associated with the DB9/DB9-P port on the Telemetry screen is pressed. This screen
allows the user to configure the DB9/DB9-P port serial port settings.
None disables the Telemetry port
FTS for use with telemetry devices which use FTS protocols
FTS (Bluetooth)
Specific for use with the FTS WRLS-AXIOM-PC device
FTS2 extended FTS protocols specific to FTS Ubicom 2-way satellite (Iridium) transceiver
G5 specific for the FTS G5 GOES Transmitter
G6 specific for the FTS G6 GOES Transmitter
RVT specific for the FTS Radio Voice Transmitter (version 1)
AirTalk specific for AirTalk (FTS Radio Voice Transmitter version 2)
DB9 / DB9-P
generic port setting, simple serial communications
Modbus generic port setting for Modbus telemetry devices

700 – Axiom – H2 Overview– Rev 7 - 03 Aug 2017 26/35
Figure 8: DB9 Serial Port Configuration
Port Settings Tab: The serial port parameters shown are configurable as follows by using the
Edit icon and using the drop down menus to input the desired values:
Baud Rate configurable from 110 baud to 115k2 baud in standard baud rate increments
Data Bits configurable for 7 or 8 data bits
Stop Bits configurable for 1, 1.5, or 2 stop bits
Parity configurable for None, Even, Odd, Mark, or Space parity
Flow Control configurable for None, Hardware, and XonXoff
Reset: If Port Settings have been changed, they can be returned to the default settings by selecting the Edit icon and then the Reset button.
Protocol Settings Tab: The DB9/DB9-P protocols can be configured by using the Protocol
Settings Tab.
Figure 9: Protocol Settings Tab
Press Edit to change the default settings. The settings are explained in the following table.

700 – Axiom – H2 Overview– Rev 7 - 03 Aug 2017 27/35
Wakeup Delay
The period of time in microseconds that the device will wait for the Datalogger to respond to a wakeup command before sending another
ACK Timeouts
The period of time in seconds that the device will wait for the Datalogger to acknowledge a command before repeating it
CTS Active Timeouts
The period of time in seconds that the device will suspend receiving data from the Datalogger as it empties its buffer. Once the buffer is clear, it will continue to download data.
Modbus: The Modbus device type is specific to and should only be used with the Modbus compatible devices.
Ubicom: The Ubicom device type is specific to and should only be used with the FTS Ubicom
Transmitter.
3.5.1.1 Telemetry Status
To view a summary of a telemetry device status, use the Telemetry screen (Home >
Telemetry>Status). The displayed status depends on the telemetry port’s Device Type setting.
Figure 10: Example Telemetry Status screen

700 – Axiom – H2 Overview– Rev 7 - 03 Aug 2017 28/35
Chapter 4 Specifications __________________________________________________________________________________
4.1 Datalogger
4.1.1 General
4.1.1.1 Protection
Inputs are lightning / static protected
Connectors are metal shell circular waterproof types
Built-in case temperature sensor
4.1.1.2 Physical
Size: 25 cm wide, 20 cm high. 15 cm deep (10” x 8” x 6”)
Weight: 3.3 kgs (7.3 lbs)
4.2 kgs (9.2 lbs) with optional internal G6 Transmitter
4.1.1.3 Environmental
Operating Temperature Range -40 ºC to 60 ºC (refer to the display specification for the display’s operating temperature range)
Storage Temperature Range -50 ºC to 70 ºC
Enclosure watertight, even without connectors attached
4.1.1.4 Power management
9.6 Vdc to 20 Vdc operating voltage
Internal solar panel voltage and current measurement
Internal battery voltage, current, and temperature measurement
Internal, temperature compensated battery charge regulator
4.1.1.5 Power consumption
State
Current draw
without internal G6 transmitter
with internal G6 transmitter
Idle 3 mA with ) 8 mA
Active 10 mA 15 mA
Display On 60 mA 65 mA
Transmit n/a 2.6 A max

700 – Axiom – H2 Overview– Rev 7 - 03 Aug 2017 29/35
4.1.1.6 Memory
RAM 64M
non-volatile flash storage 256M
memory allocations 14 MB circular memory file for data
20 kB circular audit log, transmit log
70 kB circular transmit log
4.1.1.7 Real time clock
Battery backed clock
Synchronized to optional GPS
Clock accuracy: ±1 second if connected to a G6 transmitter.
Otherwise, maximum drift of 2 sec/day (room temperature).
4.1.2 User interface
4.1.2.1 Display / user interface
Display Built-in quarter VGA colour display, 7 cm wide x 5.5 cm high (2.8” x 2.125”) with touchscreen user interface.
Operating Temperature Range
-20 ºC to 60 ºC
Functions System status; Stored data (tables and graphs); System configuration; Troubleshooting/diagnostics.
4.1.2.2 USB device port
1 waterproof front panel connector
USB (full-speed, 12Mbps)
Automatic PC detection
4.1.2.3 USB host ports
2 waterproof front panel connectors
USB (full-speed, 12Mbps)
Supports 1.5Mbps and 12Mbps USB devices including memory sticks, mouse and keyboard.
4.1.3 Connectors
The connectors used on the Datalogger are commercial versions of the MIL-C-26482 Series 1 family of
connectors and are compatible with their military equivalents.
All pin-out diagrams on the following pages show the face of the chassis connector. This is the same as
the back of the mating cable connector.

700 – Axiom – H2 Overview– Rev 7 - 03 Aug 2017 30/35
There are several different manufacturers of connectors that mates with the Datalogger connectors, but
not all manufacturers make all of the pin-out variations. The part numbers we specify below are for
Souriau connectors with solder cup connections. Crimp connections are also available, but do not order
these unless you have the proper assembly tools.
Be particularly aware of problems in the 8-3 family, there are some variations that look like they should
mate, but the pins are in slightly different positions.
There are several different styles of environmental sealing, depending on the type of wire used. The part
numbers we have specified are for sealing to jacketed cables. There are also types that are for loose wire
bundles and thus seal the individual wires, or are intended for potting. Not all manufacturers make all
variations in sealing, so check the catalog very carefully before ordering a different brand. The true
military equivalents usually do not seal to jacketed cable -- check with your supplier. Note that
individual wire seals require wires of a specific diameter to work.
Delivery can be slow from the suppliers -- there are so many possible variations of these military style
connectors that the suppliers often stock the raw parts and then assemble the ordered combination
when they get an order.
WARNING ! If you are soldering wires to the connector, make sure you clean the flux off
the connector after soldering. Any moisture present inside the connector will combine
with the flux and cause corrosion eventually resulting in a connection failure.
Part number example
Part number: 851-06JC10-6PN50
851 Souriau series designation for this family of connectors
06 cable connecting plug (i.e., plugs into the Datalogger connectors)
JC seals to jacketed cable, with cable clamp
10 shell size (connector diameter)
6 contact arrangement (6 pins in hexagon)
P pins (as opposed to sockets)
N normal - insert not rotated (this is left out of the part number)
50 Souriau series index
In general, all of the connectors is of the form 851-06JCxx-xxYN50 where xx-xx is the shell size and
contact arrangement, and Y is the pin (P) or socket (S) descriptor. This cable end connector is equivalent
to MS3116Fxx-xxYN except that the military has individual wire seals instead of sealing to jacketed
cable. Check with your supplier to see if a jacket seal is available.

700 – Axiom – H2 Overview– Rev 7 - 03 Aug 2017 31/35
4.1.3.1 Battery
Mating Connector: 851-06JC10-7S50
FTS Part Number: 521-107S
PIN Function
A Signal ground
B Battery negative sense
C Battery negative (Chassis ground)
D Battery positive sense
E Battery positive
F Temperature input
G Optional battery back-up input
Signal input
9.6 VDC to 20 VDC operating voltage
Internal battery voltage, current (+ or -), and temperature measurement
4.1.3.2 Solar panel
Mating Connector: 851-06JC8-3AS50
FTS Part Number: 520-83AS
PIN Function
A Power positive
B Power negative
C Chassis ground
Signal input
100 W (25 Vdc, 7A) maximum input
Internal solar panel voltage and current measurement
Internal, temperature compensated battery charge regulator

700 – Axiom – H2 Overview– Rev 7 - 03 Aug 2017 32/35
4.1.3.3 Rain
Mating Connector: 851-06JC8-3AP50
FTS Part Number: 520-83AP
PIN Function
A Signal ground
B Signal input
C Chassis ground
Signal input
Contact closure to ground or 0 to 3 V
10 k pull-up to 3 Vdc internally
0 to-400 Hz at 50% duty cycle
Minimum closure (low level) duration 1 ms
Compatible with any tipping bucket rain gauge with contact closure.
53 bit counter (floating point, double precision)
Configurable units and tip increment
Optional reset date for automatic resetting of rain accumulation
4.1.3.4 SDI
Mating Connector: 851-06JC8-3AP50
FTS Part Number: 520-83AP
PIN Function
A SDI power out
B SDI data
C SDI ground
Signal input
Four independent SDI-12 version 1.3 ports
Supports M, C and R measurements with or without CRC error control.
CMOS Signal Levels
SDI over-voltage
Current limited to approximately 750 mA. Short duration transients of higher current can be
supplied without triggering the limit.

700 – Axiom – H2 Overview– Rev 7 - 03 Aug 2017 33/35
4.1.3.5 Telemetry
Mating Connector: 851-06JC12-8S50
FTS Part Number: 520-128S
PIN Function
A CTS (to Datalogger)
B Chassis ground
C RXD (to Datalogger)
D TXD (from Datalogger)
E RTS (from Datalogger)
F Signal ground
G Power from Datalogger
H Transmit enable
Signal input
Two ports factory configured as either:
o one internal G6 transmitter and one external connector, or
o two external connectors
Signal Levels: RS232C
Flow control may be enabled, depending on port configuration
Port settings are preserved through power failures

700 – Axiom – H2 Overview– Rev 7 - 03 Aug 2017 34/35
4.2 Internal G6 transmitter (OPTIONAL)
4.2.1 Transmission data rates
Meteosat/International - 100 BPS
GOES - 300 and 1200 BPS
Self-timed and Random transmissions
4.2.2 Output
Antenna: 5.7 dBi, right hand circular polarization
Connector: N-Type female
RF Power:
Data rate Power
100 BPS 14 W max
300 BPS 6.5 W max
1200 BPS 6.5 W max
4.2.3 Frequency range
401.701MHz – 402.09850 MHz
4.2.4 Frequency stability
Initial Accuracy: ±20 Hz disciplined to GPS
Short term drift: ±0.04 Hz/s
Ageing: ± 0.1 ppm/year
Vcc + Temperature: ± 0.1 ppm
4.2.5 Channel bandwidth
Data rate Bandwidth
100 BPS 3.0 kHz
300 BPS 750 Hz
1200 BPS 1.5 kHz
4.2.6 Time keeping
Setting Accuracy: +/- 100 us synchronized to GPS
Drift: +/- 10 ms/day over operating temperature range.
Transmission continuation without GPS fix: 28 days
4.2.7 GPS
Antenna type: 3 V active
Connector: SMA female
Time synchronization / frequency correction schedule:
- 1 fix at power up, 1 fix per day thereafter

700 – Axiom – H2 Overview– Rev 7 - 03 Aug 2017 35/35
Revision History
Revision Date Description Comments
1 31 Oct 2014, Updated with AS 3.1.1.165 Extract of 700-H2 Datalogger Rev 12, 01 May 2013 prior to archiving
2 09 Mar 2015, Minor formatting
3 17 Jun 2015 Updated for G6 and Ubicom Initial Spanish Translation
4 10 Aug 2015
Updated Section 3.5. Changed Tagline
Detailed all the device types and setting up DB9.
5 26 Oct 2015 Updated Cover photo
6 05 Oct 2016 Updated for AS ver 3.7.3.22 Added telemetry device type FTS (Bluetooth)
7 03 Aug 2017 Corrected PIN labels in section 4.1.3.3