aviation economic benefits - iata - · pdf fileaviation economic benefits measuring the...
TRANSCRIPT

Aviation Economic Benefits
Measuring the economic rate of return on investment in the aviation industry
IATA ECONOMICS BRIEFING No 8

IATA Economics Briefing No 8: AVIATION ECONOMIC BENEFITS
Mark SmythBrian Pearce
IATA, July 2007

Foreword by Giovanni Bisignani
Executive Summary
Report Outline
Productivity and Economic Growth
Aviation Connectivity
Connectivity and Economic Growth
Investment Examples
Policy Implications
Summary
ANNEX A: THE ECONOMETRIC MODEL
Contents
0100
0203
060504
0807
page 03
page 04
page 10
page 16
page 20
page 30
page 12
page 26
page 32


IATA and the aviation industry are committed to meeting current and future demand for air passenger and cargo traffic in a sustainable and environmentally responsible manner. We are fully engaged in the development and implementation of technological, operational and economic processes to meet this. But we must not lose sight of the substantial benefits that the aviation industry offers to the global economy. Sustainable growth – not artificial constraints – is the best way to maximise the benefits for all countries while continuing to meet our environmental responsibilities.
Giovanni Bisignani - Director General & CEO, IATA
The aviation industry facilitates greater global travel, economic links and trade. It is a key factor in connecting a country to the global economy. It provides greater opportunities for travel and tourism. It connects firms to larger potential sales markets, to more efficient supply chains and to greater investment opportunities. It helps to improve productivity levels, to the benefit of the national economy.
This report demonstrates how investment in the aviation industry can create a significant economic return – over and above the returns received directly by users. In particular, it shows how the incremental benefits of aviation investment are greatest for developing economies. It can offer them significant and speedy economic return, providing an important step in their economic development and integration into the global economy.
The wider economic returns must not be ignored in debates about future aviation development and investment. They represent the additional social and economic value of air transport that would be lost completely if future aviation growth was constrained or prevented. Consideration of aviation investment projects will rightly take into account the wider environmental costs involved. However, a balanced approach must ensure that the wider economic benefits are included too.
00 Foreword
Investment in aviation helps to open a country’s economy to global markets and op-portunities. It can lead to an improvement in its long-term economic performance.
01 Executive Summary
Air transport can play a key role in economic development and in supporting long-term economic growth. It facilitates a country’s integration into the global economy, providing direct benefits for users and wider economic benefits through its positive impact on productivity and growth.Economic growth is determined by the resources available to a nation – in the form of labour, energy, materials and capital – and the productive way in which these resources are used. Productivity can vary according to a number of factors, the most important of which are generally considered to be education, research and development and the level of capital assets available to each worker. However, this report provides new evidence that connections to the global air transport network – and the advantages these provide for businesses – create a key infrastructure asset that enhances productivity, and improves economic performance.
SCOPE OF THE REPORTA previous report by IATA 1 highlighted the significant wider economic benefits that are created through improved links to the global air transport network. Its survey of firms in five different countries showed the importance of good air transport links for a firm’s sales, efficiency and investment. It also included a high-level statistical analysis of the links between connections to the global network and economic growth in the European Union. This report takes the previous analysis a step further.
IATA worked closely with InterVISTAS Consulting to develop a detailed statistical analysis of the relationship between a country’s connectivity to the global air transport network and its level of productivity. The analysis encompasses a wide range of 48 countries – including both developed and developing economies – and across a ten-year period, 1996 to 2005. The results are applied to specific investment examples to show the significant wider economic returns that can be created through the development of aviation infrastructure.
1 IATA (2006), “Airline Network Benefits”, available at www.iata.org/economics.

CONNECTIVITY AND PRODUCTIVITYGlobal economic growth is a key driver of growth in air traffic demand. However, while air traffic demand has increased as economies have grown, air transportation itself can be a key cause and facilitator of economic growth. Not only is the aviation industry a major industry in its own right, employing large numbers of highly skilled workers, but more importantly it an essential input into the rapidly growing global economy. Greater connections to the global air transport network can boost the productivity and growth of economies by providing better access to markets, enhancing links within and between businesses and providing greater access to resources and to international capital markets.
01 - Aviation Economic Benefits 05
This report analyses the relationship between connectivity and productivity. Aviation connectivity is a measure which reflects the range and economic importance of destinations, the frequency of service and the number of onward connections available through each country’s aviation network. Based on an analysis of 48 countries over nine years, there appears to be a strong positive link between higher connectivity to the global network – as a proportion of GDP – and labour productivity (see Chart 1). Developing or transition economies are typically at the bottom left of the chart. They have low connectivity relative to their GDP and also relatively low labour productivity. At the top right of the chart are the developed Asian, North American and European economies with high levels of connectivity and labour productivity.
Chart 1: Labour Productivity vs Connectivity/GDP
Among developing economies there appears to be a clear positive relationship between higher levels of connectivity and higher levels of labour productivity, and hence higher GDP and living standards. For developed countries, there appears to still be a positive relationship, but with smaller incremental impacts once a threshold level of connectivity as a proportion of GDP is reached.
Table 1: Economic Rates of Return from Aviation Investment
THE ECONOMIC RATE OF RETURN OF AVIATION INVESTMENTThe report uses statistical results to estimate the economic rate of return of a few examples of aviation investment projects. These examples demonstrate that investment in aviation can create a significant economic rate of return. These returns are in addition to the direct returns earned by investors and users.
For example, an investment of C$1,805 million at Vancouver airport was estimated to have led to a 5.4% increase in connectivity for Canada as a whole. As such, this raised Canada’s long-term productivity by 0.04%. Assuming that the number of hours worked remains constant, this implies an annual boost to Canadian GDP of C$348 million (an economic rate of return of 19.3%).
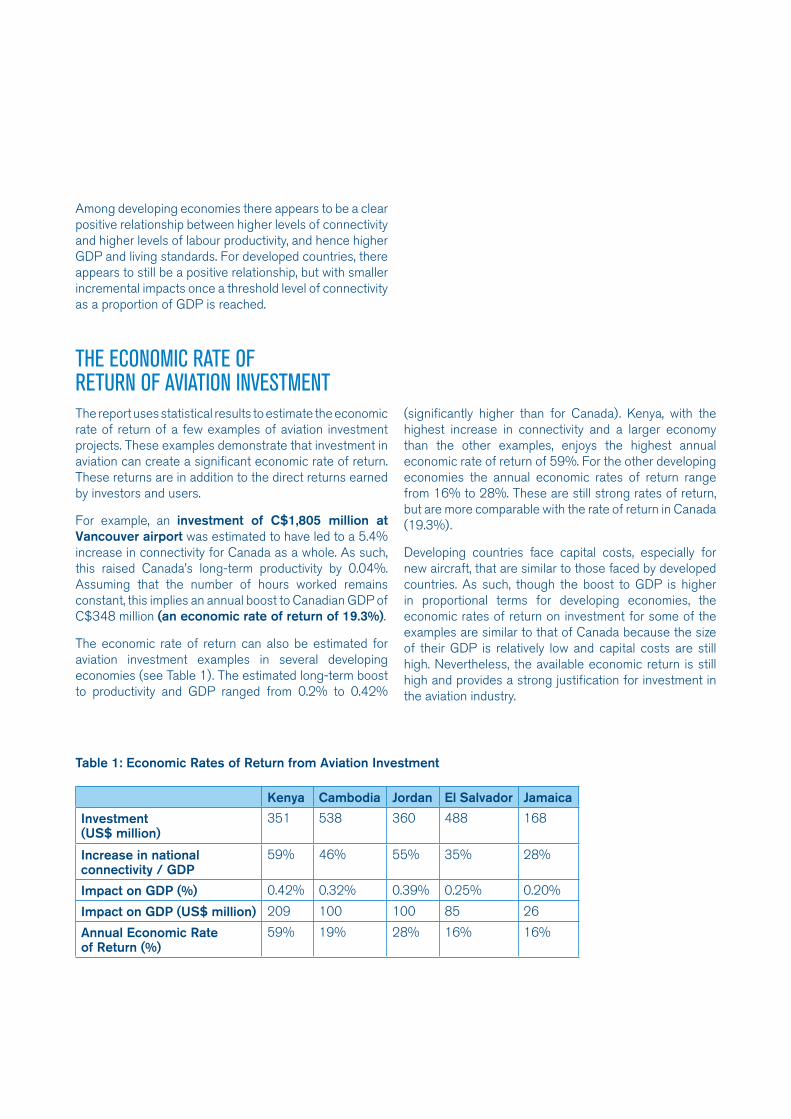
The economic rate of return can also be estimated for aviation investment examples in several developing economies (see Table 1). The estimated long-term boost to productivity and GDP ranged from 0.2% to 0.42%
(significantly higher than for Canada). Kenya, with the highest increase in connectivity and a larger economy than the other examples, enjoys the highest annual economic rate of return of 59%. For the other developing economies the annual economic rates of return range from 16% to 28%. These are still strong rates of return, but are more comparable with the rate of return in Canada (19.3%).
Developing countries face capital costs, especially for new aircraft, that are similar to those faced by developed countries. As such, though the boost to GDP is higher in proportional terms for developing economies, the economic rates of return on investment for some of the examples are similar to that of Canada because the size of their GDP is relatively low and capital costs are still high. Nevertheless, the available economic return is still high and provides a strong justification for investment in the aviation industry.
Kenya Cambodia Jordan El Salvador Jamaica
Investment(US$ million)
351 538 360 488 168
Increase in national connectivity / GDP
59% 46% 55% 35% 28%
Impact on GDP (%) 0.42% 0.32% 0.39% 0.25% 0.20%
Impact on GDP (US$ million) 209 100 100 85 26
Annual Economic Rate of Return (%)
59% 19% 28% 16% 16%

2 T.M. Harchaoui and F. Tarkhani (2004), “Whatever Happened to U.S.-Canada Economic Growth and Productivity Performance in the Information Age?”, Statistics Canada Research Paper.
01 - Aviation Economic Benefits 07
ESTIMATING THE RELATIONSHIP BETwEEN CONNECTIVITY AND PRODUCTIVITY GROwTHAn econometric model was used to derive the rela-tionship between connectivity and labour productivity (see Annex A). The model identifies and quantifies the relationship between connectivity and productivity while controlling for other factors that may influence pro-ductivity, such as education levels, research and devel-opment, capital spending, institutional and regulatory factors. Assuming input levels remain fixed, a 1% increase in productivity translates into a 1% increase in long-run GDP
The key results derived from the statistical model are:
A positive link between connectivity and productivity. The model shows that connectivity has a statistically significant relationship with labour productivity levels. It shows that a 10% rise in connectivity, relative to a country’s GDP, will boost labour productivity levels by 0.07%.
A greater impact for developing countries. The relationship between connectivity and productivity is logarithmic (i.e. based on percentage changes in both values), rather than linear. This suggests that investments in air transport capacity in developing or transition countries, where connectivity is currently relatively low, will have a much larger impact on their productivity and economic success than a similar level of investment in a relatively developed country.
Capital investment has the greatest impact on productivity. Investments in the overall capital stock are shown to have a strong positive impact on productivity levels. A 1% rise in capital spending per worker is found to increase labour productivity by 0.37%.
•
•
•
A positive impact from R&D. A higher level of expenditure on research and development is shown to have a positive impact on productivity. R&D helps to develop new production methods and knowledge, allowing more output to be produced from a similar level of inputs.
Other factors can constrain productivity in some countries. For developed countries (e.g. the US and UK) there is little difference in productivity levels beyond those that are explained by differences in capital spending, education, R&D and connectivity. However, for some developing countries (e.g. India) the country specific indicator highlights other factors (i.e. institutional or social) that can act as a constraint on productivity.
•
•
The results are consistent with previous studies undertaken for the telecoms and IT industries. Air transportation has a smaller impact on productivity than the Information and Communications Technology (ICT) sector, where a 10% increase in ICT investment can lead to a 0.5-1.2% increase in productivity 2 . However, this is to be expected, as investment in ICT has been substantial and has acted as a key driver of productivity growth over the last 25 years. The impact of investment in aviation is lower, but is still high and can provide significant additional economic benefits.
The estimated impact for aviation connectivity is lower than estimated in the previous IATA report on Airline Network Benefits. This analysis looked just at EU economies and found a 10% rise in connectivity, relative to a country’s GDP, boosted total factor productivity by 0.9%. By adopting a high-level, top-down approach, the estimates in the previous study may have picked-up some of the additional impacts associated with wider investment or country-specific factors. The analysis adopted in this report uses a more comprehensive database across a wider range of countries, allowing for a bottom-up approach that can more closely identify the impact of each individual variable. Nevertheless, it shows investment in aviation can deliver economic rates of return that are much higher than for many other public or private investments.

KEY POLICY IMPLICATIONSThis report provides new evidence that greater con-nections to the global air transport network can boost a country’s productivity and economic performance. These results lead to the following key implications for aviation policy makers:
1. Investment in aviation can generate significant wider economic benefits
There are significant and positive benefits generated by investment in aviation, particularly in developing economies. By increasing a country’s connections to the global air transport network, investment in aviation can boost productivity and economic growth.
2. Wider economic benefits must be included in policy appraisals
The wider economic benefits available from investment in aviation infrastructure and services should be included in any project appraisal. If these benefits are excluded, it will underestimate the potential social and economic gains from a project and could see much-needed investment projects either delayed or not undertaken. The wider social and environmental costs of aviation investment are rightly included in a project appraisal – but the wider economic benefits also need to be included if the appraisal is to be balanced and comprehensive.
3. Liberalisation can also help to support greater connectivity
Airline liberalisation can further increase demand and ensure that the services providing increased connectivity are sustainable over the long-term. It provides the commercial freedom necessary for airlines to adjust capacity appropriately to meet changes in market demand. By way of example, the growth in air services between Poland and the UK since 2003 has increased connectivity as a proportion of GDP by 27% for Poland, whereas the increase in the already well-served UK was a much smaller 0.5%. These changes provide an estimated long-term boost to Poland’s productivity of US$634 million per annum. The UK also benefited, with an estimated boost to its GDP of US$45 million per annum.
4. The wider economic benefits help to boost competitiveness
Greater aviation connectivity – and the improvements in productivity and GDP growth it can provide – can also help to boost a country’s competitiveness. By way of illustration, the World Economic Forum (WEF) has developed a Global Competitiveness Index for the travel and tourism sector 3. The WEF’s index incorporates many of the factors necessary to develop connectivity and create wider economic benefits in terms of productivity and economic growth. There is a clear positive relationship between a country’s connectivity and its performance in the WEF index.
3 See WEF (2007), “The Travel & Tourism Competitiveness Report 2007: Furthering the Process of Economic Development”

3 See WEF (2007), “The Travel & Tourism Competitiveness Report 2007: Furthering the Process of Economic Development”

02 Report OutlineAccess to the global air transport network is a key infrastructure asset for any country. It has a positive influence on economic development and growth.

This report provides new evidence of the positive impact that greater connections to the global air transport network can have on a country’s economic performance. IATA worked closely with InterVISTAS Consulting to develop a detailed statistical analysis of the relationship between a country’s connectivity to the global air transport network and its level of productivity. The analysis is across a wide range of countries – including both developed and developing economies – and across a ten-year period, 1996 to 2005. The results are applied to specific investment examples to show the significant wider economic returns that can be created through the development of aviation infrastructure.
Productivity and economic growth
Chapter 3 discusses the importance of productivity improvements for long-term economic performance. It outlines how improvements in productivity (i.e. using less resources to produce the same output or producing more output with the same level of resources) are central to the long-term competitiveness and expansion in productive potential of an economy.
Measuring connectivity
Chapter 4 outlines how a country’s connections to the global air transport network can be defined and measured. It compares the level of connectivity across a range of countries, both in absolute terms and as a proportion of GDP levels.
The links between connectivity and economic growth
Chapter 5 shows the key results from the statistical analysis of the relationship between connectivity, productivity and long-term economic growth. It shows how increasing connectivity can have a positive effect on productivity and growth, with the greatest potential impact among developing economies.
The economic return on aviation investment
Chapter 6 applies the key results to examples of investment in aviation infrastructure in several countries. It demonstrates how a positive and significant economic rate of return – over and above that earned by direct users – can be generated through investment.
Policy implications
Chapter 7 discusses how aviation investment and other policies can be used as a central part of a country’s economic development strategy. Greater connectivity can provide significant benefits, for users, firms and the wider economy.
Chapter 8 provides a summary and conclusions.
02 - Aviation Economic Benefits 11

03 Productivity and Economic Growth Increases in labour and total factor
productivity are key components of long-term improvements in economic standards and growth. They allow an economy to use existing resources more effectively and to expand its productive potential.

THE IMPORTANCE OF PRODUCTIVITYProductivity is a general term referring to the amount of economic output (i.e. goods and services) generated by a given quantity of inputs. These inputs, or factors of production, can include labour, capital, energy and materials. Productivity growth refers to the ability to produce the same amount of output using fewer inputs, or to produce more output using the same amount of inputs.
Economic growth and living standards are strongly driven by a country’s productivity. Knowledge, institutions and assets that enable a nation to produce more from its own supply of labour, energy, materials and past savings will directly raise living standards and economic growth. Improved productivity is the key to sustaining and improving higher standards of living. For example, Paul Krugman, professor of economics at Princeton University, argues that:
“Productivity isn’t everything, but in the long run it is almost everything. A country’s ability to improve its standard of living over time depends almost entirely on its ability to raise its output per worker. In the US, World War II veterans came home to an economy that doubled its productivity over the next 25 years; as a result, they found themselves achieving living standards their parents had never imagined. Vietnam veterans came home to an economy that raised its productivity less than 10 percent in 15 years; as a result, they found themselves living no better - and in many cases worse - than their parents. 4”
Productivity growth is also the key to long-term economic growth. It is the means by which countries can be lifted out of poverty and generate wealth and economic security, for example:
“Over long periods of time, small differences in rates of productivity growth compound, like interest in a bank account, and can make an enormous difference to a society’s prosperity. Nothing contributes more to reduction of poverty, to increases in leisure, and to the country’s ability to finance education, public health, environment and the arts. 5”
Therefore, factors that contribute to an improvement in productivity levels also have a direct impact in terms of increasing the long-run productive potential of an economy, to the benefit of all stakeholders in the economy. For example, if increased air service levels increase productivity by 1% then, assuming input levels remain fixed, long-run economic output (GDP) will also increase by 1%.
MEASURING PRODUCTIVITYProductivity can be measured in several ways, though the most cited and widely recognised measure is labour productivity. This is the ratio of output produced to the amount of labour input used in its production. It is calculated as:
Labour productivity =
Output level / Number of labour hours
For an individual country, output is typically measured by its level of GDP. If data on the total number of labour hours worked is not available, the total number of people in employment is used instead.
Labour productivity has its strengths and weaknesses as a performance measure. At the national, macroeconomic level, labour productivity is a key driver of higher per capita incomes. It is viewed as the critical measure of economic performance. However, at the level of an individual firm, the maximisation of labour productivity may not always be the optimal approach. For example, by making enormous and expensive investments in technology, firms can achieve higher levels of labour productivity (e.g. by replacing labour with capital, but still delivering the same level of output). But if the higher annual capital costs are greater than the cost savings achieved from lower labour levels, the firm may be worse off overall.
4 Paul Krugman 1992, The Age of Diminished Expectations: US Economic Policy in the 1980s, MIT Press, Cambridge, p. 9.5 Alan Blinder and William Baumol 1993, Economics: Principles and Policy, Harcourt Brace Jovanovich, San Diego, p. 778.
03 - Aviation Economic Benefits 13
Therefore, an alternative productivity measure can be used, called Total Factor Productivity (TFP), that considers not only the productivity of labour but also the use of capital, energy and other materials. It is the ratio of output to a measure of the total inputs used in producing an amount of output. It is calculated as:
Total Factor Productivity (TFP) =
Output level / Aggregate input quantity index
The aggregate input quantity index adds up all of the factors of production that are used to produce the level of output. However, while TFP is a more comprehensive measure, it is more difficult to measure. As such, only a few countries regularly report TFP calculations, with no estimates available for the level of TFP in many countries. There are two main reasons for this:
Firstly, the process for calculating TFP is fairly complex. Labour productivity can be measured by a simple ratio of output to labour hours. However, TFP requires greater data requirements across a wide range of input values, several of which can be difficult to measure.
Secondly, economists and accountants differ significantly in how they measure capital inputs. Accountants adopt a depreciation policy and record interest payments and capital rentals. Economists believe that this under-represents the amount of capital actually used by a firm or by an economy. The depreciation policy (e.g. straight-line depreciation) may reflect the level of depreciation across the asset life, but may not accurately reflect the actual amount of depreciation at a point in time. In addition, accoun- tants do not measure the cost of equity capital or how taxation can affect the cost of capital.
•
•
As a result, many governments (or their statistical agencies) only collect and report data on labour productivity and other productivity measures based on a single input factor.
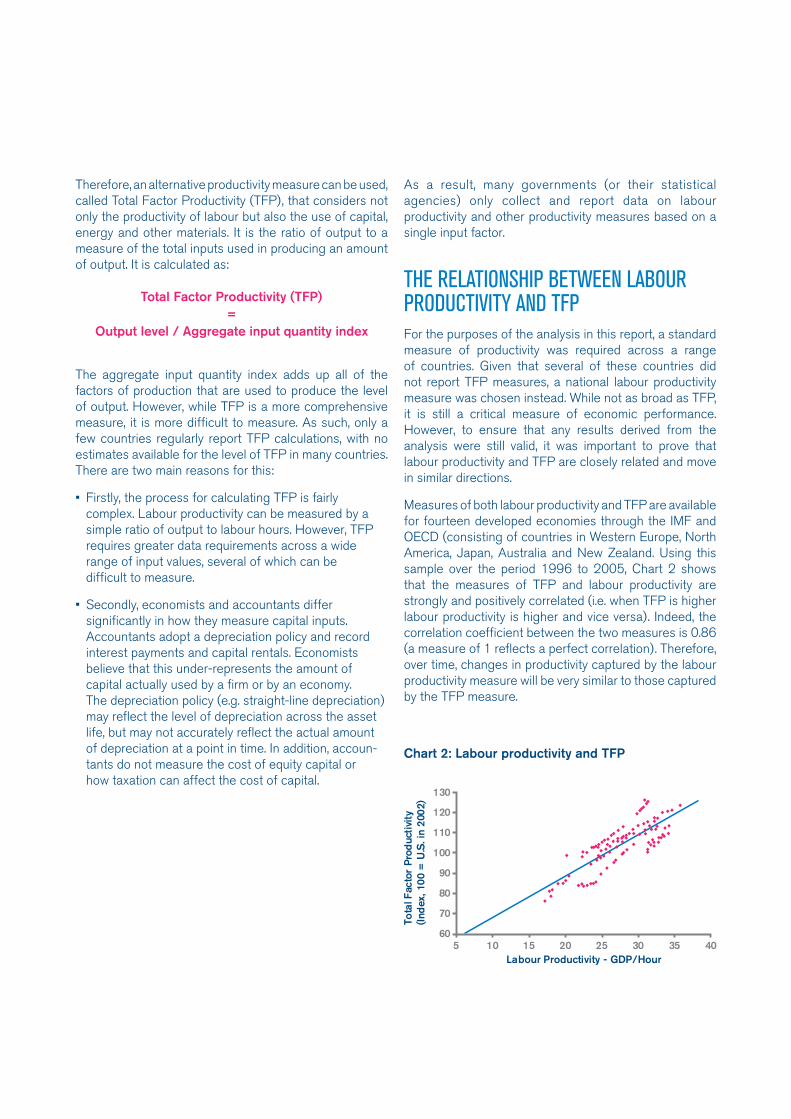
THE RELATIONSHIP BETwEEN LABOUR PRODUCTIVITY AND TFP For the purposes of the analysis in this report, a standard measure of productivity was required across a range of countries. Given that several of these countries did not report TFP measures, a national labour productivity measure was chosen instead. While not as broad as TFP, it is still a critical measure of economic performance. However, to ensure that any results derived from the analysis were still valid, it was important to prove that labour productivity and TFP are closely related and move in similar directions.
Measures of both labour productivity and TFP are available for fourteen developed economies through the IMF and OECD (consisting of countries in Western Europe, North America, Japan, Australia and New Zealand. Using this sample over the period 1996 to 2005, Chart 2 shows that the measures of TFP and labour productivity are strongly and positively correlated (i.e. when TFP is higher labour productivity is higher and vice versa). Indeed, the correlation coefficient between the two measures is 0.86 (a measure of 1 reflects a perfect correlation). Therefore, over time, changes in productivity captured by the labour productivity measure will be very similar to those captured by the TFP measure.
Chart 2: Labour productivity and TFP

03 - Aviation Economic Benefits 15
04 Aviation Connectivity
Connectivity measures the access available from a country’s major airports to the global air transport network. It is a qualitative measure of a country’s air transport services, from the point of view of its businesses. The higher the level of connectivity the greater the level of access to the global economy.
MEASURING CONNECTIVITYIATA has developed a connectivity indicator to measure the degree of integration a country has within the global air transport network. It is a measure of the number and economic importance of the destinations served from a country’s major airports, the frequency of service to each destination and the number of onward connections available from each destination. Connectivity increases as the range of destinations increases, the frequency of service increases and/or larger “hub” airport destinations are served.
A connectivity indicator was developed for a range of countries using the SRS Analyser and OAG databases of scheduled airline flights. The countries chosen cover different regions and levels of economic development, split into one of the following categories:
North America and Western Europe:
Austria, Belgium, Canada, Cyprus, Denmark, Finland, France, Germany, Greece, Ireland, Italy, Luxembourg, Malta, Netherlands, Norway, Portugal, Spain, Sweden, Switzerland, United Kingdom, United States.
Developed Asia:
Australia, Japan, New Zealand.
Emerging Europe:
Bulgaria, Czech Republic, Estonia, Hungary, Latvia, Lithuania, Poland, Romania, Russia, Slovakia, Slovenia, Turkey.
Transitioning Asia and South America:
Argentina, Brazil, Chile, Hong Kong, Israel, Korea, Mexico, Singapore.
Emerging Asia and Africa:
China, Egypt, India, South Africa.
The connectivity indicator is based on the number of available seats to each destination served for the first week in July in each year between 1996 and 2005. The number of available seats to each destination are then weighted by the size of the destination airport (in terms of number of passengers handled in each year). The weighting for each destination gives an indication of the economic importance of the destination airport and the number of onward connections it can provide.
•
•
•
•
•
For example, Atlanta airport, as the world’s largest airport, is given a weighting of 1 while Paris CDG airport, which handles 61% of the number of passengers handled by Atlanta, is given a weighting of 0.61. Therefore, if an airport has 1000 seats available to Atlanta it is given a weighted total of 1000. But if also has 1000 seats available to Paris CDG, these are given a weighted total of 610.
The weighted totals are then summed for all destinations (and divided by a scalar factor of 1000) to determine the connectivity indicator. Therefore, the connectivity indicator can be represented as:
∑ (Frequency * Available Seats per Flight * Weighting of destination airport) / 1000
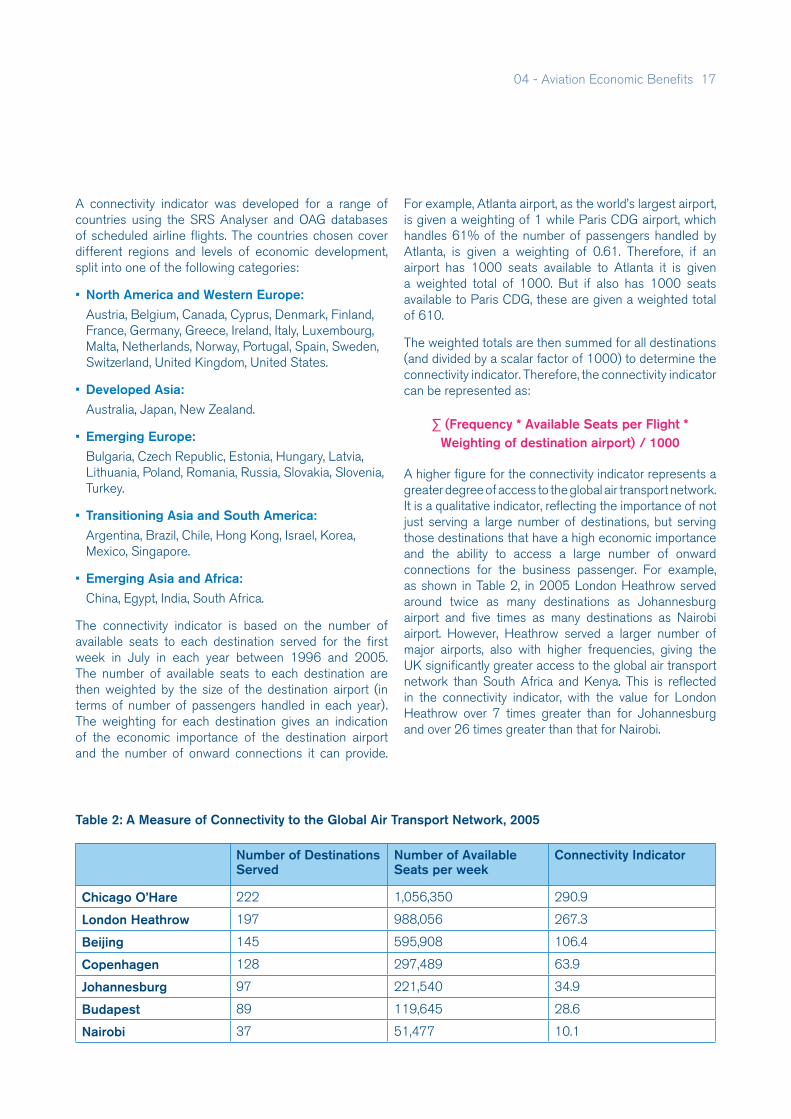
A higher figure for the connectivity indicator represents a greater degree of access to the global air transport network. It is a qualitative indicator, reflecting the importance of not just serving a large number of destinations, but serving those destinations that have a high economic importance and the ability to access a large number of onward connections for the business passenger. For example, as shown in Table 2, in 2005 London Heathrow served around twice as many destinations as Johannesburg airport and five times as many destinations as Nairobi airport. However, Heathrow served a larger number of major airports, also with higher frequencies, giving the UK significantly greater access to the global air transport network than South Africa and Kenya. This is reflected in the connectivity indicator, with the value for London Heathrow over 7 times greater than for Johannesburg and over 26 times greater than that for Nairobi.
Table 2: A Measure of Connectivity to the Global Air Transport Network, 2005
Number of Destinations Served
Number of Available Seats per week
Connectivity Indicator
Chicago O’Hare 222 1,056,350 290.9
London Heathrow 197 988,056 267.3
Beijing 145 595,908 106.4
Copenhagen 128 297,489 63.9
Johannesburg 97 221,540 34.9
Budapest 89 119,645 28.6
Nairobi 37 51,477 10.1
04 - Aviation Economic Benefits 17

CONNECTIVITY BY LOCATIONThe level of connectivity will depend to some extent on the size of a country’s economy and by the number and size of the businesses that are served by its air transport infrastructure. Large economies will naturally have more destinations and available seats, but quantity is not necessarily a measure of quality. A given level of available seats and connectivity will provide a larger opportunity and stimulus to productivity if it is supporting a smaller rather than larger number of businesses. Ten new destinations to economically significant countries are likely to bring more benefit to the business served by Nairobi airport than those already well served by London Heathrow airport. As such, it is the level of connectivity relative to Gross Domestic Product (GDP) is the key measure to be examined in this report in terms of its relationship with productivity and economic growth.
Chart 4: Connectivity per $billion of GDP, 2005.
By way of illustration, Chart 3 shows the connectivity indicator in 2005 for each country within the sample. The United States has by far the highest connectivity, at over five times larger than next most connected country, due in part to the high economic importance of connections within its domestic air network and its strong economic ties and trade links with other regions. In general, large developed countries have the highest connectivity values, while small developing countries have the lowest connectivity values.
By contrast, Chart 4 shows the connectivity indicator in 2005 for each country, divided by its level of GDP. Singapore, Malta, Cyprus and Hong Kong have highest connectivity levels, relative to the size of their economies. The United States, which had the highest absolute connectivity indicator, ranks 26th after adjusting for GDP.
Chart 3: Connectivity by location, 2005.
It is connectivity relative to the size of the economy that matters

04 - Aviation Economic Benefits 19

05 Connectivity and Economic Growth
Greater connectivity to the global air transport network is a key driver of economic development and growth. It connects businesses and people to the global economy, opening up a wider range of economic opportunities.

THE wIDER ECONOMIC BENEFITS OF CONNECTIVITY The wider economic benefits available from air transport are often overlooked in policy and investment appraisals. The benefits of the air transport sector to a country’s economy are often measured in terms of its direct contribution to GDP, through profits and the payments made by airlines for wages and for other inputs. In addition, several appraisals consider the direct and indirect output and employment benefits created along the industry’s supply chain, as well as indirect benefits in other industries from additional expenditure (e.g. the benefits for tourism).
However, in a developed economy close to full employment it could be argued that in the absence of the aviation industry, many of the benefits it creates would be substituted to another industry – that would also employ resources and buy other goods and services – rather
Chart 5: The wider economic impacts of connectivity
Greater Access to the Global Air Transport
Network
Facilitates efficiency improvements
Widens the available market
Higher Revenues
Higher potential returns from investment
Fosters greater competitiveness
Access to a wider base of suppliers
Access to new production techniques
Increases inward and
outward investment
Ability to exploit economies
of scale
than be lost completely. For developing economies, the argument is weaker as many resources are underutilised and would not be substituted to other industries in the absence of aviation.
Nevertheless, the traditional approach to appraisal does not identify and quantify the significant additional economic benefits created by aviation, those that clearly cannot be replicated by other industries in the absence of air transport. These wider benefits relate to the global air transport network and access to it (see Chart 5). Aviation is a key infrastructure asset. It takes business travellers to meet existing and new customers, expanding markets and generating economies of scale and scope. It enables businesses to access the best sources of supply around the world for high value-added materials, components, skills and ideas.
05 - Aviation Economic Benefits 21
A previous report by IATA 6 highlighted the significant wider economic benefits that are created through improved links to the global air transport network. Its survey of firms in five different countries showed the importance of good air transport links for a firm’s sales, efficiency and investment. In particular, greater connections to the air transport network provided potential benefits through:
Facilitating world trade. Air transport connects businesses to a wide range of global markets, providing a significantly larger customer base for their products than would be accessible otherwise. It is particularly important for high-tech and knowledge-based sectors, and suppliers of time-sensitive goods.
Boosting productivity across the economy. By expanding the customer base, air transport allows companies to exploit economies of scale and to reduce unit costs. By exposing domestic companies to increased foreign competition, it also helps to drive efficiency improvements among domestic firms in order to remain competitive.
Improving the efficiency of the supply chain. Several industries rely on air transport to operate their ‘just-in-time’ production operations, providing greater flexibility within the supply chain and reducing costs by minimising the need to hold stocks of supplies.
Enabling inward and outward investment. Access to extensive air transport links allows domestic firms to identify and manage investments in foreign- based assets and encourages foreign firms to invest in the domestic economy.
Acting as a spur to innovation. Extensive air transport links facilitate effective networking and collaboration between companies located in different parts of the globe. Access to a greater number of markets also encourages greater spending on research and development by companies, given the increased size of the potential market for future sales.
These wider ‘supply-side’ benefits can have a positive impact on labour productivity and, therefore, on long-term economic growth. If they are sufficiently significant in size it should be possible to observe a positive relationship between rising economic connectivity and rising labour productivity.
•
•
•
•
•
CONNECTIVITY AND LABOUR PRODUCTIVITYIATA worked closely with InterVISTAS Consulting to develop a detailed statistical analysis of the relationship between a country’s connectivity to the global air transport network and its level of productivity. The analysis is across a wide range of countries, as listed in Chapter 4, and across a ten-year period, 1996 to 2005.
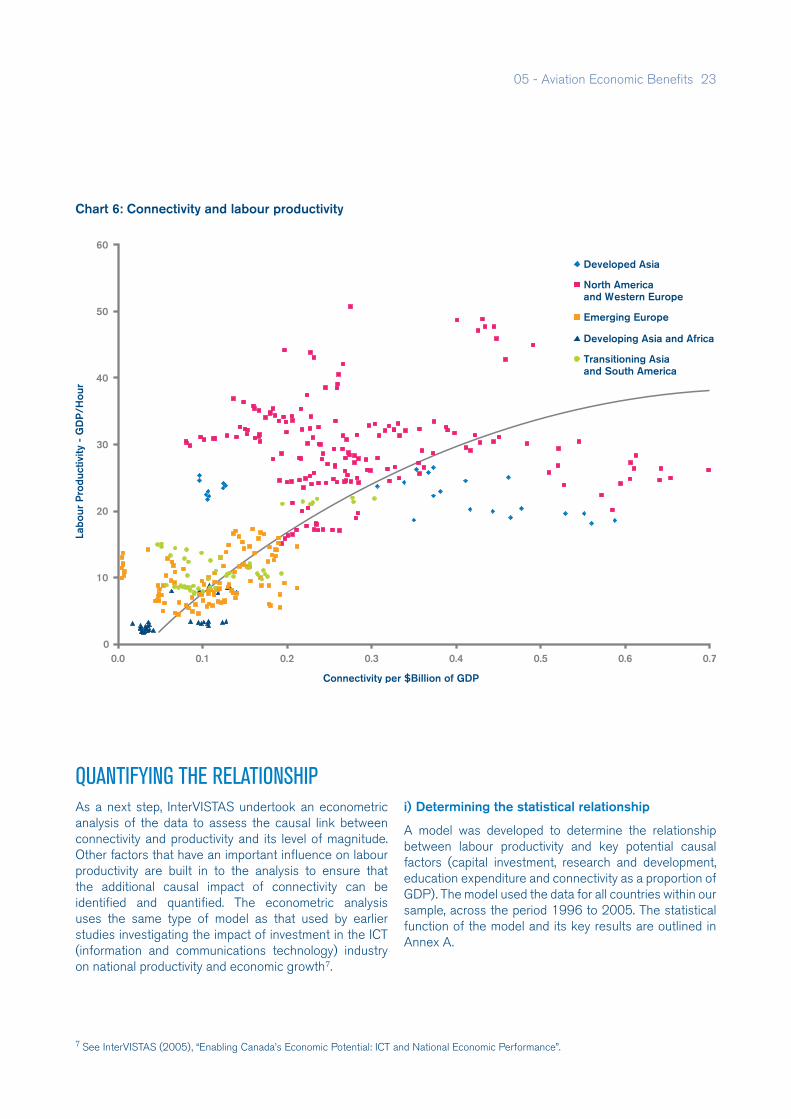
Based on our sample, there appears to be a strong positive link between higher connectivity to the global network – as a proportion of GDP – and labour productivity (see Chart 6). Developing or transition economies are typically at the bottom left of the chart. They have low connectivity relative to their GDP and also relatively low labour productivity. At the top right of the chart are the developed Asian, North American and European economies with high levels of connectivity and labour productivity. Cyprus, Hong Kong, Malta and Singapore have been excluded from the chart because their geographic circumstances (i.e. small island or city states) lead them to have very high levels of connectivity relative to the size of their economies and their populations. The reasons for their high level of connectivity may depend on other factors, such as a strong dependency on international trade (particularly Singapore and Hong Kong), tourism (Malta and Cyprus) or political reasons (Cyprus).
Above a certain level of productivity (US$20 of GDP per labour hour worked) there is a wide spread of connectivity levels. This may well be due to a wider variation in these nations in other factors determining the level of labour productivity. It may also signal that there is a threshold effect above which an increase in the connectivity of already well-connected developed economies has a smaller marginal impact on productivity than it does for developing countries. As such, among developing economies there appears to be a clear positive relationship between higher levels of connectivity and higher levels of labour productivity, and hence higher GDP and living standards. For developed countries, there appears to still be a positive relationship, but with smaller incremental impacts once a threshold level of connectivity as a proportion of GDP is reached.
6 IATA (2006), “Airline Network Benefits”, available at www.iata.org/economics.
QUANTIFYING THE RELATIONSHIP As a next step, InterVISTAS undertook an econometric analysis of the data to assess the causal link between connectivity and productivity and its level of magnitude. Other factors that have an important influence on labour productivity are built in to the analysis to ensure that the additional causal impact of connectivity can be identified and quantified. The econometric analysis uses the same type of model as that used by earlier studies investigating the impact of investment in the ICT (information and communications technology) industry on national productivity and economic growth 7.
i) Determining the statistical relationship
A model was developed to determine the relationship between labour productivity and key potential causal factors (capital investment, research and development, education expenditure and connectivity as a proportion of GDP). The model used the data for all countries within our sample, across the period 1996 to 2005. The statistical function of the model and its key results are outlined in Annex A.
7 See InterVISTAS (2005), “Enabling Canada’s Economic Potential: ICT and National Economic Performance”.
05 - Aviation Economic Benefits 23
Chart 6: Connectivity and labour productivity
The key results derived from the statistical model are:
A positive link between connectivity and productivity. The model shows that connectivity has a statistically significant relationship with labour productivity levels. It shows that a 10% rise in connectivity, relative to a country’s GDP, will boost labour productivity levels by 0.07%.
A greater impact for developing countries. The relationship between connectivity and productivity is logarithmic (i.e. based on percentage changes in both values), rather than linear. This suggests that investments in air transport capacity in developing or transition countries, where connectivity is currently relatively low, will have a much larger impact on their productivity and economic success than a similar level of investment in a relatively developed country.
Capital investment has the greatest impact on productivity. In line with economic theory, investments in the overall capital stock are shown to have a strong positive impact on productivity levels. Higher levels of capital per worker reflect a greater use of technology, allowing a higher level of output to be produced. A 1% rise in capital spending per worker is found to increase labour productivity by 0.37%.
A positive impact from R&D. Also in line with economic theory, a higher level of expenditure on research and development is shown to have a positive impact on productivity. R&D helps to develop new production methods and knowledge, allowing more output to be produced from a similar level of inputs. An increase in R&D spending equivalent to 1% of GDP is found to increase productivity by 0.1%. The indicator for education was also shown to have a positive impact on productivity. However, the indicator was statistically weak, suggesting that its impacts may also be picked up in the R&D and country-specific indicators.
Other factors can constrain productivity in some countries. The model also includes specific indicators for each country that can pick-up any other factors that may have a significant, though localised, impact on productivity. This shows that for developed countries e.g. the US and UK) there is little difference in productivity levels beyond those that are explained by differences in capital spending, education, R&D and connectivity. However, for some developing countries (e.g. India) the country specific indicator highlights other factors (i.e. institutional or social) that can act as a constraint on productivity. In other words, actual productivity is less than would be expected from the current level of capital spending, R&D, education and connectivity due to other constraining factors.
•
•
•
•
•
ii) Determining the causality of the relationship
The next step of the analysis was to determine that, though there is a positive link between connectivity and productivity, it is greater connectivity that causes greater productivity and not vice versa. A Granger causality test was undertaken, details of which are outlined in Annex A.
The analysis found that there was no evidence that changes in productivity directly cause changes in connectivity, a finding that would undermine the statistical relationship found above. However, it was also unable to provide conclusive evidence that the direction of causality is solely from changes in connectivity directly causing changes in productivity. To some extent, the test may be affected by the connectivity indicator being expressed as a proportion of GDP – in other words changes in productivity and GDP are already reflected in the indicator itself.
However, the results of the test may also demonstrate the dynamic, virtuous cycle benefits available from higher connectivity. As such, an increase in connectivity can initially lead to improved productivity and higher GDP. As the economy grows, it is able to support a larger air transport sector, which itself encourages further increases in connectivity, providing a second round of positive effects for productivity and GDP. Increasing air transport links can therefore not only provide an initial benefit but can also act as a catalyst for further productivity and economic growth.

COMPARING THE RESULTSThe analysis estimates that a 10% increase in the level of connectivity to the global air transport network (relative to GDP) can produce a long-term increase in productivity – and ultimately GDP – of 0.07% per annum. Therefore, for many countries, especially developing economies, investment in air transport infrastructure and services can offer a significant and sustainable boost to economic growth and development.
The results are consistent with similar studies for other industries. They suggest that air transportation has a smaller impact on productivity than the Information and Communications Technology (ICT) sector, at least over the last 20-25 years. For example, a study by Statistics Canada 8 estimates that each 10% increase in ICT investment led to 0.5-1.2% increase in productivity between 1981 and 2000. However, this is to be expected. Investment in ICT has been substantial over the last 25 years and has acted as a key driver of productivity growth. Its impact is picked-up in our statistical model through the capital investment and country specific indicators.
However, the estimated impact of the econometric model in this report is lower than the higher-level statistical analysis undertaken in the previous IATA report on Airline Network Benefits. This estimated that, for European countries, a 10% increase in connectivity could lead to a boost to long-term growth of up to 0.9%. This previous analysis highlighted the positive impact that connectivity can have, but may have over-estimated its impact due to constraints on the available data. By adopting a high-level, top-down approach, the estimates in the previous study may have picked-up some of the additional impacts associated with wider investment or country-specific factors. The analysis adopted in this report uses a more comprehensive database across a wider range of countries, allowing for a bottom-up approach that can more closely identify the impact of each individual variable. Nevertheless, it shows investment in aviation can deliver economic rates of return that are much higher than for many other public or private investments.
8 T.M. Harchaoui and F. Tarkhani (2004), “Whatever Happened to U.S.-Canada Economic Growth and Productivity Performance in the Information Age?”, Statistics Canada Research Paper.
05 - Aviation Economic Benefits 25
There is a statistically significant and positive link between connectivity, productivity and long-term economic growth.
06 Investment Examples
Investment in aviation infrastructure and services can provide a significant economic rate of return. These returns benefit the performance and growth of the national economy.

This chapter applies the estimated impact of connectivity on productivity and GDP to a few investment examples. It shows that investment in aviation can create a significant economic rate of return. These returns are in addition to the direct returns earned by investors and users. Individual investment projects will also have separate rates of return to air carriers and airports through increased profitability (e.g. reduced engine idling time due to fewer delays at the airport, lower unit operating costs at the airport from the application of new technologies).
VANCOUVER INTERNATIONAL AIRPORTThe expansion of Vancouver International Airport (YVR) in Canada provides a practical example of the positive economic rate of return available from investing in air transport infrastructure.
Between 1995 and 2000 the airport authority at YVR made substantial investments in terminals, runways and other infrastructure in order to increase the capacity of the airport. The investment in capacity helped to stimulate demand and to facilitate and support additional traffic arising from the liberalisation of air services between Canada and the US in 1995.
The total investment in new infrastructure and services was C$1,805 million (at 2005 prices) consisting of:
A net investment in YVR’s airport infrastructure – after allowing for some replacement investment – of C$506 million.
An estimated investment in new aircraft of C$1,280 million. To handle the increase in passenger demand (an additional 4 million passengers per annum) airlines needed to invest in new aircraft. It is difficult to isolate the specific airline investment, but assuming a 5% increase in load factors, the increase in passengers would need to be supported by an extra 8 aircraft (with an average of 200 seats) flying an average of 4 flights a day.
An investment by the Canadian federal government of C$19 million on a new air traffic control tower in 1996.
•
•
•
The investment of C$1,805 million was associated with a 25% rise in the connectivity of YVR, relative to GDP, and a 5.4% increase in connectivity for Canada as a whole. Using the results from chapter 5, where a 10% increase in the connectivity indicator leads to a 0.07% increase in productivity, meant that the investment at Vancouver raised Canada’s long-term productivity by 0.04%. Assuming that the number of hours worked remains constant, this percentage can be applied to the level of GDP in Canada to derive an annual return. Canada’s GDP in 2005 was C$969 billion, implying a long-term boost to Canadian GDP of C$348 million per annum (i.e. C$969 billion multiplied by 0.04%).
Therefore, the investment at YVR produced a significant annual economic rate of return of 19.3% (i.e. C$348 million divided by the investment of C$1,805 million). This represents a significant and positive wider economic benefit from the investment. In addition, the rate of return does not include the direct benefits to passengers of the added services or any increase in profits for the airport or airlines. The total economic rate of return of the investment would be considerably higher.
EXAMPLES FROM DEVELOPING ECONOMIESApplying a similar methodology, the economic rate of return can also be estimated for aviation investment examples in several developing economies (see Table 3). These estimates are based on capital investment programmes at the major international airport (sourced from the Airports Council International) of each country between 2000 and 2005 and estimates have been made of the new aircraft required, based on the increase in seat capacity at the airport between 2000 and 2005, using 200-seat aircraft with a list price of US$150 million.
Between 2000 and 2005, connectivity relative to GDP increased by between 28% and 59% across the five countries. As such, the estimated long-term boost to productivity and GDP ranged from 0.2% to 0.42%. This impact is substantially larger than that of the Canadian example (0.04%), demonstrating the higher marginal effects that are available from increased connectivity in developing economies.
06 - Aviation Economic Benefits 27
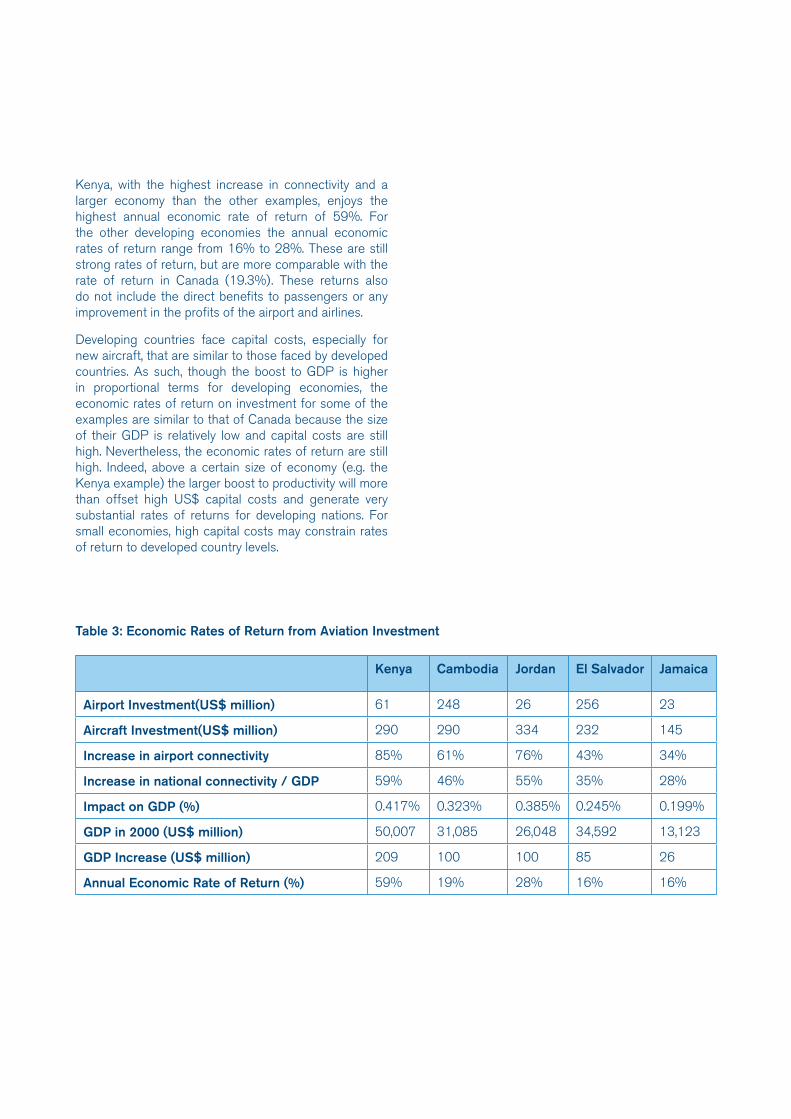
Kenya, with the highest increase in connectivity and a larger economy than the other examples, enjoys the highest annual economic rate of return of 59%. For the other developing economies the annual economic rates of return range from 16% to 28%. These are still strong rates of return, but are more comparable with the rate of return in Canada (19.3%). These returns also do not include the direct benefits to passengers or any improvement in the profits of the airport and airlines.
Developing countries face capital costs, especially for new aircraft, that are similar to those faced by developed countries. As such, though the boost to GDP is higher in proportional terms for developing economies, the economic rates of return on investment for some of the examples are similar to that of Canada because the size of their GDP is relatively low and capital costs are still high. Nevertheless, the economic rates of return are still high. Indeed, above a certain size of economy (e.g. the Kenya example) the larger boost to productivity will more than offset high US$ capital costs and generate very substantial rates of returns for developing nations. For small economies, high capital costs may constrain rates of return to developed country levels.
Table 3: Economic Rates of Return from Aviation Investment
Kenya Cambodia Jordan El Salvador Jamaica
Airport Investment(US$ million) 61 248 26 256 23
Aircraft Investment(US$ million) 290 290 334 232 145
Increase in airport connectivity 85% 61% 76% 43% 34%
Increase in national connectivity / GDP 59% 46% 55% 35% 28%
Impact on GDP (%) 0.417% 0.323% 0.385% 0.245% 0.199%
GDP in 2000 (US$ million) 50,007 31,085 26,048 34,592 13,123
GDP Increase (US$ million) 209 100 100 85 26
Annual Economic Rate of Return (%) 59% 19% 28% 16% 16%


07 Policy Implications
An increase in connectivity can create substantial long-term economic benefits, for both developed and developing economies. Delivering these benefits requires investment and other policy support, such as market liberalisation.
CONNECTIVITY AND INVESTMENT APPRAISALThe wider economic benefits available from investment in aviation infrastructure and services should be included in any project appraisal. If these benefits are excluded, it will underestimate the potential social and economic gains from a project and could see several much-needed investment projects either delayed or not undertaken. The wider social and environmental costs of aviation investment are rightly included in a project appraisal – but the wider economic benefits also need to be included if the appraisal is to be balanced and comprehensive.
This report sets out a framework for wider economic benefits to be included, based upon the impact that improvements in connectivity can have on productivity and economic growth. It demonstrates the significant and positive benefits that can be associated with investment in aviation, particularly in developing economies. It provides a statistically significant estimate of the impact of connectivity on productivity. Further research in this area can help to develop the analysis.
CONNECTIVITY AND LIBERALISATIONInvestment in aviation infrastructure and services can increase connectivity and help to stimulate traffic demand. However, other policies may also be required to further increase demand and to ensure that the services providing increased connectivity are sustainable over the long-term. In particular, liberalisation of operational and ownership constraints on the airline industry can generate demand and provide the commercial freedom necessary for airlines to adjust capacity appropriately to meet changes in market demand.
A recent report by IATA highlighted the potential benefits available from further liberalisation of international aviation 9. Governments and industry stakeholders must work together to reform the outdated rules that continue to constrain the airline industry. Greater commercial freedom will allow airlines to offer new services and routes, boosting both the overall air transport network and the connections of individual countries to this network.
By way of example, the accession of Poland to the EU in 2004 provided access to the liberalised EU Open Aviation Area. One result of this was an increase in the number of air connections between Poland and the UK. This provided positive wider economic benefits to both countries, with particular benefits for the emerging economy, Poland. Between June 2003 and June 2006 the number of flights a week between the two countries increased from 58 to 250 (and available seats rose from 7,000 to 40,000). In terms of connectivity as a proportion of GDP, this represented a 27% increase for Poland, whereas the increase in the already well-served UK was a much smaller 0.5%. Applying the results from the statistical analysis, the estimated long-term boost to Poland’s productivity and GDP was 0.19% (US$634 million per annum). The UK also benefited, with an estimated 0.004% boost to its GDP (US$45 million per annum).
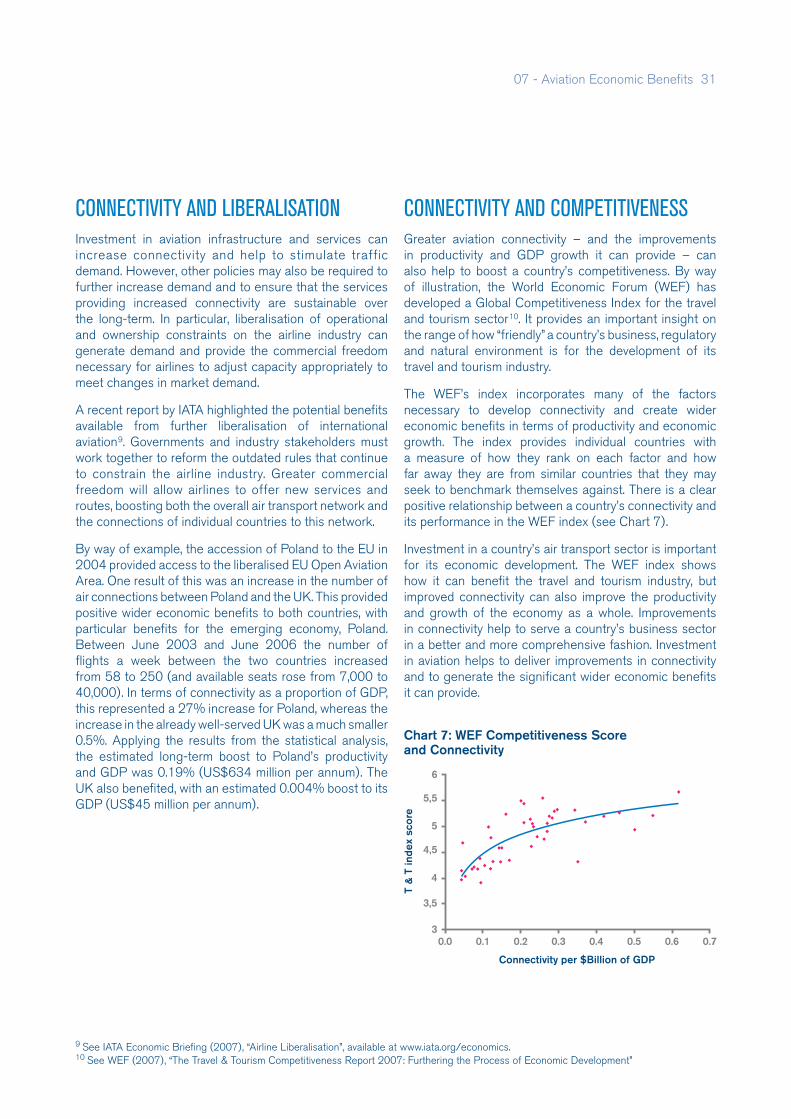
CONNECTIVITY AND COMPETITIVENESSGreater aviation connectivity – and the improvements in productivity and GDP growth it can provide – can also help to boost a country’s competitiveness. By way of illustration, the World Economic Forum (WEF) has developed a Global Competitiveness Index for the travel and tourism sector 10. It provides an important insight on the range of how “friendly” a country’s business, regulatory and natural environment is for the development of its travel and tourism industry.
The WEF’s index incorporates many of the factors necessary to develop connectivity and create wider economic benefits in terms of productivity and economic growth. The index provides individual countries with a measure of how they rank on each factor and how far away they are from similar countries that they may seek to benchmark themselves against. There is a clear positive relationship between a country’s connectivity and its performance in the WEF index (see Chart 7).
Investment in a country’s air transport sector is important for its economic development. The WEF index shows how it can benefit the travel and tourism industry, but improved connectivity can also improve the productivity and growth of the economy as a whole. Improvements in connectivity help to serve a country’s business sector in a better and more comprehensive fashion. Investment in aviation helps to deliver improvements in connectivity and to generate the significant wider economic benefits it can provide.
9 See IATA Economic Briefing (2007), “Airline Liberalisation”, available at www.iata.org/economics.10 See WEF (2007), “The Travel & Tourism Competitiveness Report 2007: Furthering the Process of Economic Development”
Chart 7: WEF Competitiveness Score and Connectivity
07 - Aviation Economic Benefits 31

08 SummaryGreater connections to the global air transport network can produce a virtuous cycle for a country’s economy. Improved links can stimulate higher productivity and GDP, which in turn further helps to support a country’s aviation industry.

This report provides new statistical evidence on the relationship between the quality of a country’s air links (as represented by its connections to the global network) and its economic performance. It shows that:
Investment in aviation can generate a significant economic rate of return. This return is in addition to the direct returns received by investors and users. High annual economic returns of around 20% are estimated for several examples, implying a full economic return on investment within five to six years. For larger developing economies the economic rate of return can be even higher.
There is a statisticallly significant and positive link between connectivity and productivity. A 10% increase in connectivity, relative to GDP, can increase long-term productivity levels by 0.07%.
•
•
Sustainable growth – not artificial constraints – is the best way to maximise the benefits of the aviation industry for all countries.
08 - Aviation Economic Benefits 33
Increases in connectivity can have a higher marginal impact for developing countries. Investment in air transport capacity in developing or transition countries, where connectivity is currently relatively low, will have a much larger impact on their productivity and economic success than a similar level of investment in a relatively developed country.
Improvements in connectivity can potentially create a virtuous cycle for an economy. An increase in connectivity can initially lead to improved productivity and higher GDP. As the economy grows, it is able to support a larger air transport sector, which itself encourages further increases in connectivity, providing a second round of positive effects for productivity and GDP.
•
•
The report highlights the wider economic benefits that are available through investment in air transport infrastructure and other policies that enable the industry to grow in a sustainable and environmentally responsible manner Governments and other stakeholders should recognise these additional benefits and account for them within aviation policy appraisals.

ANNEX A: THE ECONOMETRIC MODEL
InterVISTAS developed an econometric model to estimate the impact of changes in connectivity and in other factors on labour productivity levels within the sample database. The statistical form of the model, estimated from data covering the period 1996 to 2005, is:
Ln(Labour Productivity)
=
Constant
+ a1 * Ln(Connectivity/GDP)
+ a2 * %R&D
+ a3 * %Education
+ a4 * Ln(GFCF/Worker)
+ a5 * Country dummy variables
where:
Ln refers to a loge functional form in which parameters ai can be read as elasticities
Labour productivity is measured by GDP divided by total hours worked, in constant US$ converted at purchasing power parity
%R&D is the amount of research and development expenditure in a country as a percentage of GDP
%Education is the amount of public spending on education as a percentage of GDP
GFCF/Worker is gross fixed capital investment per worker. It is a measure of the change of capital deepening in a country, measuring the flow rather than the stock of investment.
Country dummy variables are relative to the US, capturing any remaining structural reasons for productivity differences across countries.
The results of the model are shown in Table A1. Of the main variables, only the %Education variable is not statistically significant at a 95% confidence level. This may be due, in part, to its impact being partly captured by the country specific variables. The largest impact on productivity comes from GFCF/Worker. A 1% rise in capital spending per worker will increase labour productivity by 0.37%. The connectivity indicator is both statistically significant and positive. A 10% increase in connectivity will increase labour productivity by 0.07%.
A Granger causality test was also undertaken on the relationship between connectivity and labour productivity. This is a technique for determining whether one time-series causes changes in another or vice versa. A time series X is said to Granger-cause Y if it can be shown, through a series of F-tests on lagged values of X (and with lagged values of Y also known), that those Y values provide statistically significant information on future values of X.
The test was unable to clearly determine that connectivity granger-causes productivity growth, nor that productivity granger-causes connectivity. In other words, no causality was detected in either direction between these two variables. While inconclusive, the results are interesting in that this test does not indicate that productivity growth (economic growth) causes connectivity growth, a finding that would put into doubt the findings from the previous regression analysis. Indeed, the test’s findings are consistent with the view that there is a synergistic relationship between a nation’s air transport and its economy. Increases in connectivity can boost economic growth. However, as an economy grows, it supports a larger air transport sector, which in turn leads to a need for further improvements in connectivity. Increases in connectivity can initiate improvements in economic growth, while also increasing as a result of that economic growth.
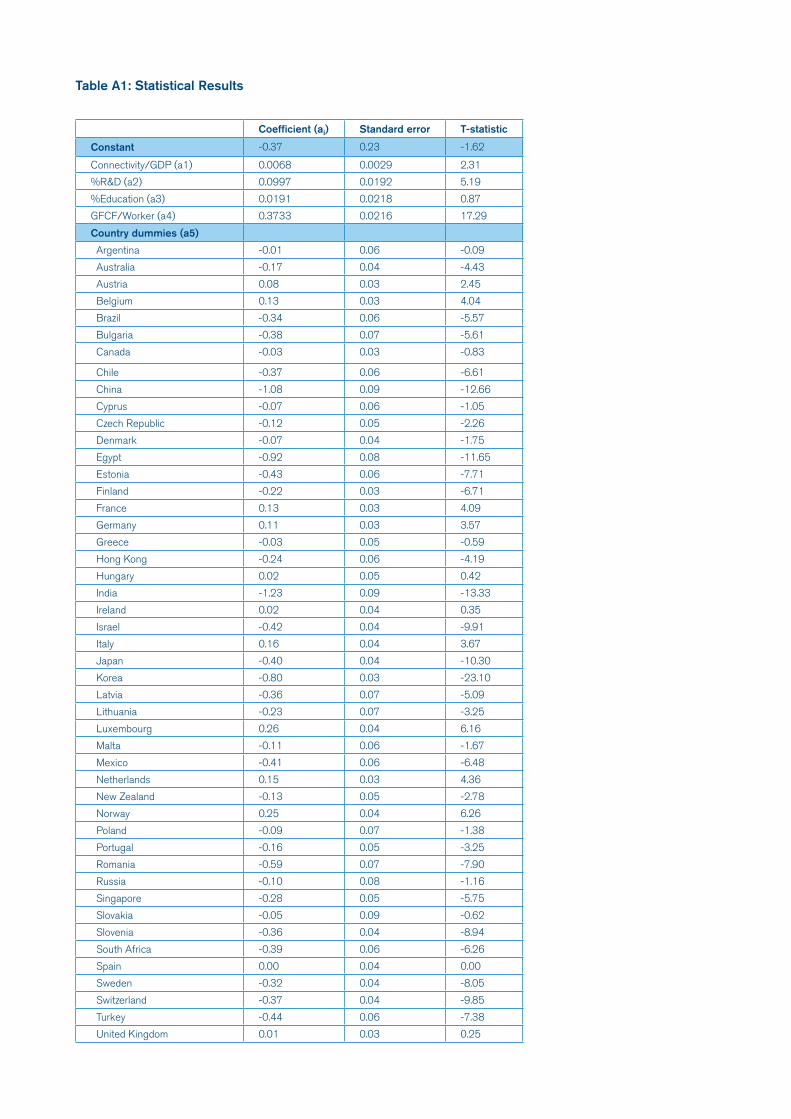
Table A1: Statistical Results
Coefficient (ai) Standard error T-statistic
Constant -0.37 0.23 -1.62
Connectivity/GDP (a1) 0.0068 0.0029 2.31
%R&D (a2) 0.0997 0.0192 5.19
%Education (a3) 0.0191 0.0218 0.87
GFCF/Worker (a4) 0.3733 0.0216 17.29
Country dummies (a5)
Argentina -0.01 0.06 -0.09
Australia -0.17 0.04 -4.43
Austria 0.08 0.03 2.45
Belgium 0.13 0.03 4.04
Brazil -0.34 0.06 -5.57
Bulgaria -0.38 0.07 -5.61
Canada -0.03 0.03 -0.83
Chile -0.37 0.06 -6.61
China -1.08 0.09 -12.66
Cyprus -0.07 0.06 -1.05
Czech Republic -0.12 0.05 -2.26
Denmark -0.07 0.04 -1.75
Egypt -0.92 0.08 -11.65
Estonia -0.43 0.06 -7.71
Finland -0.22 0.03 -6.71
France 0.13 0.03 4.09
Germany 0.11 0.03 3.57
Greece -0.03 0.05 -0.59
Hong Kong -0.24 0.06 -4.19
Hungary 0.02 0.05 0.42
India -1.23 0.09 -13.33
Ireland 0.02 0.04 0.35
Israel -0.42 0.04 -9.91
Italy 0.16 0.04 3.67
Japan -0.40 0.04 -10.30
Korea -0.80 0.03 -23.10
Latvia -0.36 0.07 -5.09
Lithuania -0.23 0.07 -3.25
Luxembourg 0.26 0.04 6.16
Malta -0.11 0.06 -1.67
Mexico -0.41 0.06 -6.48
Netherlands 0.15 0.03 4.36
New Zealand -0.13 0.05 -2.78
Norway 0.25 0.04 6.26
Poland -0.09 0.07 -1.38
Portugal -0.16 0.05 -3.25
Romania -0.59 0.07 -7.90
Russia -0.10 0.08 -1.16
Singapore -0.28 0.05 -5.75
Slovakia -0.05 0.09 -0.62
Slovenia -0.36 0.04 -8.94
South Africa -0.39 0.06 -6.26
Spain 0.00 0.04 0.00
Sweden -0.32 0.04 -8.05
Switzerland -0.37 0.04 -9.85
Turkey -0.44 0.06 -7.38
United Kingdom 0.01 0.03 0.25
Air Transport can play a key role in economic development and in enhancing long-term economic growth


www.iata.org PR
INTE
D I
N S
WIT
ZE
RLA
ND